wheelbase filtering and automobile suspension tuning for ... · wheelbase filtering and automobile...
TRANSCRIPT
Wheelbase filtering and automobile suspension tuning for minimising
motions in pitch
R. S. Sharp, Department of Electrical and Electronic Engineering, Imperial College of
Science, Technology and Medicine, Exhibition Road, London SW7 2BT
Abstract: The rear to front stiffness tuning of the suspension system of a car is discussed,
through reference to a half-car pitch plane mathematical model. New results relating to the
frequency responses of the bouncing (heaving) and pitching motions of the car body in
following sinusoidal terrain are used to show more clearly than before that the pitch
minimisation mechanism, known since Olley’s observations in the early 1930’s, involves
interference between the responses to the front and rear axle inputs. It is shown that
interference with respect to the rotational motion implies reinforcement with respect to the
translational motion and conversely. Phasor diagrams are constructed for particular cases to
illustrate the mechanics. At higher vehicle speeds, Olley-tuning is shown to bring marked
advantage in pitch suppression with very little disadvantage in terms of body accelerations.
At lower speeds, not only does the pitch tuning bring with it large vertical acceleration
penalties but also, the suspension stiffnesses implied are impractical from an attitude control
standpoint. The results shown can be employed to guide new suspension designs.
Alternatively, corresponding computations can be done for new cases of interest, since they
are easy to do and rapid.
Keywords: automobile, suspension, wheelbase filter, Olley, tuning, pitch, frequency
response, interference
NOTATION
a, b; longitudinal distance from body mass centre to front and rear axle respectively
Cf, Cr; suspension damper coefficients
kf, kr; suspension spring stiffnesses
ktf, ktr; tyre spring stiffnesses
L; wheelbase, (a+b)
Mb, Mwf, Mwr; masses of body and wheels respectively
s; multiplier used in parameter variations
u; vehicle speed
zbf, zbr, zwf, zwr, zif, zir; vertical displacements, Fig. 1
ω; circular frequency
1 INTRODUCTION
In the early 1930’s, conventional wisdom in car suspension design involved having a
relatively stiff front system with a comparatively flexible rear. It was something of a
revolution when Olley, through laboratory rig testing, discovered the potential of making the
rear suspension somewhat stiffer than the front, for the suppression of pitching vibrations [1].
Olley subsequently advocated this design practice vigorously [2, 3] and it became a rule of
practice, with a clear basis in experimentation but little basis in fundamental mechanics.
Confirmation of the effectiveness in pitch reduction of the “Olley” design was given
by Best over a limited range of circumstances [4]. Random road excitation was applied to a
half car computer model, with identical front and rear excitations but with the important time
delay between the two excitations included in the calculations. Pitch suppression was clearly
associated with the wheelbase filtering effect. Pitch suppression appeared to be necessarily
associated with increases in bounce responses, leaving it unclear whether or not it is a
worthwhile goal.
Sharp and Pilbeam attempted a more fundamental understanding of the phenomenon
[5] primarily by calculating frequency responses for the half car over a wide range of speed
and design conditions. At higher speeds, marked reductions in pitch response with only small
costs in terms of the bounce response were shown to result from Olley-tuning. At low
speeds, the situation is reversed. These behavioural features were shown to be generic
insofar as variations in mass centre location, pitch inertia and damping level were concerned
and the implications from the frequency responses were confirmed by simulations with non-
linear asymmetric suspension damping.
The problem was re-visited by Crolla and King [6]. They generated vehicle vibration
response spectra, under random road excitation, as Best had done previously. Some results
included the wheelbase filter effect, while others did not, also following Best [4]. Olley and
reverse Olley designs were simulated at speeds of 10, 20, 30 and 40 m/s, with the result that
the Olley design was good in pitch and bad in bounce in all cases. Rear to front suspension
stiffness ratio was found to have very little effect on pitch acceleration but to have an
influence on pitch displacement, which is strange, since they should be simply related to each
other and it was “confidently concluded that the rear / front stiffness ratio has virtually no
effect on overall levels of ride comfort”.
It is evident that a further study of this tuning problem is necessary, to accurately
describe the behaviour and to shed further light on the mechanics involved. The paper
constitutes such a study. The modelling is described in the next section. Some new results
are then shown and discussed. Conclusions are drawn, in the hope that the evidence will be
sufficient for a concensus to be formed on how the front / rear suspension tuning affects the
behaviour, as speed and vehicle design are varied.
2 MODELLING
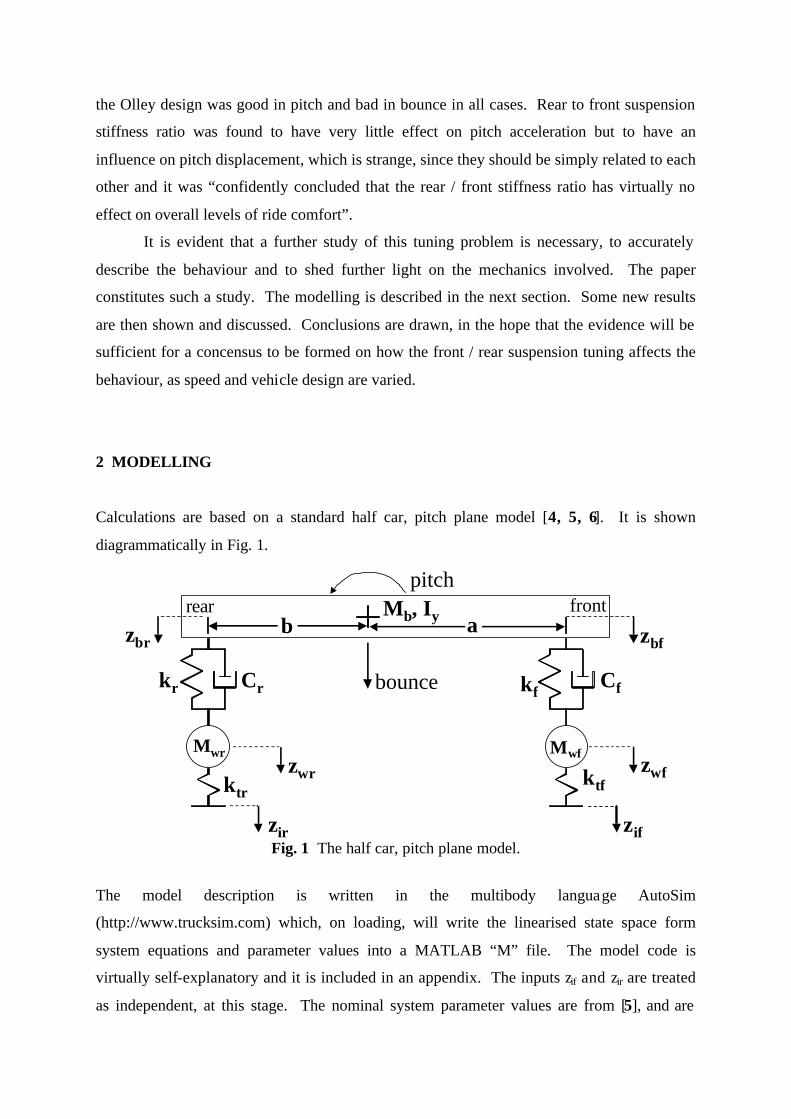
Calculations are based on a standard half car, pitch plane model [4, 5, 6]. It is shown
diagrammatically in Fig. 1.
kfkr Cr Cf
ktfktr
Mb, Iy ab
Mwr Mwfzwr zwf
zbfzbr
zir zif
frontrearpitch
bounce
Fig. 1 The half car, pitch plane model.
The model description is written in the multibody language AutoSim
(http://www.trucksim.com) which, on loading, will write the linearised state space form
system equations and parameter values into a MATLAB “M” file. The model code is
virtually self-explanatory and it is included in an appendix. The inputs zif and zir are treated
as independent, at this stage. The nominal system parameter values are from [5], and are
given in Table 1 below. They represent the symmetric case with baMI by ••= , which, as is
well known, decouples the front and rear systems [1, 4, 5, 8]; they each behave as the same
quarter car, due to the symmetry and the decoupling. Subsequently, parameter variations
make the system much more general.
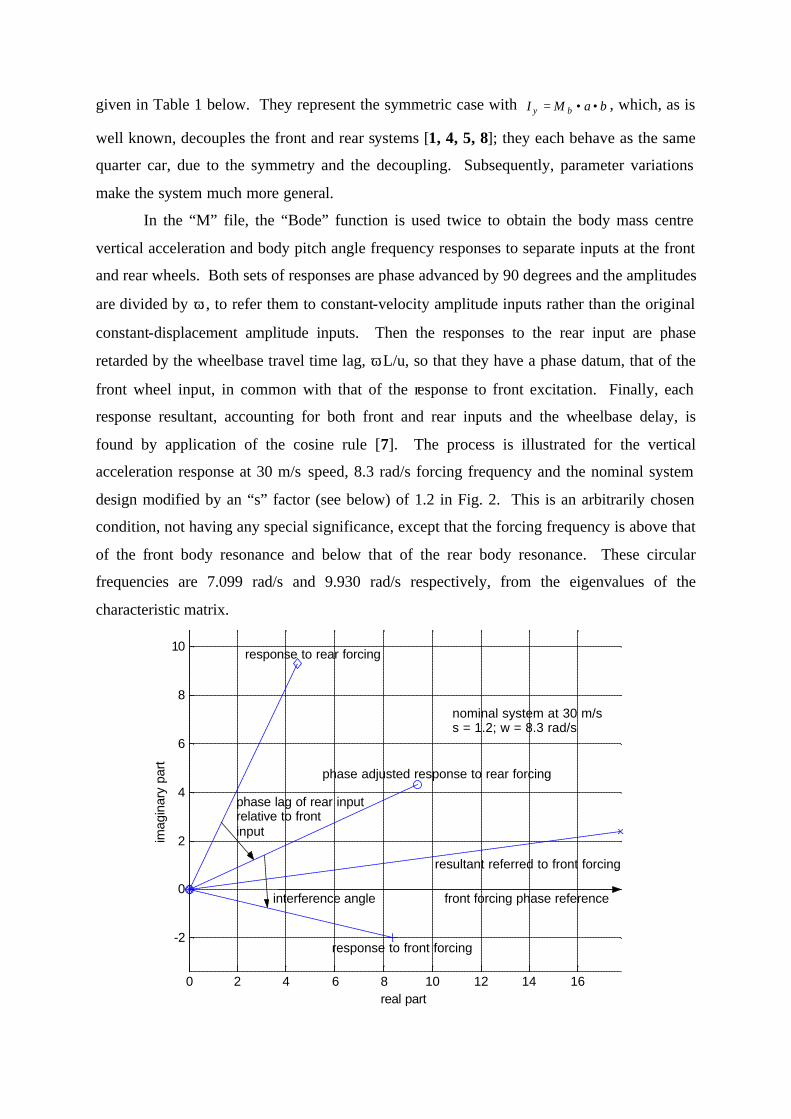
In the “M” file, the “Bode” function is used twice to obtain the body mass centre
vertical acceleration and body pitch angle frequency responses to separate inputs at the front
and rear wheels. Both sets of responses are phase advanced by 90 degrees and the amplitudes
are divided by ω, to refer them to constant-velocity amplitude inputs rather than the original
constant-displacement amplitude inputs. Then the responses to the rear input are phase
retarded by the wheelbase travel time lag, ωL/u, so that they have a phase datum, that of the
front wheel input, in common with that of the response to front excitation. Finally, each
response resultant, accounting for both front and rear inputs and the wheelbase delay, is
found by application of the cosine rule [7]. The process is illustrated for the vertical
acceleration response at 30 m/s speed, 8.3 rad/s forcing frequency and the nominal system
design modified by an “s” factor (see below) of 1.2 in Fig. 2. This is an arbitrarily chosen
condition, not having any special significance, except that the forcing frequency is above that
of the front body resonance and below that of the rear body resonance. These circular
frequencies are 7.099 rad/s and 9.930 rad/s respectively, from the eigenvalues of the
characteristic matrix.
0 2 4 6 8 10 12 14 16
-2
0
2
4
6
8
10
real part
imag
inar
y pa
rt
response to front forcing
response to rear forcing
phase adjusted response to rear forcing
resultant referred to front forcing
nominal system at 30 m/ss = 1.2; w = 8.3 rad/s
front forcing phase reference interference angle
phase lag of rear inputrelative to frontinput
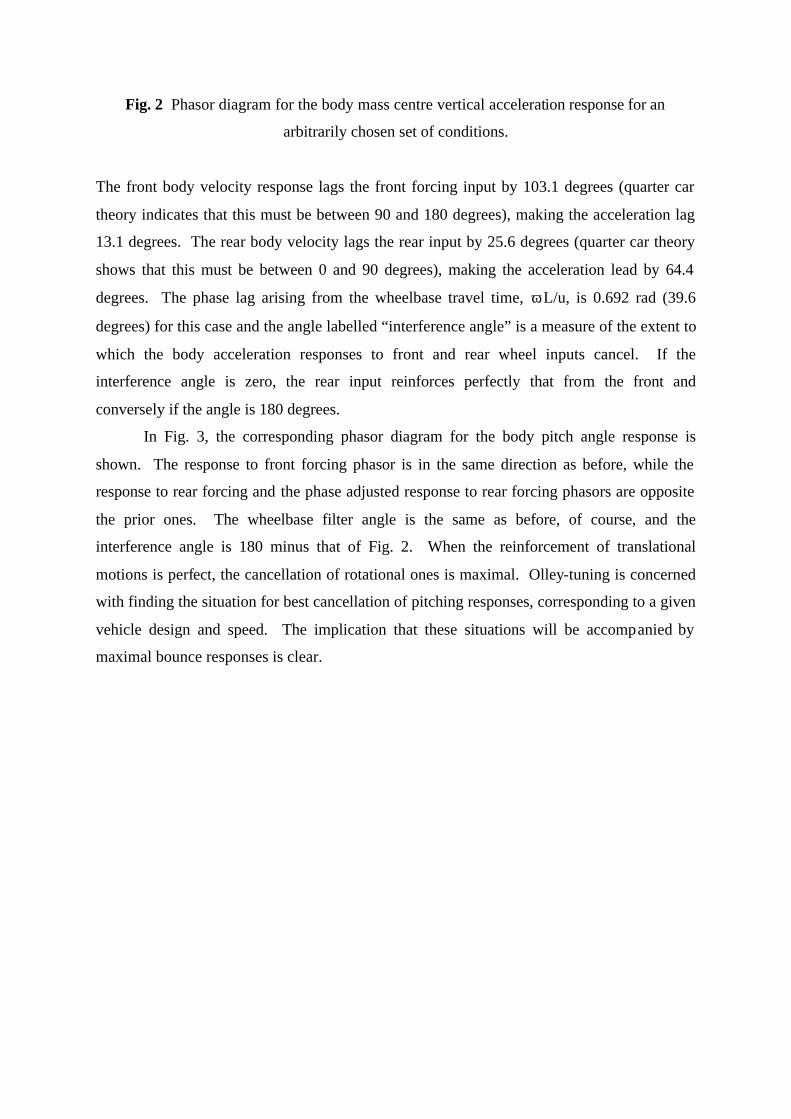
Fig. 2 Phasor diagram for the body mass centre vertical acceleration response for an
arbitrarily chosen set of conditions.
The front body velocity response lags the front forcing input by 103.1 degrees (quarter car
theory indicates that this must be between 90 and 180 degrees), making the acceleration lag
13.1 degrees. The rear body velocity lags the rear input by 25.6 degrees (quarter car theory
shows that this must be between 0 and 90 degrees), making the acceleration lead by 64.4
degrees. The phase lag arising from the wheelbase travel time, ωL/u, is 0.692 rad (39.6
degrees) for this case and the angle labelled “interference angle” is a measure of the extent to
which the body acceleration responses to front and rear wheel inputs cancel. If the
interference angle is zero, the rear input reinforces perfectly that from the front and
conversely if the angle is 180 degrees.
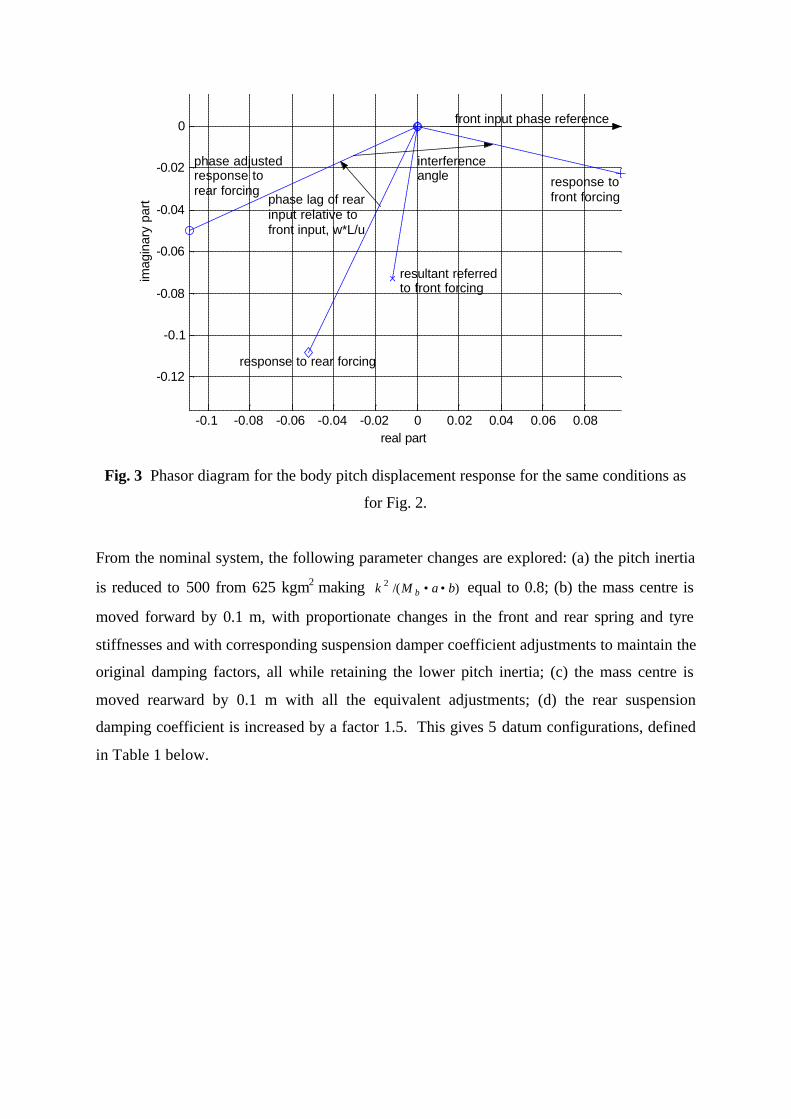
In Fig. 3, the corresponding phasor diagram for the body pitch angle response is
shown. The response to front forcing phasor is in the same direction as before, while the
response to rear forcing and the phase adjusted response to rear forcing phasors are opposite
the prior ones. The wheelbase filter angle is the same as before, of course, and the
interference angle is 180 minus that of Fig. 2. When the reinforcement of translational
motions is perfect, the cancellation of rotational ones is maximal. Olley-tuning is concerned
with finding the situation for best cancellation of pitching responses, corresponding to a given
vehicle design and speed. The implication that these situations will be accompanied by
maximal bounce responses is clear.
-0.1 -0.08 -0.06 -0.04 -0.02 0 0.02 0.04 0.06 0.08
-0.12
-0.1
-0.08
-0.06
-0.04
-0.02
0
real part
imag
inar
y pa
rt
response tofront forcing
response to rear forcing
phase adjustedresponse torear forcing
resultant referredto front forcing
interferenceangle
phase lag of rearinput relative tofront input, w*L/u
front input phase reference
Fig. 3 Phasor diagram for the body pitch displacement response for the same conditions as
for Fig. 2.
From the nominal system, the following parameter changes are explored: (a) the pitch inertia
is reduced to 500 from 625 kgm2 making )/(2 baMk b •• equal to 0.8; (b) the mass centre is
moved forward by 0.1 m, with proportionate changes in the front and rear spring and tyre
stiffnesses and with corresponding suspension damper coefficient adjustments to maintain the
original damping factors, all while retaining the lower pitch inertia; (c) the mass centre is
moved rearward by 0.1 m with all the equivalent adjustments; (d) the rear suspension
damping coefficient is increased by a factor 1.5. This gives 5 datum configurations, defined
in Table 1 below.

Table 1 Parameter sets – fixed parameters; Mb = 400 kg, Mf = Mr = 25 kg
Parameter:
SI units
Nominal
system
Modified
system (a)
Modified
system (b)
Modified
system (c)
Modified
system (d)
a 1.25 1.25 1.15 1.35 1.25
b 1.25 1.25 1.35 1.15 1.25
Cf 750 750 779.4 719.4 750
Cr 750 750 719.4 779.4 1125
Iy 625 500 500 500 500
kf 16000 16000 17280 14720 16000
kr 16000 16000 14720 17280 16000
ktf 150000 150000 160667 139333 150000
ktr 150000 150000 139333 160667 150000
With each datum system in turn, an “s” ratio is set and a number of loops, in which the
frequency responses are computed over the range 0.5 to 5 Hz, is completed. These responses
are described above and illustrated in Fig. 2,. In the first loop, the datum system is treated,
while in subsequent loops, the “s” value is used as a multiplier for the rear suspension damper
coefficient, s2 is the multiplier for the rear suspension spring stiffness and the corresponding
front coefficients are divided by the s and s2 factors, rather than being multiplied by them. s
factors greater than 1 move the datum systems towards an “Olley” design and conversely.
3 RESULTS AND THEIR INTERPRETATION
Consider the nominal system design travelling at 40 m/s with the goal of determining the “s”
value that gives a minimum pitch response for this condition. For 4 loops with s = 1.02, the
results of Fig. 4 are obtained. In the figure, the mass centre vertical acceleration, the pitch
angle and the pitch interference angle, in the sense of Fig. 3, are given. The chosen line-type
order is full, dotted, dash-dot, dashed. The “full” curve corresponds to the datum system in
each case. For the “dotted” curve, the “s” multiplier is 1.02, for the “dash-dot”, it is 1.022,
while for the “dashed”, it is 1.023. The acceleration interference angle is the reverse of the
pitch interference angle as discussed above, so it is not necessary to plot it. The numbers
have been chosen to make the fourth loop give the desired result, involving a near zero pitch
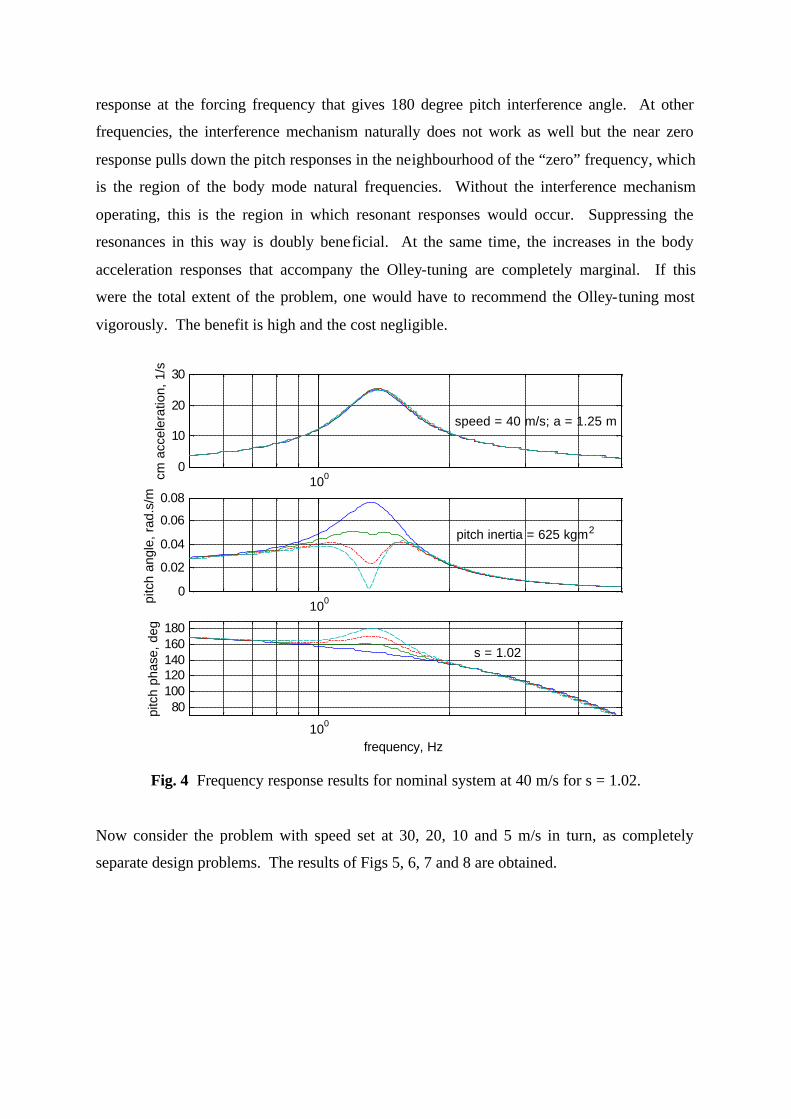
response at the forcing frequency that gives 180 degree pitch interference angle. At other
frequencies, the interference mechanism naturally does not work as well but the near zero
response pulls down the pitch responses in the neighbourhood of the “zero” frequency, which
is the region of the body mode natural frequencies. Without the interference mechanism
operating, this is the region in which resonant responses would occur. Suppressing the
resonances in this way is doubly beneficial. At the same time, the increases in the body
acceleration responses that accompany the Olley-tuning are completely marginal. If this
were the total extent of the problem, one would have to recommend the Olley-tuning most
vigorously. The benefit is high and the cost negligible.
1000
10
20
30
cm a
ccel
erat
ion,
1/s
speed = 40 m/s; a = 1.25 m
1000
0.02
0.04
0.06
0.08
pitc
h an
gle,
rad
.s/m
pitch inertia = 625 kgm2
100
80100120140160180
frequency, Hz
pitc
h ph
ase,
deg
s = 1.02
Fig. 4 Frequency response results for nominal system at 40 m/s for s = 1.02.
Now consider the problem with speed set at 30, 20, 10 and 5 m/s in turn, as completely
separate design problems. The results of Figs 5, 6, 7 and 8 are obtained.
1000
10
20
30
cm a
ccel
erat
ion,
1/s
speed = 30 m/s; a = 1.25 m
1000
0.05
0.1
pitc
h an
gle,
rad
.s/m
pitch inertia = 625 kgm2
100
50
100
150
frequency, Hz
pitc
h ph
ase,
deg
s = 1.027
Fig. 5 Frequency response results for nominal system at 30 m/s for s = 1.027.
1000
10
20
30
cm a
ccel
erat
ion,
1/s
speed = 20 m/s; a = 1.25 m
1000
0.05
0.1
0.15
pitc
h an
gle,
rad
.s/m
pitch inertia = 625 kgm2
100-50
0
50100
150
frequency, Hz
pitc
h ph
ase,
deg
s = 1.046
Fig. 6 Frequency response results for nominal system at 20 m/s for s = 1.046.
1000
10
20cm
acc
eler
atio
n, 1
/s
speed = 10 m/s; a = 1.25 m
1000
0.1
0.2
pitc
h an
gle,
rad
.s/m
pitch inertia = 625 kgm2
100
-200
0
200
frequency, Hz
pitc
h ph
ase,
deg
s = 1.14
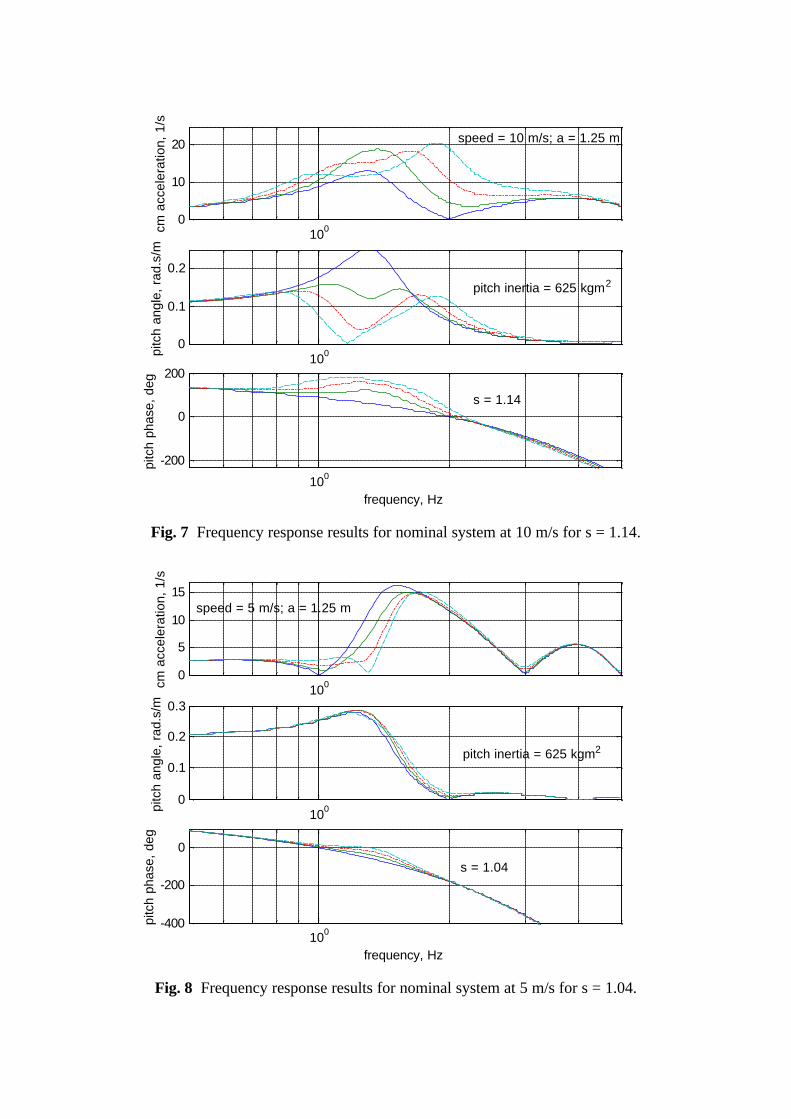
Fig. 7 Frequency response results for nominal system at 10 m/s for s = 1.14.
1000
5
10
15
cm a
ccel
erat
ion,
1/s
speed = 5 m/s; a = 1.25 m
1000
0.1
0.2
0.3
pitc
h an
gle,
rad
.s/m
pitch inertia = 625 kgm2
100-400
-200
0
frequency, Hz
pitc
h ph
ase,
deg
s = 1.04
Fig. 8 Frequency response results for nominal system at 5 m/s for s = 1.04.
For speeds of 10 m/s and above, there is, in each case, a design giving 180 degrees pitch
interference angle and near zero pitch response at a frequency near to the body resonant
frequencies. This always has a strong influence to suppress the pitch response, where,
without interference, resonances would be excited. For 30 and 20 m/s speed, the
deterioration in the bounce response due to the Olley-tuning is small, although clearly larger
at 20 m/s than at 30 m/s. However, at 10 m/s, the body mass centre acceleration response is
prejudiced a great deal by the Olley-tuning. It is entirely possible that the pitch improvement
of the Olley-tuned condition is not worth the cost in terms of the bounce response. Not only
is there a large price to pay for Olley-tuning at the low speed but also the rear suspension
implied is much too stiff for reasonable ride comfort, presuming that the front suspension is
stiff enough for proper attitude control. For a speed of 5 m/s, stiffening the rear springs and
softening the front ones has the opposite effect, improving the bounce response and slightly
worsening the pitching, with an overall improvement but not in pitching.
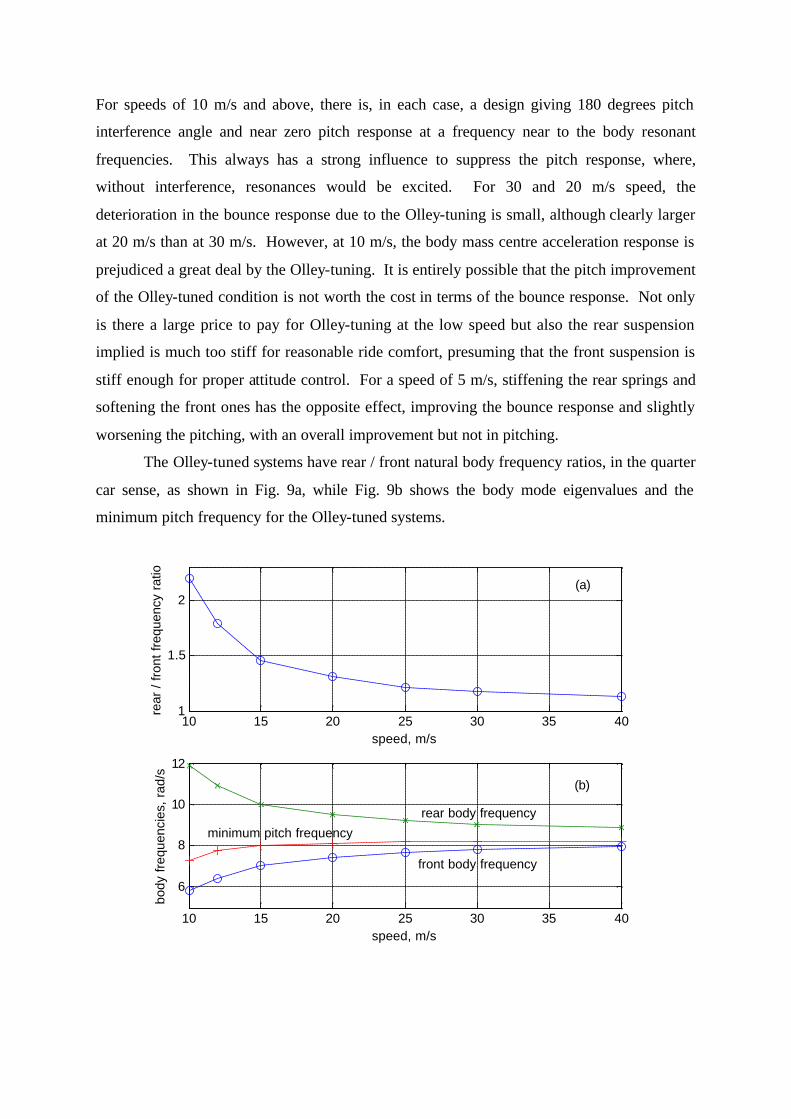
The Olley-tuned systems have rear / front natural body frequency ratios, in the quarter
car sense, as shown in Fig. 9a, while Fig. 9b shows the body mode eigenvalues and the
minimum pitch frequency for the Olley-tuned systems.
10 15 20 25 30 35 401
1.5
2
speed, m/s
rear
/ fr
ont f
requ
ency
rat
io
10 15 20 25 30 35 40
6
8
10
12
speed, m/s
body
freq
uenc
ies,
rad
/s
front body frequency
rear body frequency
minimum pitch frequency
(a)
(b)
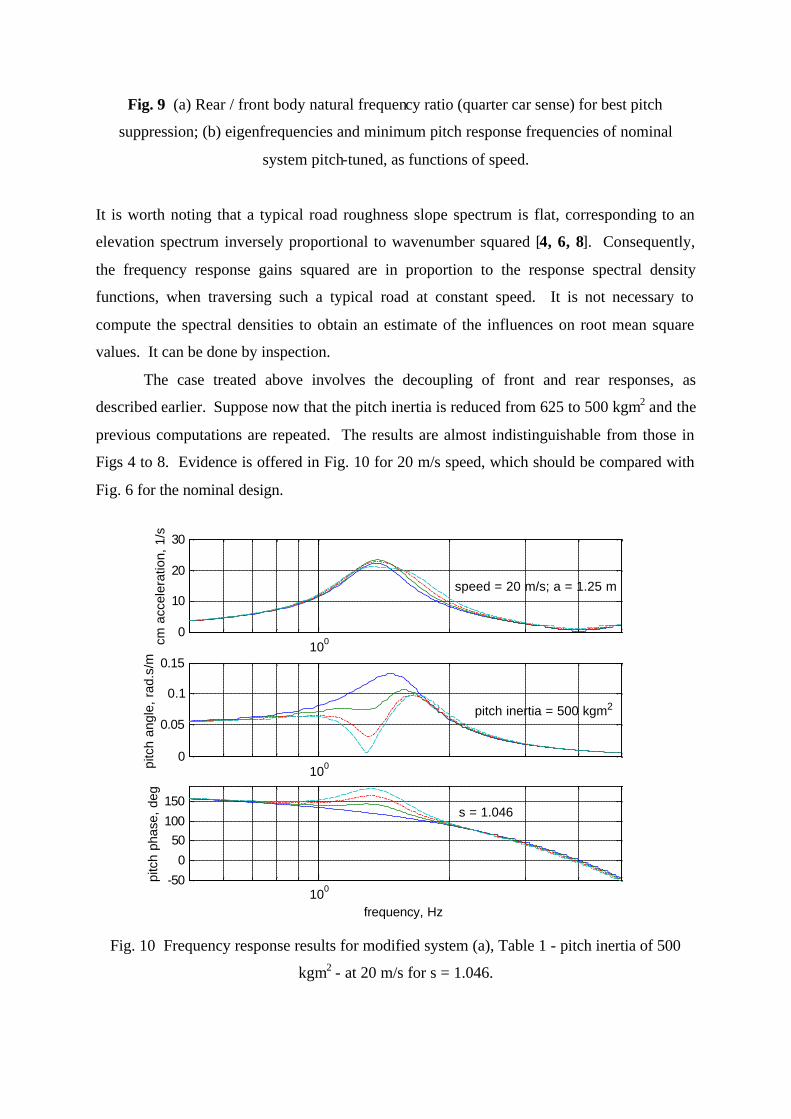
Fig. 9 (a) Rear / front body natural frequency ratio (quarter car sense) for best pitch
suppression; (b) eigenfrequencies and minimum pitch response frequencies of nominal
system pitch-tuned, as functions of speed.
It is worth noting that a typical road roughness slope spectrum is flat, corresponding to an
elevation spectrum inversely proportional to wavenumber squared [4, 6, 8]. Consequently,
the frequency response gains squared are in proportion to the response spectral density
functions, when traversing such a typical road at constant speed. It is not necessary to
compute the spectral densities to obtain an estimate of the influences on root mean square
values. It can be done by inspection.
The case treated above involves the decoupling of front and rear responses, as
described earlier. Suppose now that the pitch inertia is reduced from 625 to 500 kgm2 and the
previous computations are repeated. The results are almost indistinguishable from those in
Figs 4 to 8. Evidence is offered in Fig. 10 for 20 m/s speed, which should be compared with
Fig. 6 for the nominal design.
1000
10
20
30
cm a
ccel
erat
ion,
1/s
speed = 20 m/s; a = 1.25 m
1000
0.05
0.1
0.15
pitc
h an
gle,
rad
.s/m
pitch inertia = 500 kgm2
100-50
0
50100
150
frequency, Hz
pitc
h ph
ase,
deg
s = 1.046
Fig. 10 Frequency response results for modified system (a), Table 1 - pitch inertia of 500
kgm2 - at 20 m/s for s = 1.046.
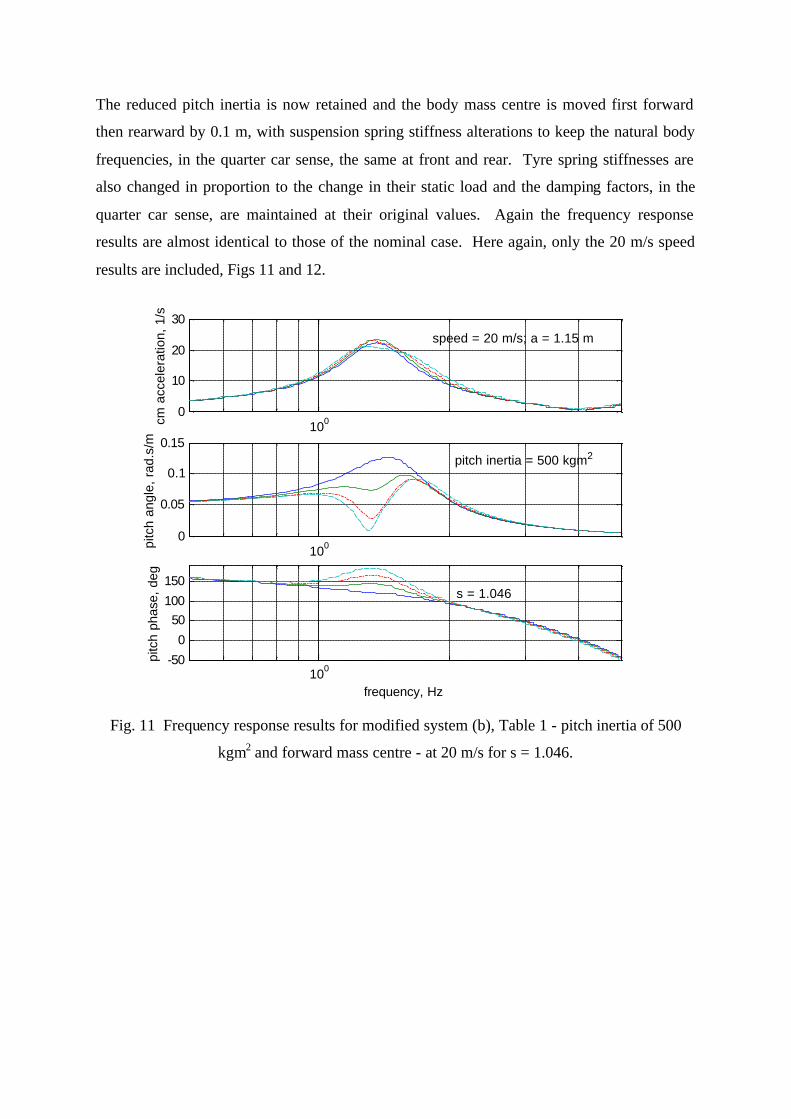
The reduced pitch inertia is now retained and the body mass centre is moved first forward
then rearward by 0.1 m, with suspension spring stiffness alterations to keep the natural body
frequencies, in the quarter car sense, the same at front and rear. Tyre spring stiffnesses are
also changed in proportion to the change in their static load and the damping factors, in the
quarter car sense, are maintained at their original values. Again the frequency response
results are almost identical to those of the nominal case. Here again, only the 20 m/s speed
results are included, Figs 11 and 12.
1000
10
20
30
cm a
ccel
erat
ion,
1/s
speed = 20 m/s; a = 1.15 m
1000
0.05
0.1
0.15
pitc
h an
gle,
rad
.s/m
pitch inertia = 500 kgm2
100-50
0
50100
150
frequency, Hz
pitc
h ph
ase,
deg
s = 1.046
Fig. 11 Frequency response results for modified system (b), Table 1 - pitch inertia of 500
kgm2 and forward mass centre - at 20 m/s for s = 1.046.
1000
10
20
30
cm a
ccel
erat
ion,
1/s
speed = 20 m/s; a = 1.35 m
1000
0.05
0.1
0.15
pitc
h an
gle,
rad
.s/m
pitch inertia = 500 kgm2
100-50
0
50100
150
frequency, Hz
pitc
h ph
ase,
deg
s = 1.046
Fig. 12 Frequency response results for modified system (c), Table 1 - pitch inertia of 500
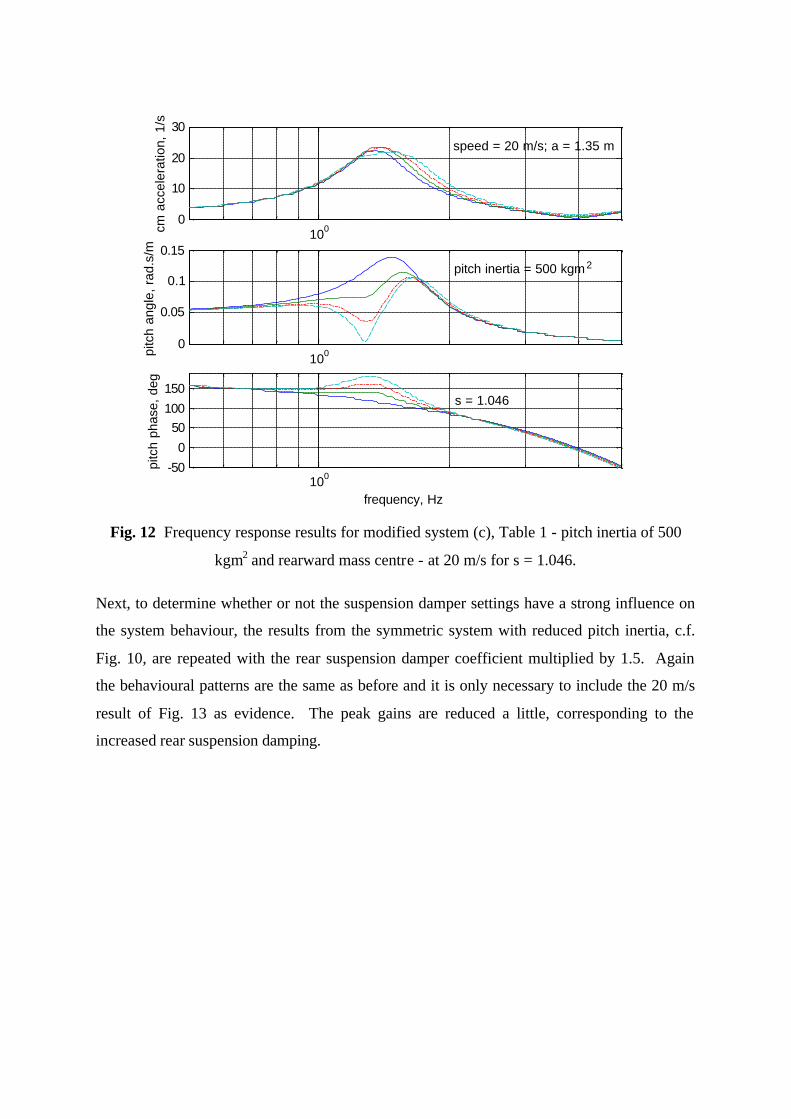
kgm2 and rearward mass centre - at 20 m/s for s = 1.046.
Next, to determine whether or not the suspension damper settings have a strong influence on
the system behaviour, the results from the symmetric system with reduced pitch inertia, c.f.
Fig. 10, are repeated with the rear suspension damper coefficient multiplied by 1.5. Again
the behavioural patterns are the same as before and it is only necessary to include the 20 m/s
result of Fig. 13 as evidence. The peak gains are reduced a little, corresponding to the
increased rear suspension damping.
1000
10
20
30
cm a
ccel
erat
ion,
1/s
speed = 20 m/s; a = 1.25 m
1000
0.05
0.1
0.15
pitc
h an
gle,
rad
.s/m
pitch inertia = 500 kgm2
100-50
0
50100
150
frequency, Hz
pitc
h ph
ase,
deg
s = 1.046
Fig. 13 Frequency response results for modified system (d), Table 1 - pitch inertia of 500
kgm2 and Cr multiplied by 1.5 - at 20 m/s for s = 1.046.
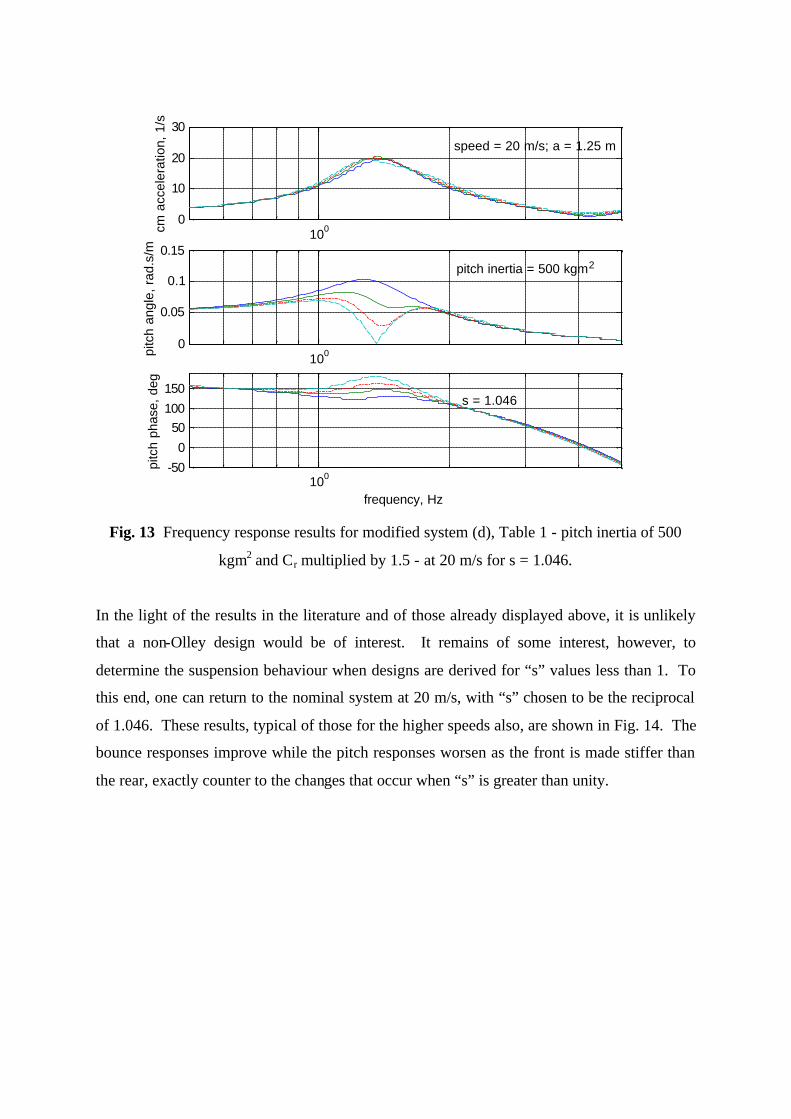
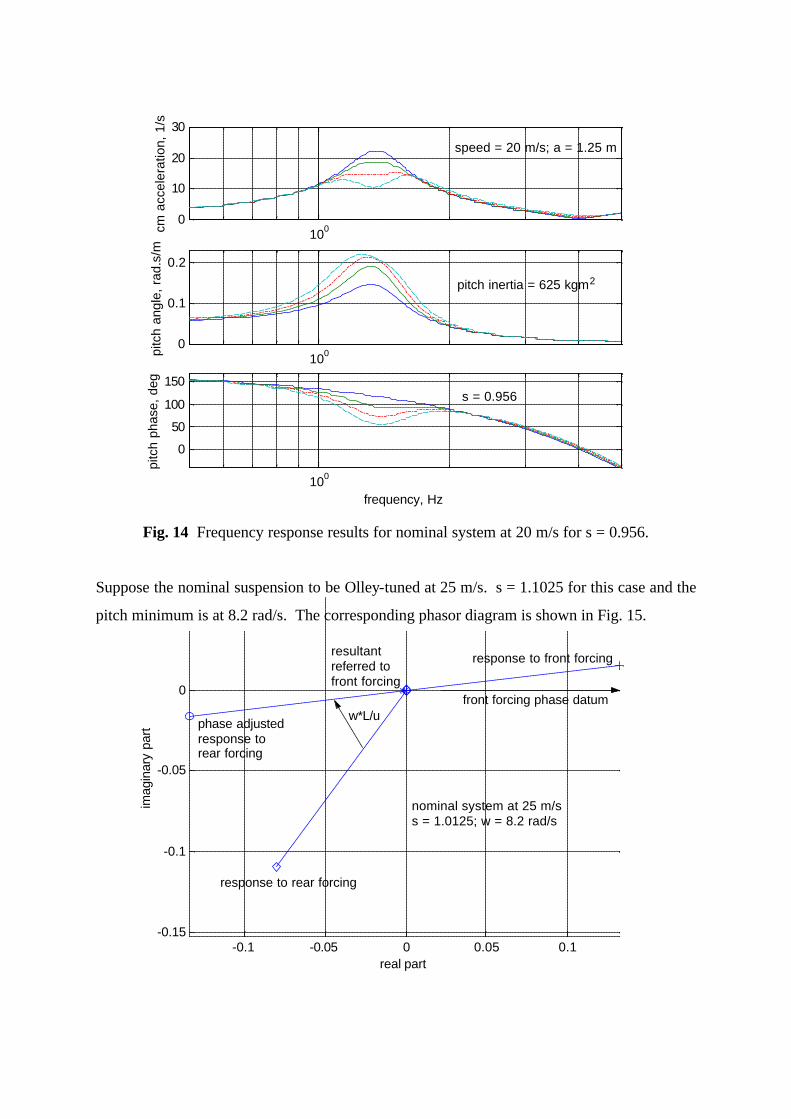
In the light of the results in the literature and of those already displayed above, it is unlikely
that a non-Olley design would be of interest. It remains of some interest, however, to
determine the suspension behaviour when designs are derived for “s” values less than 1. To
this end, one can return to the nominal system at 20 m/s, with “s” chosen to be the reciprocal
of 1.046. These results, typical of those for the higher speeds also, are shown in Fig. 14. The
bounce responses improve while the pitch responses worsen as the front is made stiffer than
the rear, exactly counter to the changes that occur when “s” is greater than unity.
1000
10
20
30
cm a
ccel
erat
ion,
1/s
speed = 20 m/s; a = 1.25 m
1000
0.1
0.2
pitc
h an
gle,
rad
.s/m
pitch inertia = 625 kgm2
100
0
50
100
150
frequency, Hz
pitc
h ph
ase,
deg
s = 0.956
Fig. 14 Frequency response results for nominal system at 20 m/s for s = 0.956.
Suppose the nominal suspension to be Olley-tuned at 25 m/s. s = 1.1025 for this case and the
pitch minimum is at 8.2 rad/s. The corresponding phasor diagram is shown in Fig. 15.
-0.1 -0.05 0 0.05 0.1-0.15
-0.1
-0.05
0
real part
imag
inar
y pa
rt
response to front forcing
response to rear forcing
phase adjustedresponse torear forcing
resultantreferred tofront forcing
nominal system at 25 m/ss = 1.0125; w = 8.2 rad/s
w*L/u front forcing phase datum
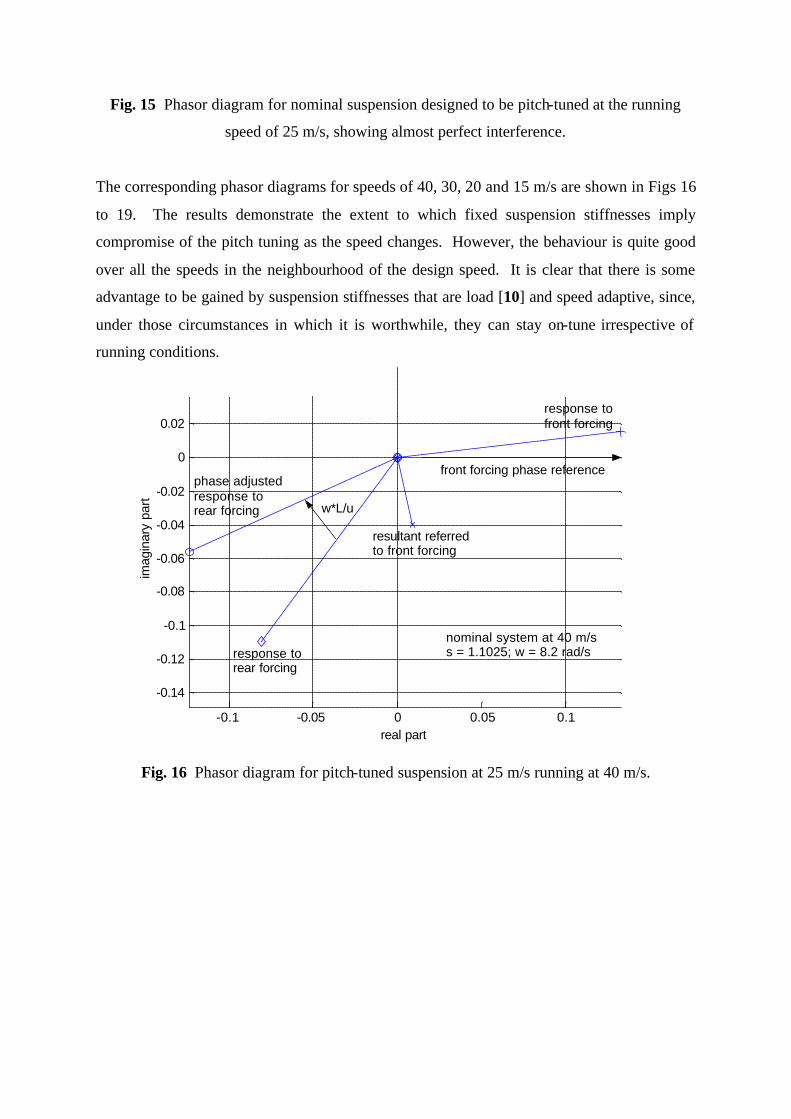
Fig. 15 Phasor diagram for nominal suspension designed to be pitch-tuned at the running
speed of 25 m/s, showing almost perfect interference.
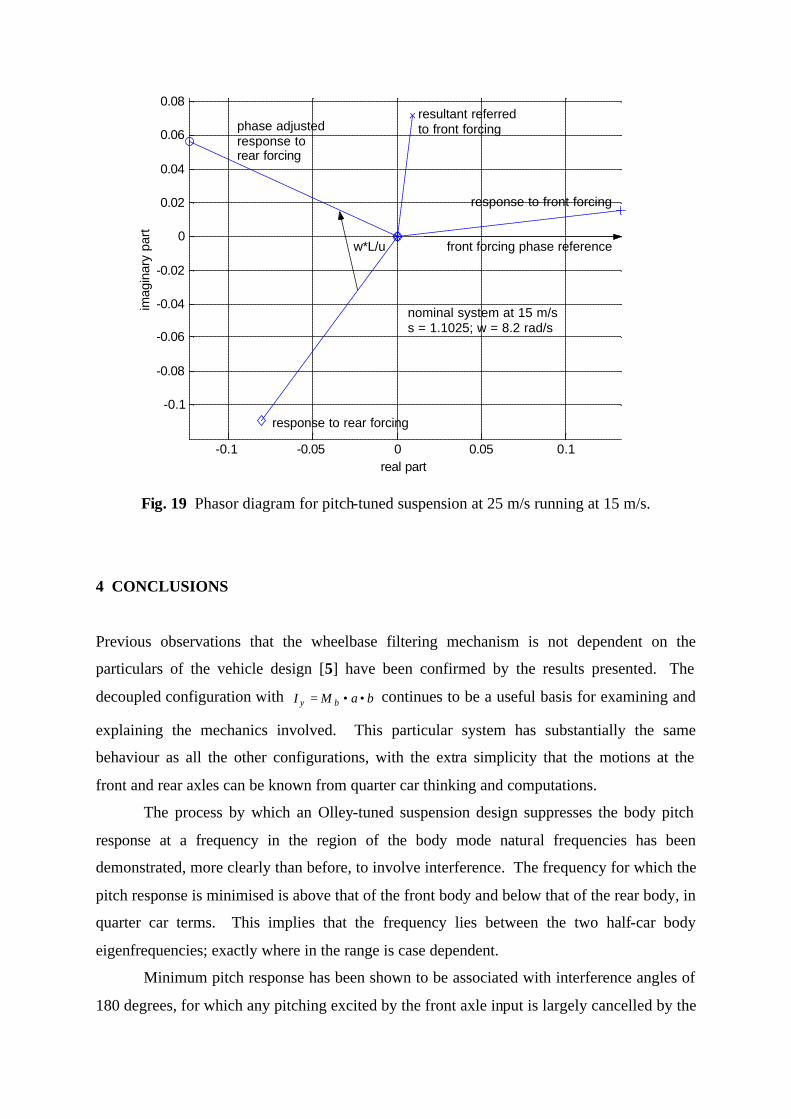
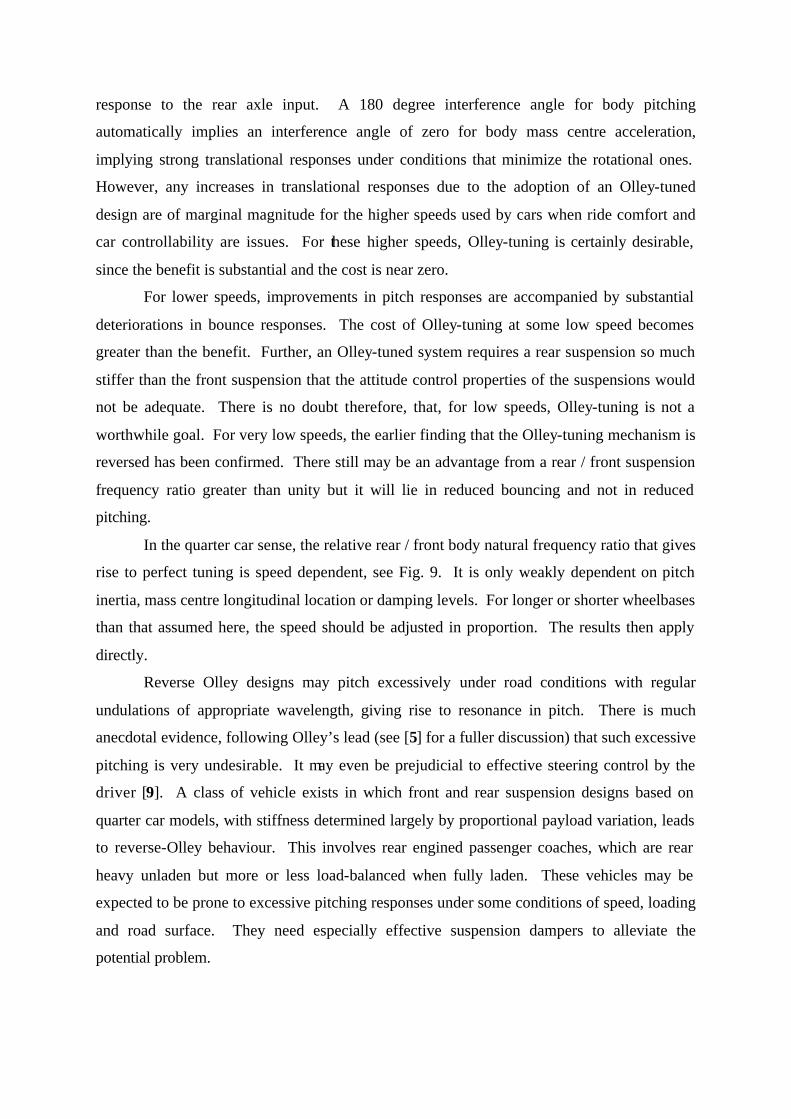
The corresponding phasor diagrams for speeds of 40, 30, 20 and 15 m/s are shown in Figs 16
to 19. The results demonstrate the extent to which fixed suspension stiffnesses imply
compromise of the pitch tuning as the speed changes. However, the behaviour is quite good
over all the speeds in the neighbourhood of the design speed. It is clear that there is some
advantage to be gained by suspension stiffnesses that are load [10] and speed adaptive, since,
under those circumstances in which it is worthwhile, they can stay on-tune irrespective of
running conditions.
-0.1 -0.05 0 0.05 0.1
-0.14
-0.12
-0.1
-0.08
-0.06
-0.04
-0.02
0
0.02
real part
imag
inar
y pa
rt
response tofront forcing
response torear forcing
phase adjustedresponse torear forcing
resultant referredto front forcing
front forcing phase reference
nominal system at 40 m/ss = 1.1025; w = 8.2 rad/s
w*L/u
Fig. 16 Phasor diagram for pitch-tuned suspension at 25 m/s running at 40 m/s.
-0.1 -0.05 0 0.05 0.1-0.15
-0.1
-0.05
0
real part
imag
inar
y pa
rt
response tofront forcing
response to rear forcing
phase adjustedresponse torear forcing
resultant referredto front forcing
w*L/u
front forcing phase reference
nominal system at 30 m/ss = 1.1025; w = 8.2 rad/s
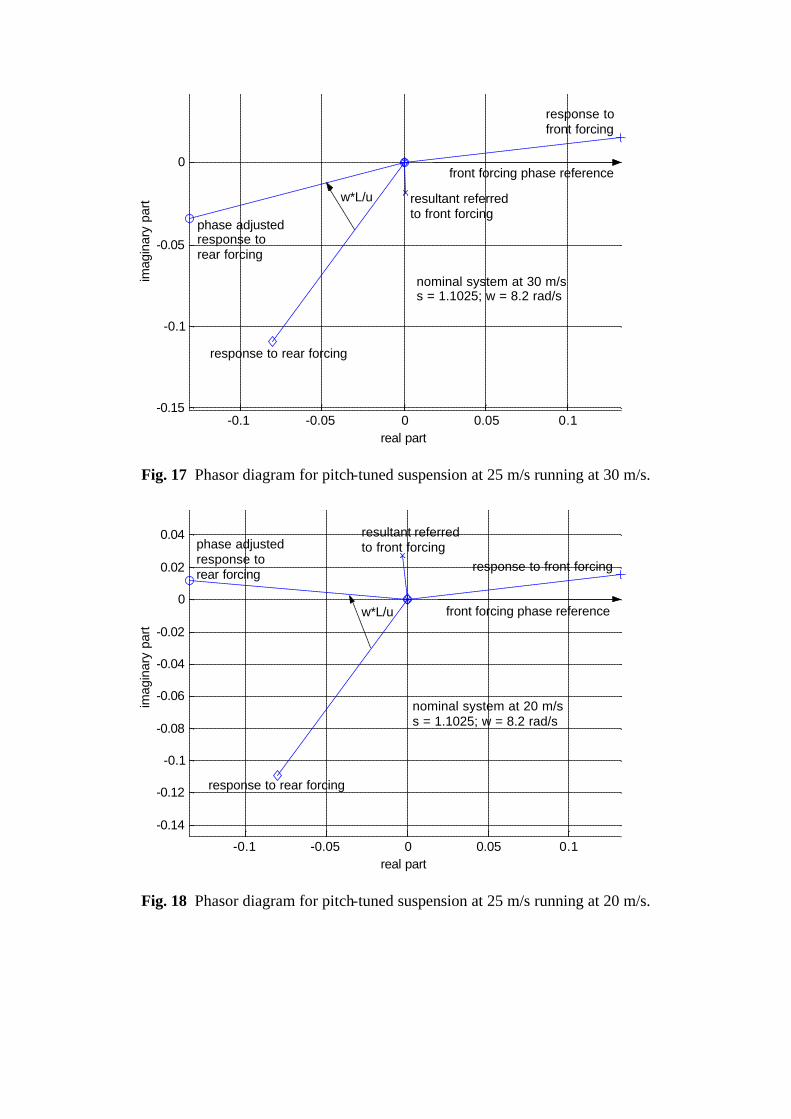
Fig. 17 Phasor diagram for pitch-tuned suspension at 25 m/s running at 30 m/s.
-0.1 -0.05 0 0.05 0.1
-0.14
-0.12
-0.1
-0.08
-0.06
-0.04
-0.02
0
0.02
0.04
real part
imag
inar
y pa
rt
response to front forcing
response to rear forcing
phase adjustedresponse torear forcing
resultant referredto front forcing
front forcing phase reference w*L/u
nominal system at 20 m/ss = 1.1025; w = 8.2 rad/s
Fig. 18 Phasor diagram for pitch-tuned suspension at 25 m/s running at 20 m/s.
-0.1 -0.05 0 0.05 0.1
-0.1
-0.08
-0.06
-0.04
-0.02
0
0.02
0.04
0.06
0.08
real part
imag
inar
y pa
rt
response to front forcing
response to rear forcing
phase adjustedresponse torear forcing
resultant referredto front forcing
front forcing phase reference w*L/u
nominal system at 15 m/ss = 1.1025; w = 8.2 rad/s
Fig. 19 Phasor diagram for pitch-tuned suspension at 25 m/s running at 15 m/s.
4 CONCLUSIONS
Previous observations that the wheelbase filtering mechanism is not dependent on the
particulars of the vehicle design [5] have been confirmed by the results presented. The
decoupled configuration with baMI by ••= continues to be a useful basis for examining and
explaining the mechanics involved. This particular system has substantially the same
behaviour as all the other configurations, with the extra simplicity that the motions at the
front and rear axles can be known from quarter car thinking and computations.
The process by which an Olley-tuned suspension design suppresses the body pitch
response at a frequency in the region of the body mode natural frequencies has been
demonstrated, more clearly than before, to involve interference. The frequency for which the
pitch response is minimised is above that of the front body and below that of the rear body, in
quarter car terms. This implies that the frequency lies between the two half-car body
eigenfrequencies; exactly where in the range is case dependent.
Minimum pitch response has been shown to be associated with interference angles of
180 degrees, for which any pitching excited by the front axle input is largely cancelled by the
response to the rear axle input. A 180 degree interference angle for body pitching
automatically implies an interference angle of zero for body mass centre acceleration,
implying strong translational responses under conditions that minimize the rotational ones.
However, any increases in translational responses due to the adoption of an Olley-tuned
design are of marginal magnitude for the higher speeds used by cars when ride comfort and
car controllability are issues. For these higher speeds, Olley-tuning is certainly desirable,
since the benefit is substantial and the cost is near zero.
For lower speeds, improvements in pitch responses are accompanied by substantial
deteriorations in bounce responses. The cost of Olley-tuning at some low speed becomes
greater than the benefit. Further, an Olley-tuned system requires a rear suspension so much
stiffer than the front suspension that the attitude control properties of the suspensions would
not be adequate. There is no doubt therefore, that, for low speeds, Olley-tuning is not a
worthwhile goal. For very low speeds, the earlier finding that the Olley-tuning mechanism is
reversed has been confirmed. There still may be an advantage from a rear / front suspension
frequency ratio greater than unity but it will lie in reduced bouncing and not in reduced
pitching.
In the quarter car sense, the relative rear / front body natural frequency ratio that gives
rise to perfect tuning is speed dependent, see Fig. 9. It is only weakly dependent on pitch
inertia, mass centre longitudinal location or damping levels. For longer or shorter wheelbases
than that assumed here, the speed should be adjusted in proportion. The results then apply
directly.
Reverse Olley designs may pitch excessively under road conditions with regular
undulations of appropriate wavelength, giving rise to resonance in pitch. There is much
anecdotal evidence, following Olley’s lead (see [5] for a fuller discussion) that such excessive
pitching is very undesirable. It may even be prejudicial to effective steering control by the
driver [9]. A class of vehicle exists in which front and rear suspension designs based on
quarter car models, with stiffness determined largely by proportional payload variation, leads
to reverse-Olley behaviour. This involves rear engined passenger coaches, which are rear
heavy unladen but more or less load-balanced when fully laden. These vehicles may be
expected to be prone to excessive pitching responses under some conditions of speed, loading
and road surface. They need especially effective suspension dampers to alleviate the
potential problem.
References
[1] Olley, M., Independent wheel suspension – its whys and wherefores, SAE Trans., 29,
1934, 73-81.
[2] Olley, M., National influences on American passenger car design, IAE Proceedings,
1937-38, XXXII, 509-541.
[3] Olley, M., Road manners of the modern car, IAE Proceedings, 1946-47, 41, 147-182.
[4] Best, A., Vehicle ride – stages in comprehension, Phys. Technol., 15, 1984, 205-210.
[5] Sharp, R. S. and Pilbeam, C., Achievability and value of passive suspension designs for
minimum pitch response, Vehicle Ride and Handling, I.Mech.E. Int. Conf. 1993-9, 243-259.
[6] Crolla, D. A. and King, R. P., Olley’s “Flat Ride” revisited, Vehicle System Dynamics
Supplement 33, 1999, 762-774.
[7] Bronshtein, I. N. and Semendyayev, K. A., A guide book to mathematics, Verlag Harri
Deutsch, Frankfurt, 1971.
[8] Sharp, R. S. and Crolla, D. A., Road vehicle suspension design - a review, Vehicle System
Dynamics, 16, No.3, 1987, 167-192.
[9] Best, A., Private communication, 1993.
[10] Harrison, A. W., A theoretical study of constant area gas springs in passenger car
suspensions, Road Vehicle Handling, I. Mech. E., CONFERENCE PUBLICATIONS 1983-5,
97-106.
Appendix – AutoSim model code ; Half car pitch plane model (reset) (setsym *multibody-system-name* "Flat ride problem") (si) (add-gravity :direction [nz]) (setsym l "a+b") ;VEHICLE MAIN BODY (add-body main :parent n :name "vehicle body" :mass Mb :inertia-matrix (0 Iy 0) :cm-coordinates (0 0 0) :translate z :body-rotation-axes y :parent-rotation-axis y :reference-axis z) (add-point mainpf :body main :coordinates (a 0 0)) (add-point mainpr :body main :coordinates (-b 0 0)) (add-body fwhl :parent n :name "front wheel" :mass mf :inertia-matrix 0 :joint-coordinates mainpf :translate z)
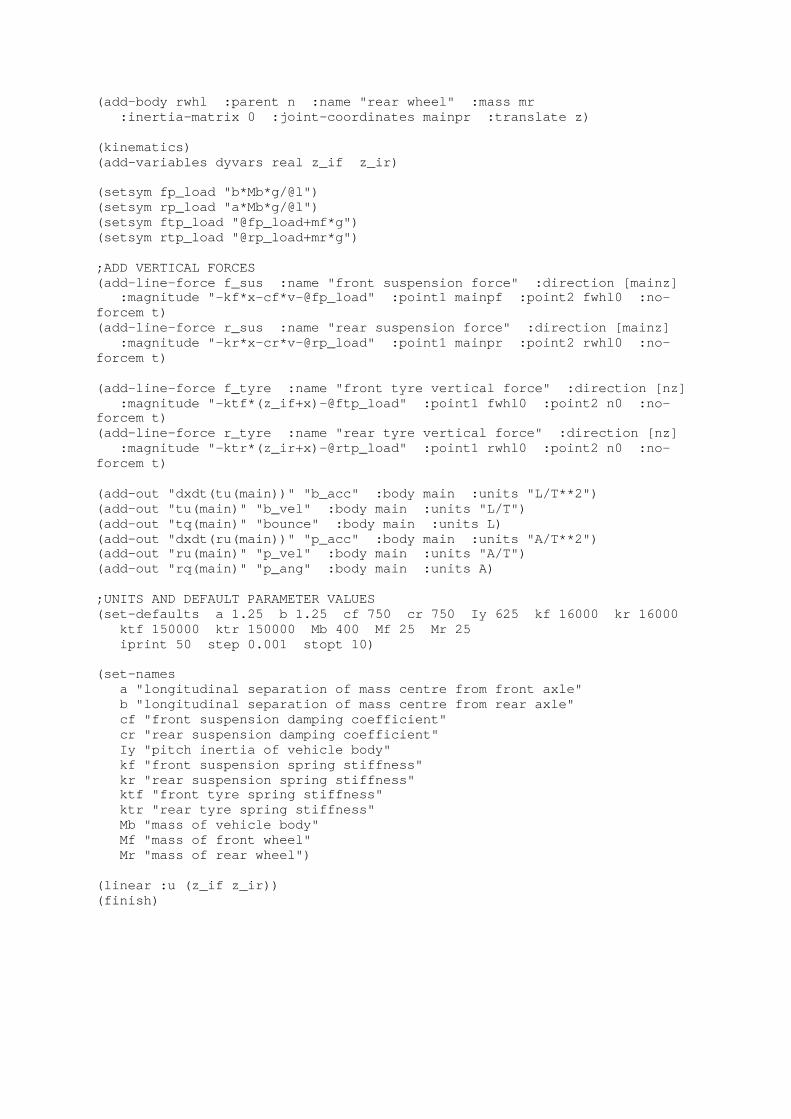
(add-body rwhl :parent n :name "rear wheel" :mass mr :inertia-matrix 0 :joint-coordinates mainpr :translate z) (kinematics) (add-variables dyvars real z_if z_ir) (setsym fp_load "b*Mb*g/@l") (setsym rp_load "a*Mb*g/@l") (setsym ftp_load "@fp_load+mf*g") (setsym rtp_load "@rp_load+mr*g") ;ADD VERTICAL FORCES (add-line-force f_sus :name "front suspension force" :direction [mainz] :magnitude "-kf*x-cf*v-@fp_load" :point1 mainpf :point2 fwhl0 :no-forcem t) (add-line-force r_sus :name "rear suspension force" :direction [mainz] :magnitude "-kr*x-cr*v-@rp_load" :point1 mainpr :point2 rwhl0 :no-forcem t) (add-line-force f_tyre :name "front tyre vertical force" :direction [nz] :magnitude "-ktf*(z_if+x)-@ftp_load" :point1 fwhl0 :point2 n0 :no-forcem t) (add-line-force r_tyre :name "rear tyre vertical force" :direction [nz] :magnitude "-ktr*(z_ir+x)-@rtp_load" :point1 rwhl0 :point2 n0 :no-forcem t) (add-out "dxdt(tu(main))" "b_acc" :body main :units "L/T**2") (add-out "tu(main)" "b_vel" :body main :units "L/T") (add-out "tq(main)" "bounce" :body main :units L) (add-out "dxdt(ru(main))" "p_acc" :body main :units "A/T**2") (add-out "ru(main)" "p_vel" :body main :units "A/T") (add-out "rq(main)" "p_ang" :body main :units A) ;UNITS AND DEFAULT PARAMETER VALUES (set-defaults a 1.25 b 1.25 cf 750 cr 750 Iy 625 kf 16000 kr 16000 ktf 150000 ktr 150000 Mb 400 Mf 25 Mr 25 iprint 50 step 0.001 stopt 10) (set-names a "longitudinal separation of mass centre from front axle" b "longitudinal separation of mass centre from rear axle" cf "front suspension damping coefficient" cr "rear suspension damping coefficient" Iy "pitch inertia of vehicle body" kf "front suspension spring stiffness" kr "rear suspension spring stiffness" ktf "front tyre spring stiffness" ktr "rear tyre spring stiffness" Mb "mass of vehicle body" Mf "mass of front wheel" Mr "mass of rear wheel") (linear :u (z_if z_ir)) (finish)