wheatstone project - australia.chevron.com · mdmp marine discharge management plan mike3 software...
TRANSCRIPT
© Chevron Australia Pty Ltd
Document No: WS0-0000-HES-PLN-CVX-000-00102-000 Revision: 4
Revision Date: 02-Feb-2016
IP Security: Public
Wheatstone Project Permanent Onshore Facilities Waste Water Discharge Plan

Wheatstone Project Document No: WS0-0000-HES-PLN-CVX-000-00102-000
Permanent Onshore Facilities Waste Water Discharge Plan Revision: 4
Revision Date: 02/02/2016
© Chevron Australia Pty Ltd Public Page 2
Printed Date:04/12/2013 Uncontrolled when printed
TABLE OF CONTENTS
ACRONYMS, ABBREVIATIONS AND TERMINOLOGY ........................................................ 5
1.0 BACKGROUND .............................................................................................................. 8
1.1 Project Overview .................................................................................................... 8 1.2 Proponent and Environmental Approvals .............................................................. 8 1.3 Purpose ............................................................................................................... 12 1.4 Scope ................................................................................................................... 13 1.5 Structure .............................................................................................................. 18 1.6 Review, Approval and Revision ........................................................................... 19
2.0 PROJECT DESCRIPTION............................................................................................ 20
2.1 Construction Village ............................................................................................. 20 2.2 LNG Plant ............................................................................................................ 20
2.2.1 LNG Plant Site Waste Water Treatment Plant ....................................... 20 2.2.2 LNG Plant Site Primary Treatment Facilities ......................................... 21
2.3 Seawater Desalination System ............................................................................ 21 2.4 Permanent Waste Water Outfall .......................................................................... 21
2.4.1 Sources of Waste Water ........................................................................ 21 2.4.2 Outfall Diffuser Configuration ................................................................. 23
3.0 WASTE WATER TREATMENT PROCESS ................................................................. 24
3.1 Waste Water Treatment Philosophy .................................................................... 24 3.2 Sanitary Waste Water Treatment Process .......................................................... 24
3.2.1 Screening and Equalisation ................................................................... 24 3.2.2 Biological Treatment .............................................................................. 26 3.2.3 Sludge Stabilisation and Dewatering ..................................................... 26 3.2.4 Disinfecting ............................................................................................ 26 3.2.5 Filtration ................................................................................................. 26
3.3 Primary Wastewater Treatment Process ............................................................. 26 3.3.1 CPI System ............................................................................................ 27 3.3.2 DAF System ........................................................................................... 27 3.3.3 DAF Effluent Filters ................................................................................ 27
4.0 ENVIRONMENTAL QUALITY MANAGEMENT FRAMEWORK .................................. 28
4.1 Baseline Water Quality Conditions ...................................................................... 28 4.1.1 Toxicants................................................................................................ 28 4.1.2 Other Physical and Chemical Parameters ............................................. 29 4.1.3 Biological Parameters ............................................................................ 30
4.2 Environmental Values, Quality Objectives and Criteria ....................................... 30 4.3 Levels of Ecological Protection (LEP) .................................................................. 38
5.0 NUMERICAL MODELLING OF EFFLUENT TOXICITY, DILUTION RATES AND RECIRCULATION ........................................................................................................ 41
5.1 Model Approach and Methodology ...................................................................... 41 5.2 Effluent Characterisation ..................................................................................... 45 5.3 Predicted Discharge Toxicity ............................................................................... 51 5.4 Predicted Dilution Rates ...................................................................................... 54 5.5 Recirculation ........................................................................................................ 54
6.0 COMMISSIONING MANAGEMENT AND MONITORING ............................................ 57
6.1 Contingency Management during Commissioning .............................................. 57

Wheatstone Project Document No: WS0-0000-HES-PLN-CVX-000-00102-000
Permanent Onshore Facilities Waste Water Discharge Plan Revision: 4
Revision Date: 02/02/2016
© Chevron Australia Pty Ltd Public Page 3
Printed Date:04/12/2013 Uncontrolled when printed
6.2 Triggers ................................................................................................................ 58 6.2.1 Level 1 ................................................................................................... 58 6.2.2 Level 2 ................................................................................................... 58
6.3 Monitoring ............................................................................................................ 59
7.0 EFFLUENT QUALITY VALIDATION AND REPORTING PLAN .................................. 64
7.1 Contingency Management during Validation ....................................................... 64 7.2 Triggers ................................................................................................................ 65
7.2.1 Level 1 ................................................................................................... 65 7.2.2 Level 2 ................................................................................................... 66 7.2.3 Level 3 ................................................................................................... 66
7.3 Whole Effluent Toxicity Testing ........................................................................... 67 7.4 Effluent Monitoring ............................................................................................... 70 7.5 Marine Water Quality Monitoring ......................................................................... 70
7.5.1 Procedure .............................................................................................. 70 7.5.2 Marine Water Quality Monitoring Design ............................................... 70
7.6 Revision of EQCs and Dilution requirements ...................................................... 72
8.0 OPERATIONS MANAGEMENT & MONITORING ....................................................... 74
8.1 Management ........................................................................................................ 74 8.1.1 Typical Conditions .................................................................................. 74 8.1.2 Unplanned Events .................................................................................. 74
8.2 Triggers ................................................................................................................ 75 8.2.1 Level 1 ................................................................................................... 75 8.2.2 Level 2 ................................................................................................... 75
8.3 Effluent Monitoring ............................................................................................... 76 8.4 Changes to Effluent Stream Composition ............................................................ 76
9.0 REPORTING ................................................................................................................. 77
9.1 Effluent Quality Validation Report ........................................................................ 77 9.2 Annual Compliance Reporting ............................................................................. 77 9.3 Non-compliance Reporting .................................................................................. 77
10.0 REFERENCES ............................................................................................................. 78
TABLES
Table 1.1: Requirements of WA Ministerial Statement No. 873 relevant to this Plan ............ 15 Table 1.2: Requirements of Commonwealth Ministerial Conditions: EPBC 2008/4469
relevant to this Plan ........................................................................................... 17 Table 2.1: Indicative Design Parameters for Permanent Onshore Facilities Waste Water
Outfall Diffuser ................................................................................................... 23 Table 4.1: Environmental Values and Environmental Quality Objectives for Onshore
Facilities Waste Water Discharges .................................................................... 30 Table 4.2: EQCs for Toxicants in Onshore Facilities Waste Water Discharges ..................... 32 Table 4.3: EQCs for Other Chemical and Physical Parameters of Onshore Facilities
Waste Water Discharges ................................................................................... 34 Table 4.4: EQCs for Biological Parameters in Onshore Facilities Waste Water
Discharges......................................................................................................... 36 Table 4.5: Levels of Ecological Protection for Onshore Facilities Waste Water
Discharges......................................................................................................... 39
Wheatstone Project Document No: WS0-0000-HES-PLN-CVX-000-00102-000
Permanent Onshore Facilities Waste Water Discharge Plan Revision: 4
Revision Date: 02/02/2016
© Chevron Australia Pty Ltd Public Page 4
Printed Date:04/12/2013 Uncontrolled when printed
Table 5.1: Summary of the source of historic and baseline meteorological and oceanographic conditions for the model ............................................................ 42
Table 5.2: Effluent Characterisation for Permanent Onshore Facilities Waste Water Discharges - Toxicants ...................................................................................... 46
Table 5.3: Effluent Characterisation for Permanent Onshore Facilities Waste Water Discharges – Other Physical and Chemical Parameters ................................... 48
Table 5.4: Effluent Characterisation for Permanent Onshore Facilities Waste Water Discharges – Biological Parameters .................................................................. 50
Table 5.5: Evaluation of Potential Toxicity of the Discharge using a Colour Coding Scheme - each constituent is categorised into Not Assessable (white), Low Risk (green), Moderate Risk (yellow) and Elevated Risk (orange) .................... 52
Table 5.6: Calculation of the predicted dilutions of the discharge required to meet EQCs at the Low and Moderate LEP Boundaries ........................................................ 55
Table 6.1: Triggers for Contingency Management of the Permanent Onshore Facilities Waste Water Discharges ................................................................................... 60
Table 6.2: Wastewater Discharge Monitoring Parameters, Locations and Frequency .......... 63 Table 7.1: WET Testing of Permanent Onshore Facilities Waste Water Discharges ............ 68
FIGURES
Figure 1.1: Location of the Project Infrastructure ................................................................... 10 Figure 1.2: Nearshore Project Infrastructure .......................................................................... 11 Figure 1.3: Location of the Construction and Permanent Onshore Facilities Waste Water
Outfalls .............................................................................................................. 14 Figure 2.1: Flow Diagram of Permanent Waste Water Treatment Facilities .......................... 22 Figure 3.1: Flow Diagram Overview of the Sanitary Waste Water Treatment Process in
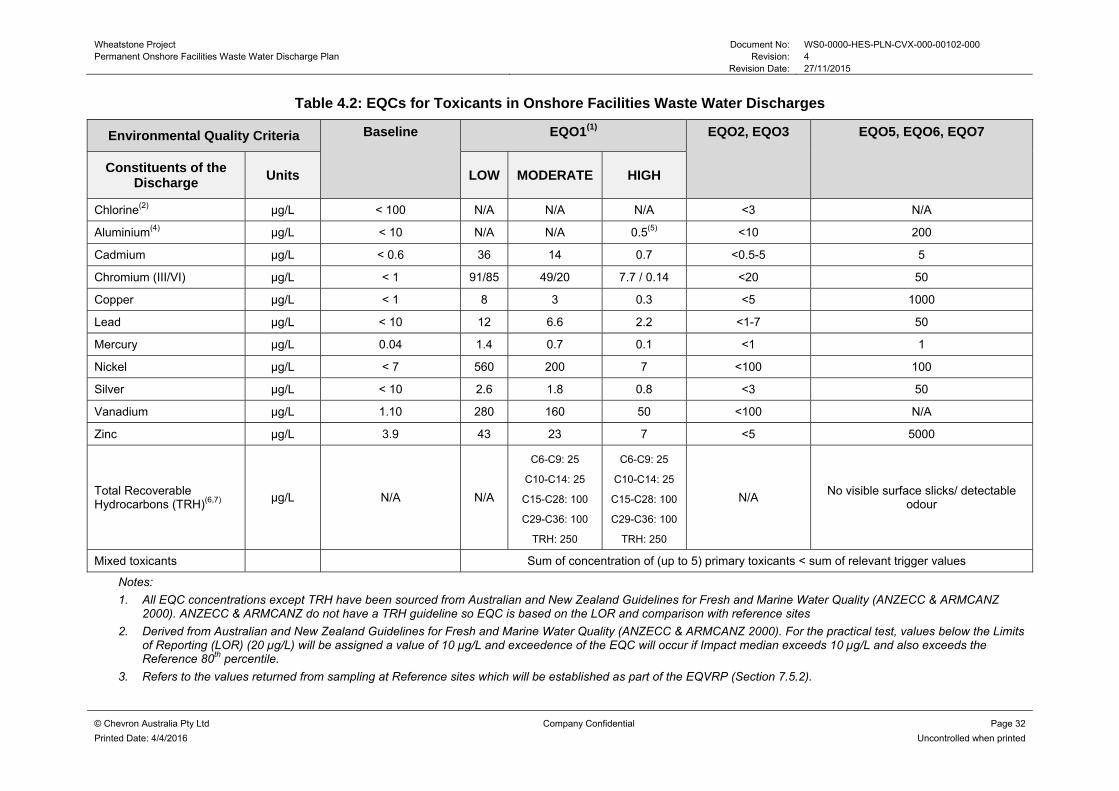
an Activated Sludge Plant (ASP) System .......................................................... 25 Figure 4.1 Approach to determine suitable EQCs to meet all EQOs ..................................... 31 Figure 4.2: The Low, Moderate and High LEP Zones and the indicative Exclusion Zone
where the EQOs will be achieved in relation to the outfall diffuser and nearshore infrastructure .................................................................................... 40
Figure 5.1: Full horizontal model mesh (top) and detail of the area surrounding the planned infrastructure and the diffuser site (bottom) ......................................... 44
Figure 7.1: Approximate Locations of Impact (Black) and Reference (Blue) Monitoring Sites .................................................................................................................. 73
APPENDICES
APPENDIX A ACTION TABLE .................................................................................... 82
APPENDIX B SPECIES AND MATTERS PROTECTED BY THE EPBC ACT ........... 88
APPENDIX C MODELLING RESULTS ........................................................................ 89

Wheatstone Project Document No: WS0-0000-HES-PLN-CVX-000-00102-000
Permanent Onshore Facilities Waste Water Discharge Plan Revision: 4
Revision Date: 2711/2015
© Chevron Australia Pty Ltd Company Confidential Page 5
Printed Date: 4/4/2016 Uncontrolled when printed
ACRONYMS, ABBREVIATIONS AND TERMINOLOGY
°C Degrees Celsius
ANSIA Ashburton North Strategic Industrial Area
ANZECC Australia and New Zealand Environment Conservation Council
ARMCANZ Agriculture and Resource Management Council of Australia and New Zealand
ASP Activated Sludge Plant
BWRO Brackish Water Reverse Osmosis
CAR Compliance Assessment Report
CEO Chief Executive Officer (of the Office of the Environmental Protection Authority)
Chevron Australia Chevron Australia Pty Ltd
Commissioning Is taken to mean wet commissioning of all plant, facilities or associated infrastructure resulting in discharges via the permanent outfall outlined in this plan.
CORMIX Software model used for modelling of near-field dilution
CPI Corrugated Plate Interceptor
CV Construction Village
DAF Dissolved Air Flotation
DBNGP Dampier-to-Bunbury Natural Gas Pipeline
DDG DBP Development Group Pty Ltd
DER Department of Environment Regulation (WA)
DO Dissolved Oxygen
DOTE Department of The Environment (Commonwealth)
Domgas Domestic gas
EC50 Concentration that produces 50 % of the maximum possible effect, derived from regression analysis of toxicity data.
EIS/ERMP Environmental Impact Statement/Environmental Review and Management Programme
EP Act Environmental Protection Act 1986 (WA)
EPBC Act Environment Protection and Biodiversity Conservation Act 1999
EPBC 2008/4469 The Commonwealth Primary Environmental Approval and conditional requirements for the Wheatstone Project. Commonwealth Government of Australia, Minister for Sustainability, Environment, Water, Populations and Communities, Hon. Tony Burke, 22 September 2011, with variations to EPBC 2008/4469 Conditions 44, 45, 55, 56 and 66 made pursuant to section 143 of the EPBC Act, as amended from time to time.
EQC Environmental Quality Criteria
EQMF Environmental Quality Management Framework
EQO Environmental Quality Objectives
EQVRP Effluent Quality Validation and Reporting Plan
EVs Environmental Values

Wheatstone Project Document No: WS0-0000-HES-PLN-CVX-000-00102-000
Permanent Onshore Facilities Waste Water Discharge Plan Revision: 4
Revision Date: 2711/2015
© Chevron Australia Pty Ltd Company Confidential Page 6
Printed Date: 4/4/2016 Uncontrolled when printed
GTG Gas Turbine Generators
IAH Inlet Air Humidification
IC50 50% Inhibitory concentration derived similarly to the EC50 values
kL kilolitre
Km kilometre(s)
LC50 50% Lethal concentration derived similarly to the EC50 values
LEP Level of Ecological Protection
LNG Liquefied Natural Gas
LOR Limits of reporting. Minimum concentration of a residue used for reporting purposes
M Metre(s)
mm Millimetre(s)
m3 Cubic Metre(s)
m3/hr Cubic Metre(s) Per Hour
MDMP Marine Discharge Management Plan
MIKE3 Software model used for modelling of far-field dilution
MIKE21 NHD Model system originally established for the EIS
MS 873 Ministerial Statement No. 873: The State (WA) Primary Environmental Approval, and conditional requirements for the Wheatstone Project. Government of Western Australia, Minister for the Environment; Water, Hon. Bill Marmion MLA, 30 August 2011 as amended by MS 903, MS 922, MS 931 and Attachments 1 to 4 and amended from time to time.
MSL Mean Sea Level
MTPA Million Tonnes Per Annum
NATA National Association of Testing Authorities
Nearshore Marine habitat from the 20 m contour to the shoreline
NOEC No Observed Effect Concentration
Ntot Total Nitrogen
NTU Nephelometric Turbidity Unit
O&G TSE Oil & Grease, Total Solvent Extractable
OEPA Office of the Environmental Protection Authority
Offshore Marine habitat beyond the 20 m contour to the shoreline
(The) Plan Permanent Onshore Facilities Waste Water Discharge Plan
Project The Wheatstone Project as assessed and approved under MS 873 and EPBC 2008/4469.
Practicable Means reasonably practicable having regard to, among other things, local conditions and circumstances (including costs) and to the current state of technical knowledge (taken from the EP Act)
Proponent Chevron Australia Pty Ltd
PTF Primary Treatment Facilities

Wheatstone Project Document No: WS0-0000-HES-PLN-CVX-000-00102-000
Permanent Onshore Facilities Waste Water Discharge Plan Revision: 4
Revision Date: 2711/2015
© Chevron Australia Pty Ltd Company Confidential Page 7
Printed Date: 4/4/2016 Uncontrolled when printed
Ptot Total Phosphorous
RO Reverse Osmosis
Site LNG Plant Site
SWRO Seawater Reverse Osmosis
TDS Total Dissolved Solids
TRH Total Recoverable Hydrocarbons
TSS Total Suspended Solids
TEPCO Tokyo Electric Power Company
TTM Total Toxicity of a Mixture
Typical Conditions Represents the seasonal facility operating scenarios when the various waste water treatment and discharge facilities (the seawater intake, WWTPs, seawater desalination system, primary treatment system, and waste water outfall) are jointly operating within their design limits as outlined in this Plan. Typical conditions do not include the commissioning period of any facility or the scenario(s) when one or more waste water treatment facilities are out of service or major disruptions such as cyclonic events or incidents (e.g. spills).
UF Ultrafiltration
UMF Upflow Media Filtration
μg/L Microgram(s) Per Litre
WA Western Australia
WET Whole Effluent Toxicity
Wet Commissioning
Initial operation and testing that verifies the works and all relevant systems, plant, machinery and equipment have been installed and are capable of performing, to the maximum extent possible, in accordance with the design specification set out in the works approval application.
WWTP Waste Water Treatment Plant
Wheatstone Project Document No: WS0-0000-HES-PLN-CVX-000-00102-000
Permanent Onshore Facilities Waste Water Discharge Plan Revision: 4
Revision Date: 2711/2015
© Chevron Australia Pty Ltd Company Confidential Page 8
Printed Date: 4/4/2016 Uncontrolled when printed
1.0 BACKGROUND
1.1 Project Overview
Chevron Australia Pty Ltd (Chevron Australia) will construct and operate a multi-train Liquefied Natural Gas (LNG) facility and domestic gas (Domgas) plant near Onslow on the Pilbara Coast, Western Australia. The Wheatstone Project (the Project) will process gas from various offshore fields in the West Carnarvon Basin. Ashburton North Strategic Industrial Area (ANSIA) is the approved site for the LNG and Domgas plants.
The Project requires installation of gas gathering, export and processing facilities in Commonwealth and State waters and on land. The initial Project will produce gas from Production Licences WA-46-L, WA-47-L and WA-48-L, 145 km offshore from the mainland, approximately 100 km north of Barrow Island and 225 km north of Onslow, and will also process gas from Production Licence WA-49-L operated by Woodside Petroleum Limited. Figure 1.1 shows the location of the Project.
The ANSIA site is located approximately 12 km south-west of Onslow along the Pilbara coast within the Shire of Ashburton. The initial Project will consist of two LNG processing trains, each with a capacity of approximately 4.45 million tonnes per annum (MTPA). Environmental approval was granted for a 25 MTPA plant to allow for the expected further expansions. The Domgas plant will be a separate but co-located facility and will form part of the Project. The Domgas plant will tie-in to the existing Dampier-to-Bunbury Natural Gas Pipeline (DBNGP) infrastructure via third party DBP Development Group Pty Ltd (DDG) Domgas pipeline. Figure 1.2 shows the onshore and nearshore Project footprint.
1.2 Proponent and Environmental Approvals
Chevron Australia is the Proponent and the company taking the action for the Project on behalf of its joint venture participants.
The Project was assessed through an Environmental Impact Statement / Environmental Review and Management Program (EIS/ERMP) assessment process under the WA Environmental Protection Act 1986 (EP Act) and the Commonwealth Environment Protection and Biodiversity Conservation Act 1999 (EPBC Act).
The Project was approved by the WA Minister for Environment on 30 August 2011 by way of Ministerial Statement No. 873 (MS 873) and as amended by Ministerial Statement No. 903 (MS 903), Ministerial Statement No. 922 (MS 922), Ministerial Statement No. 931 (MS 931) and Attachments 1 to 4. Revised Environmental Protection Outcomes under Condition 8-7 to allow for trunkline installation were approved by the Minister by way of letter dated 30 January 2013. The Commonwealth Minister for Sustainability, Environment, Water, Population and Communities approved the Project on 22 September 2011 (EPBC 2008/4469) with variations to EPBC 2008/4469 Conditions 44, 45, 55, 56 66 and 71 made pursuant to section 143 of the EPBC Act. Other amendments may be made from time to time and if so will be reflected in the next revision of this Plan.

Wheatstone Project Document No: WS0-0000-HES-PLN-CVX-000-00102-000
Permanent Onshore Facilities Waste Water Discharge Plan Revision: 4
Revision Date: 2711/2015
© Chevron Australia Pty Ltd Company Confidential Page 9
Printed Date: 4/4/2016 Uncontrolled when printed
Noted sections of this Plan have been prepared to meet the following requirements (Table 1.1):
Prior to submitting an application for a works approval to the Department of Environment Regulation (DER) for any discharge from the onshore facilities, the Proponent shall submit a report to the DER that meets the requirements set out in Condition 13-11 (MS 873).
Prior to submitting an application for a works approval to the DER for any discharge from the onshore facilities, the Proponent shall develop an Effluent Quality Validation and Reporting Plan (EQVRP) in consultation with the DER that addresses the matter set out in Condition 13-12 (MS 873).
The sections in this Plan which are noted to meet the conditions of EPBC 2008/4469 (Table 1.2) shall be read and be interpreted as only requiring implementation of EPBC 2008/4469 for managing the impacts of the Permanent Onshore Facilities waste water discharge on, or protecting, the EPBC Act matters listed in Appendix B. The implementation of matters required only to meet the requirements of MS 873 are not the subject of EPBC 2008/4469. Similarly, the implementation of matters required only to meet the requirements of EPBC 2008/4469 are not the subject of MS 873.

Wheatstone Project Document No: WS0-0000-HES-PLN-CVX-000-00102-000
Permanent Onshore Facilities Waste Water Discharge Plan Revision: 4
Revision Date: 2711/2015
© Chevron Australia Pty Ltd Company Confidential Page 10
Printed Date: 4/4/2016 Uncontrolled when printed
Figure 1.1: Location of the Project Infrastructure

Wheatstone Project Document No: WS0-0000-HES-PLN-CVX-000-00102-000 Permanent Onshore Facilities Waste Water Discharge Plan Revision: 4 Revision Date: 2/02/2016
© Chevron Australia Pty Ltd Company Confidential Page 11
Printed Date: 4/4/2016 Uncontrolled when printed
Figure 1.2: Nearshore Project Infrastructure
Wheatstone Project Document No: WS0-0000-HES-PLN-CVX-000-00102-000 Permanent Onshore Facilities Waste Water Discharge Plan Revision: 4 Revision Date: 02/02/2016
© Chevron Australia Pty Ltd Public Page 12
Printed Date: 4/4/2016 Uncontrolled when printed
1.3 Purpose
In accordance with the Western Australia (WA) Minister for Environment Ministerial Statement No. 873 (MS 873) Condition 13-11, the purpose of the Permanent Onshore Facilities Waste Water Discharge Plan (the Plan) is to submit a report that meets the following conditions:
i. Spatially maps the areas where each environmental quality objective and level of ecological protection (LEP) is to be achieved.
ii. Identifies the environmental quality criteria (EQC), for constituents of the discharge considered relevant by DER - formerly Department of Environment and Conservation, that should be achieved to maintain the environmental quality objectives (EQO) and LEP established through Condition 13-1.
iii. Predicts the toxicity of the final discharge under typical conditions. iv. Predicts the number of dilutions necessary to meet the required EQO and LEP. For
example, a moderate level of protection at the boundary of a Low and Moderate Ecological Protection Area and a high level of protection at the boundary of a Moderate and High Ecological Protection Area, or to meet a high level of protection at the boundary of a Low and High Ecological Protection Area (predictions are based on achieving EQC and effluent toxicity).
v. Presents contingency options for additional treatment or extending the diffuser to achieve greater dilutions if required.
Simultaneously, this Plan will meet the purpose of describing the EQVRP required under MS 873 Condition 13-12 to address the following:
i. Whole Effluent Toxicity (WET) Testing program for determining: a. the actual toxicity of any discharge post commissioning and post operation of
the outfall and following any significant change in effluent composition; and b. the number of dilutions required to achieve each relevant LEP, testing is to be
undertaken on a minimum of five locally relevant species from four different taxonomic groups using the recommended protocols from Australia and New Zealand Environment Conservation Council (ANZECC) and Agriculture and Resource Management Council of Australia and New Zealand (ARMCANZ) (2000).
ii. Characterisation of any waste water discharge under typical operational conditions and after any significant changes in effluent composition.
iii. A revised set of EQC based on the contaminants of concern identified from Condition 13-12(ii).
iv. Given the results from Conditions 13-12(i) (ii) and (iii), the number of dilutions required to achieve the EQO and LEP identified in Condition 13-1 and described in Schedule 2.
v. Reporting to the DER within six months of commissioning of a discharge or within six months of any significant change in composition of a discharge, including any management actions necessary to ensure ongoing compliance with the EQO and levels of ecological protection established through Condition 13-1 and described in Schedule 2.
In accordance with Commonwealth Minister for the Environment, Environmental Protection and Biodiversity Conservation Statement 2008/4469 (EPBC 2008/4469) Condition 44a states that as part of a Marine Discharge Management Program (MDMP) for discharges to marine and riverine habitats, the purpose of the Permanent Onshore Facilities Waste Water Discharge Plan (the Plan) is to submit:
a. An Onshore facilities waste water discharge report and an Onshore EQVRP. The Onshore EQVRP must include water quality targets based on the

Wheatstone Project Document No: WS0-0000-HES-PLN-CVX-000-00102-000 Permanent Onshore Facilities Waste Water Discharge Plan Revision: 4 Revision Date: 02/02/2016
© Chevron Australia Pty Ltd Public Page 13
Printed Date: 4/4/2016 Uncontrolled when printed
ANZECC Water Quality Guidelines (2000), monitoring programs, trigger levels, management and corrective actions.
The Plan has been prepared for the purpose of meeting the conditions listed above as well as to inform the Works Approval process, required under Part 5 of the Environmental Protection Act 1986 (EP Act). If there are differences or inconsistencies between the Works Approval/Licence application documents and conditions (MS 873 or EPBC 2008/4469), the former prevail to the extent of the inconsistency, and the Plan will be amended to ensure there is no difference or inconsistency between the documents provided the necessary amendments do not alter the Proponent’s obligations under the conditions. The requirements of the State and Commonwealth Ministerial Conditions, and reference to the relevant sections within this Plan are provided in Table 1.1 and Table 1.2, respectively.
1.4 Scope
The scope of the Plan is relevant to the commissioning and operation of the permanent onshore facilities waste water outfall of the Wheatstone Project. The facilities and treatment processes relevant to the expected discharges via this outfall are described in Sections 2.0 and 3.0, respectively. The location of the permanent onshore facilities waste water outfall (refer Figure 1.3) has been approved by the WA Minister for Environment under Conditions 13-2 through 13-4 of MS 873.
The potential impacts associated with the commissioning and operation of the construction onshore facilities waste water outfall are addressed in the Construction Onshore Facilities Waste Water Discharge Plan (Chevron Australia 2013) and are therefore outside the scope of this Plan. The location of the construction onshore facilities waste water outfall (refer Figure 1.3) has been approved by the WA Minister for Environment under Conditions 13-2 through 13-4 of MS 873.
The Plan presents the environmental monitoring and management measures regarding permanent onshore facilities waste water discharges, as well as the proposed activities required to support the Effluent Quality Validation and Reporting Plan required under Condition 13-12 (MS 873) and Condition 44a of EPBC 2008/4469. While the Plan includes contingency management for commissioning and unplanned events, the environmental quality management framework (EQMF) is focused on discharges from the waste water treatment plants (WWTPs) under Typical Conditions.
Typical conditions are considered to represent the scenario when the various waste water treatment and discharge facilities (the seawater intake, seawater desalination system, primary treatment facilities, WWTPs and waste water outfall) are jointly operating within their design limits as outlined in this Plan. This includes the extraction of ambient seawater for the seawater desalination plant within the designed water quality parameters, the availability of reject brine for co-mingling of treated waste water streams, and the discharge characteristics of the treated effluent remaining within the rated design limits. Typical conditions do not include the commissioning period of any facility or the scenario(s) when one or more waste water treatment facilities are out of service or major disruptions such as cyclonic events or incidents (e.g. spills).
The waste water system was designed with sufficient detail to support the development of this Plan for the permanent onshore facilities waste water outfall only, and has subsequently been modified in 2015. The detailed engineering design for the permanent onshore facilities waste water discharge system has been incorporated into the plan.

Wheatstone Project Document No: WS0-0000-HES-PLN-CVX-000-00102-000 Permanent Onshore Facilities Waste Water Discharge Plan Revision: 4 Revision Date: 02/02/2016
© Chevron Australia Pty Ltd Public Page 14
Printed Date: 4/4/2016 Uncontrolled when printed
Figure 1.3: Location of the Construction and Permanent Onshore Facilities Waste Water Outfalls

Wheatstone Project Document No: WS0-0000-HES-PLN-CVX-000-00102-000 Permanent Onshore Facilities Waste Water Discharge Plan Revision: 4 Revision Date: 27/11/2015
© Chevron Australia Pty Ltd Company Confidential Page 15
Printed Date: 4/4/2016 Uncontrolled when printed
Table 1.1: Requirements of WA Ministerial Statement No. 873 relevant to this Plan
No. Condition Section
13-11 Prior to submitting an application for a works approval to the DER (formerly DEC) for any discharge from the onshore facilities, the Proponent shall submit a report to the DER that:
13-11 i. spatially maps the areas where each environmental quality objective and level of ecological protection is to be achieved;
Figure 4.2
13-11 ii. identifies the environmental quality criteria, for constituents of the discharge considered relevant by the DER, that should be achieved to maintain the environmental quality objectives and levels of ecological protection established through Condition 13-1;
4.0
13-11 iii. predicts the toxicity of the final discharge under typical conditions; 5.2
13-11 iv. predicts the number of dilutions necessary to meet the required environmental quality objectives and level of ecological protection. For example, a moderate level of protection at the boundary of a Low and Moderate Ecological Protection Area and a high level of protection at the boundary of a Moderate and High Ecological Protection Area, or to meet a high level of protection at the boundary of a Low and High Ecological Protection Area (predictions are based on achieving environmental quality criteria and effluent toxicity); and
5.3
13-11 v. presents contingency options for additional treatment or extending the diffuser to achieve greater dilutions if required. 6.1, 8.1
13-12 Prior to submitting an application for a works approval to the DER for any discharge from the onshore facilities, the Proponent shall develop an Effluent Quality Validation and Reporting Plan in consultation with the DER that addresses the following issues:
7.0
13-12 i. Whole Effluent Toxicity Testing program for determining: a. the actual toxicity of any discharge post commissioning and post operation of the outfall and following any
significant change in effluent composition; and
7.3
7.6

Wheatstone Project Document No: WS0-0000-HES-PLN-CVX-000-00102-000 Permanent Onshore Facilities Waste Water Discharge Plan Revision: 4 Revision Date: 27/11/2015
© Chevron Australia Pty Ltd Company Confidential Page 16
Printed Date: 4/4/2016 Uncontrolled when printed
No. Condition Section
b. the number of dilutions required to achieve each relevant level of ecological protection, testing is to be undertaken on a minimum of five locally relevant species from four different taxonomic groups using the recommended protocols from ANZECC and ARMCANZ (2000)
13-12 ii. characterisation of any waste water discharge under typical operational conditions and after any significant changes in effluent composition;
7.4, 8.4
13-12 iii. a revised set of environmental quality criteria based on the contaminants of concern identified from Condition 13-12(ii); 7.6
13-12 vi. given the results from Conditions 13-12(i) (ii) and (iii), the number of dilutions required to achieve the environmental quality objectives and levels of ecological protection identified in Condition 13-1 and described in Schedule 2; and
7.6
13-12 v. reporting to the DER within six months of commissioning of a discharge or within six months of any significant change in composition of a discharge, including any management actions necessary to ensure ongoing compliance with the environmental quality objectives and levels of ecological protection established through Condition 13-1 and described in Schedule 2.
9.0

Wheatstone Project Document No: WS0-0000-HES-PLN-CVX-000-00102-000 Permanent Onshore Facilities Waste Water Discharge Plan Revision: 4 Revision Date: 27/11/2015
© Chevron Australia Pty Ltd Company Confidential Page 17
Printed Date: 4/4/2016 Uncontrolled when printed
Table 1.2: Requirements of Commonwealth Ministerial Conditions: EPBC 2008/4469 relevant to this Plan
No. Condition Section
44. The person taking the action must submit to the Minister the following reports and plans, as component parts of the Marine Discharge Management Program (MDMP) for discharges to marine and riverine habitats(1):
a. An Onshore facilities waste water discharge report and an Onshore Effluent Quality Validation and Reporting Plan (Onshore EQVRP). The Onshore EQVRP must include:
(1) water quality targets based on the ANZECC Water Quality Guidelines (2000),
(2) monitoring programs,
(3) trigger levels,
(4) management and corrective actions.
(1) 4.2
(2) 6.0, 7.0, 8.0
(3) 6.0, 7.0
(4) 6.0, 7.0
Note:
(1) The Plan is to be included into the collaborative of all discharge Environmental Management Plans prepared for the Wheatstone Project. Together, these Plans form the MDMP.

Wheatstone Project Document No: WS0-0000-HES-PLN-CVX-000-00102-000 Permanent Onshore Facilities Waste Water Discharge Plan Revision: 4 Revision Date: 27/11/2015
© Chevron Australia Pty Ltd Company Confidential Page 18
Printed Date: 4/4/2016 Uncontrolled when printed
1.5 Structure
This Plan is structured as follows:
Section Description
Section 1.0 Provides the background to the Wheatstone Project, outline the scope and Ministerial Conditions relevant to the Plan.
Section 2.0 Describes the facilities and equipment that will be involved in the operation of the permanent onshore facilities.
Section 3.0 Describes the processes involved in the treatment of waste water.
Section 4.0 Describes the baseline water quality for the Project area from baseline sampling undertaken, identifies EQCs that should be achieved to maintain the EQOs for the Project and identifies and maps the areas of the Low, Moderate and High LEP Zones.
Section 5.0 Presents the results of modelling undertaken to characterise the water quality conditions at the location of the discharge outfall and the constituents contained within the waste stream, evaluates the potential toxicity of the permanent onshore facilities waste water discharge under typical conditions, predicts the number of dilutions necessary to achieve the Moderate and High EQCs at the outer boundaries of the Low and Moderate LEP Zones and predicts the magnitude of recirculation between the outfall and the seawater intake.
Section 6.0 Describes the monitoring and management undertaken during the Commissioning period. Presents contingency options for additional treatment or to achieve greater dilutions.
Section 7.0 Describes the monitoring and management undertaken during the EQVRP including; WET testing, characterising waste water discharge, revision of the EQCs based on the contaminants of concern and revision of the number of dilutions required to achieve the EQOs and LEP.
Section 8.0 Describes the monitoring and management undertaken during the Operational Period. Presents contingency options for additional treatment or to achieve greater dilutions.
Section 9.0 Reporting requirements, including any management actions necessary to achieve EQOs and LEPs.

Wheatstone Project Document No: WS0-0000-HES-PLN-CVX-000-00102-000 Permanent Onshore Facilities Waste Water Discharge Plan Revision: 4 Revision Date: 27/11/2015
© Chevron Australia Pty Ltd Company Confidential Page 19
Printed Date: 4/4/2016 Uncontrolled when printed
1.6 Review, Approval and Revision
The Proponent will review the Plan to address matters such as the overall effectiveness, environmental performance, changes in environmental risks and changes in business conditions on an as needed basis (e.g. in response to new information).
The Project elements may also be amended, for example under section 45C of the EP Act. The Project elements which are detailed in this Plan should therefore be read as subject to any Project amendments. In accordance with Condition 24-1 of MS 873, Chevron Australia may only implement an amendment to this Plan from the date of the amendment.
Further, if during the Works Approval or licensing process, or as a result of the conditions of the Works Approval or licence, there is a revision(s) to this Plan, Chevron Australia will revise this Plan and provide the revision(s) to DER, and in the meantime the works approval/licence documents will be preferred in the extent of any difference or inconsistency.
In accordance with Condition 5 of EPBC 2008/4469, if Chevron Australia wishes to undertake activities associated with the discharge of waste water from the permanent onshore facilities otherwise than in accordance with the provisions of this Plan, the activity shall not commence until the Commonwealth Minister has approved the varied plan. In accordance with Condition 6 of EPBC 2008/4469, Chevron Australia is required to make specified revisions of the Plan if requested by the Commonwealth Minister for the better protection of listed threatened and migratory species and communities.

Wheatstone Project Document No: WS0-0000-HES-PLN-CVX-000-00102-000 Permanent Onshore Facilities Waste Water Discharge Plan Revision: 4 Revision Date: 27/11/2015
© Chevron Australia Pty Ltd Company Confidential Page 20
Printed Date: 4/4/2016 Uncontrolled when printed
2.0 PROJECT DESCRIPTION
The Project description which follows has been included for the purpose of contextualising the environmental monitoring and management measures required under this Plan, and are provided for information only as an approximate indication of how the processes may operate. Chevron Australia may change these processes as necessary to meet the relevant environmental quality objectives and levels of ecological protection. The Project description described below may be amended as a consequence of a change in planning, for example under section 45C of the EP Act. The Project description detailed in this Plan should therefore be read as subject to any Project amendments.
2.1 Construction Village
A construction village (CV) has been designed to house the peak population of the Project. The CV is serviced by a set of WWTP trains which are connected to the Project temporary ocean outfall (refer to Works Approval W5439/2013/1 and the Wheatstone Project Construction Onshore Facilities Waste Water Discharge Plan WS0-0000-HES-PLN-CVX-000-00096-000 Rev 3) and will eventually be discharged via the permanent outfall subject to this Plan.
Each CV WWTP train has the capacity to treat up to 480 kilolitres (kL) of waste water per day. The CV WWTP configuration will be adjusted to optimize WWTP performance. The CV WWTP will treat all water associated with the CV (sink/shower, sanitary, and other domestic waste water). The sludge generated from the CV WWTP will be stored in the integrated sludge storage tank and will either be removed offsite directly by a licensed controlled waste contractor to an approved, licensed facility or pumped to the sludge digester and belt press prior to being removed offsite.
2.2 LNG Plant
The LNG Plant will initially comprise two LNG trains operating at a total capacity of approximately 8.9 MTPA, expanding to its maximum capacity of 25 MTPA with up to five LNG trains in operation. LNG will be initially stored in two 150 000 cubic metres (m3) LNG tanks, expanding up to four 150 000 m3 tanks. The LNG is pumped from the storage tanks to the loading arms at the LNG carrier berths and into LNG carriers for shipping to export markets.
Condensate will be stored in tanks of approximately 120 000 m3 and pumped to the condensate berth to transfer to oil tankers via the loading arms. Initially, two tanks are proposed with additional tanks being added as throughput increases over time, up to a maximum of four condensate storage tanks. The 25 MTPA LNG Plant will operate with up to eight elevated flare structures; three high pressure flares with approximate height of 95 meters (m), three low pressure flares with approximate height of 45 m and two marine flares with approximate height of 45 m.
2.2.1 LNG Plant Site Waste Water Treatment Plant
The LNG Plant Site WWTP (LNG WWTP) will consist of two treatment trains operating at 50% capacity. This configuration supports the overall system reliability as the treatment can be performed by in-service train if the other train is out of service. The LNG WWTP will treat waste water from site sinks/showers and sanitary facilities at the LNG Plant site. The installation, commissioning, and operation of the LNG WWTP is similar to that described for the CV WWTP and will be completed, one train after the other. Both the CV and LNG WWTPs will have similar module configuration and will be Activated Sludge Plant (ASP) systems. Wet Commissioning of each stage of the LNG WWTP will occur continuously, 24 hours per day, over a period of approximately three months.
Wheatstone Project Document No: WS0-0000-HES-PLN-CVX-000-00102-000 Permanent Onshore Facilities Waste Water Discharge Plan Revision: 4 Revision Date: 27/11/2015
© Chevron Australia Pty Ltd Company Confidential Page 21
Printed Date: 4/4/2016 Uncontrolled when printed
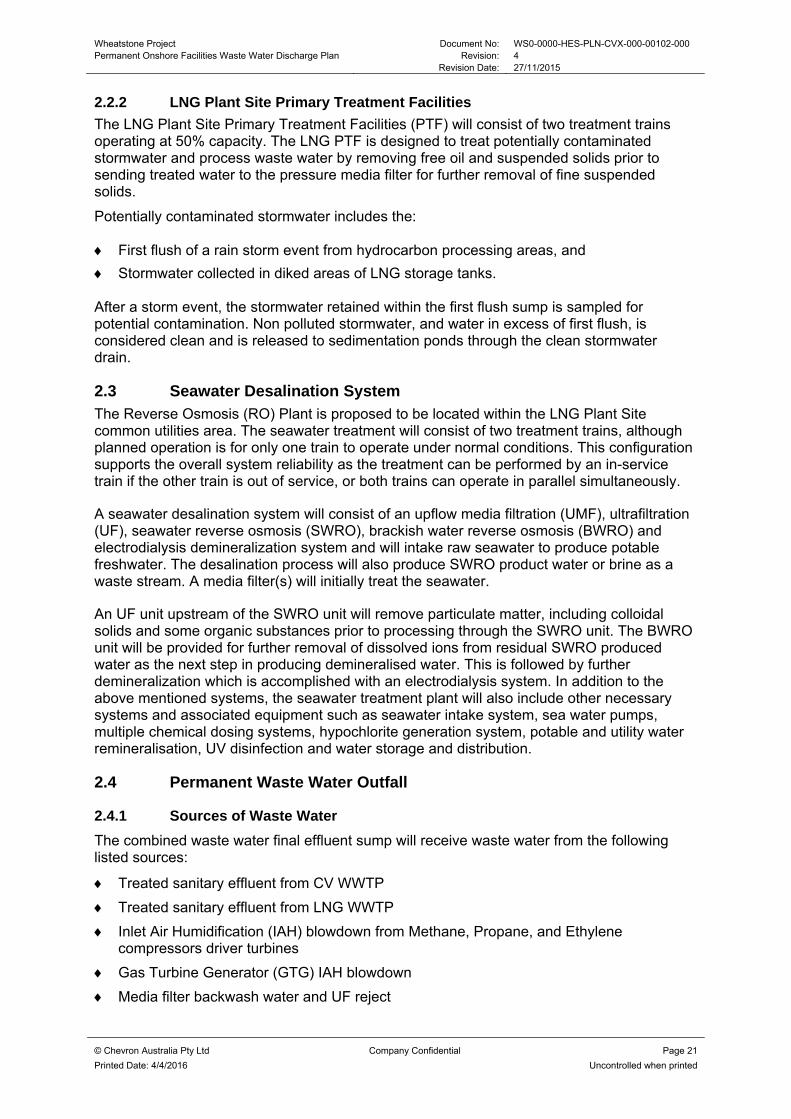
2.2.2 LNG Plant Site Primary Treatment Facilities
The LNG Plant Site Primary Treatment Facilities (PTF) will consist of two treatment trains operating at 50% capacity. The LNG PTF is designed to treat potentially contaminated stormwater and process waste water by removing free oil and suspended solids prior to sending treated water to the pressure media filter for further removal of fine suspended solids.
Potentially contaminated stormwater includes the:
First flush of a rain storm event from hydrocarbon processing areas, and
Stormwater collected in diked areas of LNG storage tanks. After a storm event, the stormwater retained within the first flush sump is sampled for potential contamination. Non polluted stormwater, and water in excess of first flush, is considered clean and is released to sedimentation ponds through the clean stormwater drain.
2.3 Seawater Desalination System
The Reverse Osmosis (RO) Plant is proposed to be located within the LNG Plant Site common utilities area. The seawater treatment will consist of two treatment trains, although planned operation is for only one train to operate under normal conditions. This configuration supports the overall system reliability as the treatment can be performed by an in-service train if the other train is out of service, or both trains can operate in parallel simultaneously.
A seawater desalination system will consist of an upflow media filtration (UMF), ultrafiltration (UF), seawater reverse osmosis (SWRO), brackish water reverse osmosis (BWRO) and electrodialysis demineralization system and will intake raw seawater to produce potable freshwater. The desalination process will also produce SWRO product water or brine as a waste stream. A media filter(s) will initially treat the seawater.
An UF unit upstream of the SWRO unit will remove particulate matter, including colloidal solids and some organic substances prior to processing through the SWRO unit. The BWRO unit will be provided for further removal of dissolved ions from residual SWRO produced water as the next step in producing demineralised water. This is followed by further demineralization which is accomplished with an electrodialysis system. In addition to the above mentioned systems, the seawater treatment plant will also include other necessary systems and associated equipment such as seawater intake system, sea water pumps, multiple chemical dosing systems, hypochlorite generation system, potable and utility water remineralisation, UV disinfection and water storage and distribution.
2.4 Permanent Waste Water Outfall
2.4.1 Sources of Waste Water
The combined waste water final effluent sump will receive waste water from the following listed sources:
Treated sanitary effluent from CV WWTP
Treated sanitary effluent from LNG WWTP
Inlet Air Humidification (IAH) blowdown from Methane, Propane, and Ethylene compressors driver turbines
Gas Turbine Generator (GTG) IAH blowdown
Media filter backwash water and UF reject
Wheatstone Project Document No: WS0-0000-HES-PLN-CVX-000-00102-000 Permanent Onshore Facilities Waste Water Discharge Plan Revision: 4 Revision Date: 27/11/2015
© Chevron Australia Pty Ltd Company Confidential Page 22
Printed Date: 4/4/2016 Uncontrolled when printed
Reject from SWRO and BWRO units
Treated effluent from the LNG PTF.
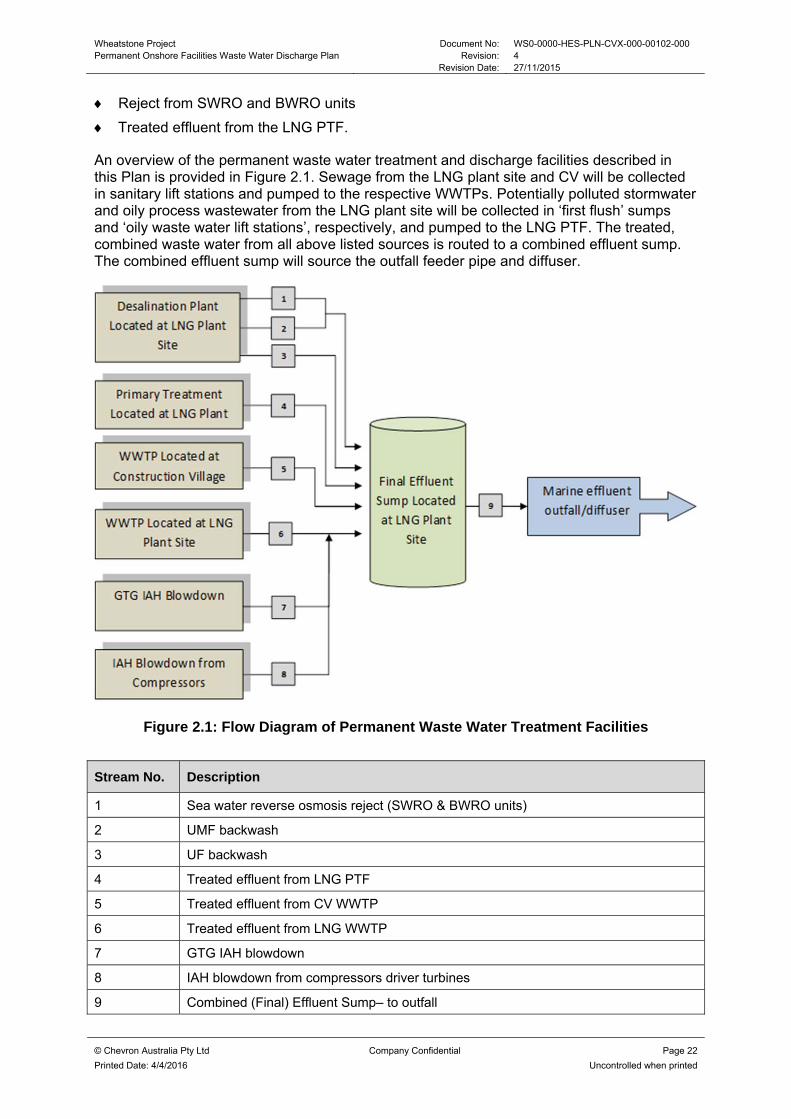
An overview of the permanent waste water treatment and discharge facilities described in this Plan is provided in Figure 2.1. Sewage from the LNG plant site and CV will be collected in sanitary lift stations and pumped to the respective WWTPs. Potentially polluted stormwater and oily process wastewater from the LNG plant site will be collected in ‘first flush’ sumps and ‘oily waste water lift stations’, respectively, and pumped to the LNG PTF. The treated, combined waste water from all above listed sources is routed to a combined effluent sump. The combined effluent sump will source the outfall feeder pipe and diffuser.
Figure 2.1: Flow Diagram of Permanent Waste Water Treatment Facilities
Stream No. Description
1 Sea water reverse osmosis reject (SWRO & BWRO units)
2 UMF backwash
3 UF backwash
4 Treated effluent from LNG PTF
5 Treated effluent from CV WWTP
6 Treated effluent from LNG WWTP
7 GTG IAH blowdown
8 IAH blowdown from compressors driver turbines
9 Combined (Final) Effluent Sump– to outfall

Wheatstone Project Document No: WS0-0000-HES-PLN-CVX-000-00102-000 Permanent Onshore Facilities Waste Water Discharge Plan Revision: 4 Revision Date: 27/11/2015
© Chevron Australia Pty Ltd Company Confidential Page 23
Printed Date: 4/4/2016 Uncontrolled when printed
2.4.2 Outfall Diffuser Configuration
The wastewater streams listed in Section 2.4.1 will be comingled and discharged to the marine environment via a permanent outfall terminating in a diffuser, located adjacent to the Product Loading Facility (PLF), attached to a concrete block mattress (approximately 200 mm thick) that acts as scour protection (Figure 1.3). The unidirectional oblique diffuser design consists of 20 variable-area duckbill ports. Owing to the presence of the desalination plant intake near the intersection of the access trestle and the basin cut, all diffuser ports are arranged on the offshore (Northeast) side of the main diffuser pipe to direct effluent away from the intake. Key details of the permanent outfall diffuser are summarised in Table 2.1.
Table 2.1: Indicative Design Parameters for Permanent Onshore Facilities Waste Water Outfall Diffuser
Period Current Speed (m/s)
Diffuser centrepoint MGA-50: (293670, 7601738)
Water depth -13.5 m lowest astronomical tide/ -14.8 m MSL
Discharge elevation +2.5 m above sea bed/ -12.3 m MSL
Discharge rate 674 m3/hr = 0.187 m3/s
Outfall type Unidirectional oblique diffuser
Length 89 m
No. of ports 20
Port spacing 4.5 to 5.0 m c/c
Port diameter (ID) 2” (50.8 mm)
Port exit velocity 4.6 m/s
Port angle in horizontal plane 60°N
Port angle in vertical plane 30°
Wheatstone Project Document No: WS0-0000-HES-PLN-CVX-000-00102-000 Permanent Onshore Facilities Waste Water Discharge Plan Revision: 4 Revision Date: 27/11/2015
© Chevron Australia Pty Ltd Company Confidential Page 24
Printed Date: 4/4/2016 Uncontrolled when printed
3.0 WASTE WATER TREATMENT PROCESS
The waste water treatment process description which follows has been included for the purpose of contextualising the environmental monitoring and management measures which are required under this Plan and has been provided for information only as an approximate indication of how the processes may operate. Chevron Australia may change these processes as necessary to meet the relevant environmental quality objectives and levels of ecological protection. This section describes the processes associated with the systems and equipment described in the Project Description in Section 2.0. If Section 2.0 is amended, for example under section 45C of the EP Act, the waste water treatment process described below may be altered and this section may also be amended. The waste water treatment process detailed within this Plan should therefore be read as subject to any Project amendments.
3.1 Waste Water Treatment Philosophy
Water is considered a resource in a dry environment where access to surface and groundwater is limited. Therefore, treated water will be reused to the extent practicable provided all environmental and health requirements are satisfied. Treated effluent from the CV and LNG WWTPs that meets recognised standards outlined in the ANZECC Guidelines for Sewerage Systems (ANZECC 1997) may be reused for purposes such as dust suppression and compaction. Any treated effluent that is beyond the volume needed for reuse will be discharged to the marine environment.
3.2 Sanitary Waste Water Treatment Process
The sanitary and domestic waste water shall be treated by a series of main treatment phases:
Screening and Equalisation
Biological Treatment (Oxidation and Settling)
Sludge Stabilisation
Sludge Dewatering
Disinfection
Filtration. The CV and LNG WWTPs are ASP systems which have the same module configuration. The ASP uses an aerobic biological treatment system. The process involves the introduction of oxygen into waste water for aerobic biomass metabolism and a reduction in waste water organic content. A flow diagram of the treatment phases for the sanitary waste water in the ASP system is provided in Figure 3.1.
3.2.1 Screening and Equalisation
The sanitary influent is pumped through a series of bar screens to remove debris and coarse solids prior to entering into the equalisation tank. Screened material will be collected in a roll-off container. A flow splitter box is utilized to split the flow evenly into each equalisation train. The equalisation tank is utilised to smooth out the flow and organic load. The capacity of the equalisation tank and lifting pumps will be sized to realise flow equalisation of fluctuating hydraulic loads. Air sparging at the bottom of the tank will allow a thorough mixing and will avoid anaerobic processes to occur, which should minimise odour emissions.

Wheatstone Project Document No: WS0-0000-HES-PLN-CVX-000-00102-000 Permanent Onshore Facilities Waste Water Discharge Plan Revision: 4 Revision Date: 27/11/2015
© Chevron Australia Pty Ltd Company Confidential Page 25
Printed Date: 4/4/2016 Uncontrolled when printed
Figure 3.1: Flow Diagram Overview of the Sanitary Waste Water Treatment Process in an Activated Sludge Plant (ASP) System
Sludge from CV WWTP Sludge from LNG WWTP to Sludge Digester or for offsite Disposal
Wheatstone Project Document No: WS0-0000-HES-PLN-CVX-000-00102-000 Permanent Onshore Facilities Waste Water Discharge Plan Revision: 4 Revision Date: 27/11/2015
© Chevron Australia Pty Ltd Company Confidential Page 26
Printed Date: 4/4/2016 Uncontrolled when printed
3.2.2 Biological Treatment
The aeration chamber is the key part of the WWTP and it will be designed to operate as an extended aeration process. This process operates by promoting bacterial activity, in the presence of added oxygen, to metabolise and biologically flocculate the organic (biodegradable) materials in the waste stream. A foam control system is installed on each aeration module. Bacteria in the aeration tank decompose the sewage to form a suspended sludge. This mixed liquor from the aeration basin flows by gravity to the clarifier. In the clarifier, biological solids are removed from the treated wastewater by gravity separation. Biological solids settle to the bottom of the clarifier and the treated wastewater overflows the weirs and flows by gravity to the chlorine contact chamber where the treated effluent is disinfected. Biological solids that settle to the bottom of the clarifier are removed with a sludge removal mechanism and the majority of the sludge is recycled back to the aeration basin. Excess sludge from the system is discharged to the sludge storage tank and then to sludge digester for sludge digestion and stabilisation.
3.2.3 Sludge Stabilisation and Dewatering
Sludge will be stabilised biologically in the presence of oxygen, within the sludge storage tank, before it is pumped to an aerobic digester thickener. Periodically the sludge will be removed and further treated in the sludge dewatering section. Stabilised thickened sludge coming from the sludge thickeners will be fed to a mixing tank where a polymer conditioner will be added, through a polymer blending system, to improve dewatering in the belt press. The belt press then treats all the sludge produced. All of the pressed sludge will be collected in a roll-off container for offsite disposal at an approved facility by a licensed contractor. This system is being designed to minimise final sludge disposal volumes.
The CV and LNG WWTPs follow the same treatment process. However, sludge from the LNG WWTP will be trucked to the CV sludge digester for digestion, sludge dewatering, and offsite removal. The sludge “cake” will be hauled by a licensed controlled waste contractor to a licensed facility. The non-dewatered sludge will be sent offsite if the sludge digestion and dewatering systems at the CV WWTP are not available.
3.2.4 Disinfecting
The clarified water will flow to a disinfection tank, with a retention time of one hour at the average flow rate.
3.2.5 Filtration
The disinfected water will then be sent to a dual media filtration section to further reduce the level of suspended solids in the treated water. Two pressurised filters will be included for each train, one to be on duty and one in stand-by mode, for the entire flow rate of the train. Once the pressure drop or maximum time elapsed has been reached, the filter will automatically be backwashed with air scouring with the stand-by filter immediately being on duty. Backwash water will be sent to the waste water influent equalisation tanks. The filtered water is then sent to the final treated effluent sump for discharge to the permitted outfall discharge diffuser along with the other treated wastewater streams.
3.3 Primary Wastewater Treatment Process
Primary treatment receives flow from oily water lift stations, process unit sumps and first flush sumps. The system splits the flow to each Corrugated Plate Interceptor (CPI) oil-water separator train. Primary treatment is used to remove free oil and suspended solids prior to sending to the pressure media filter for further removal of fine suspended solids. Process units utilized in primary treatment include CPI oil-water separator, Dissolved Air Flotation (DAF) and media filtration.

Wheatstone Project Document No: WS0-0000-HES-PLN-CVX-000-00102-000 Permanent Onshore Facilities Waste Water Discharge Plan Revision: 4 Revision Date: 27/11/2015
© Chevron Australia Pty Ltd Company Confidential Page 27
Printed Date: 4/4/2016 Uncontrolled when printed
Potentially hydrocarbon contaminated wastewaters will normally be pumped directly to the CPI. However, in the event that any of the primary treatment equipment is out of service, potentially hydrocarbon contaminated water may be directed to a diversion tank which will have the capacity to store wastewater from the plant.
3.3.1 CPI System
The wastewater is pumped continuously at a controlled rate by the CPI feed pump to the CPI unit. Reduced flow velocity in the CPI allows free oil and low specific gravity particles to rise to the top and heavier solid particles to settle on the bottom of the separator. Free oil and other floating hydrocarbons overflow by gravity into the CPI oil reservoir. The recovered oil is then pumped to the Waste Oil Tank. The settled solids in the CPI are pumped to the Sludge Holding Tank to allow further solids concentration. The concentrated solids are then hauled out by a vacuum truck for disposal offsite.
3.3.2 DAF System
Effluent from the CPI is routed to the DAF Surge Tank where the effluent is then pumped continuously at a controlled rate feeding to the DAF system. Polymer is added at the DAF inlet feed line to aid in breaking emulsions and to facilitate flocculation of the colloidal suspended solids and oils. A portion of the DAF clarified effluent is pressurised with air in the DAF saturation tank. The dissolved air flotation system blends recycled effluent saturated with air, at elevated pressure, with the incoming coagulated wastewater to release microscopic air bubbles that cling to the oils and solid particles forcing them to float to the top of the flotation cell where they are skimmed off into the DAF Float Reservoir. The removed float is then pumped to the Waste Oil Tank. Heavier solids settled in bottom of the DAF will be transferred to the Sludge Holding Tank. The DAF treated effluent flows by gravity into the DAF effluent tank where it is then pumped to the DAF Effluent filter for further effluent polishing.
3.3.3 DAF Effluent Filters
Effluent from the DAF Effluent Tank is pumped through downflow multimedia filters to remove remaining trace oil and grease and suspended solids. The multimedia filter has anthracite in the top layer, sand in the middle, and garnet gravel on the bottom. When impurities collect in or on the media bed, a backwash cycle cleans the filter. The filtered water is then sent to the final treated effluent sump for discharge to the permitted outfall discharge diffuser along with the other treated wastewater streams.
Wheatstone Project Document No: WS0-0000-HES-PLN-CVX-000-00102-000 Permanent Onshore Facilities Waste Water Discharge Plan Revision: 4 Revision Date: 27/11/2015
© Chevron Australia Pty Ltd Company Confidential Page 28
Printed Date: 4/4/2016 Uncontrolled when printed
4.0 ENVIRONMENTAL QUALITY MANAGEMENT FRAMEWORK
The aim of the EQMF is to describe the foundation for the development of the management and monitoring framework. The EQMF includes three objectives:
1. Describe the baseline water quality for the Project area
2. Identify the EQCs that should be achieved to maintain the EQOs
3. Identify the Low, Moderate and High LEP Zones and prescribed EQCs for each Zone and map these areas.
4.1 Baseline Water Quality Conditions
The area around Onslow is characterised by relatively turbid inshore/nearshore waters that are subject to moderate tidal and residual flows and episodic highly turbid runoff from the Ashburton River. The mid and outer waters are generally clear (Chevron Australia 2010). The coastal waters generally have very low levels of anthropogenic contamination (Wenziker et al. 2006) and are oligotrophic with low availability of nitrogen limiting rates of primary production. However on occasions, blooms of nitrogen-fixing microbes such as Trichodesmium or mangrove tidal mud-flat cyanobacteria may contribute significant amounts of nutrients into the marine environment. High spatial and seasonal variability has previously been recorded in nutrient and chlorophyll-a concentrations within the Dampier Archipelago (Pearce et al. 2003; Buchan et al. 2003). Baseline nitrogen and phosphorus concentrations in the marine waters around Onslow occasionally exceeded the default trigger values of 100 µgN/l (total nitrogen [Ntot]) and 15 µgP/L (total phosphorus [Ptot]) specified by ANZECC & ARMCANZ (2000), with concentrations approaching 350 µgN/L and 18 µgP/L, respectively (Chevron Australia 2010).
Baseline water quality values were collected as part of the EIS/ERMP for the Project. Two separate monitoring programs provide relevant baseline values to characterise the existing environment:
1. A regional monitoring program of water quality area near the proposed turning basins along the proposed trunkline adjacent to Bessieres and Thevenard Island (MScience 2011), and
2. A localised monitoring program focussed on the water quality around the proposed nearshore outfall approximately 0.5-1.0 km from the shoreline (MScience 2013).
The second monitoring program was originally intended to provide information on the composition of intake water for use in the design and construction of the desalination plant. However, the four short vessel-borne synoptic sampling campaigns also provide baseline water quality values for the nearshore region for use in assessing impacts from the outfall. The baseline water quality conditions and results of these monitoring programs, in line with Schedule 2 (MS 873), are presented in terms of the concentrations of:
1. Toxicants
2. Other Physical and Chemical Parameters
3. Biological Parameters.
4.1.1 Toxicants
The results of the monitoring programs provide baseline concentrations and indicate the ANZECC & ARMCANZ (2000) guideline values for toxicants generally provide appropriate concentrations for protecting the environmental values of the nearshore waters around Onslow and managing the impacts of the onshore facilities waste water discharges. Baseline

Wheatstone Project Document No: WS0-0000-HES-PLN-CVX-000-00102-000 Permanent Onshore Facilities Waste Water Discharge Plan Revision: 4 Revision Date: 27/11/2015
© Chevron Australia Pty Ltd Company Confidential Page 29
Printed Date: 4/4/2016 Uncontrolled when printed
concentrations occasionally exceeded the lower reporting limit although these concentrations typically varied between surveys.
The baseline 95th percentile of concentrations of cadmium, chromium, manganese, molybdenum, nickel, vanadium and mercury were always below the ANZECC & ARMCANZ (2000) guideline values for 99 or 90% species protection. The concentrations of arsenic, copper, lead, aluminium and selenium were always below the reporting limit and/or the ANZECC & ARMCANZ (2000) guideline values for 99 or 90% species protection. However the reporting limit for these elements was, at times, above the guideline or low reliability guideline value. There are no published guideline values for iron. The 95th percentile concentration of zinc exceeded the guideline value for 99% species protection (High LEP) but not 90% species protection (Moderate LEP). A high reliability guideline concentration for aluminium is not available; the low reliability ANZECC & ARMCANZ (2000) guideline value is 0.5 µg/L and was exceeded. This published guideline for aluminium has been calculated from limited data and is provided as an indicative value only.
Oil and grease, Total Solvent Extractable (O&G TSE) was rarely detectable and median concentration was usually below 5 mg/L. The test for chlorine was not sensitive enough to detect if chlorine concentrations approached the low reliability ANZECC &ARMCANZ (2000) guideline value. Under such circumstances a more sensitive method combined with comparison to Reference sites should be used for monitoring purposes. Overall, the results indicate that the water quality guidelines for 99% and 90% species protection for all elements, except possibly zinc, are suitable for application to the water around Onslow.
4.1.2 Other Physical and Chemical Parameters
The results of the monitoring programs indicate that the water quality guidelines recommended in ANZECC & ARMCANZ (2000) for other physical and chemical parameters are generally not suitable for protecting the environmental values of the nearshore waters around Onslow and managing the impacts of the onshore facilities waste water discharges. Schedule 2 of MS 873 (EPA 2011), requires triggers to be based on the 95th percentile of these natural background values for the Moderate LEP and the 80th percentiles of natural background values for the High LEP.
For nitrogen based water quality parameters (Ntot, nitrates + nitrites) baseline median concentrations in MScience (2013) were above the recommended guidelines specified in ANZECC & ARMCANZ (2000). The median concentrations for both Ptot and filterable reactive phosphorus in MScience (2013) were below the ANZECC & ARMCANZ (2000) default guideline values although total phosphorus did, at times, exceed the guideline value. Further from shore, N totals exceeded guideline values, but nitrate + nitrite, ammonia, Ptot and filterable reactive phosphorus did not (MScience 2011). Monitoring undertaken in the specific area of interest therefore provide the most appropriate values for calculation of locally relevant triggers for nitrogen and phosphorus compounds as recommended by ANZECC and ARMCANZ (2000).
Most of the remaining Other Chemical and Physical parameters—particularly turbidity, temperature and salinity (shown as Total Dissolved Solids [TDS])— exhibit high natural variability. This has been well demonstrated in the regional monitoring of these parameters over a 2 year baseline period (SKM 2013). It is therefore recommended these triggers be based on a combination of long term statistics and real-time comparative Reference sites (see Figure 7.1 for location of proposed Reference sites). Only by using this combination will the program be able to address both the relationship between natural and discharge parameters together with an assessment of potential impact.

Wheatstone Project Document No: WS0-0000-HES-PLN-CVX-000-00102-000 Permanent Onshore Facilities Waste Water Discharge Plan Revision: 4 Revision Date: 27/11/2015
© Chevron Australia Pty Ltd Company Confidential Page 30
Printed Date: 4/4/2016 Uncontrolled when printed
4.1.3 Biological Parameters
The ANZECC & ARMCANZ (2000) guideline values for biological parameters generally provide appropriate concentrations for protecting the environmental values of the nearshore waters around Onslow and managing the impacts of the onshore facilities waste water discharges. Total coliforms measured were well below guideline values for recreational water use.
4.2 Environmental Values, Quality Objectives and Criteria
The State Water Quality Management Strategy (Department of Environment 2004) provides for the establishment of Environmental Values (EVs) and EQOs in relation to the effects of waste inputs and pollution on marine water quality. Under this framework, EQOs are established in relation to prescribed EVs (Table 4.1). So as to enable determination of the achievement of each EQO, a set of EQC are required which measure chemical and physical water quality parameters relevant for baseline water quality conditions at the location of the discharge and the constituents contained within the waste stream. The rationale for determining relevant EQCs for the achievement of each EQO is provided in Figure 4.1.
Table 4.1: Environmental Values and Environmental Quality Objectives for Onshore Facilities Waste Water Discharges
# Environmental Value Environmental Quality Objectives EQO
1. Ecosystem Health Maintenance of Ecosystem Integrity EQO1
2. Fishing Maintenance of seafood for human consumption EQO2
3. Aquaculture Maintenance of aquaculture EQO3
4. Industrial Water Supply Maintenance of industrial water supply EQO4(1)
5. Recreation
Maintenance of primary contact recreation EQO5
Maintenance of secondary contact recreation EQO6
6. Aesthetic Maintenance of aesthetic values EQO7
7. Cultural and spiritual values Maintenance of cultural and spiritual values. EQO2, EQO5, EQO7
Notes:
1. The guidelines provide no specific guidance for industrial water use
A comprehensive set of EQCs have yet to be formally established by the OEPA for Pilbara coastal waters. There have been recent studies on background water and sediment quality in the region as summarised above (Wenziker et al. 2006) and these have been used together with the guidelines, approaches from ANZECC & ARMCANZ (2000) and consultation with the DER, to develop EQCs relevant for the expected constituents of the discharge from Permanent Onshore Facilities waste water treatment processes. Toxicant EQCs are

Wheatstone Project Document No: WS0-0000-HES-PLN-CVX-000-00102-000 Permanent Onshore Facilities Waste Water Discharge Plan Revision: 4 Revision Date: 27/11/2015
© Chevron Australia Pty Ltd Company Confidential Page 31
Printed Date: 4/4/2016 Uncontrolled when printed
provided in Table 4.2, other physical and chemical parameter EQCs are shown in Table 4.3 and biological parameter EQCs are presented in Table 4.4. The microbiological EQCs in Table 4.4 have been developed using ANZECC & ARMCANZ (2000) and OEPA Report 20 (EPA 2005) for Cockburn Sound.
Figure 4.1 Approach to determine suitable EQCs to meet all EQOs
Ecosystem Social(EQOs 2,3,5,6&7)
Industrial Cultural
EQO at risk?Relevant stressors• Toxicants• Chemical &
Physical Parameters
• Biological Parameters
EQO at risk?Relevant stressors• Toxicants• Chemical and
Physical Parameters
• Biological Parameters
EQO at risk?Relevant stressors• Toxicants• Chemical and
Physical Parameters
EQO at risk?Relevant stressors• Toxicants• Biological
Parameters
Yes Yes No No
Develop EQC
Validate/Revise EQC
EQC Met?
Rationale• Toxicant,
Chemical and Physical Parameters will apply Ecosystem EQCs because they are more stringent
• Biological parameters will apply Social EQCs because they are more stringent
Rationale• No significant
recirculation of the outfall plume into the seawater intake was observed in model simulations
• Chevron are the only operators. Any changes caused by Chevron will only affect their operations
Rationale• Any cultural
and/or spiritual values associated with marine waters will be protected by maintaining the EQC for Ecosystem or Social values
Monitor against EQCs
EQO not at riskNo EQC developed
EQO not at riskNo EQC developed
EQO not at riskNo EQC developed
No No
Yes No
Implement Management to restore EQO
EQC Validated?
Yes No
Wheatstone Project Document No: WS0-0000-HES-PLN-CVX-000-00102-000 Permanent Onshore Facilities Waste Water Discharge Plan Revision: 4 Revision Date: 27/11/2015
© Chevron Australia Pty Ltd Company Confidential Page 32
Printed Date: 4/4/2016 Uncontrolled when printed
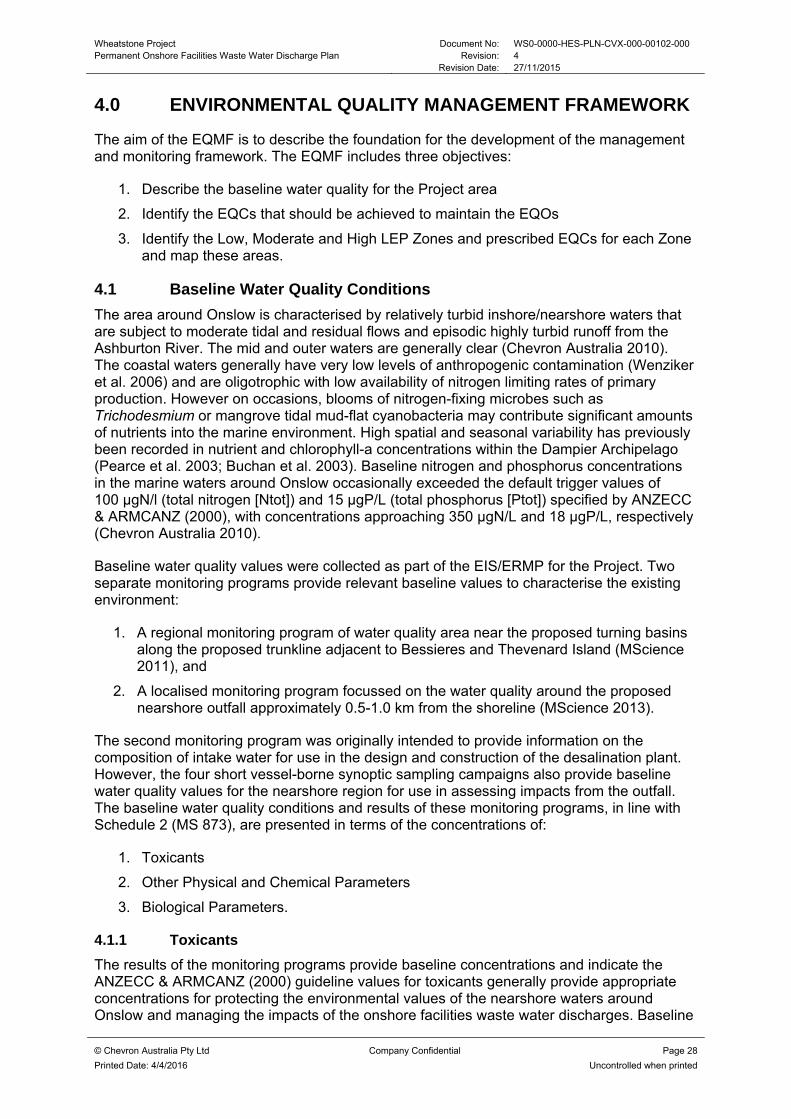
Table 4.2: EQCs for Toxicants in Onshore Facilities Waste Water Discharges
Environmental Quality Criteria Baseline EQO1(1) EQO2, EQO3 EQO5, EQO6, EQO7
Constituents of the Discharge
Units LOW MODERATE HIGH
Chlorine(2) μg/L < 100 N/A N/A N/A <3 N/A
Aluminium(4) μg/L < 10 N/A N/A 0.5(5) <10 200
Cadmium μg/L < 0.6 36 14 0.7 <0.5-5 5
Chromium (III/VI) μg/L < 1 91/85 49/20 7.7 / 0.14 <20 50
Copper μg/L < 1 8 3 0.3 <5 1000
Lead μg/L < 10 12 6.6 2.2 <1-7 50
Mercury μg/L 0.04 1.4 0.7 0.1 <1 1
Nickel μg/L < 7 560 200 7 <100 100
Silver μg/L < 10 2.6 1.8 0.8 <3 50
Vanadium μg/L 1.10 280 160 50 <100 N/A
Zinc μg/L 3.9 43 23 7 <5 5000
Total Recoverable Hydrocarbons (TRH)(6,7) μg/L N/A N/A
C6-C9: 25
C10-C14: 25
C15-C28: 100
C29-C36: 100
TRH: 250
C6-C9: 25
C10-C14: 25
C15-C28: 100
C29-C36: 100
TRH: 250
N/A No visible surface slicks/ detectable
odour
Mixed toxicants Sum of concentration of (up to 5) primary toxicants < sum of relevant trigger values
Notes:
1. All EQC concentrations except TRH have been sourced from Australian and New Zealand Guidelines for Fresh and Marine Water Quality (ANZECC & ARMCANZ 2000). ANZECC & ARMCANZ do not have a TRH guideline so EQC is based on the LOR and comparison with reference sites
2. Derived from Australian and New Zealand Guidelines for Fresh and Marine Water Quality (ANZECC & ARMCANZ 2000). For the practical test, values below the Limits of Reporting (LOR) (20 µg/L) will be assigned a value of 10 µg/L and exceedence of the EQC will occur if Impact median exceeds 10 µg/L and also exceeds the Reference 80th percentile.
3. Refers to the values returned from sampling at Reference sites which will be established as part of the EQVRP (Section 7.5.2).

Wheatstone Project Document No: WS0-0000-HES-PLN-CVX-000-00102-000 Permanent Onshore Facilities Waste Water Discharge Plan Revision: 4 Revision Date: 27/11/2015
© Chevron Australia Pty Ltd Company Confidential Page 33
Printed Date: 4/4/2016 Uncontrolled when printed
4. For the practical test, values below the LOR (5 µg/L) will be assigned a value of 2.5 µg/L and exceedence of the EQC will occur if Impact median exceeds 2.5 µg/L and also exceeds the Reference 80th percentile.
5. Low reliability guideline value
6. Where not indicated otherwise, the Impact 95th percentile will be tested against the EQC.
7. For the practical test, values below the LOR will be assigned a value of 125 µg/L and exceedence of the EQC will occur if Impact median exceeds 125 µg/L and also exceeds the Reference 95th percentile.

Wheatstone Project Document No: WS0-0000-HES-PLN-CVX-000-00102-000 Permanent Onshore Facilities Waste Water Discharge Plan Revision: 4 Revision Date: 27/11/2015
© Chevron Australia Pty Ltd Company Confidential Page 34
Printed Date: 4/4/2016 Uncontrolled when printed
Table 4.3: EQCs for Other Chemical and Physical Parameters of Onshore Facilities Waste Water Discharges
Environmental Quality Criteria Baseline EQO1 EQO2, EQO3 EQO5, EQO6, EQO7
Constituents of the Discharge
Units MODERATE HIGH
TDS(1) mg/L 37 700 39 500
and Impact median < Reference 95th percentile
39 400
and Impact median < Reference 80th percentile
33 000-37 000 N/A
Ntot(1) μg/L 147 260 225 N/A N/A
NOx (nitrate + nitrite)(1) μg/L 9.3 16.6 12.0
<100,000 + <100
N/A
Ptot(1) μg/L 5.0 17.5 7.5 N/A N/A
Filterable reactive phosphorus(1)
μg/L 2.0 4.0 3.3 N/A N/A
Temperature –winter(3) °C 21.1 26.2 23.4 <2⁰C change over 1 hour
15-35⁰C Temperature–summer(3)
°C 28.2 30.2 29.4
Chlorophyll-a μg/L 0.6 1.45 1.45 N/A N/A
pH(2) 8.1 Impact median between Reference
5th and 95th percentiles Impact median between Reference
20th and 80th percentiles 6.0-9.0
5.0-9.0
6.5-8.5
Turbidity(2) NTU/SSC 5.5 N/A N/A <10
Clarity should not reduce by >20%
Hue should not change by >10 (Munsell Scale)
Reflectance should not change by >50%
200 mm diameter black disk should be visible
>1.6 m
Dissolved Oxygen (DO)(4)
% Saturation
N/A 60% (spot sample ≤ 0.5 m from
seafloor) 60% (spot sample ≤ 0.5 m from
seafloor) N/A >80%
N/A 80% (6 week median at any site
≤0.5 m from seafloor) 90% (6 week median at any site
≤0.5 m from seafloor) N/A N/A
Notes:
(1) Specified concentrations derived from the Project baseline studies (MScience 2013), percentile comparisons based on guidelines (ANZECC & ARMCANZ 2000).

Wheatstone Project Document No: WS0-0000-HES-PLN-CVX-000-00102-000 Permanent Onshore Facilities Waste Water Discharge Plan Revision: 4 Revision Date: 27/11/2015
© Chevron Australia Pty Ltd Company Confidential Page 35
Printed Date: 4/4/2016 Uncontrolled when printed
(2) For the practical test, EQC will be based on reference comparison only due to high spatial and temporal variability in regional studies.
(3) Derived from the Project in situ water quality baseline monitoring (SKM 2012) – 80th and 95th percentile of background.
(4) Ministerial Statement 873 (EPA 2011).
(5) 1.4 μg/L based on Table 3.3.4 from ANZECC and ARMCANZ (2000) for tropical Australia for slightly disturbed waters. Note for marine inshore areas a range between 0.7 - 1.4 μg/L is quoted, qualified with the statement that the upper limit is appropriate for application to the North-west Shelf of WA.

Wheatstone Project Document No: WS0-0000-HES-PLN-CVX-000-00102-000 Permanent Onshore Facilities Waste Water Discharge Plan Revision: 4 Revision Date: 27/11/2015
© Chevron Australia Pty Ltd Company Confidential Page 36
Printed Date: 4/4/2016 Uncontrolled when printed
Table 4.4: EQCs for Biological Parameters in Onshore Facilities Waste Water Discharges
Environmental Quality Criteria
Baseline EQO2(1) EQO5 EQO6 EQO7 Constituents of the
Discharge Units
Microbiological (Guideline) – based on the median bacterial content in marine waters unless stated otherwise
Faecal Coliform Org / 100 ml 2.25 14(3) 150(6) 1000(6) N/A
Enterococci Org /100 ml N/A (2) Impact 95th percentile < 200
Impact 95th percentile <2000
N/A
Algal Biotoxins Org /100 ml N/A
Any samples should not
exceed:
Alexandrium = 10
Dinophysis = 50
Prorocentrum = 50
Gymnodinium = 100
Karenia = 100
Pseudonitzchia = 500(4)
1 500 000 N/A
Microbiological (Standard) based on the median bacterial content in marine waters unless stated otherwise
Faecal Coliform Org /100 ml N/A 70(3) 80% of samples per
survey < 600(6) 80% of samples per
survey < 4000(6) N/A
Enterococci Org /100 ml N/A (2) Impact 95th percentile< 5000 N/A
Algal Biotoxins Org /100 ml N/A N/A No confirmed incidents of skin or eye irritation caused by toxic algae
N/A
Nuisance Organisms Cells/mL N/A
Macrophytes, phytoplankton scums, filamentous algal mats, blue-green algae, sewage fungus and leeches should not be present in excessive amounts (5). Direct contact activities should be discouraged if algal levels of 15 000-20 000 are present, depending on algal species.
Notes:
(1) There are no EQCs outlined in ANZECC & ARMCANZ (2000) to meet EQO3. Criteria for achievement of EQO2 will be sufficient for achievement of both EQO3 & EQO4.
(2) There are no specific EQCs for enterococci in ANZECC & ARMCANZ (2000) that relate to EQO2 (seafood consumption), they are included as part of the faecal coliform group.

Wheatstone Project Document No: WS0-0000-HES-PLN-CVX-000-00102-000 Permanent Onshore Facilities Waste Water Discharge Plan Revision: 4 Revision Date: 27/11/2015
© Chevron Australia Pty Ltd Company Confidential Page 37
Printed Date: 4/4/2016 Uncontrolled when printed
(3) As per EPA 2005, Environmental Quality Criteria Reference Document for Cockburn Sound (2003 - 2004), the median concentration should not exceed the EQC value, with no more than 10% of the samples exceeding 21 Org/100 ml and 85 Org/100ml.for the Guideline and Standard, respectively.
(4) Pseudonitzchia EQC is 500 org/100ml when Pseudonitzchia >50% total phytoplankton & 5000 org/100ml when Pseudonitzchia <50% total phytoplankton.
(5) Monitored through nutrient concentrations necessary to limit excessive plant growth, which are represented by the moderate and high EQOs for nutrients and Chlorophyll-a concentrations in Table 4.3.
(6) Derivation of EQG and EQS in order to meet the EQO5 and EQO6, primary and secondary contact, were based on ANZECC and ARMCANZ (2000), Section 5.2.3.1 Microbiological Characteristics. Minimum of five surveys taken at regular intervals not exceeding one month

Wheatstone Project Document No: WS0-0000-HES-PLN-CVX-000-00102-000 Permanent Onshore Facilities Waste Water Discharge Plan Revision: 4 Revision Date: 27/11/2015
© Chevron Australia Pty Ltd Company Confidential Page 38
Printed Date: 4/4/2016 Uncontrolled when printed
4.3 Levels of Ecological Protection (LEP)
The LEP for onshore facilities waste water discharges are prescribed under Schedule 2 (MS 873) and are set out in Table 4.5. The LEPs have been used to derive a set of appropriate trigger values for each identified EQC in accordance with the recommended approaches in ANZECC & ARMCANZ (2000). The Low LEP Zone allows for large changes in the quality of water, sediment and biota and occurs within a maximum radius of 70 m around the diffuser or discharge. The Moderate LEP Zone allows moderate changes in the quality of water, sediment and biota within 250 m from the ship turning basin and nearshore marine facilities. The High LEP Zone allows small changes in the quality of water, sediment and biota in marine waters beyond the Low and Moderate LEPs. A map of the Low, Moderate and High LEP Zones where the EQOs will be achieved is presented with the outfall diffuser and nearshore infrastructure in Figure 4.2. The LEP established in Schedule 2 (MS 873) will apply to operations under Typical Conditions only. Continuous and composite sample monitoring undertaken during commissioning and through operations will be used to confirm achievement of the validated EQCs which will be determined through the monitoring described in Section 7.0.
During construction, the area around the near-shore marine facilities has been designated as closed waters. This area is defined by a boundary that is at a minimum 1.5 km from the near-shore marine facilities. Once operational, a security regulated water-side exclusion zone will be prescribed for the port facilities, to be defined by a nominal distance around the near-shore marine facilities. Access within this zone will be controlled and social values will not be permitted. This zone is indicatively shown in Table 4.2 using a nominal 200 m distance around the marine facilities; noting this zone is yet to be defined and is likely to be in excess of 200 m based on exclusion zones prescribed for other ports in the State.

Wheatstone Project Document No: WS0-0000-HES-PLN-CVX-000-00102-000 Permanent Onshore Facilities Waste Water Discharge Plan Revision: 4 Revision Date: 27/11/2015
© Chevron Australia Pty Ltd Company Confidential Page 39
Printed Date: 4/4/2016 Uncontrolled when printed
Table 4.5: Levels of Ecological Protection for Onshore Facilities Waste Water Discharges
Level of Ecological Protection
Extent Intent
Environmental Quality Criteria
Toxicants(1) Physical Dissolved Oxygen
LOW within a maximum radius of 70 m around the diffuser or
discharge
allow for large changes in the quality of water, sediment and biota
80% species protection guideline trigger values
N/A N/A
MODERATE within 250 m from the ship
turning basin
allow moderate changes in the quality of water, sediment and biota
90% species protection guideline trigger values(2)
95th percentile of natural background measurements
median DO concentration (3)
> 80% saturation at any site, but never below 60%
saturation.
HIGH marine waters beyond the Low and Moderate LEPs
to allow small changes in the quality of water, sediment and biota
99% species protection guideline trigger values(2)
(except cobalt: 95% species protection guideline)
80th percentile of natural background measurements
median DO concentration (3)
> 90% saturation at any site, but never below 60%
saturation.
Notes:
(1) Applies for potentially bio-accumulating toxicants in water: For discharges that contain a mixture of toxicants, the sum of the concentrations of the primary toxicants (up to five toxicants) should not exceed the sum of the relevant trigger values.
(2) For sediments the ISQG-low applies.
(3) For waters monitored within 0.5 m of the seafloor, over a period of up to six weeks.
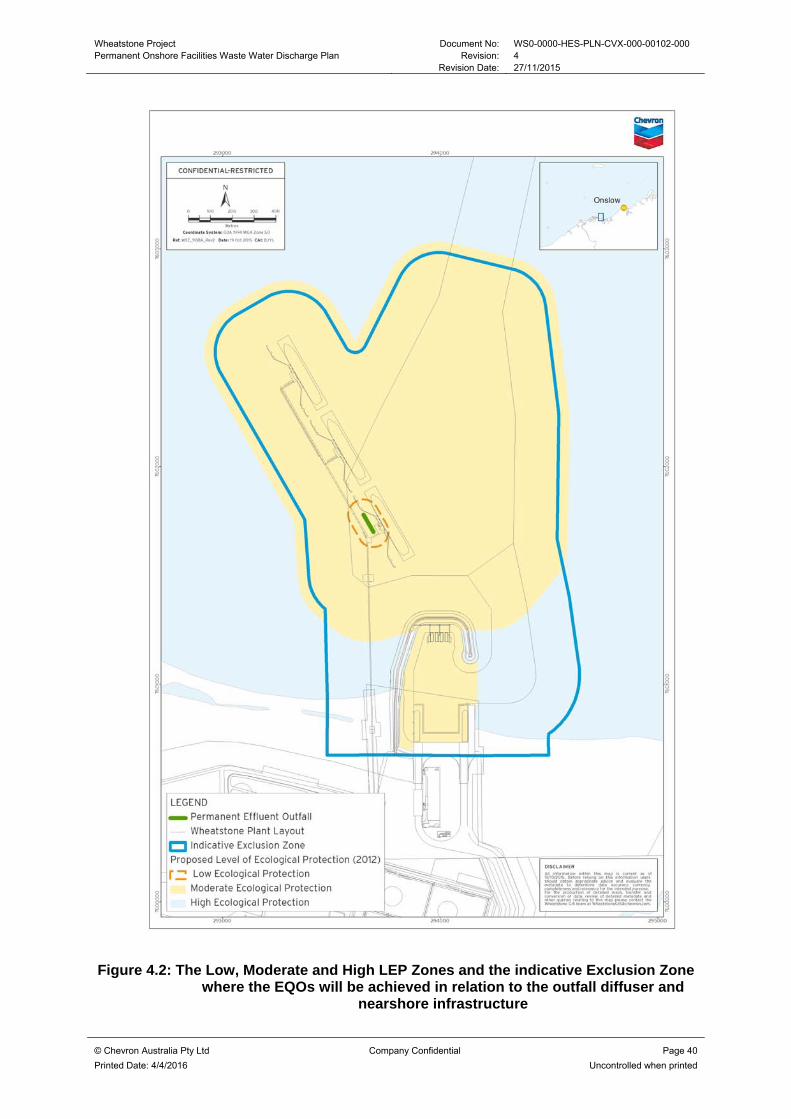
Wheatstone Project Document No: WS0-0000-HES-PLN-CVX-000-00102-000 Permanent Onshore Facilities Waste Water Discharge Plan Revision: 4 Revision Date: 27/11/2015
© Chevron Australia Pty Ltd Company Confidential Page 40
Printed Date: 4/4/2016 Uncontrolled when printed
Figure 4.2: The Low, Moderate and High LEP Zones and the indicative Exclusion Zone where the EQOs will be achieved in relation to the outfall diffuser and
nearshore infrastructure

Wheatstone Project Document No: WS0-0000-HES-PLN-CVX-000-00102-000 Permanent Onshore Facilities Waste Water Discharge Plan Revision: 4 Revision Date: 27/11/2015
© Chevron Australia Pty Ltd Company Confidential Page 41
Printed Date: 4/4/2016 Uncontrolled when printed
5.0 NUMERICAL MODELLING OF EFFLUENT TOXICITY, DILUTION RATES AND RECIRCULATION
The objectives of the numerical modelling study (DHI 2013, DHI 2015) were to:
Characterise the water quality conditions at the location of the discharge outfall and the constituents contained within the waste stream
Evaluate the potential toxicity of the permanent onshore facilities waste water discharge under typical conditions
Predict the number of dilutions necessary to achieve the Moderate and High EQCs at the outer boundaries of the Low and Moderate LEP Zones
Predict the magnitude of recirculation between the outfall and the seawater intake. The water quality conditions at the location of the discharge outfall and constituents in the waste stream are dependent on the background water quality (raw intake seawater) described in Section 4.1 and the effectiveness of the Permanent Onshore Treatment facilities equipment and process as described in Sections 2.0 and 3.0. The prediction of the toxicity and dilution rates of the waste water discharge into the environment is based on concentrations for the effluent constituents at the outer boundaries of the Low and Moderate LEP zones as outlined in the applicable conditions of MS 873, so they can be compared against the Moderate and High EQCs. Recirculation at the seawater intake is assessed relative to design ranges for each constituent.
5.1 Model Approach and Methodology
The following four identified effluent constituents were tracked in the model:
TDS
Ntot
Ptot
O&G TSE. Other components expected to be ecologically insignificant will be validated during implementation of EQVRP (e.g., metals, chlorine, microbes). As described in Section 2.0, the effluent originating from the desalination plant, sewage treatment plants and stormwater runoff will be released into a sump which is in turn emptied into the feeder pipe to the outfall diffuser. As the sump will be emptied using one single-speed pump, the discharge rate used in this study is constant and based on the maximum designed flow rate of 674 m3/hr. However, the frequency and duration of the discharge will vary, as will the composition of the effluent.
The character of the individual discharge is variable over the year, due to both the differing character of the intake seawater, as well as the differing requirements and operations of the facility by season. Further, the character of the effluent will vary depending upon whether the desalination plant is online, offline, or transitioning between those two states. Finally, the “receiving water” ambient environmental conditions vary throughout the year. After taking the above mentioned variables into consideration, two representative sequences of discharge and seawater intake cycling were identified, each of one month duration. The behaviour of the plume and subsequent modelled concentrations of constituents at the outer boundaries of the Low and Moderate LEP zones are based on representative seasonal environmental conditions (e.g. meteorological and oceanographic)established from historic and baseline records for the Project area. A summary of the source of these historic and baseline records are provided in Table 5.1.

Wheatstone Project Document No: WS0-0000-HES-PLN-CVX-000-00102-000 Permanent Onshore Facilities Waste Water Discharge Plan Revision: 4 Revision Date: 27/11/2015
© Chevron Australia Pty Ltd Company Confidential Page 42
Printed Date: 4/4/2016 Uncontrolled when printed
Table 5.1: Summary of the source of historic and baseline meteorological and oceanographic conditions for the model
Condition Description
Current An AWAC (acoustic Doppler current profiler) deployed intermittently over the last several years at the site.
Bathymetry Bathymetry was compiled from a combination of different data sets including local surveys, digital nautical charts accessed via DHI’s software MIKE C-MAP and satellite images. In addition, bathymetry was later updated with LADS (LIDAR) data. The different input data sets were analysed and combined by referencing all to mean sea level (MSL) based on several tidal stations in the area.
Wind Wind data is available both as time- and space-varying modelled wind fields from the Australian Bureau of Meteorology’s numerical weather prediction system MesoLAPS (Mesoscale Limited Area Prediction System) and as time-varying measured winds at Onslow Met Station1 installed at the Onslow Salt Jetty
Tide Water depth determined from the pressure sensors on bottom mounted AWAC current meters deployed at the Jetty location. The depth was related to tidal heights in Australian Height Datum (AHD)
Salinity and Temperature
Ambient salinity and temperature are based on the recorded values from baseline water quality surveys between 2009 and 2010 and temperature was also measured by the AWAC on site
The essential approach of the study was to numerically model the dilution of the outfall discharge as a function of time and space, and determine the concentrations of each relevant constituent at the boundaries of the Low and Moderate LEPs and at the intake location.
Due to the dynamic tidal nature of the ambient environmental conditions in the area, the behaviour of the discharge plume cannot be treated using a stationary approach. For example, under some conditions the discharge plume may “pool” near the outfall around slack tide, creating a slug of water with high effluent concentrations; these "pools" are then advected away as the current increases. Alternatively, the plume may return to the outfall location as the tide reverses, producing elevated concentrations due to re-entrainment and recirculation. Such dynamic behaviour requires time-varying dynamic modelling. Furthermore, because the discharge buoyancy can be either positively or negatively buoyant, and because the degree of vertical mixing is important to the dilution, three-dimensional modelling is necessary.
The hydrodynamics determining the behaviour of a discharge plume has different regimes. Close to the outfall the behaviour is determined by the properties of the effluent and the outfall design, termed the near-field region. As distance from the diffuser increases, the initial

Wheatstone Project Document No: WS0-0000-HES-PLN-CVX-000-00102-000 Permanent Onshore Facilities Waste Water Discharge Plan Revision: 4 Revision Date: 27/11/2015
© Chevron Australia Pty Ltd Company Confidential Page 43
Printed Date: 4/4/2016 Uncontrolled when printed
properties of the discharge become relatively less significant compared to the influence of the ambient conditions in determining the plume behaviour, termed the far-field region. As the outer boundaries of the Low and Moderate LEP zones are located relatively close to the outfall, both hydrodynamic regions must be considered in a single integrated approach. In the present study a state-of-the-art coupled approach was used where the near-field model (CORMIX) has been dynamically linked to a far-field model (MIKE3) to capture the important unsteady behaviour of the plume.
The CORMIX model was run for a three-dimensional matrix of parameters that envelop the conditions at the site of the diffuser and the effluent stream. These parameters included the ambient current speed, the ambient current direction and the effluent density. The ambient current and ambient direction portions of the three-dimensional parameter space have been determined based upon a year-long time series of current velocities predicted at the permanent outfall diffuser location by the well-calibrated regional MIKE21 NHD model established in DHI (2010). Based upon initial prospective testing, near-field plume characterization in CORMIX was performed for a total of 34 combinations of current speeds and directions, as well as for the seven effluent densities, yielding a total of 238 combinations (7 x 34 = 238).
After near-field plume characterization in CORMIX, the high-resolution three-dimensional far-field model was implemented in the numerical modelling software MIKE3 FM. The model domain extends roughly 10 km west, 35 km east and about 15 km offshore of the onshore permanent waste water treatment and discharge facilities. The horizontal resolution varies from 10 m at the diffuser location to nominally 500 m near the outer boundaries. The computational model mesh showing the resolution used in the area surrounding the planned infrastructure and the diffuser site is presented in Figure 5.1. Note that quadratic (square) mesh elements have been used around the diffuser site to ensure that all elements containing near-/far-field coupling points have the same volume.
The vertical resolution of the model was defined by ten discrete (sigma-) layers of equidistant thickness with the lowest layer occurring at the bottom depth and the thickness of the layers adjusted according to the local total water depth. At the proposed diffuser location this yields a vertical resolution varying between approximately 1.40 m at low spring tide and 1.57 m at high spring tide. The layers were numbered from one to ten, from bottom to surface.
The model (MIKE3) was forced by local wind observations and output from an existing validated two-dimensional model which was used extensively for dredge spoil modelling. The MIKE3 model was compared to in-situ measurements and shown to agree with measurements to a level acceptable according to standard international guidelines.
To account for the detailed dynamics close to the outfall, an advanced one-way coupling was implemented, where the near-field model (CORMIX) was used to simulate the time-varying dynamics of the outfall plume in the near-field region for a large set of ambient conditions. These results were then used to determine the time-varying sources in the MIKE3 model. The resulting model system included both baroclinic effects due to the density of the outfall discharge, the effect of the proposed diffuser in the near-field, the timing of the discharge releases via the outfall and the complex dynamics of tidal reversals, pooling and re-entrainment.

Wheatstone Project Document No: WS0-0000-HES-PLN-CVX-000-00102-000 Permanent Onshore Facilities Waste Water Discharge Plan Revision: 4 Revision Date: 27/11/2015
© Chevron Australia Pty Ltd Company Confidential Page 44
Printed Date: 4/4/2016 Uncontrolled when printed
Note: Coordinates are the MGA-50 projection using the GDA94 datum.
Figure 5.1: Full horizontal model mesh (top) and detail of the area surrounding the planned infrastructure and the diffuser site (bottom)

Wheatstone Project Document No: WS0-0000-HES-PLN-CVX-000-00102-000 Permanent Onshore Facilities Waste Water Discharge Plan Revision: 4 Revision Date: 27/11/2015
© Chevron Australia Pty Ltd Company Confidential Page 45
Printed Date: 4/4/2016 Uncontrolled when printed
Simulations were performed for ambient and discharge conditions which were considered representative of summer and winter environmental conditions and of typical operating conditions at the permanent waste water treatment and discharge facilities when the LNG berth is unoccupied. Two one-month periods, spanning Oct–Nov 2011 and Aug 2010, were identified which together characterize typical metocean forcing conditions during summer and winter, respectively. Each of the seasonal simulations featured the above seasonally characteristic metocean forcing, in combination with seasonally dependent ambient background concentrations and a highly detailed sequence of discharge events which are considered representative of the actual operations of the permanent waste water treatment and discharge facilities.
The location of the permanent onshore facilities waste water outfall and the outer boundaries of the Low and Moderate LEP zones are shown in Figure 4.2. The Moderate LEP EQCs are imposed on the outer boundary of Low LEP zone while the High LEP EQCs are imposed on the outer boundary of the Moderate LEP zone (Figure 4.2). A number of specific outputs were included in the model configuration and then post-processed to determine achievement of the EQCs at the outer boundaries of the Low and Moderate LEP zones. The time series of constituent concentrations from different locations and depths at the outfall and along the LEP boundaries were post-processed as follows:
For each physical constituent (TDS, Ntot, and Ptot) the temporal median was calculated for the respective time series, producing a median value for each constituent at each extraction point on the outer boundary of the Low and Moderate LEP zones. The same procedure was repeated for O&G TSE using the 95th percentile.
For all constituents the spatial maximum (in the horizontal and the vertical) of the percentile values along the outer boundaries of the Low and Moderate LEP zones were calculated, yielding one value for each constituent: the spatial maximum of the temporal percentile (effectively a median).
5.2 Effluent Characterisation
As discussed in Section 2.4.1, the combined effluent flow rates are comprised of treated effluent from sanitary treatment plants, treated stormwater runoff, reject from desalination plant and IAH blowdowns from GTGs and compressor driver turbines. Table 5.2 through Table 5.4 show effluent discharge concentrations along with predicted concentrations of modelled constituents for two simulations representing typical summer and winter ambient and operating conditions. Ambient raw seawater intake values for modelling are based on concentrations recorded during October-November and August for summer and winter, respectively. These values do not directly represent baseline concentrations shown in Section 4.1 derived from complete summer and winter datasets. Variations in raw seawater intake values that can be applied to the model will be accounted for during validation and monitoring. Detailed results of the modelling study along with the required number of dilutions to meet the EQO are provided in Appendix C.
The results provided in Table 5.2 through Table 5.4 and Appendix C indicates that the relevant EQCs for modelled constituents are achieved during typical conditions at both the outer boundaries of the Low and Moderate LEP zones (See Section 5.3).

Wheatstone Project Document No: WS0-0000-HES-PLN-CVX-000-00102-000 Permanent Onshore Facilities Waste Water Discharge Plan Revision: 4 Revision Date: 27/11/2015
© Chevron Australia Pty Ltd Company Confidential Page 46
Printed Date: 4/4/2016 Uncontrolled when printed
Table 5.2: Effluent Characterisation for Permanent Onshore Facilities Waste Water Discharges - Toxicants
Stream Description Raw Seawater Intake Combined Wastewater Effluent Concentration(1)(2)
EQCs and Predicted Concentrations
Low LEP Moderate LEP
Parameters Units Summer Winter Min(1)(2) Max(1)(2) EQC(7) Max 95th percentile Conc.(4)(5)
EQC(8) Max 95th percentile Conc.(4)(5)
Chlorine(3)(6) μg/L <100 <100 6.82 28.97 Impact median < Reference 95th percentile
NM 3 & Impact median < Reference 80th percentile
NM
Aluminium(3) μg/L <10 <10 4.23 13.88 Impact median < Reference 95th percentile
NM 0.5 & Impact median < Reference 80th percentile
NM
Cadmium(3) μg/L <0.6 <0.6 0.25 0.83 14 NM 0.7 NM
Chromium (III/VI)(3) μg/L <1.0 <1.0 0.42 1.39 49/20 NM 7.7 / 0.14 NM
Copper(3) μg/L <1.0 <1.0 0.42 1.39 3 NM 0.3 NM
Lead(3) μg/L <10 <10 4.23 13.88 6.6 NM 2.2 NM
Mercury μg/L 0.05 0.05 0.02 0.07 0.7 NM 0.1 NM
Nickel(3) μg/L <7.0 <4.0 2.42 8.74 200 NM 7.0 NM
Silver(3) μg/L <10.0 <10.0 4.23 13.89 1.8 NM 0.8 NM
Vanadium μg/L 1.9 0.5 0.30 2.37 160 NM 50 NM
Zinc μg/L 2.9 8.8 1.23 12.22 23 NM 7.0 NM
Wheatstone Project Document No: WS0-0000-HES-PLN-CVX-000-00102-000 Permanent Onshore Facilities Waste Water Discharge Plan Revision: 4 Revision Date: 27/11/2015
© Chevron Australia Pty Ltd Company Confidential Page 47
Printed Date: 4/4/2016 Uncontrolled when printed
Stream Description Raw Seawater Intake Combined Wastewater Effluent Concentration(1)(2)
EQCs and Predicted Concentrations
Low LEP Moderate LEP
Parameters Units Summer Winter Min(1)(2) Max(1)(2) EQC(7) Max 95th percentile Conc.(4)(5)
EQC(8) Max 95th percentile Conc.(4)(5)
O&G TSE(3) µg/L 0 0 110 1330 C6-C9: 25
C10-C14: 25
C15-C28: 100
C29-C36: 100
TRH: 250
& Impact median
TRH(6)<80th percentile of Reference
sites
6 C6-C9: 25
C10-C14: 25
C15-C28: 100
C29-C36: 100
TRH: 250
& Impact median
TRH(6)<95th percentile of Reference
sites
1
Notes:
(1) Table 5.2 represents the range of values across both winter and summer ambient and operating conditions. The character of the effluent will vary depending upon intake seawater concentrations and the expected operation for the desalination system. Therefore, minimum and maximum effluent flow rates and corresponding concentrations to the collecting sump are shown. The actual pumping rate (instantaneous flow rate) during discharge to the outfall will be constant at 674 m3/hr. The wastewater parameter concentrations for instantaneous flow rate remain same.
(2) Combined wastewater effluent flow rates are comprised of the following: Reject from SWRO Unit (0 - 183 m3/hr), Media filter backwash and UF Reject (50 m3/hr), IAH blowdown from compressors (24.2 m3/hr), GTG IAH blowdown (8.1 m3/hr), Treated effluent from LNG plant (1 m3/hr), Treated effluent from CV WWTP (8.2 m3/hr), and Treated effluent from LNG WWTP (1.2 m3/hr).
(3) Toxicant concentration falls below detectable limit. For calculation purposes, detectable limit was used to calculate concentration limits in subsequent streams. Only values above background are reported in this table.
(4) The spatial maximum of 95th percentile concentration of the modeled constituent is shown. Please see Appendix C for detail modeling results.
(5) NM: Not Modeled. Although not directly modeled, present modeling results indicate that the effluent concentration for these constituents is not expected to exceed the EQCs at the Low or Moderate LEP boundaries.
(6) TRH will be used as the constituent to determine the EQCs based on a direct assumed relationship with O&G TSE.
(7) Measured at the outer boundary of the Low LEP Zone
(8) Measured at the outer boundary of the Moderate LEP Zone.

Wheatstone Project Document No: WS0-0000-HES-PLN-CVX-000-00102-000 Permanent Onshore Facilities Waste Water Discharge Plan Revision: 4 Revision Date: 27/11/2015
© Chevron Australia Pty Ltd Company Confidential Page 48
Printed Date: 4/4/2016 Uncontrolled when printed
Table 5.3: Effluent Characterisation for Permanent Onshore Facilities Waste Water Discharges – Other Physical and Chemical Parameters
Stream Description Raw Sea Water Intake Combined Wastewater Effluent Concentration(1)(2)
EQCs and Predicted Concentrations
Low LEP Moderate LEP
Parameters Units Summer Winter Min(1)(2) Max(1)(2) EQC(6) Max Median Conc.
(3)(4)
EQC(7) Max Median Conc.
(3)(4)
TDS mg/L 34 900 39 500 15 885 57 436 39 500 and Impact median < Refer-ence 95th percent-ile
34 903 39 400
and Impact median < Refer-ence 95th percent-ile
34 901
Ntot μg/L 237.7 158.0 1490 5165 260 241 225 240(9)
NOx(2) (nitrate + nitrite) μg/L 6.7 9.1 2.83 3616 16.6 NM 12.0 NM
Ptot μg/L 7.5 5.0 146 582 17.5 7.6 7.5 7.5(9)
Filterable reactive phosphorus
μg/L 1.0 3.2 0.42 523.8 4.0 NM 3.3
NM
Temperature °C 29.9 22.8 24.8 31.9 30.2 NM 29.4 NM
Chlorophyll-a μg/L 0.7 0.5 N/A N/A 1.4 NM 1.4 NM
pH 8.1 8.2 6-8 6-9 median between Reference 5th and 95th percentiles
NM median between Reference 20th and 80th percentiles
NM
Turbidity NTU 5.4 1.6 9.16 49.53 Median < Reference 95th
percentile
NM Median< Reference 80th
percentile
NM
DO Saturation(5) % 95 95 84 93 60% (spot sample
≤ 0.5 m from seafloor)
NM 60% (spot sample ≤ 0.5 m from seafloor)
NM
80% (6wk median at any site ≤ 0.5 m from seafloor)
90% (6wk median at any site ≤ 0.5 m from seafloor)

Wheatstone Project Document No: WS0-0000-HES-PLN-CVX-000-00102-000 Permanent Onshore Facilities Waste Water Discharge Plan Revision: 4 Revision Date: 27/11/2015
© Chevron Australia Pty Ltd Company Confidential Page 49
Printed Date: 4/4/2016 Uncontrolled when printed
Notes:
(1) Table 5.3 represents the range of values across both winter and summer ambient and operating conditions. The character of the effluent will vary depending upon intake seawater concentrations and the operation of the desalination system. Therefore, minimum and maximum effluent flow rates and corresponding concentrations to the collecting sump are shown. The actual pumping rate (instantaneous flow rate) during discharge to the outfall will be constant at 674 m3/hr. The wastewater parameter concentrations for instantaneous flow rate remain same.
(2) Combined wastewater effluent average daily flow rates are comprised of the following: Reject from SWRO Unit (0 - 183 m3/hr), Media filter backwash and UF Reject (50 m3/hr), IAH blowdown from compressors (24.2 m3/hr), GTG IAH blowdown (8.1 m3/hr), Treated effluent from LNG Plant (1 m3/hr), Treated effluent from CV WWTP (8.2 m3/hr), and Treated effluent from LNG WWTP (1.2 m3/hr)
(3) The highest temporal median concentration of the modeled constituent is shown. Please see Appendix C for detail modeling results.
(4) NM: Not Modeled. Although not directly modeled, present modeling results indicate that the effluent concentration for these constituents is not expected to exceed the EQCs at the Low or Moderate LEP boundaries.
(5) DO saturation percentages in raw seawater, SWRO reject, Q-3605 sump water, IAH blowdowns, and T-2903 treated effluent is estimated. Percent saturation DO values for plant and village STPs are calculated based on process design requirement of 2 mg/L DO
(6) To be measured at the outer boundary of the Low LEP Zone.
(7) To be measured at the outer boundary of the Moderate LEP Zone.
(8) 1.4 μg/L based on Table 3.3.4 from ANZECC and ARMCANZ (2000) for tropical Australia for slightly disturbed waters. Note for marine inshore areas a range between 0.7 - 1.4 μg/L is quoted, qualified with the statement that the upper limit is appropriate for application to the North-west Shelf of WA.
(9) The constituent meets the target concentration in both the Moderate LEP and High LEP zones, with the exception of situations where the background concentration is already at or above the target concentration.
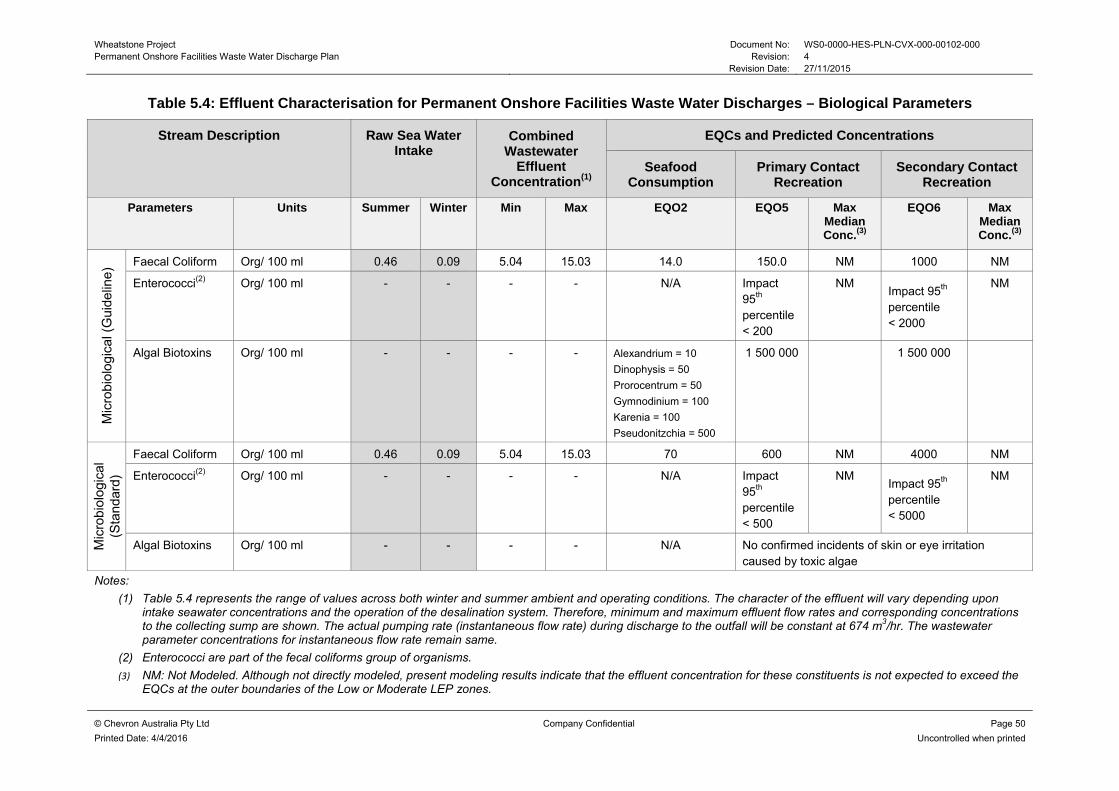
Wheatstone Project Document No: WS0-0000-HES-PLN-CVX-000-00102-000 Permanent Onshore Facilities Waste Water Discharge Plan Revision: 4 Revision Date: 27/11/2015
© Chevron Australia Pty Ltd Company Confidential Page 50
Printed Date: 4/4/2016 Uncontrolled when printed
Table 5.4: Effluent Characterisation for Permanent Onshore Facilities Waste Water Discharges – Biological Parameters
Stream Description Raw Sea Water Intake
Combined Wastewater
Effluent Concentration(1)
EQCs and Predicted Concentrations
Seafood Consumption
Primary Contact Recreation
Secondary Contact Recreation
Parameters Units Summer Winter Min Max EQO2 EQO5 Max Median Conc.(3)
EQO6 Max Median Conc.(3)
Mic
robi
olog
ical
(G
uide
line)
Faecal Coliform Org/ 100 ml 0.46 0.09 5.04 15.03 14.0 150.0 NM 1000 NM
Enterococci(2) Org/ 100 ml - - - - N/A Impact 95th percentile < 200
NM Impact 95th percentile < 2000
NM
Algal Biotoxins Org/ 100 ml - - - - Alexandrium = 10
Dinophysis = 50
Prorocentrum = 50
Gymnodinium = 100
Karenia = 100
Pseudonitzchia = 500
1 500 000 1 500 000
Mic
robi
olog
ical
(S
tand
ard)
Faecal Coliform Org/ 100 ml 0.46 0.09 5.04 15.03 70 600 NM 4000 NM
Enterococci(2) Org/ 100 ml - - - - N/A Impact 95th percentile < 500
NM Impact 95th percentile < 5000
NM
Algal Biotoxins Org/ 100 ml - - - - N/A No confirmed incidents of skin or eye irritation caused by toxic algae
Notes:
(1) Table 5.4 represents the range of values across both winter and summer ambient and operating conditions. The character of the effluent will vary depending upon intake seawater concentrations and the operation of the desalination system. Therefore, minimum and maximum effluent flow rates and corresponding concentrations to the collecting sump are shown. The actual pumping rate (instantaneous flow rate) during discharge to the outfall will be constant at 674 m3/hr. The wastewater parameter concentrations for instantaneous flow rate remain same.
(2) Enterococci are part of the fecal coliforms group of organisms.
(3) NM: Not Modeled. Although not directly modeled, present modeling results indicate that the effluent concentration for these constituents is not expected to exceed the EQCs at the outer boundaries of the Low or Moderate LEP zones.

Wheatstone Project Document No: WS0-0000-HES-PLN-CVX-000-00102-000 Permanent Onshore Facilities Waste Water Discharge Plan Revision: 4 Revision Date: 27/11/2015
© Chevron Australia Pty Ltd Company Confidential Page 51
Printed Date: 4/4/2016 Uncontrolled when printed
5.3 Predicted Discharge Toxicity
Table 5.2 through Table 5.4 show the flow rates and the expected constituent concentrations of the combined effluent discharge for two simulations representing typical summer and winter ambient operating conditions, respectively. For each of the effluent constituents, the corresponding EQCs at the outer boundaries of the Low and Moderate LEP zones are also provided. Additionally, the tables provide the predicted concentrations at the outer boundaries of the Low and Moderate LEP zones of constituents. The modelling results show that all selected constituents meet their respective EQCs at the outer boundaries of the Low and Moderate LEP zones, with the exception of situations where the ambient concentration is already at or above stipulated target concentration. Otherwise the percentile values are close to the ambient values and below the EQCs.
The potential toxicity of the discharge waste water under Typical Conditions is determined by first comparing the predicted typical discharge constituents and the default EQCs derived from ANZECC and ARMCANZ (2000) to identify the constituents with highest predicted risk of exceeding the guideline EQCs (Table 5.5); and, then, using the procedures outlined in ANZECC and ARMCANZ (2000), calculating the theoretical toxicity of a simple mixture of the highest risk constituents identified during the first step. This is not a definitive result, since this method is only valid for simple mixtures with less than five constituent toxicants. Since the current discharge contains more than five toxicants, direct toxicity assessment of the WET is required, as proposed in Section 7.3.
Synergistic effects of certain chemicals contained in a mixture can have greater toxicity than the additive effects of each chemical’s individual toxicity while other mixtures may result in reduced toxicity (antagonism). Mixtures of metals can also cover the full range of antagonistic, additive or synergistic effects. The most common interaction for many chemicals is additivity, i.e. total toxicity is the sum of the toxicity of the individual components. Therefore the total toxicity of a mixture (TTM) for simple mixtures of less than five constituents is calculated as follows:
TTM = Σ (Ci/WQGi)
Ci is the concentration of constituent i; and
WQGi is the concentration of the guideline trigger value.
If TTM exceeds a value of one, the mixture has exceeded the water quality guideline. Further, if the aqueous concentration of any chemical in the mixture exceeds its guideline figure, then the water quality guidelines are automatically exceeded. To undertake the following calculation, the five toxicants from Table 5.5 with an elevated risk of exceeding the EQC guideline values at the outer boundaries of the Low and Moderate LEP zones can be chosen for inclusion in the mixture. TTM calculations for the outer boundaries of the Low and Moderate LEP zones show that the predicted toxicity for the discharge is low.
Two important points must be considered relating to these calculations. Firstly, the TTM method is less reliable for mixtures with greater than five constituents which is why the WET testing is proposed to be conducted. The results of the WET test will establish relative toxicity. Second, the method will not provide a meaningful result when nutrients, physical or biological parameters are included. For example, the physical measure of TDS, representing the hyper-saline nature of the discharge, is expected to have a potential for toxicity. Background TDS is 95% of EQC and, if added to nutrients such as total nitrogen (background 65% of EQC) then the TTM calculation would always exceed 1 TTM (TTM = 1.6) even without discharge. For this reason the five toxicants selected for the total toxicity calculation were a subset of those defined as toxicants by ANZECC and ARMCANZ (2000)

Wheatstone Project Document No: WS0-0000-HES-PLN-CVX-000-00102-000 Permanent Onshore Facilities Waste Water Discharge Plan Revision: 4 Revision Date: 27/11/2015
© Chevron Australia Pty Ltd Company Confidential Page 52
Printed Date: 4/4/2016 Uncontrolled when printed
(see Vol. 1, Chapter 3.4). The proposed tests of direct toxicity assessment of the whole effluent will capture the combined toxicity of elevated concentrations of physical, nutrient and toxicant parameters.
Table 5.5: Evaluation of Potential Toxicity of the Discharge using a Colour Coding Scheme - each constituent is categorised into Not Assessable (white), Low Risk
(green), Moderate Risk (yellow) and Elevated Risk (orange)
Note: See Key at bottom of Table for description of risk categories.
Stream Description
EQC Maximum Combined Wastewater Effluent
Concentration Low LEP Moderate LEP
Parameters Units
Chlorine μg/L impact median <
reference 95th percentile
3 & impact median < reference 80th
percentile 28.97
Aluminium μg/L impact median <
reference 95th percentile
0.5 & impact median < reference
80th percentile 13.88
Cadmium μg/L 14 0.7 0.83
Chromium (III/VI) μg/L 49/20 7.7/0.14 1.39
Copper μg/L 3 0.3 1.39
Lead μg/L 6.6 2.2 13.88
Mercury μg/L 0.7 0.1 0.07
Nickel μg/L 200 7 8.74
Silver μg/L 1.8 0.8 13.89
Vanadium μg/L 160 50 2.37
Zinc μg/L 23 7 12.22
O&G TSE(2) µg/L
250 and Impact median TRH <95th
percentile of Reference sites(2)
250 and Impact median TRH <80th
percentile of Reference sites(2)
1330
TDS mg/L 39 500 39 400 57 436
Ntot μg/L 260 225 5165
NOx(2) (nitrate + nitrite)
μg/L 17 12 3616
Ptot μg/L 17.5 7.5 582
Filterable reactive phosphorus
μg/L 4.0 3.3 523.8

Wheatstone Project Document No: WS0-0000-HES-PLN-CVX-000-00102-000 Permanent Onshore Facilities Waste Water Discharge Plan Revision: 4 Revision Date: 27/11/2015
© Chevron Australia Pty Ltd Company Confidential Page 53
Printed Date: 4/4/2016 Uncontrolled when printed
Stream Description
EQC Maximum Combined Wastewater Effluent
Concentration Low LEP Moderate LEP
Parameters Units
Temperature °C 30.2 & median < reference 95th
percentile
29.4 & median < reference 80th
percentile 31.9
Chlorophyll-a μg/L median between reference 5th and 95th percentiles
1.4* & Impact median < Reference
80th percentile N/A
pH median between reference 5th and 95th percentiles
median between reference 20th and
80th percentiles 6–9
Turbidity NTU median < reference
95th percentile median < reference
80th percentile 49.53
DO Saturation %
80% (6wk median at any site < 0.5 m
from seafloor)
90% (6wk median at any site ≤ 0.5 m from seafloor)
93%
Faecal coliforms(1) Orgs/ 100 mL 150 14 15
Key for Colour Coding of Max Combined Effluent Concentration (above):
Discharge wastewater effluent concentration Not assessable
Discharge wastewater effluent concentration < Moderate LEP Low Risk
Discharge wastewater effluent concentration > Moderate LEP and < Low LEP, EQC max. median concentration> Moderate LEP or Low LEP not specified
Moderate Risk
Discharge wastewater effluent concentration > Low LEP, Low EQC guideline value>Low LEP
Elevated Risk
Notes:
(1) EQC trigger values derived from EQO2 (seafood consumption) which has the most conservative guideline values.
(2) TRH will be used as the constituent to determine the EQCs based on a direct assumed relationship with O&G TSE.

Wheatstone Project Document No: WS0-0000-HES-PLN-CVX-000-00102-000 Permanent Onshore Facilities Waste Water Discharge Plan Revision: 4 Revision Date: 27/11/2015
© Chevron Australia Pty Ltd Company Confidential Page 54
Printed Date: 4/4/2016 Uncontrolled when printed
5.4 Predicted Dilution Rates
The number of dilutions necessary to meet the EQOs at the outer boundaries of the Low and Moderate LEP zones is presented in Table 5.6. The lowest dilutions achieved within the model for TDS/TN/TP/O&G from either the summer or winter simulations were 3895/6244/6480/289 dilutions respectively at the Low and >10 000/>10 000/>10 000/1457 dilutions respectively at the Moderate LEP boundaries. These dilution values have been used for assessment of concentration at the LEP boundaries. The lowest dilution factor was applied to relevant constituents as per Table 5.6. The constituent’s pH, turbidity and DO were excluded from Table 5.6 as the EQC compared against reference sites and no fixed value is provided for calculations.
All constituents are expected to meet the EQCs at the Moderate and High LEP boundaries with the exception of some dissolved metals where the EQC value is less than 50% of the reporting limit used as the raw seawater intake concentration (Chlorine, Aluminium, Chromium, Copper, Lead, and Silver). A value of 50% of the reporting limit was used to calculate statistics where all measured values during baseline were less than the reporting limit. For these constituents, ecological risk will be evaluated by comparison with the 80th or 95th percentile of reference sites and compliance cannot be determined a priori. For the remaining constituents, the required dilutions are well within the lowest effective dilutions achieved within the model. Modelling outputs for the constituents modelled are presented in Appendix C.
5.5 Recirculation
To evaluate the degree of recirculation to the seawater intake, the temporal mean, maximum and minimum predicted concentrations at the location and depth of the seawater intake was calculated for each constituent, and compared to the expected design concentrations. In addition, the percentage time that intake values were likely to be above design concentrations was calculated. No significant recirculation of the outfall plume into the seawater intake was observed in model simulations. Predicted concentrations at the intake show that both the mean and temporal maxima values are within the acceptable range at the intake, with the exception of Ntot for which the imposed summer ambient is above the design limits. In other cases, the temporal mean concentrations are close to ambient levels while temporal maxima are modestly elevated but well below the maximum of the design range. Modelling suggests the constituents released from the outfall of the onshore facilities will not exceed the EQCs predicted due to any seawater intake recirculation.

Wheatstone Project Document No: WS0-0000-HES-PLN-CVX-000-00102-000 Permanent Onshore Facilities Waste Water Discharge Plan Revision: 4 Revision Date: 27/11/2015
© Chevron Australia Pty Ltd Company Confidential Page 55
Printed Date: 4/4/2016 Uncontrolled when printed
Table 5.6: Calculation of the predicted dilutions of the discharge required to meet EQCs at the Low and Moderate LEP Boundaries
Toxicant Maximum Raw
Seawater Intake2
Combined effluent sump outlet
Low LEP Boundary Moderate LEP Boundary
Maximum Predicted Concentration
EQC Required Dilutions3
Effective Dilutions4
EQC Required Dilutions4
Effective Dilutions4
Chlorine (µg/l)1 50 29.0 N/A N/A 3895 3 0.455 >10 000
Aluminium (µg/l)1 5 13.9 N/A N/A 3895 0.5 -1.975 >10 000
Cadmium (µg/l) 0.3 0.8 14 0.04 3895 0.7 1.33 >10 000
Chromium (III/VI) (µg/l) 0.5 1.39 49/20 0.02/0.05 3895 7.7/0.14 0.12/ -2.545 >10 000
Copper (µg/l) 0.5 1.39 3 0.36 3895 0.3 -4.455 >10 000
Lead (µg/l) 5 13.88 6.6 5.55 3895 2.2 -3.175 >10 000
Mercury (µg/l) 0.04 0.07 0.7 0.05 3895 0.1 0.50 >10 000
Nickel (µg/l) 3.5 8.74 200 0.03 3895 7 1.5 >10 000
Silver (µg/l) 5 13.89 1.8 -2.785 3895 0.8 -2.125 >10 000
Vanadium (µg/l) 1.1 2.37 160 0.01 3895 50 0.03 >10 000
Zinc (µg/l) 3.9 12.22 23 0.44 3895 7 2.68 >10 000
TRH (mg/l) / O&G 0 1330 250 5.32 289 250 5.32 1457
TDS (mg/l) 37700 57436 39500 10.96 3895 39400 11.61 >10 000

Wheatstone Project Document No: WS0-0000-HES-PLN-CVX-000-00102-000 Permanent Onshore Facilities Waste Water Discharge Plan Revision: 4 Revision Date: 27/11/2015
© Chevron Australia Pty Ltd Company Confidential Page 56
Printed Date: 4/4/2016 Uncontrolled when printed
Toxicant Maximum Raw
Seawater Intake2
Combined effluent sump outlet
Low LEP Boundary Moderate LEP Boundary
Maximum Predicted Concentration
EQC Required Dilutions3
Effective Dilutions4
EQC Required Dilutions4
Effective Dilutions4
Ntot (µg/l) 147 5165 260 44.41 6244 225 64.33 >10 000
NOx(2) (nitrate + nitrite) (µg/l)
9.3 3616 17 468.40 6244 12 1335.81 >10 000
Ptot (µg/l) 5 582 17.5 46.16 6480 7.5 230.8 >10 000
Filterable reactive phosphorus (µg/l)
2 523.8 4.0 260.90 6480 3.3 401.38 >10 000
Temperature (⁰C) 28.2 31.9 30.2 1.85 3895 29.4 3.08 >10 000
Faecal coliforms (Org/100ml)
2.25 15 150 0.09 3895 14 1.09(6) >10 000
Notes
(1) Chlorine and aluminium are included for calculation at the moderate LEP boundary because of high concentrations in discharge. Not assessed for Low LEP boundary as no guideline value is available.
(2) Background concentrations shown in Table 4.2, Table 4.3 and Table 4.4. Using maximum background concentrations results in many constituents exceeding the EQC values and required dilutions are unable to be calculated. Where the ambient concentration is greater than the EQC, ecological risk is evaluated by comparison with the 80th percentile of reference sites. A value of 50% of the reporting limit was used to calculate statistics where all measured values were below the reporting limit.
(3) Required dilutions were calculated by dividing the difference between the maximum concentration at the combined effluent sump outlet and ambient seawater concentrations by the difference between the EQC and ambient seawater concentrations.
(4) The effective dilutions represent the lowest predicted dilutions derived from modelling data in Appendix C. The lowest dilution factor in Appendix C was applied to relevant constituents.
(5) The EQC for the Low or Moderate LEP boundary is less than 50% of the reporting limit. Therefore, the required dilutions are not able to be calculated. Where 50% of the reporting limit is greater than the EQC, ecological risk will be evaluated by comparison with the 80th percentile of reference sites and compliance cannot be determined a priori
(6) Only one dilution is required to meet the EQC for seafood consumption. The number of dilutions required is predicted to be achieved at the Low LEP boundary. This demonstrates social values (e.g. fishing, aquaculture, primary contact and secondary contact) for biological parameters are likely to be easily achieved at the Exclusion Zone boundary. Disinfection processes at the WWTP will eliminate the majority of faecal coliforms from the effluent prior to discharge

Wheatstone Project Document No: WS0-0000-HES-PLN-CVX-000-00102-000 Permanent Onshore Facilities Waste Water Discharge Plan Revision: 4 Revision Date: 2711/2015
© Chevron Australia Pty Ltd Company Confidential Page 57
Printed Date: 4/4/2016 Uncontrolled when printed
6.0 COMMISSIONING MANAGEMENT AND MONITORING
A commissioning period is required to enable the LNG WWTP and RO plant to be gradually brought “online”, and for the LNG WWTP operations to be optimised for all input streams (Section 7.4). The end of the commissioning period will be determined when engineering and monitoring confirm typical operating conditions have been achieved for all plant, facilities or associated infrastructure resulting in discharges via the permanent outfall outlined in this plan.
Management of the permanent onshore facilities waste water discharge during commissioning is focused on staggered start-up and optimization of the permanent waste water treatment and discharge facilities following construction. Relevant triggers and contingency management measures provide direction and recommendations for achieving EQCs and associated LEPs as described in Schedule 2 (MS 873).
6.1 Contingency Management during Commissioning
In the event that the treatment system and permanent waste water outfall are unable to achieve the commissioning triggers, optimization actions will be investigated. Optimization actions are intended to resolve potential long-term operational issues and are dependent upon which constituent(s) of the effluent stream is of concern and the risk that it poses. Therefore, the specific constituent would be evaluated to determine if either an operational or design solution is required, available and can practicably be implemented to resolve the abnormal conditions.
There are a number of potential operational and design solutions which may be used as contingency measures in response to trigger level exceedences during commissioning. In the event of an exceedence requiring intervention, the first step would likely be to determine if the cause of exceedence relates to design or operating parameters (such as the design model itself, monitoring errors, discharge rates/volumes, met-ocean conditions). Subject to the outcomes of the investigation a combination of the following optimization actions may be implemented:
Redirecting effluent to temporary storage on site for later recirculation/recycling through the WWTP(s).
Adjust the flow process and rates.
Change management and treatment of wastewater (e.g. isolating a particular stream of concern and other modifications to WWTP[s] operations depending on the test results).
Injecting seawater into the combined waste water equalisation tank to achieve further dilution.
Investigate available options for reuse.
Transport by a licensed controlled waste contractor for treatment off site at an approved licensed facility.
Conducting additional field studies or monitoring to investigate environmental factors which may have contributed to the exceedence.
Design contingency options may include any combination of the following:
Modify existing equipment/facilities (e.g. adding an additional treatment method[s] for the constituent[s] of concern, replacing a particular treatment[s] with other equivalent or improved techniques)
Addition of another processing train[s] to the WWTP[s] (subject to approval)
Modifying or relocating the diffuser (subject to approval under Condition 13.1).

Wheatstone Project Document No: WS0-0000-HES-PLN-CVX-000-00102-000 Permanent Onshore Facilities Waste Water Discharge Plan Revision: 4 Revision Date: 2711/2015
© Chevron Australia Pty Ltd Company Confidential Page 58
Printed Date: 4/4/2016 Uncontrolled when printed
Once design options are selected, an assessment of the risk that the commissioning triggers will not be met (including possible additional modelling) will be conducted to determine if proposed optimization actions are likely to correct the abnormal conditions. In the event that a design option is required to resolve the abnormal conditions relevant approval applications will be submitted as appropriate.
6.2 Triggers
Two levels of triggers are proposed for commissioning to enable staggered start-up and optimization of the permanent waste water treatment and discharge facilities. These trigger values are based on the modelling outputs and effluent characterisation described in Section 5.0. Inputs to the modelling results were based on maximum flow rate characteristics listed in Section 5.1 of this Plan. The commissioning trigger values described below are intended to initiate investigations and/or modifications for the purposes of system optimization, and are the designated values against which investigations and / or modifications will be initiated. Commissioning triggers are not intended for the purpose of Condition 13-11.ii, 13-11.v (MS 873) or Condition 44 (EPBC 2008/4469), relevant triggers for these are described in Section 7.2. Monitoring procedures to provide data for comparison against these triggers have been outlined in Section 6.3.
A description of relevant optimization actions associated with each level of the trigger values are provided in the following sections. Trigger values for Toxicants, Other Chemical and Physical Parameters, and Biological Parameters are listed in Table 6.1.
6.2.1 Level 1
Level 1 Trigger is based on a maximum instantaneous flow rate (pumping rate) during each discharge period of 674 m3/hr (Table 6.1).
The average equivalent incoming flow rate to the final effluent sump before discharge via permanent outfall is 276 m3/hr and 248 m3/hr for typical summer and winter operations, respectively. The waste water parameter concentrations for average and instantaneous flow rate remain the same. Readings in excess of the projected maximum flow rate specifications will trigger an investigation to determine the source of elevated readings, beginning with an evaluation of readings at the individual WWTPs and the seawater desalination system. Investigations may also require increased monitoring at the permanent waste water outfall. Should an unplanned flow rate exceedence be detected, the pumping operations will be reduced to a more acceptable level. Pumps, in-line analyser(s) and alarms, and effluent monitors shall be inspected and repaired/replaced as necessary.
6.2.2 Level 2
Level 2 Trigger is based on effluent monitoring concentrations (Table 6.1).
Level 2 trigger values are based on effluent monitoring concentrations set at 100% of maximum expected constituent concentration in the discharge (Table 6.1). If the trigger value is exceeded, corrective measures must be undertaken immediately. During the commissioning period, Level 2 trigger values are based on a sampling frequency of once per week (Table 6.2).
Corrective measures may include equipment maintenance, caustic solution dosing, possible recirculation/recycling of effluent through the WWTP for additional treatment, or redirecting of effluent to temporary storage on site for later recirculation/recycling as necessary.
Where a Level 2 trigger is reached, an investigation similar to the one for a Level 1 Trigger will be initiated to determine the cause of the trigger being reached including inspection and repair of in-line analyser(s) and alarms, and monitors as necessary. Monitored readings that

Wheatstone Project Document No: WS0-0000-HES-PLN-CVX-000-00102-000 Permanent Onshore Facilities Waste Water Discharge Plan Revision: 4 Revision Date: 2711/2015
© Chevron Australia Pty Ltd Company Confidential Page 59
Printed Date: 4/4/2016 Uncontrolled when printed
reach a Level 2 trigger may be recorded and reported internally as required for the purposes of system optimization and commissioning.
6.3 Monitoring
For commissioning effluent quality monitoring, discharge samples will be collected from the combined effluent sump outlet on a weekly basis, as detailed in Table 6.2. These samples will be assessed against the Trigger Levels 1 and 2 (Table 6.1).
Samples collected will be sent to a National Association of Testing Authorities (NATA) accredited laboratory for evaluation of relevant water quality parameters. Water samples may be taken for biological and chemical analyses in accordance with the laboratory specifications for the constituents. Readings for pH, salinity (by conductivity) and chlorine may be taken in situ, with salinity measurements converted to a TDS equivalent for comparison with EQCs.
The water quality constituents proposed for assessment of the treatment system and permanent waste water outfall are likely to include those provided in Table 6.2. Flow rates will also be confirmed in the commissioning monitoring and management program.

Wheatstone Project Document No: WS0-0000-HES-PLN-CVX-000-00102-000 Permanent Onshore Facilities Waste Water Discharge Plan Revision: 4 Revision Date: 27/11/2015
© Chevron Australia Pty Ltd Company Confidential Page 60
Printed Date: 4/4/2016 Uncontrolled when printed
Table 6.1: Triggers for Contingency Management of the Permanent Onshore Facilities Waste Water Discharges
Effluent Constituents
Units
Trigger Values
Level 1 Level 2(1) Level 3(2)
Summer Winter Low LEP Boundary Moderate LEP Boundary
Toxicants
Chlorine(3) μg/L
instantaneous flow rate during discharge
> 674m3/hr
15.00 28.97 Impact median > Reference 95th
percentile 3 & impact median > reference
80th percentile
Aluminium(4) μg/L 12.48 13.88
Impact median > Reference 95th percentile
0.5 & impact median > reference 80th percentile
Cadmium μg/L 0.75 0.83 14 0.7
Chromium (III/VI) μg/L 1.25 1.39 49/20 7.7/0.14
Copper μg/L 1.25 1.39 3 0.3
Lead μg/L 12.48 13.88 6.6 2.2
Mercury μg/L 0.06 0.07 0.7 0.1
Nickel μg/L 8,74 5.55 200 7
Silver μg/L 12.48 13.89 1.8 0.8
Vanadium μg/L 2.37 0.69 160 50
Zinc μg/L 3.62 12.22 23 7
Hydrocarbon (TRH)(5)
μg/L 1.33 0.42
C6-C9: 25
C10-C14: 25
C15-C28: 100
C29-C36: 100
TRH: 250
& Impact median > Reference 95th percentile
C6-C9: 25
C10-C14: 25
C15-C28: 100
C29-C36: 100
TRH: 250
& Impact median > Reference 80th percentile
Physical and Chemical Parameters
TDS mg/L instantaneous flow rate during
discharge > 674m3/hr 45 950 57 436
39,500 and Impact median > Reference 95th percentile
39 400
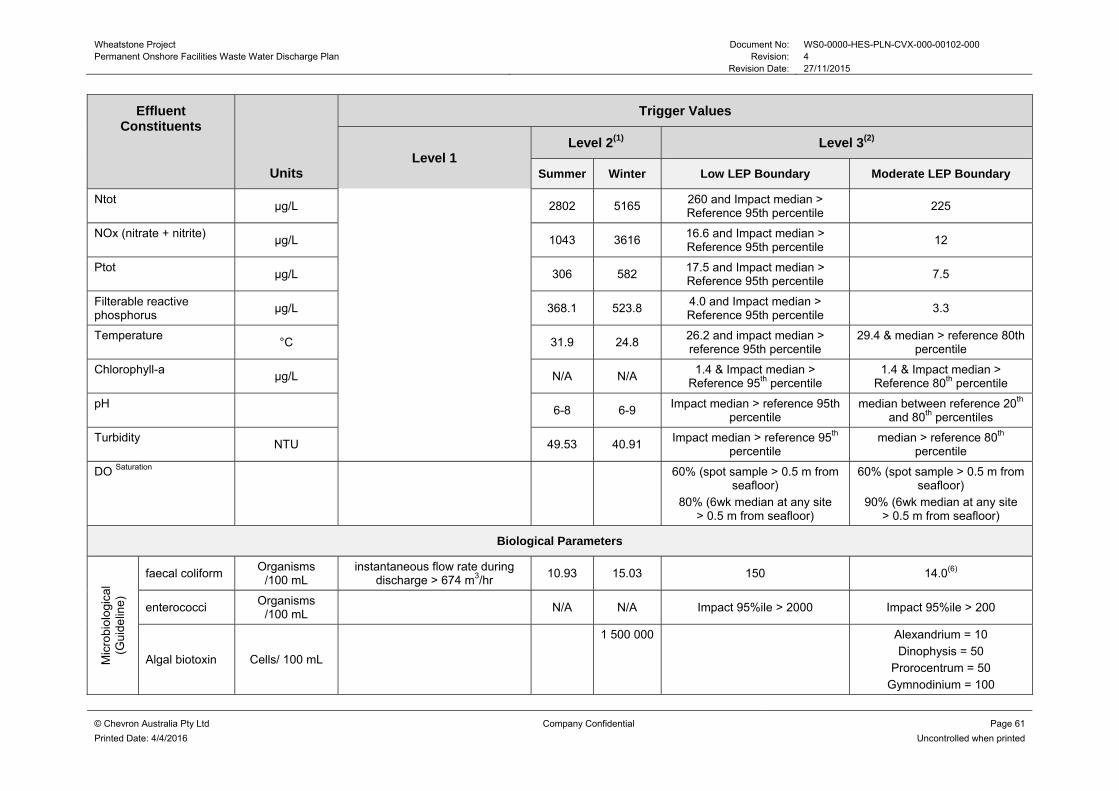
Wheatstone Project Document No: WS0-0000-HES-PLN-CVX-000-00102-000 Permanent Onshore Facilities Waste Water Discharge Plan Revision: 4 Revision Date: 27/11/2015
© Chevron Australia Pty Ltd Company Confidential Page 61
Printed Date: 4/4/2016 Uncontrolled when printed
Effluent Constituents
Units
Trigger Values
Level 1 Level 2(1) Level 3(2)
Summer Winter Low LEP Boundary Moderate LEP Boundary
Ntot μg/L 2802 5165
260 and Impact median > Reference 95th percentile
225
NOx (nitrate + nitrite) μg/L 1043 3616
16.6 and Impact median > Reference 95th percentile
12
Ptot μg/L 306 582
17.5 and Impact median > Reference 95th percentile
7.5
Filterable reactive phosphorus
μg/L 368.1 523.8 4.0 and Impact median > Reference 95th percentile
3.3
Temperature °C 31.9 24.8
26.2 and impact median > reference 95th percentile
29.4 & median > reference 80th percentile
Chlorophyll-a μg/L N/A N/A
1.4 & Impact median > Reference 95th percentile
1.4 & Impact median > Reference 80th percentile
pH 6-8 6-9
Impact median > reference 95th percentile
median between reference 20th and 80th percentiles
Turbidity NTU 49.53 40.91
Impact median > reference 95th percentile
median > reference 80th
percentile
DO Saturation
60% (spot sample > 0.5 m from seafloor)
80% (6wk median at any site > 0.5 m from seafloor)
60% (spot sample > 0.5 m from seafloor)
90% (6wk median at any site > 0.5 m from seafloor)
Biological Parameters
Mic
robi
olog
ical
(G
uide
line)
faecal coliform Organisms
/100 mL instantaneous flow rate during
discharge > 674 m3/hr 10.93 15.03 150 14.0(6)
enterococci Organisms
/100 mL N/A N/A Impact 95%ile > 2000 Impact 95%ile > 200
Algal biotoxin Cells/ 100 mL
1 500 000 Alexandrium = 10
Dinophysis = 50 Prorocentrum = 50
Gymnodinium = 100

Wheatstone Project Document No: WS0-0000-HES-PLN-CVX-000-00102-000 Permanent Onshore Facilities Waste Water Discharge Plan Revision: 4 Revision Date: 27/11/2015
© Chevron Australia Pty Ltd Company Confidential Page 62
Printed Date: 4/4/2016 Uncontrolled when printed
Effluent Constituents
Units
Trigger Values
Level 1 Level 2(1) Level 3(2)
Summer Winter Low LEP Boundary Moderate LEP Boundary
Karenia = 1000 Pseudonitzchia = 5000(7)
Mic
robi
olog
ical
(S
tand
ard)
faecal coliform Organisms /
100 mL 10.93 15.03 600 70(6)
enterococci Organisms
/100 mL N/A N/A Impact 95%ile > 5000 Impact 95%ile > 500
Algal biotoxin Cells/100 mL N/A N/A N/A N/A
(1) Level 2 Trigger values will be measured from samples taken at the combined effluent sump outlet.
(2) Level 3 Trigger values are based on the EQCs for the Low and Moderate Level of Ecological Protection (LEP) boundaries which were derived from a combination of ANZECC/ARMCANZ (2000), or Cockburn Sound EPA (2005) and/or are based on the percentile values detected at reference sites during the EQVRP only.
(3) For the practical test, values below the Limits of Reporting (LOR) (20 µg/L) will be assigned a value of 10 µg/L and exceedence of the EQC will occur if Impact median exceeds 10 µg/L and also exceeds the Reference 80th percentile.
(4) For the practical test, values below the LOR (5 µg/L) will be assigned a value of 2.5 µg/L and exceedence of the EQC will occur if Impact median exceeds 2.5 µg/L and also exceeds the Reference 80th percentile.
(5) For the practical test, values below the LOR will be assigned a value of 125 µg/L and exceedence of the EQC will occur if Impact median exceeds 125 µg/L and also exceeds the Reference 95th percentile
(6) As per EPA 2005, Environmental Quality Criteria Reference Document for Cockburn Sound (2003 - 2004), the median concentration should not exceed the EQC value, with no more than 10% of the samples exceeding 21 Org/100 ml and 85 Org/100ml.for the Guideline and Standard, respectively.
(7) Pseudonitzchia EQC is 500 org/100ml when Pseudonitzchia >50% total phytoplankton & 5000 org/100ml when Pseudonitzchia <50% total phytoplankton

Wheatstone Project Document No: WS0-0000-HES-PLN-CVX-000-00102-000 Permanent Onshore Facilities Waste Water Discharge Plan Revision: 4 Revision Date: 27/11/2015
© Chevron Australia Pty Ltd Company Confidential Page 63
Printed Date: 4/4/2016 Uncontrolled when printed
Table 6.2: Wastewater Discharge Monitoring Parameters, Locations and Frequency
Sampling Parameter Effluent Monitoring at the Combined Effluent Sump
Outlet
Marine Water Quality Monitoring at Impact (Low & Moderate LEP
boundaries) & Reference Sites2
Toxicants
Chlorine Continuous
Collect Samples3: Weekly
Aluminium
Composite sample1: Weekly
Cadmium
Chromium (III/VI)
Copper
Lead
Mercury
Nickel
Silver
Vanadium
Zinc
Hydrocarbon (TRH)
Physical and Chemical Parameters
TDS Continuous In-situ3: Weekly
Ntot
Composite sample1: Weekly Collect Samples3: Weekly NOx(nitrate + nitrite)
Ptot
Filterable reactive phosphorus
Salinity
Continuous In-situ3: Weekly
pH
Chlorophyll-a
Temperature
Turbidity
DOSaturation Composite sample1: Weekly
Flow rate and volume Continuous N/A
Biological Parameters
faecal coliform Composite sample1: Weekly Collect Samples3: Weekly
enterococci
(1) Multiple samples are combined, thoroughly homogenized and treated as a single sample (2) Marine Water Quality Monitoring at Impact and Reference sites will be required during the EQVRP only (3) Samples will be collected from eighteen sites, six sites on the Low LEP boundary, six sites on the
Moderate LEP boundary and six Reference sites. At each site, samples will be collected at 1 m from the surface and 0.5 m from the bottom of the seafloor.

Wheatstone Project Document No: WS0-0000-HES-PLN-CVX-000-00102-000 Permanent Onshore Facilities Waste Water Discharge Plan Revision: 4 Revision Date: 27/11/2015
© Chevron Australia Pty Ltd Company Confidential Page 64
Printed Date: 4/4/2016 Uncontrolled when printed
7.0 EFFLUENT QUALITY VALIDATION AND REPORTING PLAN
The purpose of the EQVRP is to assess modelling predictions against the EQCs set out in Section 4.0 and to achieve EQOs as outlined in MS 873. The EQVRP has been designed to deliver outcomes for the objectives outlined in Condition 13-12 of MS 873 and Condition 44a of EPBC 2008/4679 and will be undertaken once typical conditions have been achieved. The specific purposes of the EQVRP are:
Describe the Contingency Management during Validation (trigger levels, management and corrective actions)
Determine the actual toxicity of any discharge post commissioning and post operation of the outfall of the effluent
Characterise actual water quality of waste water discharged from the outfall (monitoring program)
Evaluate the modelling and predicted dilutions and assess if the prescribed LEPs are being achieved at the:
Low LEP boundary within 70 m from the diffuser and
Moderate LEP boundary (monitoring program)
Revise the set of EQCs (where relevant) and predict the number of dilutions required to achieve the relevant LEPs as outlined in Schedule 2 (MS 873) for the purpose of ongoing monitoring (water quality targets).
To deliver outcomes for the objectives of Condition 13-12, the EQVRP comprises the following four components:
1. WET testing for determining the actual toxicity of the discharge (Section 7.3)
2. Effluent validation monitoring to characterise the effluent from the combined wastewater treatment tank;
(Section7.4)
3. EQC validation monitoring at the outer boundaries of the Low and Moderate LEP zones to test water quality against the Low and Moderate LEPs, and
(Section 7.5)
4. Assessment to determine if EQCs and dilution requirements need to be revised at the prescribed Low and Moderate LEP boundaries based on the results of the EQVRP
(Section 7.6)
The EQVRP will be used to evaluate the predicted dilutions from the model and subsequently derive a revised set of relevant EQCs to be used for ongoing monitoring, if required.
7.1 Contingency Management during Validation
In the event that the treatment system and the permanent waste water outfall are unable to achieve the triggers, optimization actions will be investigated. Optimization actions are intended to resolve potential long-term operational issues and are dependent upon which constituent(s) of the effluent stream is of concern and the risk that it poses. Therefore, the specific constituent would be evaluated to determine if either an operational or design solution is required, available and can practicably be implemented to resolve the abnormal conditions.
There are a number of potential operational and design solutions which may be used as contingency measures in response to trigger level exceedences during Validation. In the event of an exceedence requiring intervention, the first step would likely be to determine if

Wheatstone Project Document No: WS0-0000-HES-PLN-CVX-000-00102-000 Permanent Onshore Facilities Waste Water Discharge Plan Revision: 4 Revision Date: 27/11/2015
© Chevron Australia Pty Ltd Company Confidential Page 65
Printed Date: 4/4/2016 Uncontrolled when printed
the cause of exceedence relates to design or operating parameters (such as the design model itself, monitoring errors, discharge rates/volumes, met-ocean conditions). Subject to the outcomes of the investigation a combination of the following optimization actions may be implemented:
Redirecting effluent to temporary storage on site for later recirculation/recycling through the WWTP(s).
Adjust the flow process and rates.
Change management and treatment of wastewater (e.g. isolating a particular stream of concern and other modifications to WWTP[s] operations depending on the test results).
Injecting seawater into the combined waste water equalisation tank to achieve further dilution.
Investigate available options for reuse.
Transport by a licensed controlled waste contractor for treatment off site at an approved licensed facility.
Conducting additional field studies or monitoring to investigate environmental factors which may have contributed to the exceedence.
Design contingency options may include any combination of the following:
Modify existing equipment/facilities (e.g. adding an additional treatment method[s] for the constituent[s] of concern, replacing a particular treatment[s] with other equivalent or improved techniques)
Addition of another processing train[s] to the WWTP[s] (subject to approval)
Modifying or relocating the diffuser (subject to approval under Condition 13.1). Once design options are selected, an assessment of the risk that the triggers will not be met (including possible additional modelling) will be conducted to determine if proposed optimization actions are likely to correct the abnormal conditions. In the event that a design option is required to resolve the abnormal conditions relevant approval applications will be submitted as appropriate.
7.2 Triggers
Three levels of triggers are proposed to enable optimization of the permanent waste water treatment and discharge facilities during validation. These trigger values are based on the modelling outputs and effluent characterisation described in Section 5.0. Inputs to the modelling results were based on maximum flow rate characteristics listed in Section 5.1 of this Plan. The trigger values described below are intended to initiate investigations and/or modifications for the purposes of system optimization, and are the designated values against which investigations and / or modifications will be initiated. Triggers are not intended for the purpose of Condition 13-11.ii, 13-11.v (MS 873) or Condition 44 (EPBC 2008/4469), relevant triggers for these are described in Section 8.2.
A description of relevant optimization actions associated with each level of the trigger values are provided in the following sections. Trigger values for Toxicants, Other Chemical and Physical Parameters, and Biological Parameters are listed in Table 6.1.
7.2.1 Level 1
Level 1 Trigger is based on a maximum instantaneous flow rate (pumping rate) during each discharge period of 674 m3/hr (Table 6.1).
Wheatstone Project Document No: WS0-0000-HES-PLN-CVX-000-00102-000 Permanent Onshore Facilities Waste Water Discharge Plan Revision: 4 Revision Date: 27/11/2015
© Chevron Australia Pty Ltd Company Confidential Page 66
Printed Date: 4/4/2016 Uncontrolled when printed
The average equivalent incoming flow rate to the final effluent sump before discharge via permanent outfall is 276 m3/hr and 248 m3/hr for typical summer and winter operations, respectively. The waste water parameter concentrations for average and instantaneous flow rate remain the same. Readings in excess of the projected maximum flow rate specifications will trigger an investigation to determine the source of elevated readings, beginning with an evaluation of readings at the individual WWTPs and the seawater desalination system. Investigations may also require increased monitoring at the permanent waste water outfall. Should an unplanned flow rate exceedence be detected, the pumping operations may be reduced to a more acceptable level. Pumps, in-line analyser(s) and alarms, and effluent monitors shall be inspected and repaired/replaced as necessary.
7.2.2 Level 2
Level 2 Trigger is based on effluent monitoring concentrations (Table 6.1).
Level 2 trigger values are based on effluent monitoring concentrations set at 100% of maximum expected constituent concentration in the discharge. If the trigger value is exceeded, corrective measures must be undertaken immediately. During the commissioning period, Level 2 trigger values are based on a sampling frequency of once per week (Table 6.2).
Corrective measures may include equipment maintenance, caustic solution dosing, possible recirculation/recycling of effluent through the WWTP for additional treatment, or redirecting of effluent to temporary storage on site for later recirculation/recycling as necessary.
Where Level 2 triggers values are reached, an investigation similar to the one for Level 1 Trigger Values will be initiated to determine the cause of the trigger being reached including inspection and repair of in-line analyser(s) and alarms, and monitors as necessary. Monitored readings that reach Level 2 trigger values may be recorded and reported internally as required for the purposes of system optimization and commissioning.
7.2.3 Level 3
Level 3 Trigger are defined as EQCs and are based on measurements of samples collected at the Low and Moderate LEP boundaries during validation (Table 6.1).
Measurements obtained during this period may be used to trigger optimization actions as described in Section 7.1. Weekly medians at the LEP boundary during validation monitoring may be used to assess achievement of Level 3 trigger values to determine the efficacy of optimization actions.
Should monitoring show that Level 3 trigger values are reached, contingency management measures taken may include equipment maintenance, overhaul, or full replacement; caustic solution dosing; possible recirculation/recycling of effluent through the WWTP for additional treatment, redirecting of effluent to temporary storage on site for later recirculation/recycling as necessary or for transport by a licensed controlled waste contractor for treatment offsite at an approved licensed facility.
Where Level 3 trigger values are reached, an investigation may be initiated to determine the cause including inspection and repair of in-line analyser(s) and alarms, and monitors as necessary. Monitored readings that reach Level 3 trigger values may be recorded and reported internally for the purposes of system optimization, and the findings of this monitoring will be provided to the CEO and the DER as soon as practicable, but within five working days of receiving the results, along with a description of the management actions to be taken to meet the required level of environmental quality.

Wheatstone Project Document No: WS0-0000-HES-PLN-CVX-000-00102-000 Permanent Onshore Facilities Waste Water Discharge Plan Revision: 4 Revision Date: 27/11/2015
© Chevron Australia Pty Ltd Company Confidential Page 67
Printed Date: 4/4/2016 Uncontrolled when printed
7.3 Whole Effluent Toxicity Testing
WET testing will be conducted on samples taken from the combined effluent sump outlet following commissioning to identify the potential toxicity of the anticipated effluent under typical conditions. WET testing involves exposing organisms to different concentrations of an effluent and measuring the effect on the test organisms’ ability to survive, grow and reproduce.
The WET testing program is anticipated to involve two processes, conducted by the same laboratory, namely:
1. Range finding test for toxicity: to determine if the effluent at the outfall is toxic and, if so, the concentration range relevant for further testing.
2. Definitive toxicity testing: to determine the 50%Effect Concentration (EC50), 50% Inhibitory Concentration (IC50), 50% Lethal Concentration (LC50) and No Observed Effect Concentration (NOEC) values for the effluent in a particular species.
Ecotoxicity tests commonly employ a preliminary range-finder test to determine what concentrations of effluent should be tested to provide precise toxicity data. On the basis of these results, definitive toxicity tests are conducted to derive EC50, IC50, LC50 and NOEC values for this effluent. Ecotoxicity data will also be used to determine the number of dilutions required to achieve the various LEP values prescribed by Condition 13-12(i) b (MS873).
WET testing will be undertaken on a minimum of five locally relevant species from four different taxonomic groups using the recommended protocols from ANZECC and ARMCANZ (2000). The waters of the Project area are at the Southern extent of Australia's western coastline considered to represent tropical waters as classified by IMCRA 4.0 (Commonwealth of Australia 2006). The biodiversity of species in this area is predominantly tropical but includes the northern extent of the ranges of some temperate species. WET testing is therefore proposed to include mostly tropical species from a range of trophic levels (primary producer, herbivore and carnivore), using chronic (predominantly) tests for toxicity.
Proposed tests and locally relevant species to be used in the WET testing for this Plan are listed below, although consideration of other species is possible if these species are unavailable:
1. 72-hr microalgal growth inhibition test: Nitzschia closterium. 2. 48-hour larval abnormality test: Saccostrea echinata. 3. 72-hr larval development test: Heliocidaris tuberculata. 4. 96-hr acute toxicity test: Penaeus monodon or Melita plumulosa. 5. 96-hr Fish Imbalance test: Lates calcarifer.
A description of each WET testing method listed above, along with the method that the testing is based on, are provided in Table 7.1. Samples for WET testing will be taken in accordance with the sampling kit and instructions provided by the laboratory undertaking the ecotoxicological analysis. Plastic sample bottles (2.5 L) will be filled from the combined effluent sump outlet once typical operating conditions for all plant, facilities or associated infrastructure resulting in discharges via the permanent outfall outlined in this plan has been reached. Samples will be chilled for two hours on ice to bring down to 4 °C, packed in eskies and air freighted to the laboratory.

Wheatstone Project Document No: WS0-0000-HES-PLN-CVX-000-00102-000 Permanent Onshore Facilities Waste Water Discharge Plan Revision: 4 Revision Date: 27/11/2015
© Chevron Australia Pty Ltd Company Confidential Page 68
Printed Date: 4/4/2016 Uncontrolled when printed
Table 7.1: WET Testing of Permanent Onshore Facilities Waste Water Discharges
Test / Species / Method Notes
1. 72-hour microalgal growth inhibition
Nitzschia closterium
USEPA Method 1003.0 and Stauber et al. 1996 for the National Pulp Mills Research Program
A 72-hr growth test using the diatom Nitzschia closterium is the most extensively-used marine microalgal test in Australia. N. closterium is both benthic and planktonic and is widely distributed in Australian coastal waters (Stauber 1995). This test utilises the temperate clone of alga which has been used in many ecotoxicological assessments and is sensitive to a wide range of metals, organic compounds and whole effluents (Florence and Stauber 1986; Hogan et al. 2005; Stauber 1995). The test is usually undertaken on a range of concentrations of a test material, e.g. 100, 50, 25, 12.5 and 6.3% effluent. At the end of the exposure period, algae cell yield is determined.
2. 48-hour larval abnormality
tropical milky oyster - Saccostrea echinata
Krassoi et al., 1996 for the National Pulp Mills Research Program
Many oyster species are of great ecological and economic importance in Australia, in particular Saccostrea commercialis (Smith et al. 2004), Pinctada maxima (Negri et al. 2004) and Saccostrea echinata (Peerzada and Dickinson 1989). In northern Australian waters the black-lip oyster (S. echinata) are wild-harvested from rocky foreshore areas (van Dam et al. 2008). The vast majority of toxicity studies using oysters have assessed larval development and/or growth, endpoints that have provided one of the most rapid and sensitive toxicity tests (Geffard et al. 2002). The current test examines the effect of a range of concentrations of test material on the larval development of S. echinata from zygote to D-veliger stage, reached 48 hours after fertilisation. The test follows the standard ASTM protocol developed for North American bivalve species.
3. 72-hour larval development
sea urchin Heliocidaris tuberculata
APHA Method 8810D and Simon and Laginestra 1997
The temperate sea urchin (Echinoderm), Heliocidaris tuberculata, has become widely used in toxicity testing programs in Australia, with fertilisation (1-hr exposure) and larval development (72-hr exposure) being the major endpoints measured (as summarised by Smith et al. 2004). Although a temperate species, H. tuberculata has been used in the past for toxicity testing in the Pilbara (API Management Pty Ltd 2010) and is sensitive to saline effluent, making it suitable for the current discharges. This test involves exposing developing urchin embryos to the test material for 72 hours. The test is usually undertaken on a range of concentrations of a test material, e.g. 100, 50, 25, 12.5 and 6.3% effluent. At the end of the exposure period, the numbers of normally developed and abnormal larvae are counted.
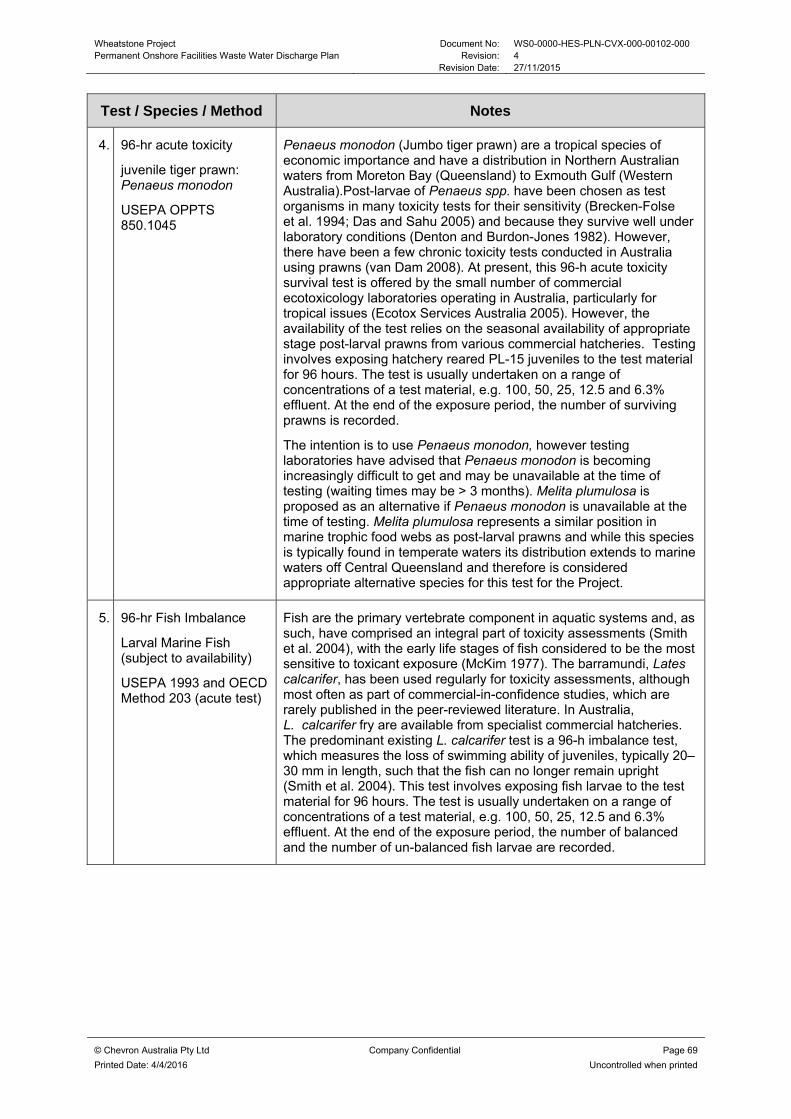
Wheatstone Project Document No: WS0-0000-HES-PLN-CVX-000-00102-000 Permanent Onshore Facilities Waste Water Discharge Plan Revision: 4 Revision Date: 27/11/2015
© Chevron Australia Pty Ltd Company Confidential Page 69
Printed Date: 4/4/2016 Uncontrolled when printed
Test / Species / Method Notes
4. 96-hr acute toxicity
juvenile tiger prawn: Penaeus monodon
USEPA OPPTS 850.1045
Penaeus monodon (Jumbo tiger prawn) are a tropical species of economic importance and have a distribution in Northern Australian waters from Moreton Bay (Queensland) to Exmouth Gulf (Western Australia).Post-larvae of Penaeus spp. have been chosen as test organisms in many toxicity tests for their sensitivity (Brecken-Folse et al. 1994; Das and Sahu 2005) and because they survive well under laboratory conditions (Denton and Burdon-Jones 1982). However, there have been a few chronic toxicity tests conducted in Australia using prawns (van Dam 2008). At present, this 96-h acute toxicity survival test is offered by the small number of commercial ecotoxicology laboratories operating in Australia, particularly for tropical issues (Ecotox Services Australia 2005). However, the availability of the test relies on the seasonal availability of appropriate stage post-larval prawns from various commercial hatcheries. Testing involves exposing hatchery reared PL-15 juveniles to the test material for 96 hours. The test is usually undertaken on a range of concentrations of a test material, e.g. 100, 50, 25, 12.5 and 6.3% effluent. At the end of the exposure period, the number of surviving prawns is recorded.
The intention is to use Penaeus monodon, however testing laboratories have advised that Penaeus monodon is becoming increasingly difficult to get and may be unavailable at the time of testing (waiting times may be > 3 months). Melita plumulosa is proposed as an alternative if Penaeus monodon is unavailable at the time of testing. Melita plumulosa represents a similar position in marine trophic food webs as post-larval prawns and while this species is typically found in temperate waters its distribution extends to marine waters off Central Queensland and therefore is considered appropriate alternative species for this test for the Project.
5. 96-hr Fish Imbalance
Larval Marine Fish (subject to availability)
USEPA 1993 and OECD Method 203 (acute test)
Fish are the primary vertebrate component in aquatic systems and, as such, have comprised an integral part of toxicity assessments (Smith et al. 2004), with the early life stages of fish considered to be the most sensitive to toxicant exposure (McKim 1977). The barramundi, Lates calcarifer, has been used regularly for toxicity assessments, although most often as part of commercial-in-confidence studies, which are rarely published in the peer-reviewed literature. In Australia, L. calcarifer fry are available from specialist commercial hatcheries. The predominant existing L. calcarifer test is a 96-h imbalance test, which measures the loss of swimming ability of juveniles, typically 20–30 mm in length, such that the fish can no longer remain upright (Smith et al. 2004). This test involves exposing fish larvae to the test material for 96 hours. The test is usually undertaken on a range of concentrations of a test material, e.g. 100, 50, 25, 12.5 and 6.3% effluent. At the end of the exposure period, the number of balanced and the number of un-balanced fish larvae are recorded.
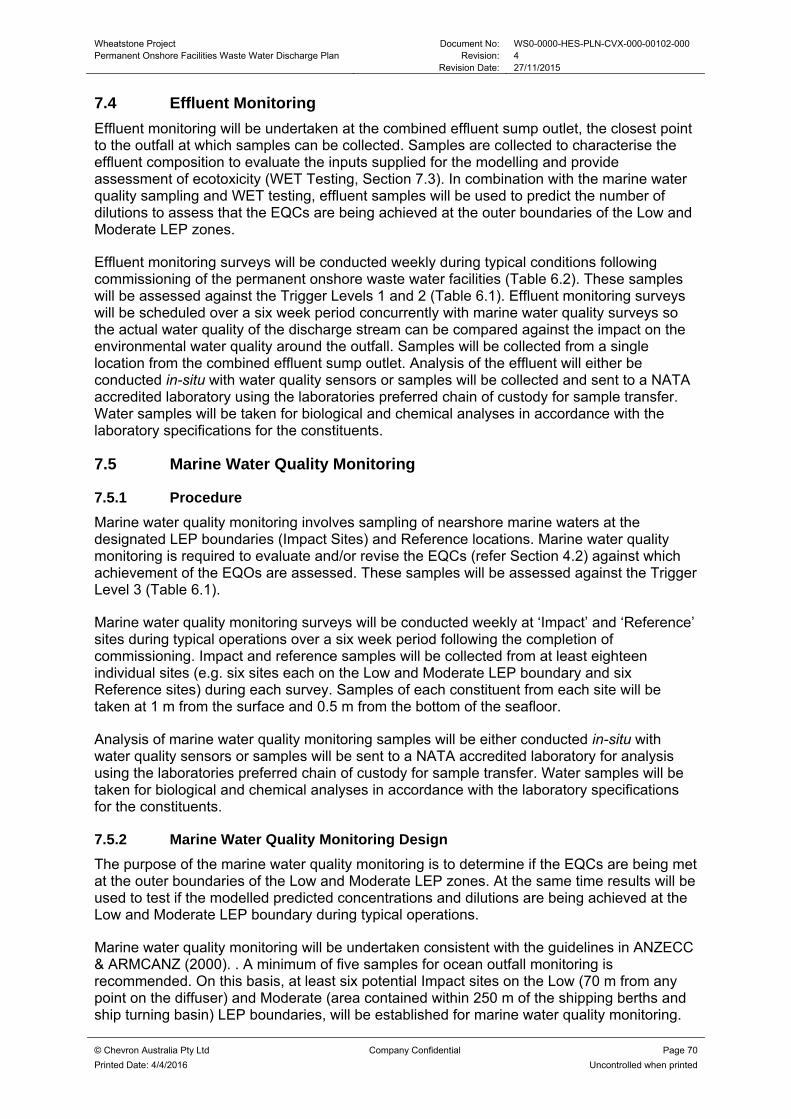
Wheatstone Project Document No: WS0-0000-HES-PLN-CVX-000-00102-000 Permanent Onshore Facilities Waste Water Discharge Plan Revision: 4 Revision Date: 27/11/2015
© Chevron Australia Pty Ltd Company Confidential Page 70
Printed Date: 4/4/2016 Uncontrolled when printed
7.4 Effluent Monitoring
Effluent monitoring will be undertaken at the combined effluent sump outlet, the closest point to the outfall at which samples can be collected. Samples are collected to characterise the effluent composition to evaluate the inputs supplied for the modelling and provide assessment of ecotoxicity (WET Testing, Section 7.3). In combination with the marine water quality sampling and WET testing, effluent samples will be used to predict the number of dilutions to assess that the EQCs are being achieved at the outer boundaries of the Low and Moderate LEP zones.
Effluent monitoring surveys will be conducted weekly during typical conditions following commissioning of the permanent onshore waste water facilities (Table 6.2). These samples will be assessed against the Trigger Levels 1 and 2 (Table 6.1). Effluent monitoring surveys will be scheduled over a six week period concurrently with marine water quality surveys so the actual water quality of the discharge stream can be compared against the impact on the environmental water quality around the outfall. Samples will be collected from a single location from the combined effluent sump outlet. Analysis of the effluent will either be conducted in-situ with water quality sensors or samples will be collected and sent to a NATA accredited laboratory using the laboratories preferred chain of custody for sample transfer. Water samples will be taken for biological and chemical analyses in accordance with the laboratory specifications for the constituents.
7.5 Marine Water Quality Monitoring
7.5.1 Procedure
Marine water quality monitoring involves sampling of nearshore marine waters at the designated LEP boundaries (Impact Sites) and Reference locations. Marine water quality monitoring is required to evaluate and/or revise the EQCs (refer Section 4.2) against which achievement of the EQOs are assessed. These samples will be assessed against the Trigger Level 3 (Table 6.1).
Marine water quality monitoring surveys will be conducted weekly at ‘Impact’ and ‘Reference’ sites during typical operations over a six week period following the completion of commissioning. Impact and reference samples will be collected from at least eighteen individual sites (e.g. six sites each on the Low and Moderate LEP boundary and six Reference sites) during each survey. Samples of each constituent from each site will be taken at 1 m from the surface and 0.5 m from the bottom of the seafloor.
Analysis of marine water quality monitoring samples will be either conducted in-situ with water quality sensors or samples will be sent to a NATA accredited laboratory for analysis using the laboratories preferred chain of custody for sample transfer. Water samples will be taken for biological and chemical analyses in accordance with the laboratory specifications for the constituents.
7.5.2 Marine Water Quality Monitoring Design
The purpose of the marine water quality monitoring is to determine if the EQCs are being met at the outer boundaries of the Low and Moderate LEP zones. At the same time results will be used to test if the modelled predicted concentrations and dilutions are being achieved at the Low and Moderate LEP boundary during typical operations.
Marine water quality monitoring will be undertaken consistent with the guidelines in ANZECC & ARMCANZ (2000). . A minimum of five samples for ocean outfall monitoring is recommended. On this basis, at least six potential Impact sites on the Low (70 m from any point on the diffuser) and Moderate (area contained within 250 m of the shipping berths and ship turning basin) LEP boundaries, will be established for marine water quality monitoring.

Wheatstone Project Document No: WS0-0000-HES-PLN-CVX-000-00102-000 Permanent Onshore Facilities Waste Water Discharge Plan Revision: 4 Revision Date: 27/11/2015
© Chevron Australia Pty Ltd Company Confidential Page 71
Printed Date: 4/4/2016 Uncontrolled when printed
Under some conditions the discharge plume may “pool” near the outfall around slack tide, creating a slug of water with high effluent concentrations; these "pools" are then advected away as the current increases. Alternatively, the plume may return to the outfall location as the tide reverses, producing elevated concentrations due to re-entrainment and recirculation. Impact sites are proposed to the east and west of the discharge point based on the model showing the plume typically oscillating parallel to the coastline between reversing longshore current patterns. Using these Impact site locations together with weekly sampling over six weeks allows for the calculation of temporal and spatial statistics for the assessment of potential impact. Impact sites will remain fixed with monitoring targeting a similar period of the tidal regime to focus the design on determining how the water quality can vary under typical conditions and effluent concentrations. The approximate location of the proposed Impact sites is shown in Figure 7.1.
Reference sites were selected to match natural conditions expected at the Impact sites. Reference sites can account for broad scale regional effects that will result in natural perturbations above the long term 80th percentile. The inclusion of both real-time Reference sites and long term percentiles will then minimise the possibility of falsely attributing change to onshore discharge.
The locations of reference sites were selected and located as recommended by ANZECC & ARMCANZ (2000) and the OEPA (EPA 2005) as follows:
Representative - same bio-geographic and climatic region as the test site
Bathymetry, substrate and hydrodynamics of the Reference site should be similar to test site
Independent - should be sufficiently distant from the test site to avoid disturbances in the test site affecting the Reference site - current assumption is that Reference sites are more than 500 m from the outfall
Reference sites are located approximately 100m apart on an axis perpendicular to the direction of current.
Background constituent concentrations recorded at Reference sites at any location during monitoring are likely to be dependent on the physical (e.g. meteorological, oceanographic, depth), biological (e.g. abundance and movement of organisms) and anthropogenic (e.g. upstream nutrient input from Ashburton River) conditions present at the time of sampling. In addition, the discharge plume exhibits typically dynamic behaviour as explained for the Impact sites (e.g. tidal reversals, pooling and re-entrainment), indicating the plume behaviour collected during any instantaneous sampling survey are likely to be variable. It is therefore difficult to establish permanent Reference sites in a unidirectional location from the outfall as they cannot always be up-current of the outfall location. Instead, Reference sites are located approximately 1 km beyond the east and west boundary of the moderate LEP on the same bathymetry contour (i.e. greater than 1250 m from the outfall). Two sets of three Reference sites have been established, each uniformly spaced either side of the Impact sites. Each set of Reference sites is orientated in a line perpendicular to the tidally reversing shoreline currents. This configuration avoids the possibility of localised differences in the physical, biological and anthropogenic conditions (e.g. Ashburton River runoff) misrepresenting the natural background water quality conditions of the Impact sites. Reference sites are to remain fixed with monitoring targeting a similar period of the tidal regime for comparison with Impact sites.
Achievement of the EQCs and the prescribed levels of ecological protection will be assessed by comparing the post commissioning survey results with the EQC guideline triggers for the low and moderate LEP boundaries, reported in Table 4.2, Table 4.3 and Table 4.4. The guideline value for each constituent will be calculated from a 6-week median (or both 6 week

Wheatstone Project Document No: WS0-0000-HES-PLN-CVX-000-00102-000 Permanent Onshore Facilities Waste Water Discharge Plan Revision: 4 Revision Date: 27/11/2015
© Chevron Australia Pty Ltd Company Confidential Page 72
Printed Date: 4/4/2016 Uncontrolled when printed
medians and spot samples for DO). Spot samples will be collected weekly with the median calculated for the six week period occurring after the end of the six-week post commissioning period. The six-week median for each individual site will be compared to the relevant guideline value or the relevant Reference percentile. Reference percentiles will be calculated from the six-week median for each individual Reference site. For measuring DO, spot samples at each site will also be compared against the 60% saturation outlined in Schedule 2 of MS 873.
7.6 Revision of EQCs and Dilution requirements
To determine initial EQCs, baseline water quality data were reviewed from a subset of baseline monitoring locations considered relevant to the permanent onshore facilities waste water discharge outfall. This review provided an indication of the variation in physical parameters, most of which (particularly turbidity, temperature and salinity) can change sharply over short periods of time. To account for this variation, final triggers will be based on a combination of long term monitoring data and real-time comparative Reference sites (refer to Sections 7.3, 6.2 and 7.4). Only by using this combination can the program address both the relationship between natural and discharge parameters together with an assessment of potential impact. The outcomes of the WET testing program (Section 7.3) will be used to revise the EQCs and the predicted number of dilutions required to be achieved at each LEP boundary (Section 5.2) as prescribed by Ministerial Condition 13-12(iv). The revised EQC and dilutions will be derived following WET testing by assessing the species sensitivity distribution using a suitable statistical software package (e.g. BurrliOZ, Campbell et al. 2000).
Ongoing monitoring of the discharge streams will continue to determine that the revised EQCs are being achieved as part of the long term environmental management of the permanent waste water treatment and discharge facilities. It is expected ongoing monitoring will depend on results from the EQVRP. The EQCs will be modified on the basis of WET testing of the combined effluent sump outlet to provide a more direct measure of the dilutions required to meet the LEPs as defined in MS 873 Schedule 2. Operations Monitoring and Management proposed in Section 8.0 of this plan will be implemented until such time that the plan has been updated and approved to consider the requirements for ongoing monitoring on the basis of the results of the EQVRP.
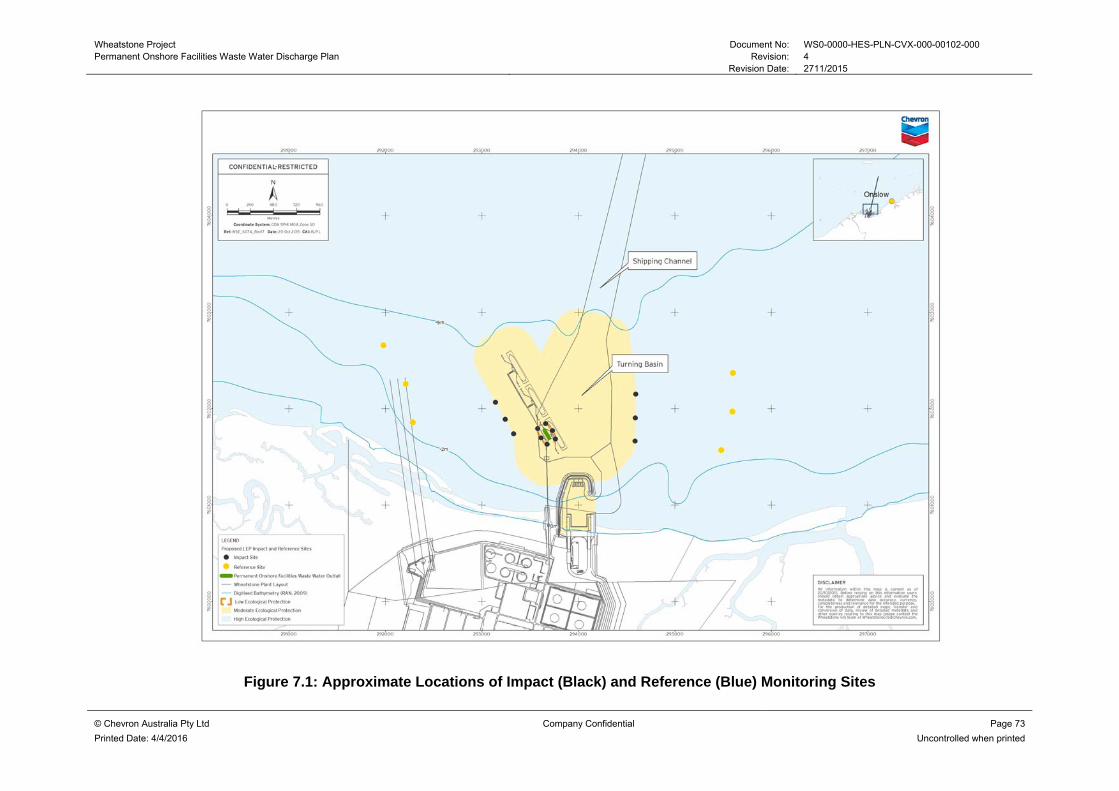
Wheatstone Project Document No: WS0-0000-HES-PLN-CVX-000-00102-000 Permanent Onshore Facilities Waste Water Discharge Plan Revision: 4 Revision Date: 2711/2015
© Chevron Australia Pty Ltd Company Confidential Page 73
Printed Date: 4/4/2016 Uncontrolled when printed
Figure 7.1: Approximate Locations of Impact (Black) and Reference (Blue) Monitoring Sites

Wheatstone Project Document No: WS0-0000-HES-PLN-CVX-000-00102-000 Permanent Onshore Facilities Waste Water Discharge Plan Revision: 4 Revision Date: 27/11/2015
© Chevron Australia Pty Ltd Company Confidential Page 74
Printed Date: 4/4/2016 Uncontrolled when printed
8.0 OPERATIONS MANAGEMENT & MONITORING
8.1 Management
8.1.1 Typical Conditions
There are a number of potential operational and design solutions which may be used as contingency measures in response to trigger level exceedences which occur under typical conditions. In the event of an exceedence requiring intervention, the first step is to determine if the cause of exceedence relates to design or operating parameters (such as the design model itself, monitoring errors, discharge rates/volumes). Subject to the outcomes of the investigation a combination of the following operational contingency actions options may be implemented:
Conduct additional field studies or monitoring to investigate
Redirect effluent to temporary storage on site for later recirculation/recycling through the WWTPs
Adjust the flow process and rates
Change management and treatment of wastewater (e.g. isolating a particular stream of concern and other modifications to WWTP[s] operations depending on the test results)
Inject seawater into the combined waste water equalisation tank to achieve further dilution
Investigate available options for reuse
Transport by a licensed controlled waste contractor for treatment offsite at an approved licensed facility.
Design contingency options may include one or any combination of the following:
Modify existing equipment/facilities (e.g. adding an additional treatment method[s] for the constituent[s] of concern, replacing a particular treatment[s] with other equivalent or improved techniques
Addition of another processing train[s] to the WWTP[s] (subject to approval)
Modify or relocate the diffuser (subject to approval under Condition 13.1).
Once design options are selected, an assessment of the risk that the dilutions and/or EQCs are not being achieved (including possible additional modelling) may be conducted to determine if proposed contingency options are likely to correct the observed exceedence. In the event that a design option is required, relevant approval applications will be submitted as appropriate.
8.1.2 Unplanned Events
Unplanned Events include minor disruptions to operation/service, cyclonic events and power failures. Prior to a predicted cyclone or rainfall event where the WWTPs may experience inundation of storm surge and/or flood water, the waste water present within the system will be discharged in-full to the onsite storage facilities. The wastewater equalisation tanks and the aerobic digesters at the CV are maintained at maximum level during storm events to ensure no wind damage will occur. The emergency shelter-in-place for a reduced workforce will direct its waste water to the sanitary sumps which pump to the CV WWTP for temporary holding and until such time that the WWTP is restarted.
If minor disruptions to operations/service occur, the off-spec effluent can be recycled back to the influent equalisation tanks. Diversion facilities (tank/sump) are also provided upstream of

Wheatstone Project Document No: WS0-0000-HES-PLN-CVX-000-00102-000 Permanent Onshore Facilities Waste Water Discharge Plan Revision: 4 Revision Date: 27/11/2015
© Chevron Australia Pty Ltd Company Confidential Page 75
Printed Date: 4/4/2016 Uncontrolled when printed
the LNG PTF and LNG WWTP to retain influent while repair or maintenance can be performed on treatment equipment. Overall, system reliability is supported by provision of redundant primary treatment (CPI-DAF-Filtration) and biological treatment (sanitary wastewater) trains to support plant operation. In addition to the equipment trains themselves, redundant forwarding and transfer pumps, metering pumps, and blowers and compressors are provided as installed spares.
The CV and LNG WWTPs, desalination plant, LNG PTF and waste water outfall will all be equipped with monitoring devices for either continuous or composite sampling analysis. Depending on the detected parameters, appropriate corrective measures will be taken immediately. In the event of an unplanned release, steps will be taken in accordance with the Oil Spill Environmental Response Plan as approved under EPBC 2008/4469 Condition 47that includes containing the release and cleaning up the release. Corrective actions would be based on findings of any investigations and may entail modifications to the operation procedure and equipment or area layout.
8.2 Triggers
Two levels of Contingency Management triggers are proposed for Planned Operations to achieve the requirements of Condition 13 and Schedule 2 (MS 873) under Typical Conditions. These trigger values are based on the modelling outputs and effluent characterisation described in Section 5.0. Inputs to the modelling results were based on maximum flow rate characteristics listed in Section 5.1 of this Plan. The operations triggers described below are intended to initiate investigations and/or modifications for the purpose of achieving the EQCs described in Section 4.2 and are considered relevant for the requirements of Condition 13-11.ii, 13-11.v (MS 873).
A description of relevant management measures associated with Level 1 and 2 triggers are provided in the following sections. Trigger values for Toxicants, Other Chemical and Physical Parameters, and Biological Parameters are listed in Table 6.1.
8.2.1 Level 1
Level 1 Trigger is based on a maximum instantaneous flow rate (pumping rate) during each discharge period of 674 m3/hr (Table 6.1).
The average equivalent incoming flow rate to the final effluent sump before discharge via permanent outfall is 276 m3/hr and 248 m3/hr for typical summer and winter operations, respectively. The waste water parameter concentrations for average and instantaneous flow rate remain the same. Readings in excess of the projected maximum flow rate specifications will trigger an investigation to determine the source of elevated readings, beginning with an evaluation of readings at the individual WWTPs and the seawater desalination system. Investigations may also require increased monitoring at the combined effluent sump outlet. Should an unplanned flow rate exceedence be detected, the pumping operations will be reduced until the flow rate falls below the defined maximum instantaneous rate. Pumps, in-line analyser(s) and alarms and effluent monitors will be inspected and repaired/replaced as necessary.
8.2.2 Level 2
Level 2 Trigger is based on effluent concentrations recorded at the combined effluent sump outlet.
The trigger value is set at 100% of maximum expected constituent concentration in the discharge. This trigger value and the sampling parameters shown may be revised subject to the results of EQVRP (see Section 7.0). The sampling frequency is expected to be a combination of continuous sampling and weekly composite sampling, although if constituents

Wheatstone Project Document No: WS0-0000-HES-PLN-CVX-000-00102-000 Permanent Onshore Facilities Waste Water Discharge Plan Revision: 4 Revision Date: 27/11/2015
© Chevron Australia Pty Ltd Company Confidential Page 76
Printed Date: 4/4/2016 Uncontrolled when printed
are consistently well within compliance values, the frequency and the constituents in the monitoring program are likely to be re-evaluated (Section 8.3, Table 6.2).
Should effluent readings reach the Level 2 trigger values, appropriate corrective measures may include equipment maintenance, caustic solution dosing, possible recirculation/recycling of effluent through the WWTP for additional treatment, or redirecting of effluent to temporary storage on site for later recirculation/recycling as necessary. Where a Level 2 trigger value is reached, an investigation similar to the one for Level 1 trigger values will be initiated to determine the cause of the trigger being reached including inspection and repair of in-line analyser(s) and alarms, and effluent monitors as necessary. Monitored readings that reach Level 2 trigger values will be recorded and reported internally.
8.3 Effluent Monitoring
Operations monitoring will be implemented as outlined in Table 6.2 at the combined effluent sump outlet, which is the closest point to the outfall at which samples can be collected, to characterise the effluent in the discharge stream. Operations monitoring will be completed through a combination of continuous inline monitoring and the analysis of composite samples collected on a weekly basis as detailed in Table 6.2, although if constituents are consistently well within compliance values, the frequency and the constituents in the monitoring program are likely to be re-evaluated. Collected samples will be sent to a NATA accredited laboratory for evaluation of relevant water quality parameters.
Water samples will be taken for biological and chemical analyses in accordance with the laboratory specifications for the constituents. Readings for pH, salinity (by conductivity) and chlorine will be taken in-situ, with salinity measurements converted to a TDS equivalent for comparison with EQCs.
Consistent with ANZECC & ARMCANZ (2000) guidelines, 10% of samples will be splits (randomly selected) and one sample will be taken as a 'blank'. The blank sample is prepared using the methods for field sampling but containers are filled with laboratory prepared distilled water, rather than discharge water.
The water quality parameters proposed for assessment have been outlined in Table 6.1. Flow rates will also be confirmed in the commissioning, EQVRP and operations monitoring.
8.4 Changes to Effluent Stream Composition
If the composition of a discharge changes significantly during typical operations from that described in Section 5.0, the requirements for validation monitoring as described in Section 7.0 will be reviewed and relevant monitoring will be performed if necessary.

Wheatstone Project Document No: WS0-0000-HES-PLN-CVX-000-00102-000 Permanent Onshore Facilities Waste Water Discharge Plan Revision: 4 Revision Date: 27/11/2015
© Chevron Australia Pty Ltd Company Confidential Page 77
Printed Date: 4/4/2016 Uncontrolled when printed
9.0 REPORTING
This section provides a framework for external reporting to regulatory authorities relevant to this Plan, including scheduled and unplanned reporting.
9.1 Effluent Quality Validation Report
In accordance with MS 873 Condition 13-12(v) and Condition 44 (EPBC 2008/4469), Chevron Australia is required to submit a waste water discharge report to the DER and the Commonwealth Minister for the Environment within six months of commissioning of a discharge or within six months of any significant change in composition of a discharge, including any management actions necessary to achieve the EQOs and LEPs established through MS 873 Condition 13-1 and described in MS 873 Schedule 2.
Consistent with MS 873 Condition 13-15, in the event that monitoring undertaken as part of the EQVRP (Section 7.0) indicates that the environmental quality objectives and levels of ecological protection established through conditions 13-1, and described in Schedule 2, are not being met, or are not likely to be met, a report of the findings of this monitoring will be provided to the CEO and the DER as soon as practicable, but within five working days of receiving the results, along with a description of the management actions to be taken to meet the required level of environmental quality.
9.2 Annual Compliance Reporting
A State and Commonwealth annual Compliance Assessment Report (CAR) are required by MS 873 Condition 4 and EPBC 2008/4469 Condition 3 respectively. Both reports assess compliance against Ministerial Conditions within the compliance reporting period being 31 August to 30 August of each compliance year, with each CAR due by the 30 November of each year. As part of the preparation of the annual CARs, Chevron Australia will assess its compliance status against this Plan, which will be guided by the action table provided in Appendix A.
The Compliance Assessment Plan requires that the Project CARs shall be made publicly available within one month of being submitted to the OEPA. A copy of the most recent annual CAR will be placed on the Chevron Australia website until the subsequent annual CAR is placed on the website. Annual CAR’s from previous years will be made publicly available on request for the life of the Project.
9.3 Non-compliance Reporting
MS 873 Condition 4-5 requires that any potential non-compliance, relevant to this Plan, will be reported to the CEO of the OEPA within five working days of that potential non-compliance being known. EPBC 2008/4469 Condition 3 requires non-compliance with this Plan to be reported to DOTE at the time the CAR is published on Chevron Australia’s website.

Wheatstone Project Document No: WS0-0000-HES-PLN-CVX-000-00102-000 Permanent Onshore Facilities Waste Water Discharge Plan Revision: 4 Revision Date: 27/11/2015
© Chevron Australia Pty Ltd Company Confidential Page 78
Printed Date: 4/4/2016 Uncontrolled when printed
10.0 REFERENCES
ANZECC (1997). Australian Guidelines for Sewerage Systems: Effluent Management. Canberra.Australian and New Zealand Environment and Conservation Council, Canberra, ACT.
ANZECC & ARMCANZ (2000). Australian and New Zealand Guidelines for Fresh and Marine Water Quality. Australian and New Zealand Environment and Conservation Council and Agriculture and Resource Management Council of Australia and New Zealand, National Water Quality Management Strategy Paper 4, Canberra, ACTAPI Management Pty Ltd (2010) API West Pilbara Iron Ore Project - Stage 1 Desalination Discharge Management Plan. API Management Pty Ltd, Perth, WA, Australia
Brecken-Folse JA, Mayer FL, Pedigo LE, Marking LL (1994). Acute toxicity of 4-nitrophenol, 2,4-dinitrophenol, terbufos and trichlorfon to grass shrimp (Palaemonetes spp.) and sheepshead minnows (Cyprinodon variegatus) as affected by salinity and temperature. Environmental Toxicology and Chemistry 13: 67-77
Campbell E, Palmer MJ, Shao Q, MStJ W, D W (2000). BurrliOZ: A computer program for calculating toxicant trigger values for the ANZECC and ARMCANZ water quality guidelines. , Perth, WA
Chevron Australia (2010). Draft Environmental Impact Statement/Environmental Review and Management Programme for the Proposed Wheatstone Project: Technical Appendices Q6, Q7, R1, S1, T1, U1, V1, and W1, July 2010
Chevron Australia (2013). Construction Onshore Facilitites Waste Water Discharge Plan. Document Number: WS0 0000 HES PLN CVX 000 00096-000 0
Commonwealth of Australia (2006). A guide to the integrated marine and coastal regionalisation of Australia Version 4.0. Canberra, Australia, Department of the Environment and Heritage.
Das, S. and B. K. Sahu (2005). "Interaction of pH with mercuric chloride toxicity to penaeid prawns from a tropical estuary, East Coast of India: enhanced toxicity at low pH." Chemosphere 58(9): 1241-1248.
Denton, G. R. W. and C. Burdon-Jones (1982). "The influence of temperature and salinity upon the acute toxicity of heavy metals to the banana prawn Penaeus merguiensis (de Man)." Chemistry in Ecology 1: 131-143.
Department of Environment (2004). State Water Quality Management Strategy No. 6. Department of Environment, SWQ 6, Perth, WA
Department of Environment (2006). Pilbara Coastal Water Quality Consultation Outcomes: Environmental Values and Environmental Quality Objectives. Perth, WA, Department of Environment: 50.
DHI (2013). Wheatstone Downstream Numerical Modelling Assessment of Construction-phase Outfall Discharge and Intake Recirculation.
DHI (2015). Revised Numerical Modelling Assessment of Permanent Outfall Discharge and Intake Recirulation.
Ecotox Services Australia (2005). Toxicity Test Fact Sheets - <www.ecotox.com.au>

Wheatstone Project Document No: WS0-0000-HES-PLN-CVX-000-00102-000 Permanent Onshore Facilities Waste Water Discharge Plan Revision: 4 Revision Date: 27/11/2015
© Chevron Australia Pty Ltd Company Confidential Page 79
Printed Date: 4/4/2016 Uncontrolled when printed
Environmental Protection Authority – See EPA
EPA (2005). Manual of Standard Operating Procedures for Environmental Monitoring against the Cockburn Sound Environmental Quality Criteria (2004). A Supporting Document for the Draft State Environmental (Cockburn Sound) Policy. EPA Report 21. Environmental Protection Authority, Perth, WA
EPA (2011). Wheatstone Development - Gas Processing, Export Facilities and Infrastructure, Shire of Ashburton and Roeburne. Ministerial Statement 873. Environmental Protection Authority, Perth, WA
Florence, T. M. and J. L. Stauber (1986). "Toxicity of copper complexes to the marine diatom Nitzschia closterium." Aquatic toxicology 8(1): 11-26.
Geffard O, Budzinski H, His E, Seaman MNL, Garrigues P (2002). Relationships between contaminant levels in marine sediments and their biological effects on embryos of oysters, Crassostrea gigas. Environmental Toxicology and Chemistry 21: 2310-2318
Government of Western Australia (2003). State Water Quality Management Strategy, Implementation Plan: Status Report, SWQ 2. Perth, WA, Water and Rivers Commission.
Hogan AC, Stauber JL, Pablo F, Adams MS, Lim RP (2005). The Development of Marine Toxicity Identification Evaluation (TIE) Procedures Using the Unicellular Alga Nitzschia closterium. Archives of Environmental Contamination and Toxicology 48: 433-443
McKim JM (1977). Evaluation of Tests with Early Life Stages of Fish for Predicting Long-Term Toxicity. Journal of the Fisheries Research Board of Canada 34: 1148-1154
MScience (2011). Wheatstone LNG Development: Water Quality Characterisation and Parameter Calibration. Unpublished Report to URS Australia Pty Ltd by MScience Pty Ltd, MSA134R9, Perth, WA
MScience (2013). Wheatstone LNG Development: Water Quality Around the Proposed Nearshore Outfall. Unpublished Report to Chevron Australia by MScience Pty Ltd, MSA188R1, Perth, WA
Negri AP, Bunter O, Jones B, Llewellyn L (2004). Effects of the bloom-forming alga Trichodesmium erythraeum on the pearl oyster Pinctada maxima. Aquaculture 232: 91-102
Pearce AF, Buchan S, Chiffings T, D'Adamo N, Fandry C, Fearn P, Mills D, Phillips R, Simpson C (2003). A review of the oceanography of the Dampier Archipelago. In: Wells FE, Walker DI, Jones DS (eds) Proceedings of the Twelfth International Marine Biological Workshop: The Marine Flora and Fauna of Dampier, Western Australia. Vol.1. Western Australian Museum, pp 13-50
Peerzada, N. and C. Dickinson (1989). "Metals in oysters from the Arnhem Land coast, Northern Territory, Australia." Marine Pollution Bulletin 20(3): 144-145.
SKM (2012). Chevron Wheatstone Water Quality Measurement Programme: Twelve Monthly Baseline Water Quality Measurement Report: 15/05/2011 – 21/05/2012 Unpublished Report by Sinclair Knight Merz for Chevron Australia, Perth, WA

Wheatstone Project Document No: WS0-0000-HES-PLN-CVX-000-00102-000 Permanent Onshore Facilities Waste Water Discharge Plan Revision: 4 Revision Date: 27/11/2015
© Chevron Australia Pty Ltd Company Confidential Page 80
Printed Date: 4/4/2016 Uncontrolled when printed
Smith R, Krazzoi R, Doyle C, Stauber J, Bacher J, Mueller J (2004). Evaluation of methods of water and effluent toxicity testing. Evaluation Report. Brisbane Water, Brisbane, QLD, Australia
Stauber, J. (1995). "Toxicity testing using marine and freshwater unicellular algae." Australasian Journal of Ecotoxicology 1: 15-24.
URS (2010). Wheatstone Project – Characterisation of the Marine Environment. Chevron Australia P/L.
van Dam RA, Harford AJ, Houston MA, Hogan AC, Negri AP (2008). Tropical tarine toxicity testing in Australia: A review and recommendations. Australasian Journal of Ecotoxicology 14: 55-88
Wenziker K, McAlpine K, Apte S, Masini R (2006). Background Quality for Coastal Marine Waters of the North West Shelf, Western Australia, North West Shelf Joint Environmental Management Study Technical Report 18

Wheatstone Project Document No: WS0-0000-HES-PLN-CVX-000-00102-000 Permanent Onshore Facilities Waste Water Discharge Plan Revision: 4 Revision Date: 27/11/2015
© Chevron Australia Pty Ltd Company Confidential Page 81
Printed Date: 4/4/2016 Uncontrolled when printed
APPENDICES
CONTENTS
APPENDIX A ACTION TABLE .................................................................................... 82
APPENDIX B SPECIES AND MATTERS PROTECTED BY THE EPBC ACT ........... 88
APPENDIX C MODELLING RESULTS ........................................................................ 89
Overview ....................................................................................................................... 89
TABLES
Table A 1: Simulation 1 Results at Low LEP Boundary - Typical Summer Conditions .......... 90 Table A 2: Simulation 1 Results at Moderate LEP Boundary - Typical Summer
Conditions.......................................................................................................... 91 Table A 3: Simulation 1 Results at the Seawater Intake - Typical Summer Conditions ......... 92 Table A 4: Simulation 2 Results at Low LEP Boundary - Typical Winter Conditions ............. 93 Table A 5: Simulation 2 Results at Moderate LEP Boundary - Typical Winter Conditions ..... 94 Table A 6: Simulation 2 Results at the Seawater Intake - Typical Winter Conditions ............ 95

Wheatstone Project Document No: WS0-0000-HES-PLN-CVX-000-00102-000 Permanent Onshore Facilities Waste Water Discharge Plan Revision: 4 Revision Date: 27/11/2015
© Chevron Australia Pty Ltd Company Confidential Page 82
Printed Date: 4/4/2016 Uncontrolled when printed
Appendix A Action Table
Section Actions Timing
Background
1.3 Purpose If there are differences or inconsistencies between the Works Approval/Licence application documents and conditions (MS 873 or EPBC 2008/4469), the former prevail to the extent of the inconsistency, and the Plan will be amended to ensure there is no difference or inconsistency between the documents provided the necessary amendments do not alter the Proponent’s obligations under the conditions.
As required
1.6 Review, Approval and Revision
Proponent will review the Plan to address matters such as the overall effectiveness, environmental performance, changes in environmental risks and changes in business conditions on an as needed basis (e.g. in response to new information).
If during the Works Approval or licensing process, or as a result of the conditions of the Works Approval or licence, there is a revision(s) to this Plan, Chevron Australia will revise this Plan and provide the revision(s) to DER and DOTE, and in the meantime the works approval/licence documents will be preferred in the extent of any difference or inconsistency. In accordance with Condition 5 of EPBC 2008/4469, if Chevron Australia wishes to undertake activities associated with the discharge of waste water from the permanent onshore facilities otherwise than in accordance with the provisions of this Plan, the activity shall not commence until the Commonwealth Minister has approved the varied plan
Commissioning Management and Monitoring
6.0 The end of the commissioning period will be determined when engineering and monitoring confirm typical operating conditions have been achieved for all plant, facilities or associated infrastructure resulting in discharges via the permanent outfall outlined in this plan.
As required
6.1 Contingency Management
In the event that the treatment system and the permanent waste water outfall are unable to achieve the commissioning triggers, optimization actions will be investigated. The specific constituent would be evaluated to determine if either an operational or design solution is required, available and can practicably be implemented to resolve the abnormal conditions.
Commissioning Once design options are selected, an assessment of the risk that the commissioning triggers will not be met (including possible additional modelling) will be conducted to determine if proposed optimization actions are likely to correct the abnormal conditions. In the event that a design option is required to resolve the abnormal conditions relevant approval applications will be submitted as appropriate.
6.2 Triggers Two levels of triggers are proposed for commissioning to enable staggered start-up and optimization of the

Wheatstone Project Document No: WS0-0000-HES-PLN-CVX-000-00102-000 Permanent Onshore Facilities Waste Water Discharge Plan Revision: 4 Revision Date: 27/11/2015
© Chevron Australia Pty Ltd Company Confidential Page 83
Printed Date: 4/4/2016 Uncontrolled when printed
permanent waste water treatment and discharge facilities. The commissioning trigger values are intended to initiate investigations and/or modifications for the purposes of system optimization, and are the designated values against which investigations and/or modifications will be initiated.
6.2.1
Level 1 Trigger is based on a maximum instantaneous flow rate (pumping rate) during each discharge period of 674 m3/hr (Table 6.1). Readings in excess of the projected maximum flow rate specifications will trigger an investigation to determine the source of elevated readings, beginning with an evaluation of readings at the individual WWTPs and the seawater desalination system. Should an unplanned flow rate exceedence be detected, the pumping operations will be reduced to a more acceptable level. Pumps, in-line analyser(s) and alarms, and effluent monitors shall be inspected and repaired/replaced as necessary.
6.2.2
Level 2 Trigger is based on effluent validation monitoring concentrations (Table 6.1). If the trigger value is exceeded, corrective measures must be undertaken immediately. Where a Level 2 trigger is reached, an investigation will be initiated to determine the cause of the trigger being reached including inspection and repair of in-line analyser(s) and alarms, and monitors as necessary.
6.3 Monitoring Effluent quality monitoring samples will be collected from the combined effluent sump outlet on a weekly basis, as detailed in Table 6.2. Samples collected will be sent to a NATA accredited laboratory for evaluation of relevant water quality parameters and assessed against the Trigger Levels 1 and 2 (Table 6.1).
Effluent Quality Validation Reporting Plan
7.0 The EQVRP will be undertaken once typical conditions have been achieved. As required
7.0 WET testing, effluent monitoring and marine water quality sampling will be used to predict the number of dilutions to assess that the EQCs are being achieved at the outer boundaries of the Low and Moderate LEP zones.
Validation
7.1 Contingency Management
In the event that the treatment system and the permanent waste water outfall are unable to achieve the triggers, optimization actions will be investigated. The specific constituent would be evaluated to determine if either an operational or design solution is required, available and can practicably be implemented to resolve the abnormal conditions.
Validation Once design options are selected, an assessment of the risk that the triggers will not be met (including possible additional modelling) will be conducted to determine if proposed optimization actions are likely to correct the abnormal conditions. In the event that a design option is required to resolve the abnormal conditions relevant approval applications will be submitted as appropriate.
7.2 Triggers Three levels of triggers are proposed to enable optimization of the permanent waste water treatment and discharge facilities during validation. Validation trigger values are intended to initiate investigations and/or modifications for the purposes of system optimization, and are the designated values against which

Wheatstone Project Document No: WS0-0000-HES-PLN-CVX-000-00102-000 Permanent Onshore Facilities Waste Water Discharge Plan Revision: 4 Revision Date: 27/11/2015
© Chevron Australia Pty Ltd Company Confidential Page 84
Printed Date: 4/4/2016 Uncontrolled when printed
investigations and/or modifications will be initiated.
7.2.1
Level 1 Trigger is based on a maximum instantaneous flow rate (pumping rate) during each discharge period of 674 m3/hr (Table 6.1). Readings in excess of the projected maximum flow rate specifications will trigger an investigation to determine the source of elevated readings, beginning with an evaluation of readings at the individual WWTPs and the seawater desalination system. Should an unplanned flow rate exceedence be detected, the pumping operations will be reduced to a more acceptable level. Pumps, in-line analyser(s) and alarms, and effluent monitors shall be inspected and repaired/replaced as necessary.
7.2.2
Level 2 Trigger is based on effluent monitoring concentrations (Table 6.1). Level 2 trigger values are based on effluent monitoring concentrations set at 100% of maximum expected constituent concentration in the discharge. If the trigger value is exceeded, corrective measures must be undertaken immediately. Where Level 2 triggers values are reached an investigation will be initiated to determine the cause of the trigger including inspection and repair of in-line analyser(s) and alarms, and monitors as necessary.
7.2.3
Level 3 Trigger is defined as EQC and is based on measurements of samples collected at the Low and Moderate LEP boundaries during validation (Table 6.1). Monitored readings that reach Level 3 trigger values may be recorded and reported internally for the purposes of system optimization, and the findings of this monitoring will be provided to the CEO and the DER as soon as practicable, but within five working days of receiving the results, along with a description of the management actions to be taken to meet the required level of environmental quality.
7.3 WET Testing
WET testing will be conducted on samples taken from the combined effluent sump outlet following commissioning under typical conditions. WET testing will involve two processes, range finding test for toxicity and definitive toxicity testing. WET testing will be undertaken on a minimum of five locally relevant species from four different taxonomic groups using the recommended protocols from ANZECC and ARMCANZ (2000) (Table 7.1).
Samples for WET testing will be taken in accordance with the sampling kit and instructions provided by the laboratory undertaking the ecotoxicological analysis. Plastic sample bottles (2.5 L) will be filled from the combined effluent sump outlet. Samples will be chilled for 2 hours on ice to bring down to 4 °C, packed in eskies and air freighted to the laboratory.
7.4 Effluent Monitoring
Effluent monitoring will be undertaken at the combined effluent sump outlet. Effluent monitoring surveys will be conducted weekly for a duration of six weeks during typical conditions following commissioning of the permanent onshore waste water facilities (Table 6.2). Analysis of the effluent will either be conducted in-situ with water quality sensors or samples will be collected and sent to a NATA accredited laboratory using the laboratories preferred chain of custody for sample transfer. Water samples will be taken for biological and chemical analyses in accordance with the laboratory specifications for the constituents.
7.5 Marine Water Marine water quality monitoring will be undertaken consistent with the guidelines in ANZECC & ARMCANZ
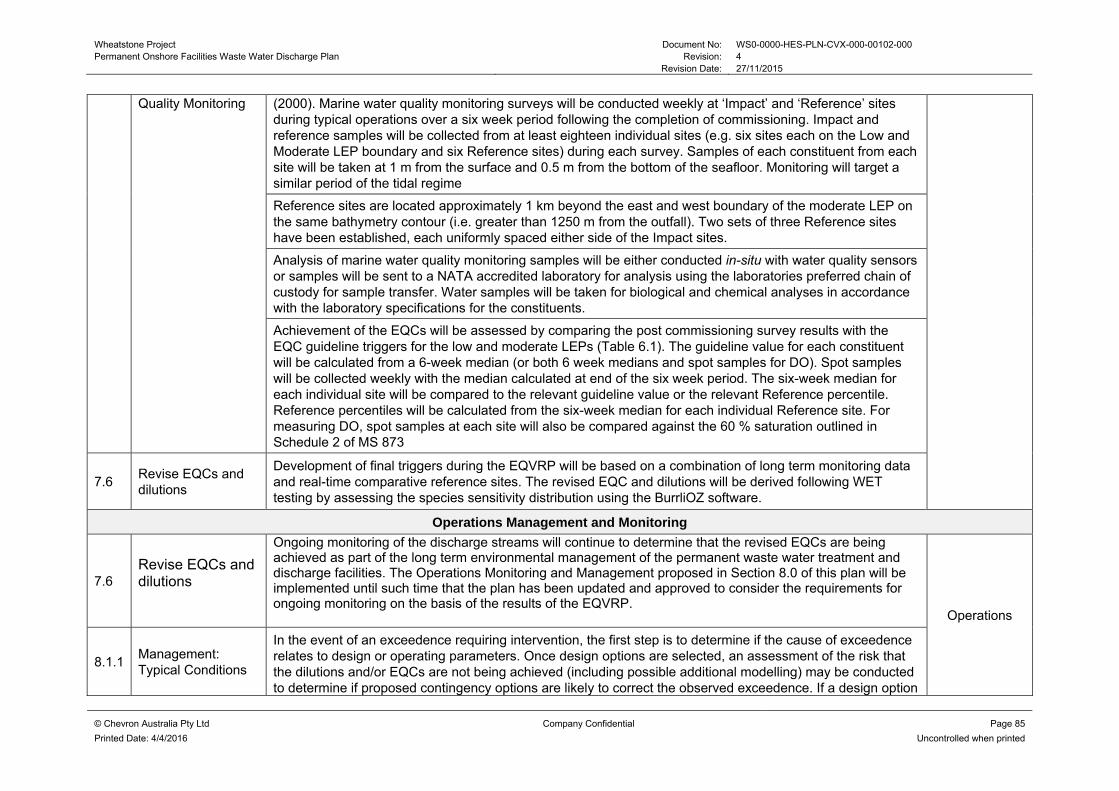
Wheatstone Project Document No: WS0-0000-HES-PLN-CVX-000-00102-000 Permanent Onshore Facilities Waste Water Discharge Plan Revision: 4 Revision Date: 27/11/2015
© Chevron Australia Pty Ltd Company Confidential Page 85
Printed Date: 4/4/2016 Uncontrolled when printed
Quality Monitoring (2000). Marine water quality monitoring surveys will be conducted weekly at ‘Impact’ and ‘Reference’ sites during typical operations over a six week period following the completion of commissioning. Impact and reference samples will be collected from at least eighteen individual sites (e.g. six sites each on the Low and Moderate LEP boundary and six Reference sites) during each survey. Samples of each constituent from each site will be taken at 1 m from the surface and 0.5 m from the bottom of the seafloor. Monitoring will target a similar period of the tidal regime
Reference sites are located approximately 1 km beyond the east and west boundary of the moderate LEP on the same bathymetry contour (i.e. greater than 1250 m from the outfall). Two sets of three Reference sites have been established, each uniformly spaced either side of the Impact sites.
Analysis of marine water quality monitoring samples will be either conducted in-situ with water quality sensors or samples will be sent to a NATA accredited laboratory for analysis using the laboratories preferred chain of custody for sample transfer. Water samples will be taken for biological and chemical analyses in accordance with the laboratory specifications for the constituents.
Achievement of the EQCs will be assessed by comparing the post commissioning survey results with the EQC guideline triggers for the low and moderate LEPs (Table 6.1). The guideline value for each constituent will be calculated from a 6-week median (or both 6 week medians and spot samples for DO). Spot samples will be collected weekly with the median calculated at end of the six week period. The six-week median for each individual site will be compared to the relevant guideline value or the relevant Reference percentile. Reference percentiles will be calculated from the six-week median for each individual Reference site. For measuring DO, spot samples at each site will also be compared against the 60 % saturation outlined in Schedule 2 of MS 873
7.6 Revise EQCs and dilutions
Development of final triggers during the EQVRP will be based on a combination of long term monitoring data and real-time comparative reference sites. The revised EQC and dilutions will be derived following WET testing by assessing the species sensitivity distribution using the BurrliOZ software.
Operations Management and Monitoring
7.6 Revise EQCs and dilutions
Ongoing monitoring of the discharge streams will continue to determine that the revised EQCs are being achieved as part of the long term environmental management of the permanent waste water treatment and discharge facilities. The Operations Monitoring and Management proposed in Section 8.0 of this plan will be implemented until such time that the plan has been updated and approved to consider the requirements for ongoing monitoring on the basis of the results of the EQVRP.
Operations
8.1.1 Management: Typical Conditions
In the event of an exceedence requiring intervention, the first step is to determine if the cause of exceedence relates to design or operating parameters. Once design options are selected, an assessment of the risk that the dilutions and/or EQCs are not being achieved (including possible additional modelling) may be conducted to determine if proposed contingency options are likely to correct the observed exceedence. If a design option

Wheatstone Project Document No: WS0-0000-HES-PLN-CVX-000-00102-000 Permanent Onshore Facilities Waste Water Discharge Plan Revision: 4 Revision Date: 27/11/2015
© Chevron Australia Pty Ltd Company Confidential Page 86
Printed Date: 4/4/2016 Uncontrolled when printed
is required, relevant approval applications will be submitted as appropriate
8.1.2 Management: Unplanned Events
Prior to a predicted cyclone or rainfall event where the WWTPs may experience inundation of storm surge and/or flood water, the waste water present within the system will be discharged in-full to the onsite storage facilities. The wastewater equalisation tanks and the aerobic digesters at the CV are maintained at maximum level during storm events to ensure no wind damage will occur. The emergency shelter-in-place for a reduced workforce will direct its waste water to the sanitary sumps which pump to the CV WWTP for temporary holding and until such time that the WWTP is restarted.
The CV and LNG WWTPs, desalination plant, LNG PTF and waste water outfall will be equipped with monitoring devices for either continuous or composite sampling analysis. Depending on the detected parameters, appropriate corrective measures will be taken immediately. Corrective actions would be based on findings of any investigations and may entail modifications to the operation procedure and equipment or area layout.
In the event of an unplanned release, steps will be taken in accordance with the Oil Spill Environmental Response Plan as approved under EPBC 2008/4469 Condition 47that includes containing the release and cleaning up the release
8.2 Triggers
Two levels of Contingency Management triggers are proposed for Planned Operations to achieve the requirements of Condition 13 and Schedule 2 (MS 873) under Typical Conditions. The operations triggers described below are intended to initiate investigations and/or modifications for the purpose of achieving the EQCs.
Level 1 Trigger is based on a maximum instantaneous flow rate (pumping rate) during each discharge period of 674 m3/hr (Table 6.1). Readings in excess of the projected maximum flow rate specifications will trigger an investigation to determine the source of elevated readings, beginning with an evaluation of readings at the individual WWTPs and the seawater desalination system. Should an unplanned flow rate exceedence be detected, the pumping operations will be reduced until the flow rate falls below the defined maximum instantaneous rate. Pumps, in-line analyser(s) and alarms and effluent monitors will be inspected and repaired/replaced as necessary.
Level 2 Trigger is based on effluent concentrations recorded at the combined effluent sump outlet. Where Level 2 trigger value is reached, an investigation will be initiated to determine the cause of the trigger being reached including inspection and repair of in-line analyser(s) and alarms, and effluent monitors as necessary. Monitoring readings that reach Level 2 trigger values will be recorded and reported internally.
8.3 Effluent Monitoring Operations monitoring will be implemented as outlined in Table 6.2 at the combined effluent sump outlet. Operations monitoring will be completed through a combination of continuous inline monitoring and the analysis of composite samples collected on a weekly basis as detailed in Table 6.2, although if constituents

Wheatstone Project Document No: WS0-0000-HES-PLN-CVX-000-00102-000 Permanent Onshore Facilities Waste Water Discharge Plan Revision: 4 Revision Date: 27/11/2015
© Chevron Australia Pty Ltd Company Confidential Page 87
Printed Date: 4/4/2016 Uncontrolled when printed
are consistently well within compliance values, the frequency and the constituents in the monitoring program are likely to be re-evaluated.
Collected samples will be sent to a NATA accredited laboratory for evaluation of relevant water quality parameters. Water samples will be taken for biological and chemical analyses in accordance with the laboratory specifications for the constituents. Samples will be taken from the combined effluent sump outlet for each constituent during each sampling occasion. Readings for pH, salinity (by conductivity) and chlorine will be taken in-situ, with salinity measurements converted to a TDS equivalent for comparison with EQCs. Readings for pH, salinity (by conductivity) and chlorine will be taken in-situ, with salinity measurements converted to a TDS equivalent for comparison with EQCs.
Consistent with ANZECC & ARMCANZ (2000) guidelines, 10% of samples will be splits (randomly selected) and one sample will be taken as a 'blank'. The blank sample is prepared using the methods for field sampling but containers are filled with laboratory prepared distilled water, rather than discharge water.
8.4 Changes to Effluent Stream Composition
If the composition of a discharge changes significantly during typical operations from that described in Section 5.0, the requirements for validation monitoring as described in Section 7.0 will be reviewed and relevant monitoring will be performed if necessary.
Reporting
9.1 Effluent Quality Validation Report
Chevron Australia is required to submit a waste water discharge report to the DER and the Commonwealth Minister for the Environment within six months of commissioning of a discharge or within six months of any significant change in composition of a discharge, including any management actions necessary to achieve the EQOs and LEPs established through MS 873 Condition 13-1 and described in MS 873 Schedule 2.
Operations
In the event that monitoring undertaken as part of the EQVRP (Section 7.0) indicates that the environmental quality objectives and levels of ecological protection established through Conditions 13-1 and 13-9, and described in Schedule 2, are not being met, or are not likely to be met, a report of the findings of this monitoring will be provided to the CEO and the DER as soon as practicable, but within five working days of receiving the results, along with a description of the management actions to be taken to meet the required level of environmental quality.
Validation
9.2 Annual Compliance Reporting
As part of the preparation of the annual CARs, Chevron Australia will assess its compliance status against this Plan, which will be guided by the action table provided in Appendix A.
As Required
9.3 Non-compliance Reporting
MS 873 Condition 4-5 requires that any potential non-compliance, relevant to this Plan, will be reported to the CEO of the OEPA within five working days of that potential non-compliance being known. EPBC 2008/4469 Condition 3 requires non-compliance with this Plan to be reported to DOTE at the time the CAR is published on Chevron Australia’s website.
As required
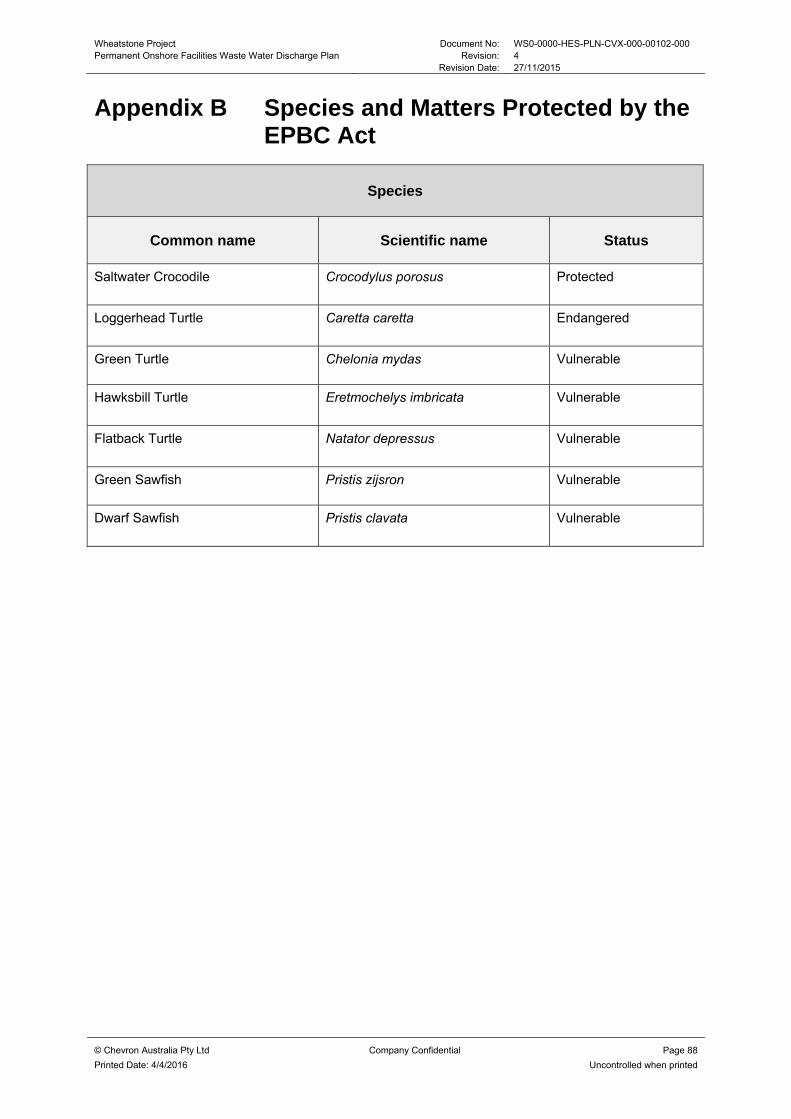
Wheatstone Project Document No: WS0-0000-HES-PLN-CVX-000-00102-000 Permanent Onshore Facilities Waste Water Discharge Plan Revision: 4 Revision Date: 27/11/2015
© Chevron Australia Pty Ltd Company Confidential Page 88
Printed Date: 4/4/2016 Uncontrolled when printed
Appendix B Species and Matters Protected by the EPBC Act
Species
Common name Scientific name Status
Saltwater Crocodile Crocodylus porosus Protected
Loggerhead Turtle Caretta caretta Endangered
Green Turtle Chelonia mydas Vulnerable
Hawksbill Turtle Eretmochelys imbricata Vulnerable
Flatback Turtle Natator depressus Vulnerable
Green Sawfish Pristis zijsron Vulnerable
Dwarf Sawfish Pristis clavata Vulnerable
Wheatstone Project Document No: WS0-0000-HES-PLN-CVX-000-00102-000 Permanent Onshore Facilities Waste Water Discharge Plan Revision: 4 Revision Date: 27/11/2015
© Chevron Australia Pty Ltd Company Confidential Page 89
Printed Date: 4/4/2016 Uncontrolled when printed
Appendix C Modelling Results
Overview
Table A 1, Table A 2, Table A 4 and Table A 5 included in this appendix provide the number of dilutions to meet the EQO. They also show effluent discharge concentrations along with predicted concentrations of modelled constituents for two simulations representing typical summer and winter ambient and operating conditions, respectively. As described in Section 5.1, the two simulations each of one month duration represent differing character of the intake seawater and differing requirements and operations of the permanent waste water treatment and discharge facilities over a year. The results show that all four selected constituents meet their respective environmental target concentrations at the outer boundaries of the Low and Moderate LEP zones, with the exception of situations where the ambient concentration is already at or above stipulated target concentration.
Table A 3 and Table A 6 show the highest mean and maximum concentrations for selected relevant constituents at the seawater intake location for the two simulations. They also show Percentage Exceedence which is calculated as the percentage time that the instantaneous concentration is below the lower bound or above the upper bound over the entire duration of the simulation. The predicted concentrations at the intake show that both the mean and temporal max values are within the acceptable range at the intake, with the exception of Ntot for which the imposed summer ambient concentration is itself above the maximum design value for the desalination plant. No degradation in the performance of the onshore facilities is anticipated due to any seawater intake recirculation.

Wheatstone Project Document No: WS0-0000-HES-PLN-CVX-000-00102-000 Permanent Onshore Facilities Waste Water Discharge Plan Revision: 4 Revision Date: 27/11/2015
© Chevron Australia Pty Ltd Company Confidential Page 90
Printed Date: 4/4/2016 Uncontrolled when printed
Table A 1: Simulation 1 Results at Low LEP Boundary - Typical Summer Conditions
Effluent Constituent
Seawater Intake
Concentration (Camb), (mg/L)
Effluent Discharge Concentration
Range (Ceff0), (mg/L)
Low Ecological Protection Boundary
Max median Concentration(1) at
Low LEP Boundary(Ceffm),
(mg/L)
EQC for Low LEP Boundary (Ccrm), (mg/L)
Range of Dilutions Required to Meet EQCs at Low LEP Boundary(Dcrm)(2)
Effective Dilution over 28 Days at Low
LEP Boundary(Deffm)(2)
Below EQC (YES/NO)
Min Max Min Max Median
TDS 34 900 26 904 45 809 34 903 39 500 N/A 2 3895 YES
Ntot 0.24 1.5 2.8 0.240 0.260 63 128 6244 YES
Ptot 0.0075 0.15 0.31 0.0075 0.0175 15 31 6480 YES
O&G TSE 0.0 0.60 1.33 0.005 0.25 3 6 289 YES
Notes:
(1) Median Concentration is calculated as the median value of the model results over the entire duration of the simulation (28 days). For O&G TSE the 95th percentile is used instead of the median.
(2) Dcrm = (Ceff0 – Camb)/(Ccrm – Camb); Deffm = (Ceff0 – Camb)/(Ceffm – Camb).

Wheatstone Project Document No: WS0-0000-HES-PLN-CVX-000-00102-000 Permanent Onshore Facilities Waste Water Discharge Plan Revision: 4 Revision Date: 27/11/2015
© Chevron Australia Pty Ltd Company Confidential Page 91
Printed Date: 4/4/2016 Uncontrolled when printed
Table A 2: Simulation 1 Results at Moderate LEP Boundary - Typical Summer Conditions
Effluent Constituent
Seawater Intake
Concentration (Camb), (mg/L)
Effluent Discharge Concentration
Range (Ceff0), (mg/L)
Moderate Ecological Protection Boundary
Max median Concentration(1) at
Moderate LEP Boundary (Ceffh),
(mg/L)
EQCs for Moderate LEP
Boundary (Ccrh), (mg/L)
Range of Dilutions Required to Meet EQCs at Moderate
LEP Boundary (Dcrh)(2)
Effective Dilution over 28 Days at Moderate LEP
Boundary (Deffh)(2)
Below EQCs
(YES/NO)
Min Max Min Max Median
TDS 34 900 26 904 45 809 34 901 39 400 N/A 3 >10 000 YES
Ntot(3) 0.24 1.5 2.8 0.240 0.225 N/A N/A >10 000 NO
Ptot(3) 0.0075 0.15 0.31 0.0075 0.0075 N/A N/A >10 000 NO
O&G TSE 0.0 0.60 1.33 0.001 0.25 3 6 1458 YES
Notes:
(1) Median Concentration is calculated as the median value of the model results over the entire duration of the simulation (28 days). For O&G TSE the 95th percentile is used instead of the median.
(2) Dcrh = (Ceff0 – Camb)/(Ccrh – Camb); Deffh = (Ceff0 – Camb)/(Ceffh – Camb).
(3) The constituent meets the target concentration, with the exception of situations where the ambient concentration is already at or above the target concentration.

Wheatstone Project Document No: WS0-0000-HES-PLN-CVX-000-00102-000 Permanent Onshore Facilities Waste Water Discharge Plan Revision: 4 Revision Date: 27/11/2015
© Chevron Australia Pty Ltd Company Confidential Page 92
Printed Date: 4/4/2016 Uncontrolled when printed
Table A 3: Simulation 1 Results at the Seawater Intake - Typical Summer Conditions
Effluent Constituent
Seawater Intake
Concentration (mg/L)
Effluent Discharge
Concentration Range (mg/L)
Temporal Mean Concentration(2)
at Intake location (mg/L)
Temporal Max Concentration(2)
at Intake location (mg/L)
Lower Bound of Design
Concentration Range for
Intake (mg/L)
Upper Bound of Design
Concentration Range for
Intake (mg/L)
Percentage Exceedance(3) below Lower
Bound
Percentage Exceedance(3) above Upper
Bound
TDS(1) 34 900 27 303 to 45 809 34 903 34 941 34 500 39 700 0 0
Ntot(1)(4) 0.24 1.5 to 2.8 0.240 0.257 0 0.2 0 100
Ptot1 0.0075 0.15 to 0.31 0.00755 0.00948 0 0.01 0 0
O&G TSE(1) 0.0 0.60 to 1.33 0.0 0.009 0 100 0 0
Notes:
(1) Raw Sea Water Intake data taken from mean March 2011 values in “Wheatstone LNG Development: Outfall Baseline Report - Water Quality around the Proposed Nearshore Outfall”, Report No. MSA188R1, 30 January 2013 (MScience 2013).
(2) Temporal Mean and Max Concentrations are calculated for a time series containing the vertical maximum concentration at each output time step at the location of the intake.
(3) Percentage Exceedence is calculated as the percentage time that the instantaneous concentration is above the upper bound over the entire duration of the simulation (28 days).
(4) The summer ambient Ntot concentration is already above max design value for the desalination plant and therefore the Ntot predicted concentration does not meet the acceptable design range at the intake.

Wheatstone Project Document No: WS0-0000-HES-PLN-CVX-000-00102-000 Permanent Onshore Facilities Waste Water Discharge Plan Revision: 4 Revision Date: 27/11/2015
© Chevron Australia Pty Ltd Company Confidential Page 93
Printed Date: 4/4/2016 Uncontrolled when printed
Table A 4: Simulation 2 Results at Low LEP Boundary - Typical Winter Conditions
Effluent Constituent
Seawater Intake
Concentration (Camb), (mg/L)
Effluent Discharge
Concentration Range (Ceff0),
(mg/L)
Moderate Ecological Protection
Max median Concentration(1)
at Low LEP Boundary
(Ceffm), (mg/L)
EQCs for Low LEP Boundary (Ccrm), (mg/L)
Range of Dilutions Required to Meet EQCs at Low LEP Boundary (Dcrm)(2)
Effective Dilution over 28 Days at
Low LEP Boundary (Deffm)(2)
Below EQCs (YES/NO)
Min Max Min Max Median
TDS(3) 39 500 24 183 57 436 39 500 39 500 N/A N/A >10 000 NO
Ntot 0.16 1.5 5.2 0.160 0.260 14 51 >10 000 YES
Ptot 0.005 0.16 0.58 0.0050 0.0175 13 46 >10 000 YES
O&G TSE 0.0 0.11 0.42 0.001 0.25 1 2 539 YES
Notes:
(1) Median Concentration is calculated as the median value of the model results over the entire duration of the simulation (28 days). For O&G TSE the 95th percentile is used instead of the median.
(2) Dcrm = (Ceff0 – Camb)/(Ccrm – Camb); Deffm = (Ceff0 – Camb)/(Ceffm – Camb).
(3) The constituent meets the target concentration, with the exception of situations where the ambient concentration is already at or above the target concentration.

Wheatstone Project Document No: WS0-0000-HES-PLN-CVX-000-00102-000 Permanent Onshore Facilities Waste Water Discharge Plan Revision: 4 Revision Date: 27/11/2015
© Chevron Australia Pty Ltd Company Confidential Page 94
Printed Date: 4/4/2016 Uncontrolled when printed
Table A 5: Simulation 2 Results at Moderate LEP Boundary - Typical Winter Conditions
Effluent Constituent
Seawater Intake
Concentration (Camb), (mg/L)
Effluent Discharge
Concentration Range (Ceff0),
(mg/L)
High Ecological Protection
Max median Concentration(1)
at Moderate LEP Boundary (Ceffh), (mg/L)
EQCs for Moderate
LEP Boundary
(Ccrh), (mg/L)
Range of Dilutions Required to Meet EQCs at Low LEP Boundary (Dcrm)(2)
Effective Dilution over 28 Days at Moderate LEP
Boundary (Deffh)(2) Below EQCs
(YES/NO)
Min Max Min Max Median
TDS 39 500 24 183 57 436 39 500 39 400 154 N/A >10 000 NO
Ntot(3) 0.16 1.5 5.2 0.160 0.225 21 78 >10 000 YES
Ptot(3) 0.005 0.16 0.58 0.0050 0.0075 62 230 >10 000 YES
O&G TSE 0.0 0.11 0.42 0.0 0.25 1 2 1987 YES
Notes:
(1) Median Concentration is calculated as the median value of the model results over the entire duration of the simulation (28 days). For O&G TSE the 95th percentile is used instead of the median.
(2) Dcrh = (Ceff0 – Camb)/(Ccrh – Camb); Deffh = (Ceff0 – Camb)/(Ceffh – Camb).
(3) The constituent meets the target concentration, with the exception of situations where the ambient concentration is already at or above the target concentration.

Wheatstone Project Document No: WS0-0000-HES-PLN-CVX-000-00102-000 Permanent Onshore Facilities Waste Water Discharge Plan Revision: 4 Revision Date: 27/11/2015
© Chevron Australia Pty Ltd Company Confidential Page 95
Printed Date: 4/4/2016 Uncontrolled when printed
Table A 6: Simulation 2 Results at the Seawater Intake - Typical Winter Conditions
Effluent Constituent
Seawater Intake
Concentration (mg/L)
Effluent Discharge
Concentration Range (mg/L)
Temporal Mean Concentration(2)
at Intake location (mg/L)
Temporal Max Concentration(2)
at Intake location (mg/L)
Lower Bound of Design
Concentration Range for
Intake (mg/L)
Upper Bound of Design
Concentration Range for
Intake (mg/L)
Percentage Exceedance(3) below Lower
Bound
Percentage Exceedance(3) above Upper
Bound
TDS(1) 39 500 31 772 to 57 436 39 501 39 533 34 500 39 700 0 0
Ntot(1) 0.16 1.5 to 5.2 0.161 0.166 0 0.2 0 0
Ptot(1) 0.005 0.16 to 0.58 0.00506 0.00566 0 0.01 0 0
O&G TSE(1) 0.0 0.11 to 0.42 0.0 0.0 0 100 0 0
Notes:
(1) Raw Sea Water Intake data taken from mean March 2011 values in “Wheatstone LNG Development: Outfall Baseline Report - Water Quality Around The Proposed Nearshore Outfall”, Report No. MSA188R1, 30 January 2013 (MScience 2013).
(2) Temporal Mean and Max Concentrations are calculated for a time series containing the vertical maximum concentration at each output time step at the location of the intake.
(3) Percentage Exceedence is calculated as the percentage time that the instantaneous concentration is above the upper bound over the entire duration of the simulation (28 days).