what’s in a gene: undergraduates’ ideas and …
TRANSCRIPT
University of Kentucky University of Kentucky
UKnowledge UKnowledge
Theses and Dissertations--Science, Technology, Engineering, and Mathematics (STEM) Education
Science, Technology, Engineering, and Mathematics (STEM) Education
2016
WHAT’S IN A GENE: UNDERGRADUATES’ IDEAS AND WHAT’S IN A GENE: UNDERGRADUATES’ IDEAS AND
MISCONCEPTIONS ABOUT GENE FUNCTION MISCONCEPTIONS ABOUT GENE FUNCTION
Justin M. LeVaughn University of Kentucky, [email protected] Digital Object Identifier: http://dx.doi.org/10.13023/ETD.2016.097
Right click to open a feedback form in a new tab to let us know how this document benefits you. Right click to open a feedback form in a new tab to let us know how this document benefits you.
Recommended Citation Recommended Citation LeVaughn, Justin M., "WHAT’S IN A GENE: UNDERGRADUATES’ IDEAS AND MISCONCEPTIONS ABOUT GENE FUNCTION" (2016). Theses and Dissertations--Science, Technology, Engineering, and Mathematics (STEM) Education. 6. https://uknowledge.uky.edu/stem_etds/6
This Master's Thesis is brought to you for free and open access by the Science, Technology, Engineering, and Mathematics (STEM) Education at UKnowledge. It has been accepted for inclusion in Theses and Dissertations--Science, Technology, Engineering, and Mathematics (STEM) Education by an authorized administrator of UKnowledge. For more information, please contact [email protected].

STUDENT AGREEMENT: STUDENT AGREEMENT:
I represent that my thesis or dissertation and abstract are my original work. Proper attribution
has been given to all outside sources. I understand that I am solely responsible for obtaining
any needed copyright permissions. I have obtained needed written permission statement(s)
from the owner(s) of each third-party copyrighted matter to be included in my work, allowing
electronic distribution (if such use is not permitted by the fair use doctrine) which will be
submitted to UKnowledge as Additional File.
I hereby grant to The University of Kentucky and its agents the irrevocable, non-exclusive, and
royalty-free license to archive and make accessible my work in whole or in part in all forms of
media, now or hereafter known. I agree that the document mentioned above may be made
available immediately for worldwide access unless an embargo applies.
I retain all other ownership rights to the copyright of my work. I also retain the right to use in
future works (such as articles or books) all or part of my work. I understand that I am free to
register the copyright to my work.
REVIEW, APPROVAL AND ACCEPTANCE REVIEW, APPROVAL AND ACCEPTANCE
The document mentioned above has been reviewed and accepted by the student’s advisor, on
behalf of the advisory committee, and by the Director of Graduate Studies (DGS), on behalf of
the program; we verify that this is the final, approved version of the student’s thesis including all
changes required by the advisory committee. The undersigned agree to abide by the statements
above.
Justin M. LeVaughn, Student
Dr. Rebecca Krall, Major Professor
Dr. Molly Fisher, Director of Graduate Studies

1
WHAT’S IN A GENE: UNDERGRADUATES’ IDEAS AND MISCONCEPTIONS ABOUT GENE FUNCTION
THESIS
A thesis submitted in partial fulfillment of the requirements for the degree of Master of Science in STEM Education in the College of Education at the University of Kentucky
By
Justin LeVaughn
Lexington, KY
Director: Dr. Rebecca McNall Krall, Associate Professor of STEM Education
Lexington, KY
2015
Copyright © Justin LeVaughn 2016

i
ABSTRACT OF THESIS
WHAT’S IN A GENE: UNDERGRADUATES’ IDEAS AND MISCONCEPTIONS ABOUT GENE FUNCTION
The purpose of this study was to field test a two-tiered instrument including multiple-choice and short answer tasks to assess college students’ ideas and level of understanding in genetics. The instrument was constructed from previously tested assessment tasks and findings from the current research literature. Ninety-seven freshmen enrolled in a biology lab course were surveyed. Test validity and reliability were measured using Chronbach coefficients. Multiple-choice and short answer responses were analyzed using descriptive statistics to identify frequencies of answer selections. Written responses were independently evaluated using a five-point scoring rubric by three researchers to identify common misconceptions revealed in students’ written responses. A purposeful stratified sample of 15 students was selected across low, middle, and high performance on the instrument for individual interviews.
Findings revealed that undergraduates have a variety of ideas concerning gene concepts. While the instrument revealed student conceptual difficulties, there also were issues with previously tested survey items. The findings suggest students possess superficial understanding regarding transcription and translation. Students also hold hybrid conceptual models of gene structure and function. The paper presents a critique of the instrument and discusses the broader impacts to teaching and learning college biology. Recommendations for improving assessment techniques also are discussed.
KEYWORDS: misconceptions, two-tiered assessment, gene expression, undergraduate
education, conceptual change
Justin LeVaughn
4/28/2016
i
WHAT’S IN A GENE: UNDERGRADUATES’ IDEAS AND MISCONCEPTIONS ABOUT GENE FUNCTION
By
Justin LeVaughn
Rebecca Krall
(Director of Thesis)
Molly Fisher
(Director of Graduate Studies)
4/28/2016

iii
Acknowledgments
I would like to dedicate this project to my loving wife, Ashley LeVaughn who
supported me thorough out this project. I would also like to acknowledge the help and
support from Dr. Rebecca Krall and Dr. Lin Xiang in providing critical feedback, as well
as, assisting the analysis protocol helping, and to develop and refine the individual
question scoring rubrics. Doing this alone would have been a monumental task, and their
combined experience provided critical insights in developing a comprehensive evaluation
instrument. I would also like to thank my committee members: Dr. Rebecca Krall, Dr.
Jennifer Wilhelm, and Dr. Jeffery Osborne for their support and feedback. Additionally,
the encouragement from everyone involved in this project was a major factor for me
completing this project and pursuing future areas of study in undergraduate STEM
education.
iv
Table of Contents
Acknowledgments ................................................................................................................................... iii LIST OF TABLES ......................................................................................................................................... vi
LIST OF FIGURES ..................................................................................................................................... vii
CHAPTER 1 INTRODUCTION ................................................................................................................ 1 Objective .................................................................................................................................................................. 2 Research Questions ............................................................................................................................................. 2 Categories Of Misconceptions ........................................................................................................................ 3 Summary .................................................................................................................................................................. 8
CHAPTER 2 REVIEW OF LITERATURE ............................................................................................. 9 Historical Development Of Gene Models ................................................................................................... 9 What Should Undergraduates Know About Gene Expression? ...................................................... 16 Student Misconceptions Of Gene Expression ......................................................................................... 20
What Is A Gene? ............................................................................................................................................. 20 How Do Genes Function? ........................................................................................................................... 24 Misconceptions Related To Abstract Levels Of Organization .................................................... 28 Applying Gene Expression Concepts To Biological Systems ...................................................... 30
Theoretical Framework: Conceptual Change ........................................................................................ 32 Summary ................................................................................................................................................................ 37
CHAPTER 3 METHODOLOGY ............................................................................................................. 39 Study Participants .............................................................................................................................................. 39 Study Design ......................................................................................................................................................... 41 Two Tiered Survey Instrument .................................................................................................................... 43 Data Analyses ....................................................................................................................................................... 46 Summary ................................................................................................................................................................ 48
CHAPTER 4 FINDINGS .......................................................................................................................... 49 Cronbach’s Coefficient Alpha ........................................................................................................................ 50 Nature Of Genetic Material ............................................................................................................................ 51
Question 1: Structure Of A Gene ............................................................................................................. 52 Question 7: Differential Gene Expression .......................................................................................... 58 Question 8: Function Of A Gene .............................................................................................................. 62
Gene Expression ................................................................................................................................................. 71 Question 2: Directionality Of Gene Expression ................................................................................ 72 Question 3: Process Of Transcription .................................................................................................. 82 Question 4: Process Of Translation ....................................................................................................... 89
Molecular Properties And Functions ......................................................................................................... 95 Question 5: Molecules In A Biological System .................................................................................. 96 Question 6: Molecular Property Related To Function ............................................................... 102
Genetic Behaviors ........................................................................................................................................... 106 Question 10: Mutations To Protein Function ................................................................................ 107 Question 11:Mutations To Traits ........................................................................................................ 114
v
CHAPTER 5 DISCUSSION .................................................................................................................. 120 Ideas Uncovered in Survey Instrument ................................................................................................. 120
Questions 1, 7 & 8: Nature Of Genetic Material ............................................................................ 121 Questions 2 – 4: Gene Expression ....................................................................................................... 124 Questions 5 & 6: Molecular Properties And Functions ............................................................. 130 Questions 10 & 11: Genetic Behavior ............................................................................................... 132
Evaluation of the Survey Instrument ..................................................................................................... 133 Cronbach’s alpha and Issues with survey reliability .................................................................. 133 Potential Issues with Survey Questions ........................................................................................... 136 Summary ....................................................................................................................................................... 139
Implications to Teaching and Learning Gene Expression ............................................................. 140 Levels of Understanding and Historical Gene Models ............................................................... 140 Conceptual Change and Understanding Gene Structure/Function Relationships ........ 142 Potential Impacts and Improving Learning ................................................................................... 146
Study Limitations and Future Research ................................................................................................ 148 Conclusions and Recommendations ....................................................................................................... 149
APPENDIX ................................................................................................................................................ 152 Two Tiered Survey Instrument With Evaluation Rubrics ............................................................. 152
REFERENCES ......................................................................................................................................... 166
VITA ........................................................................................................................................................... 172

vi
LIST OF TABLES
Table 1.1 Categories of Scientific Misconceptions (NRC, 1997) ....................................... 5 Table 3.1 Study Participant Demographics: Gender, Ethnicity, and Major of Study (n=97) ........................................................................................ 41 Table 3. 2 General Evaluation Rubric for Student Short Answers .................................... 42 Table 4. 1 Chronbach Coefficients of Instrument Question Domains .............................. 51 Table 4. 2 Question 1 Student Response Pattern Percentages ......................................... 54 Table 4. 3 Question 7 Student Response Pattern Percentages ........................................... 60 Table 4. 4 Question 8 Student Response Pattern Percentages ........................................... 64 Table 4. 5 Question 8 Tier Two Coding Categories .......................................................... 65 Table 4. 6 Question 2 Student Response Pattern Percentages ........................................... 74 Table 4. 7 Question 2 Common Theme Categories .......................................................... 75 Table 4. 8 Question 3 Student Response Pattern Percentages ........................................... 84 Table 4. 9 Question 3 Common Theme Categories .......................................................... 85 Table 4. 10 Question 4 Student Response Pattern Percentages ......................................... 91 Table 4. 11 Question 4 Common Theme Categories ........................................................ 92 Table 4. 12 Question 5 Student Response Pattern Percentages ......................................... 98 Table 4. 13 Question 5 Tier Two Common Theme Categories ........................................ 98 Table 4. 14 Question 6 Student Response Pattern Percentages ....................................... 103 Table 4. 15 Question 10 Student Response Pattern Percentages ..................................... 109 Table 4. 16 Question 10 Tier Two Common Theme Categories .................................... 110 Table 4. 17 Question 11 Student Response Pattern Percentages ..................................... 115 Table 4. 18 Question 11 Tier Two Common Theme Categories .................................... 116

vii
LIST OF FIGURES Figure 2. 1 Modern Model of Gene Function Concept Map (Gericke & Hagberg 2007) .............................................................................. 14 Figure 3. 1 Outline Of Study Design And Analyses ..................................................................... 43 Figure 3. 2 Overarching Concepts by Survey Item Groupings .................................................. 45 Figure 3. 3 Coding Example for Short Answer Responses ......................................................... 48 Figure 4. 1 Queen's Drawing used to Explain Question 2 Reasoning ..................................... 81 Figure 5. 1 Applying Student Reasoning Across Ontologically Distinct Levels of
Organization ................................................................................................................................... 145
1
CHAPTER 1 INTRODUCTION
What has been identified in terms of what students know about genetics? In
particular, how do students conceptualize a gene and its function within living systems?
The biological processes of how information in DNA is expressed into usable proteins
(often called central dogma e.g. DNAàRNAàProtein), and proteins interactions within
that system, as a whole, can seem daunting to most students. The process can seem to be
a complex and involved process for students to learn both conceptually and
mechanistically (Fisher, 1983; Guzman & Bartlett, 2012; Jensen et al., 2013). Still,
students need to understand that the molecular structure and composition limits the
function of each of the components within the process. For example, the molecular
structures of nucleotides connect to ideas about base-pairing rules to allow information to
be stored within the double-stranded DNA molecule. Thus, the three dimensional
structure of proteins and enzymes that regulate and catalyze the necessary reactions also
restrict how those molecules behave in the system allowing the information stored in
genes to be read and expressed in the system; and on and on.
The purpose of this study is to better understand college students’ conceptions
about genes and gene expression (especially, how genes are expressed into proteins) of
college freshmen enrolled in an introductory biology course for science majors. The
main goal of this study is to create a two-tiered multiple-choice and short answer survey
instrument used to identify student preconceptions about gene expression targeted to
student reasoning regarding fundamental concepts in genetics. In a two-tiered survey,
each question consists of two parts. The first tier assesses student content knowledge

2
about a concept, while the second tier assesses the reasoning behind the tier-one answer
choice.
Objective
The purpose of this study is twofold: (1) to create a two-tiered multiple-choice,
short answer survey instrument to identify college student conceptual difficulties about
gene expression, and (2) to better understand student conceptual misunderstandings
(National Research Council, NRC, 1997) about genes and gene expression. The main
goal of this study is to develop and field test a survey instrument used to identify student
existing conceptions about gene expression, and student reasoning regarding fundamental
concepts in genetics. Because genetics is a very broad topic in biology, this study will
focus on student knowledge about gene expression; that is how genetic material in the
form of DNA is expressed into protein functional units, and how those units exert an
expressed function or interact in a biological system.
Research Questions
The research questions that guided this study are as follows:
1. How well does the two-tiered survey instrument measure student ideas about
gene expression?
2. What level of understanding do freshmen science majors have about the
nature of genes and gene expression?
3. What reasonings do students use to explain processes and outcomes of gene
expression?

3
Categories Of Misconceptions
Biology Educators are not strangers to the notion that students find science
difficult. The question of why learning science is difficult seems to plague both students
and educators alike, so why does science seem so damn hard? Roth (1990) states that for
many students science is commonly seen as a list of facts and vocabulary instead of a
deeper understanding of concepts and the process of science. Furthermore as science and
technology become increasing intertwined into society and culture, students will need to
possess that deeper understanding in relation to issues around fundamental concepts in
science. Roth (1990) refers to this approach to learning science as meaningful conceptual
understanding.
According to Coley &Tanner (2013), there are a variety of ideas that students find
difficult to learn, understand and teach effectively. Other learning difficulties that can
influence development of meaningful conceptual understanding include how students
think about and view science. In the case of this paper, what are student’s conceptual
difficulties in the learning of genetics? Additionally, biology educators have shown
increased interest in identifying and understanding student misconceptions and their
effect on learning of certain biological concepts (Maskiewicz, 2013). But, can all
misconceptions be classified the same?
The following section builds on the views presented in misconceptions research
by researchers such as Roth (1990) and Maskiewicz and Lineback (2013) as it applies to
biology education. This literature review begins with a review of five categories often
used to categorize scientific misconceptions. These categories can be used as an
analytical framework for considering conceptual difficulties students often experience in
4
learning genetic concepts. Following this framework are sections summarizing the
current scientific model used to describe gene structure and function, and a section
describing specific content undergraduates are expected to know about genes and gene
function. Lastly, this literature review will conclude with an examination of conceptual
difficulties cited in the research literature related to students’ understanding of gene
expression both in K-12 and undergraduate students.
More often than not, Biology educators may associate misconceptions as wrong
ideas that need to be corrected (Roth 1990; Smith, diSessa & Roschelle 1993;
Maskiewicz & Lineback, 2013). However, not all misconceptions are the same. In a
review of 41 papers published in in the journal Cell Biology Education from 2010 – 2012,
Mackiewcz and Lineback (2013) concluded that misconceptions used biology education
were not clearly defined in relation to a theory of learning, and were commonly described
as wrong ideas to be corrected, eradicated or replaced. Such a view contradicts research
in learning sciences (Roth 1990; Smith, diSessa & Roschelle 1993; Maskiewicz &
Lineback 2013). The premise of misconceptions as flawed ideas contradicts a
constructivist view and the central role of student prior understanding in the construction
and reorganization of knowledge (Smith et al. 1993; Maskiewicz & Lineback 2013).
Research on how students learn science indicates that instead of being a correction of
prior ideas, science learning follows a process of continuous construction and
reorganization of knowledge (Smith et al. 1993; Donovan & Bransford, 2005). In other
words, the learner plays a primary role in the generation of knowledge based on prior
understanding and how new knowledge is incorporated into a developing framework of
understanding. Roth (1990) and Maskiewcz (2013) also cite research on how the science

5
of learning has attempted to provide specific definitions and/or terms for what constitutes
a misconception, including alternative conceptions and naïve theories. Although helpful
distinctions in particular contexts, Roth (1990) notes that regardless of the label attached
to student ideas, all of those terms share a common theme in knowledge construction.
This vague clarification of misconceptions calls for more specificity in their
categorization. The goal in this section is to provide a common, heuristic approach in
thinking about misconceptions. Here, misconceptions should encompass conceptual
frameworks rooted in constructivism as they relate to conceptual change theory. In
Science Teaching Reconsidered: A Handbook (National Research Council, NRC, 1997),
the National Research Council (1997) describes five general categories of misconceptions
summarized from the research literature: 1) preconceived notions, 2) non-scientific
beliefs, 3) conceptual misunderstandings, 4) vernacular misconceptions and 5) factual
misconceptions. What follows is a brief description of each category. The five major
categories of misconceptions are summarized in Table 1.1.
Table 1.1 Categories of Scientific Misconceptions (NRC, 1997)
Category Description Preconceived notions Naïve and scientifically inaccurate explanations students
develop through interaction with their world; embedded in everyday experiences
Non-scientific beliefs Religious views, popular opinion, or personal beliefs held which out outside of science education
Conceptual misunderstandings
Prior knowledge in which concepts are not effectively reorganized in mental frameworks; through instruction

6
Table continued from page 5
Factual misconceptions Misunderstanding occurring from mismatches between prior knowledge and newly integrated knowledge
Vernacular misconceptions Improper usage vocabulary or use everyday terms to describe concepts used in science
Sources from where children construct misconceptions determine the
characteristics of each category. For example, preconceived notions are naïve
explanations children develop through everyday interaction with their world. These ideas
can be tenacious because children have found them useful and well supported in
explaining natural phenomena they observe and/or experience. An example of a
preconceived notion is the naïve understanding that cold flows out of an area or object as
heat flows in. The entity of cold is a common misconception developed because of the
perceived nature of the feeling of cold children experience at a very young age (Driver,
1994). In contrast, non-scientific beliefs are views from outside science education. These
can range from religious views, popular opinion, or personal beliefs. The two may sound
similar, however, the distinction between them is that preconceived notions can be
thought of as conceptions that are formed independently based on the individual’s
observations to explain, while non-scientific beliefs would be considered individual or
group accepted beliefs that might contradict scientific concepts. Conceptual
misunderstandings are an extension of preconceived notions and non-scientific beliefs.
Conceptual misunderstandings occur through instruction by which the newly experienced
concepts may not effectively reorganize in lieu of a student’s prior knowledge.
Among the other categories, vernacular misconceptions and factual
misconceptions may arise from mismatches between the teacher’s intentions and student

7
learning. Factual misconceptions arise from unchallenged prior knowledge. This results
in inaccurate information being internalized at an early age and might persist, if left
unchallenged. Similarly, vernacular misconceptions can appear through improper usage
or the meaning of words used in science versus those used in an everyday context. The
two words are used interchangeably, but convey different ideas or meanings. An example
of this is the scientific use of the word theory as a unifying explanation with significant
evidentiary support versus to the everyday use of theory as a guess or a hunch.
Additionally, these two categories of misconceptions can encompass students’
understanding that is more sophisticated rather than being simply vocabulary driven, but
still developing in terms of scientific accuracy or complexity. An example of this
advancement is evident in the progression of understanding of genes as passive particles
coding for genetic information to the understanding of genes as more active units
involved in the production of a given trait (Lewis & Kattmann, 2004).
Why should educators consider what comprises a misconception? One take away
from misconception research is that student’s initial thoughts can be valuable resources
on which to build more sophisticated understanding. However, an initial faulty
understanding can inhibit the development of a more complex conceptual framework.
Furthermore, students’ ideas can be extremely diverse as they attempt to make sense of
existing knowledge structures with new concepts. Another important piece of the puzzle
is how scientists define abstract concepts, such as genes and gene function. Often
students’ naïve notions are parallel to the ideas early scientists demonstrated about
specific natural phenomena before the development of current scientific views.
Therefore, identification of historic models once used to explain natural phenomena can

8
be useful tools in understanding and even predicting student misconceptions. What kinds
of historical models have been used to define genes, and do they relate to conceptual
difficulties faced by students? Answers to these questions will help elucidate
misconceptions students often demonstrate about gene and gene expression.
Summary
The goal of this study is to add to the research literature regarding the teaching
and learning of key concepts in biology. The objective of this study is to develop and
field test a survey assessing undergraduates knowledge concerning how genetic material
is expressed in the body, or central dogma of biology. The proceeding sections will
describe common student ideas present in the research literature, as well as what students
are expected to know about gene expression with college biology.

9
CHAPTER 2 REVIEW OF LITERATURE
The following section includes a review of the research literature concerning what
scientific concepts involved within gene structure and function including the historical
development in scientific understanding of a gene, as well as what college
undergraduates are expected to understand about gene function. Additionally common
conceptions of gene structure and function as also described in both k-12 and college
students. Lastly, other literature regarding how students conceptualize complex
biochemical systems and gene expression are presented.
Historical Development Of Gene Models
Before an examination of what students know about basic ideas in genetics (i.e., what
is a gene, and how does they function), we need to consider how the concept of a gene
has developed and how the scientific model of the gene has changed over time. This
section serves to outline the power in understanding scientific models and how the
development of those models can parallel the development of students’ ideas about genes
and their function. Here, the comparison is drawn using Gericke and Hagberg’s (2007)
categorization of five major historical models of gene function.
To most scientists, the concept of a gene is not well defined. One reason is that as
discoveries and new knowledge are found, the concept of a gene begins to encompass an
increasing body of knowledge. Further complicating the learning about genes and gene
expression is the abstract nature of the gene concept and the multiple meanings of genes
accepted in different sub-disciplines in biology (Flodin, 2009; Santos, Joaqium & El-
Hani, 2012). Furthermore, the concept of a gene is fundamental to the development of

10
many other concepts in the field of genetics (Gericke & Hagberg, 2007). As knowledge
in genetics has progressed, scientists have needed to develop different ways of explaining
natural phenomena in the form of different scientific models. Throughout time, these
models must be elaborated and/or changed (sometimes considerably) to fit the current
understanding of the field. This is what Gericke and Hagberg (2007) express as historical
models. Nonetheless, these historical models are still used in science education (Gericke
& Hagberg, 2007; Flodin, 2009), and are often used to convey to students what they are
to learn about genes and gene expression.
In their review, Gericke and Hagberg (2007) provide a detailed examination of
five major historical models scientists have used to describe gene function. Each model
has attempted to operationally define a gene in terms of genetic transmission,
recombination, mutation and function. To determine these models, the authors describe
the development of gene function models by the ideas involving the structure of genes,
how those genes are organized, what processes relate to genes and the entities that
influence an organism. These models are defined as the Mendelian model, the Classical
model, the Biochemical-Classical model, the Neo classical model and the Modern model.
What follows is a description of these historical models looking briefly how those ideas
developed within the scientific community, and how those models can translate into
student understanding about gene function.
In the Mendelian model, a gene is described as the unit of inheritance. More
specifically, the gene was a unit responsible for transmitting or determining a trait
(Santos et al., 2012). The Mendelian model, developed in the nineteenth century, was
influential in describing how phenotypic traits were transmitted between organisms and

11
followed regular patterns. According to Gericke and Hagberg (2007), when Mendel’s
work was rediscovered in the early 1900s, scientists expanded on the idea of the gene as
the unit of inheritance. Under this model, the focus of genes was not how they functioned
within an organism, but rather on explaining the phenomenon of how genetic information
was transmitted and inherited. Because of this, the genotype was regarded as the
phenotype (in miniature single cell, i.e. a homunculus) and an abstract entity without a
chemical or physiological connection to a given trait (Gericke & Hagberg, 2007). This
concept of the gene also established the main unitary relationship between genes and
traits (Santos et al., 2012).
The Classical model began with the work of T.H. Morgan in 1911 through the
development of the chromosome theory of heredity. This sparked a new understanding of
genes in combination with work in cytology, embryology and reproduction (Gericke &
Hagberg, 2007). Thus under this model, genes could be visualized using mapping
techniques, and having a relationship with chromosomes as a string of beads, with each
bead representing a gene that were real, indivisible particles. As Gericke and Hagberg
(2007) and Santos et al. (2012) describe, this idea laid the foundation as research in the
first half of the twentieth century expanded the concept of genes as more functional units
in terms of transmission, recombination and mutation of genetic information due to
advancement in the chemical nature of genetics. These ideas led to genes being
conceptualized as enzymes, or actors that brought about phenotypic traits (Gericke &
Hagberg, 2007).
As subsequent research began focusing on the functional aspect of genes and the
biochemical reactions involved, the field of genetics began to shift from transmission to

12
gene function to biochemical nature of a gene. Thus, this is how Gericke and Hagberg
(2007) separate the biochemical-classical model with work following the 1940s, which
began to explain gene function in terms of the production of specific enzymes and its
relationship to the determination of phenotypic traits. The previous model was revised to
explain how genes functioned with later work showing that the product of genes are not
always enzymes (Santos et al., 2012), shifting the idea of one gene – one enzyme to one
gene – one protein.
Later, with the discovery of the structure of DNA in 1953 by Watson and Crick,
the material basis of inheritance was applied to genes and led to more definite terms of
genotype and phenotype. With the molecular basis of genetic information identified, the
model of genes as particles shifted to genes as coding for information (Gericke &
Hagberg, 2007). The neoclassical model began to combine the molecular understanding
of genetics to Mendel’s ideas about inheritance (Santos et al., 2012). At this time, the
gene became to be understood as a unit of information that functions in coding for an
RNA messenger, which acted as a template for specific polypeptides.
Santos et al. (2012) also discuss the concept of a gene as a molecular unit of
information, and that this concept is often superimposed onto the classical-molecular
concept of a gene. Additionally, the researchers state that in a more general sense, “there
is not yet a sufficient and consistent theory of biological information” (p. 550). While
Santos et al. (2012) explain that Gericke and Hagberg (2007) do not consider these
concepts, they do not consider other concepts (the molecular nature of genes and genes as
units of information), and the authors do not consider these two concepts as a separate
occurrence and how each relates to understanding gene function. Santos et al. (2012) call

13
this the molecular-informational model, yet this still corresponds to Gericke and
Hagberg’s (2007) neoclassical model. Their work is discussed in more detail later in this
paper, but it is important to note that their work expands Gericke and Hagberg’s (2007)
historical models into educational practice as potential sources of genetics
misconceptions.
Following the 1970s, as knowledge progressed, inconsistencies between the
neoclassical model and recent work began to mount and failed to explain other
phenomena, such as alternative splicing, complex promoters, overlapping genes, and
other processes. (Gericke & Hagberg, 2007). Thus, Gericke and Hagberg (2007)
delineate the need for a more modern view of a gene and its function that is more open
and complex. Under the modern model there can no longer exist a general description,
but rather different contexts for different areas of study. According to Pearson (2006) and
Gericke and Hagberg (2007) genes no longer function to produce a single polypeptide,
but instead fall within a number of other categories of genes such as genes that produce
enzymes, genes with a regulatory function, or genes that produce specific non-soluble
structural units. Figure 2.1 is the concept map developed by Gericke and Hagberg, (2007)
to outline the key features of the gene concept. In this model, gene function is understood
as more of an actor within a larger system in which the information follows from DNA to
RNA to Polypeptides. In other words, what is commonly termed as the Central Dogma of
Biology or gene expression, which is the process by which molecular information
encoded in DNA is transformed into a functional unit in a biological system.

14
Figure 2.1 Modern Model of Gene Function Concept Map (Gericke & Hagberg, 2007)
In a news feature published in Nature, Pearson (2006) also reports that the
scientists’ current understanding cannot clearly define a single gene concept and its
function. Similarly, the feature reports that the idea of genes as beads on DNA is fading
because scientists now observe that the protein coding sequences are not always discreet
segments with a clear beginning or end, and that RNA intermediate molecules has
become a key part in the gene function (Pearson, 2006). For example, population
geneticists may examine how traits are transmitted and evolve while not considering the
underlying molecular mechanisms (Pearson 2006); and thus define genes using different
criteria than a developmental biologist would. Still scientists’ definitions of a gene might
vary depending on whom you ask, as Karen Eilbeck (a researcher at University of
California in Berkeley) accounts when trying to reach a definition of a gene among 25
other scientists:

15
“We had several meetings that went on for hours and everyone screamed at each
other. […] The group finally settled on a loose definition that could accommodate
everyone’s demands. […] A locatable region of genomic sequence, corresponding
to a unit of inheritance, which is associated with regulatory regions, transcribed
regions and/or other functional sequence regions.” (Pearson 2006, p.401)
This quote underscores the continued disagreement among scientists regarding the
definition of a gene. Pearson (2006) suggests that rather than working for a single
definition, scientists and educators should use less ambiguous vocabulary. An example
being, the use of the word gene followed by ‘protein-coding’ or some other descriptor.
This also highlights the conceptual difficultly students face in making sense of genes and
the function, while also having to navigate a variety of operational meanings and contexts
used within biology as a whole.
Along with the work of Gericke and Hagberg (2007) on how gene concepts
developed historically, other researchers have examined how historical development can
translate into what students should understand in terms of current concepts and scientific
understanding about gene function. This work investigates textbooks in both
undergraduates (Flodin, 2009) and high school (Santos et al., 2012) as potential sources
of student misconceptions in gene function. Moreover, these student misconceptions
surrounding gene function share some parallels the historical development of scientific
understanding, thus students form hybrid, naïve theories about genes and their function.
However, the developing scientific model (or understanding) of the gene concept
partially explains the varying ways in which genes and the gene concept are portrayed in
textbooks.

16
What Should Undergraduates Know About Gene Expression?
So far this paper has examined what scientists know about gene function, but how
does this translate into student learning? What should students know about genes and
gene function? Because of academic freedom, learning goals and curricula can vary
among different universities. Unlike the Next Generation Science Standards [NGSS] in
K-12 education, higher education lacks a common set of concepts and competencies that
all undergraduates need to master by the time they graduate. So, is there a set of key
concepts and competencies that biology majors should master? If so, in the context of
this paper, what are those key concepts in terms of learning gene expression? Two major
reports were used as a framework to answer this question; BIO 2010: Transforming
Undergraduate Education for Future Research Biologist (National Research Council
[NRC], 2003); and Vision and Change in Biology Education, A Call for Action
(American Association for the Advancement of Science [AAAS], 2011). Both reports
expand on current undergraduate biology and science education curricular needs in light
of new developments with the biology discipline and in how people learn. Additionally,
the results of both reports came from a culmination of interviews among biology faculty
and students, as well as collaborations between university administrators, various
biological professional societies, workshops and meetings with hundreds of biologists
(NRC, 2003; Woodin, Carter & Flecther 2010). This section will use these research
initiatives as a guide to provide a brief description what key genetics concepts
undergraduates should master.

17
Both reports explain that the nature of biological research is changing because of
increasing connections to societal contexts, a growing complexity of data and new
technologies. As a result of these changes, students will need to master an even greater
interdisciplinary skill set to succeed. Additionally, there is a growing need for educators
to reform their goals to that of the changing field (NRC, 2003; AAAS, 2011). Bio 2010
(NRC, 2003) primarily elaborates on what the proposed new biology curricula would
look like by providing recommendations on disciplinary concepts (Biology, Chemistry,
Physics, Engineering, Math and Computer Science) and recommendations for
departmental wide changes that encourage engaging students through inquiry-based
learning, and fostering student excitement in research.
Similarly, the report Vision and Change (AAAS, 2011) provides a list of key
concepts and competencies needed for the next generation of biology students. The report
expands these curricular criteria within the context of overarching learning goals, which
include; engaging students in scientific inquiry; building communities of learning and
cultural change; developing computation competence with data; and developing future
faculty. Overall, the conceptual themes for biological literacy in both Bio 2010 (NRC,
2003) and Vision and Change (AAAS, 2011) include greater focus on
• Evolution: Understanding how the diversity of life evolved through
processes of selection, mutation heritable variation and genetic changes.
• The structure and function of living systems: Basic units define function.
Understand how simple components assemble into complex living
systems.

18
• The flow and transfer of energy and matter in living systems: Biological
systems grow and change via process of chemical transformation and
follow laws of chemistry and physics. Living systems are interconnected.
• The flow, exchange and storage of information in living systems: Living
systems are activated and influenced by expression of genetic information.
Within these core concepts there are several central ideas that are important to
cultivating meaningful conceptual understanding in genetics. In a general sense,
undergraduates need to understand the connections between the topics of evolution and
the genetic basis for those changes. The last core concept, “the flow, exchange and
storage of information of living systems” specifically relates to students’ ideas
surrounding the nature of genetics and gene function. Specifically, all biology
undergraduates should possess a basic understanding following the modern model of
gene function outlined in Figure 2.1. The provided expectations in what undergraduates
should know in terms of genetics literacy are presented below:
• Basic units of a structure define its function (NRC, 2003; AAAS, 2011).
In terms of learning genetics, students should understand that there exists
different ways in which genes are operationally defined that can influence
how they think about the function of those genes. Other structure-function
relationships can be connected to principles in chemistry such as the
molecular interactions and the structure of biomolecules (NRC, 2003).
• Gene function relates to the structure of DNA and chromosome behavior
in biological processes (NRC, 2003; AAAS, 2011).

19
• Genes are heritable segments of information organized in a DNA
molecule. This information codes for various RNA intermediates, which
in turn code for proteins that carry out various functional and structural
roles in the cell (NRC, 2003). This is colloquially known in biology as the
Central Dogma of biology.
• Differential gene expression controls various aspects of growth and
behavior in cell biology, anatomy, physiology and development of
different body systems and tissues (NRC, 2003).
• Living systems are interconnected and interacting (AAAS, 2011).
Biological literacy, and genetics learning in particular, needs to develop
from a systems approach in which students should understand emergent
properties of biological systems at various levels of organization. More
specifically, how the structure of the component molecules influence its
function and the flow of information within the larger biological system.
Additionally, there are a number of assessments having been developed that examine
learners’ genetic literacy in undergraduate biology education. These include, The
Genetics Literacy Assessment Instrument (Bowling et al., 2008), The Genetics Concept
Assessment (Smith, Wood & Knight, 2008), and Introductory Molecular and Cell
Biology Assessment (Shi et al. 2010). Each assessment instrument was developed and
tested independently using different conceptual criteria for assessing student literacy in
fundamental principals in genetics education.

20
Student Misconceptions Of Gene Expression
So what has been identified in terms of what students know about genetics? In
particular, how do student conceptualize a gene and its function within living systems?
How do these ideas fit within the modern model of gene function? Because much more
work has been done in the K-12 arena of what students know, this paper will summarize
adolescents’ (particularly high school students) ideas about genetics. Naïve notions
adolescents share about genetics will serve as a basis for what misconceptions
undergraduates bring with them into college classrooms, before examining current
research in undergraduate students’ understanding of genetics concepts.
What Is A Gene?
Here we will start the investigation of student understanding of the structure of
genes and the nature of genetics. Specifically, this section will examine how students
think about genes and how students connect these ideas to other concepts, in addition to
looking at various misconceptions students may hold pertaining to genes and learning
genetics.
Summary of K-12 students. Much of the research in K-12 students understanding
of genetics has examined how students understanding concepts related to inheritance. In a
general sense, students think about genes in a more primitive way similar to that of the
Mendelian model of gene function. That is, genes act as trait bearing particles that
determine characteristics of an individual (Venville & Treagust, 1998; Lewis &
Kattmann, 2004; Lewis, Leach & Woods-Robinson, 2000). Lewis (2004) reviewed two
research studies on secondary students’ (ages 14-18 years) understanding of genetics
found that students attempt to explain genetics in terms of everyday notions and

21
conceptual frameworks. In the first study including 10 German secondary students that
were asked to explain genetics, frequently used descriptors of genes as ‘small trait
bearing particles’, using terms like gene and character equally. Additionally, students
thought of heredity as the transfer of these passive particles from parent to offspring via
reproduction. Likewise, the second study of 482 English secondary students held the
notion of heredity as a transfer of trait bearing particles. Lewis (2004) suggests that these
everyday frameworks can foster ideas that genes and phenotypes work at the same level,
re-enforce students focus on phenotype, and result in a lack of vocabulary in genetics. In
other words, students conceptualizing genes as particles containing a trait or
characteristic can lead to notions of inheritance of unchanged heritable features or pre-
existing genes (Marbach-Ad & Stavy, 2000; Lewis et al., 2000; Saka, Cerrah, Akdeniz &
Ayas, 2006).
Additional research has indicated that students also might fail to understand the
relationship between genes, DNA and chromosomes (Marbach-Ad, 2001; Saka et al.,
2006). In a cross-sectional study observing the differences in understanding among 175
Turkish students across various age ranges, Saka et al. (2006) found that that all students
at least provided a functional explanation to define a gene rather than a structural
definition. This suggests that students think of the structure of genes as different from
that of DNA and its relation to where genes are located on a chromosome. Saka et al.
(2006) analyzed these conceptions pertaining genes, DNA and chromosomes utilizing
student drawings and interviews between 8th, 9th and 11th grade students, in addition to
pre-service and biology student teachers. Marbach-Ad (2001) found similar results in
how high school students’ drew relationship between genes, DNA and chromosomes.

22
Specifically, students appeared to characterize genes, DNA and chromosomes differently
in both structure even though each served similar functions. For example, both 9th grade
and 12th grade students defined genes as being composed of traits and DNA as being
composed of nucleotides; however, when 9th grade students were asked about the
structure and function of genes and DNA they compartmentalized the concepts separately
(Marbach-Ad, 2001). Lewis, Leach and Wood-Robinson (2000) also found that students
failed to link concepts of genes and chromosomes. Even though some students were able
to characterize chromosomes containing DNA, with only 10% of students identified
genes being located on a chromosome.
Summary of undergraduate students. So far, this section has highlighted the
superficial connections adolescents make to describe what constitutes a gene, but how do
undergraduates’ ideas about genes compare? Longden (1982) described inherent learning
difficulties that first year undergraduates experience in learning genetics. By using
interviews data, Longden (1982) identified several main topics of misconceptions and
subject areas that students had difficulty understanding. The three main learning
difficulties included: classification of genes, alleles, chromosomes and chromatids; DNA
replication and meiosis; and the mathematical elements of genetics (Longden, 1982). The
first and last learning difficulties mentioned are of particular importance to this paper;
because each corresponds to previously discussed misconceptions in genetics. For
example, interviewed students were reportedly failed to associate genes to chromosomes
and alleles. Additionally, Longden (1982) reported that there is a precise language that
allows scientists to differentiate between abstract concepts and processes in genetics,
which can also hinder students’ grasp of the topics. Similarly, Bahar, Johnstone and

23
Sutcliffe (1999) used word association tests to identify conceptual problems of first-year
biology student. Specifically the authors examined the ideas student generated using the
words such as gene, mutation, chromosome, phenotype, and genetic engineering. The
results indicated that through word associations, educators could reveal a number of
student conceptual understandings and how those associations connect to other ideas
(Bahar et al., 1999). Yet, the authors also found that even though students were able to
generate many ideas about a variety of words, students failed to make the appropriate
connections between words.
Newman, Catavero and Wright (2012) also investigated freshmen college
students’ conceptions pertaining to genes, chromosomes and chromosomal behavior
within a cell. They assessed 71-college freshman enrolled in an introductory biology
course and sophomores enrolled in a cell biology course using targeted questions on
genetics taken from various assessment instruments. In addition, the researchers
conducted interviews and collected drawings students developed during the interviews to
illustrate their understanding. Overall students at both levels understand basic
chromosome structure and were able to identify the relationship between DNA and
chromosomal structure (Newman et al., 2012). The authors noted during interviews
students identified genes as directly relating to traits or phenotypes. These students
shared similar misconceptions of genes demonstrated by K-12 students whose ideas were
analogous to more classical models of gene function. Additionally, this could indicate
that students have an incomplete understanding of other molecular processes related to
gene expression (Newman et al., 2012). This would include genes being more passive
particles that code for information, rather than actors within a biological system.

24
Additional studies have compared pre-service teachers’ and university students’
ideas of genes in relation to those naïve notions shared by K-12 students in Israel
(Marbach-Ad & Stavey, 2000; Marbach-Ad, 2001) and Turkey (Saka et al. 2006). Similar
to the results found in K-12 students, pre-service teachers more often gave structural
explanations for concepts involving genes, DNA and chromosomes (Marbach-Ad, 2001).
Furthermore, Marbach-Ad (2001) also found that pre-service teachers and 12th grade
students shared a common naïve view regarding the relationships between genes and
traits, rather than between genes and DNA. So when asked, students tend to offer more
general responses that are familiar to them and that require the least amount of mental
steps (Fisher, 1983). Thus, it is presumed that students who do not understand those
concepts will fall back on more familiar and naïve ideas/notions and vocabulary
(Marbach-Ad, 2001).
How Do Genes Function?
While, the main ideas between this subsection and the previous one are closely
related, here the focus centers on how students relate gene function to structure.
Summary of K-12 students. As stated in the previous subsection, younger
students’ ideas about the function of a gene mirror that of Gericke and Hagberg’s (2007)
Mendelian model of gene function. In other words students make no distinction between
an organism’s genotype and phenotype (Marbach-Ad & Stavy, 2000; Marbach-Ad, 2001;
Lewis & Kattmann, 2004). For example, Lewis and Kattmann (2004) observed that
students viewed heredity as the transmission of traits from parent to offspring. The
authors also suggested that these views about gene function lead to notions of the pre-
existing traits were being transmitted during reproduction. Additionally, Lewis and

25
Kattmann (2004) also observed that students had difficulty with the concept of gene
regulation (different cell types contain the same DNA, but turn on or off certain genes). In
other words, the genetic information in a cell determines its phenotype, rather than the
differential expression of certain genes determining a phenotype.
Similar results by Lewis, Leach and Wood-Robinson (2000) found that students
had difficulty distinguishing between genes and genetic information. According to the
authors, no students explicitly linked a gene with a gene product. However when asked
about DNA, students were able to distinguish between DNA and its role in providing
information for the production of proteins. Related finding from Marbach-Ad and Stavy
(2000) also suggest that students’ lack a solid conceptual understanding in the function of
RNA related to concepts about genes. The authors also suggest that because of this,
students have difficulty linking the molecular process of gene function to cellular process
and structures. Whereas Marbach-Ad and Stavy (2000) examined the difficulty in
swapping between different levels of organization, the concept map results from
Marbach-Ad (2001) suggests that students also have difficulty relating structure in to
function. According concept maps, students described relationships between ideas in a
“structure/function” (either/or) dichotomy. Because of this, 12th grade students showed
difficulty in their ability to link, for example, concepts of a gene and DNA to a protein
product (Marbach-Ad, 2001). This also fits within observations made by Santos et al.
(2012) of students superimposing ideas of a gene as a unit of information to a classical
model of gene function (discussed previously). This means that in some cases students
might combine historical gene function models that result in hybrid gene models in which

26
genes are defined as units of information that determine a trait or characteristic (Flodin,
2009; Santos et al, 2012).
Summary of Undergraduate students. Thus far this section has discussed how K-
12 students often fail to understand how the molecular structure can relate to the
functions of biological processes and living systems, but what about undergraduate
students? As mentioned previously, research examining both pre-service teachers and
university biology students found that college students also have conceptual difficulties
relating the structure of DNA to gene function similar to those found in K-12 students
(Marbach-Ad, 2001; Saka et al., 2006). One intriguing observation Saka et al. (2006)
found notes that while university students in the study used a greater amount of scientific
terminology, both pre-service and biology student teachers still lacked a clear
understanding. In some cases grade 8 students scored higher in conceptual understanding
compared grade 12 and university students. This suggests that as students grow older and
acquire increasingly more complex knowledge, they may forget content that was
previously learned (Saka et al., 2006); or students could not construct the appropriate
connections between concepts, thus developing alternative conceptions and/or synthetic
models which would hinder meaningful conceptual learning.
Similarly, research conducted by Jensen, Kummer and Banjoko (2013) assessed
college students’ ideas pertaining to gene expression (i.e. concepts the molecular basis of
gene expression). More specifically, the authors examined the effects of prior
conceptions on learning the process of central dogma in both university biology majors
and non-majors, in addition to community college biology majors. The results showed
that both non-majors and community college biology majors outperformed university

27
biology majors. This suggests that prior conceptions can serve as barriers to effective
learning. In other words, prior conceptions lead to the uptake of learned information
without the consideration of meaningful conceptual understanding (Jenson et al. 2013).
It is important to note that Jensen et al. (2013) did not test the differences between
the kinds of misconceptions students held as they influence assimilation vs.
accommodation. This is one possible avenue for future work. However, the authors did
identify several conceptual problems student faced in learning about gene expression. In
terms of relating structure to function in genetics, it was observed that students failed to
understand the role of tRNA and anti-codons. One possibility is that students have issues
relating ideas on complementary base pair of nucleotides to other molecular
intermediates (Guzman & Bartlett, 2012; Jensen et al. 2013). Additionally, students could
not relate ideas about codon sequence actually coding for a particular amino acid,
methionine. In other words, students confused this with “start” rather than the sequence
coding for a physical molecule (Guzman & Bartlett, 2012; Jensen et al., 2013). Guzman
and Bartlett (2012) also observed similar misconceptions among undergraduate students’
conceptions about relationship between bimolecular structure and gene expression.
Specially, they examined students’ thoughts about the relationship between the structure
of the genetic code and the final protein product.
According to Newman et al. (2012) undergraduates also fail to transfer
understanding of chromosome structure to ideas involving genetic information. Even
though the authors reported that students could demonstrate understanding of
chromosome structure being made of DNA, students were not able to apply basic
concepts of structure to information flow. Additionally, most students had difficulty

28
thinking about genes and/or alleles in the context of chromosomal behavior (Newman et
al., 2012). For example, in order to fully grasp more complicated cellular process,
students need to understand how genetic information is structured and behaves in various
molecular mechanisms. Ultimately, Newman et al. (2012) conclude that although
students may “know” about particular concepts, they fail to apply those various concepts
within or between similar contexts. In other words, students missed the underlying pieces
of information and key connections as they are related to the concepts of chromosomal
behavior and how that molecular structure is converted into a functional molecule
(Newman et al., 2012). This also highlights the piecemeal nature in which novices can
view concepts; In addition to the need for scaffolding, practice and application to develop
sophisticated connections in order to see big picture ideas.
Misconceptions Related To Abstract Levels Of Organization
Previously this paper has investigated what students know and don’t know in
terms of the structure of genetics and how that structure relates gene function, cellular
processes and transfer of information. Yet, how do students conceptually move between
the various levels of genetic organization? How do they trace the flow of information
throughout those levels and biological systems? The national research initiatives, such as
Bio2010 and Vision and Change previously discussed, these are questions educators
should consider when fostering meaningful conceptual learning in genetics.
In their examination of 10th graders understanding in molecular genetics, Ducan
and Reiser (2007) found that students are often not aware of the various function s of
proteins, their relation to the structure of genes and the role proteins play in facilitating
the flow of genetic information. In their analytical framework Ducan and Reiser (2007)

29
wanted to investigate how students thought about these processes mechanistically.
Meaning that they examined how students reasoned through the ontological differences
in how genetic phenomena are organized. Thus, in order to attain meaningful conceptual
understanding in genetic processes, students need to be able to possess hybrid
hierarchical thinking (i.e. understanding how information brings about changes in the
physical effect in nature) (Duncan & Reiser (2007). These hierarchical levels include
interactions on the molecular level between genes and proteins, the micro-level in cellular
processing and the macro-level involving the organism or populations. Newman et al.
(2012) also observed similar cases in which students were not able to transfer knowledge
in there visualize representations used to demonstrate connections between DNA and
chromosomes, which tended to focus on more superficial features rather than molecules.
Similarly, Marbach-Ad and Stavey (2000) also describe concepts in genetics in
terms of occupying three principal levels of organization: the submicroscopic level, the
microscopic level and macroscopic level. With this organization, the authors examined
students’ ability to connect ideas across levels. To assess this, Marbch-Ad and Stavy
(2000) asked students (grades 9, 12 and pre-service teachers) various types of questions
asking them to explain the phenomena at one level while using concepts from another.
Overall, the data suggests that the students in this study also found it difficult to
generalize across the different levels of organization (Marbach-Ad and Stavy, 2000). For
example, students were tasked with explaining the appearance of phenotypic traits using
concepts such as genes and chromosomes (i.e. macroscopic to microscopic reasoning).
Interestingly Marbach-Ad and Stavy (2000) also suggest that because student had
difficulty extrapolating between levels misconceptions in resulted (described in the

30
previous sections). The following section will apply understanding genetics in terms of
levels of organization with gene structure and function relationship using the molecular
basis of how genes are converted into a functional unit, central dogma.
Applying Gene Expression Concepts To Biological Systems
Another dimension to how genetic information is structured across distinct levels
of organization is how students are able to trace matter and the flow of energy and
information within a biological system. The idea of systems thinking or mechanistic
thinking is described in one of the core concepts outlined in Vision and Change (AAAS,
2011). Specifically, system thinking is applied to the understanding of complex
biological processes in terms of the structure and dynamic interaction of its component
parts within the context of its larger function. Within the conceptual framework of
learning genetics, this applies to students understanding of gene expression or central
dogma.
As a whole, central dogma is daunting to most students. The process can seem
very complex and involved for students to learn both conceptually and mechanistically
(Fisher, 1983; Tamlin and Fetters, 2002; Guzman & Bartlett, 2012; Jensen et al., 2013).
Still, students need to understand that the molecular structure and composition limits the
function of each of the components within the process. For example, the molecular
structures of nucleotides connect to ideas about base-pairing rules to allow information to
be stored within the double-stranded DNA molecule. Thus, the three dimensional
structure of proteins and enzymes that regulate and catalyze the necessary reactions also
restrict how those molecules behave in the system allowing the information stored in
genes to be read and expressed in the system; and on and on. Thus, developing students’

31
systems thinking skills can act as another conceptual tool through which students can
make sense of and develop a more meaningful understanding pertaining to the
interconnectedness of complex biological processes.
Research into how students trace energy and matter through systems can shed
light into the conceptual difficulties students might face when developing systems
thinking skills. Wilson et al. (2006) examined college undergraduates enrolled in a cell
biology course and their ability to trace matter as a reasoning and instructional tool to
develop fundamental principles in molecular biology. Specifically, the authors used the
processes of photosynthesis and cellular respiration; however, their methods can be
applied to other processes in molecular genetics. Wilson et al. (2006) conclude that it will
be essential for introductory undergraduates education to focus on fundamental principles
as well as understanding dynamic systems.
As mentioned previously, because biological knowledge and research is becoming
increasingly inter- and multidisciplinary, other areas of research that can help students’
conceptual understanding of molecular genetics include chemistry education; specifically
conceptions in chemical bonding and molecular interactions. Ozmen (2004) provides a
detailed review of literature that investigates student misconceptions in chemical
bonding. Some of the most common misconceptions in chemical bonding, which apply to
molecular genetics, held by 11th and 12th grade students include (Ozmen, 2004):
• Bond polarity: Influenced by the number of valence electrons between all atoms.
Properties of covalent and ionic bonds influence polarity.
• Molecule shape: due to the repulsion between bonds. Determined by bond
polarity.
32
• Polarity of molecules: polarity of atoms influences the overall polarity of
molecules such as electronegativity and non-bonding electrons.
• Intermolecular forces: forces with a molecule and how these forces influence the
chemical properties of molecules.
Theoretical Framework: Conceptual Change
Donovan and Bransford (2005) summarize the idea of learning with
understanding in How Students Learn: Science in the Classroom. They explain the
concept of learning encompasses factual knowledge placed within a conceptual
framework where meaning is developed through representations rich in factual detail.
The interplay between factual knowledge and meaning is formed through knowledge
organizing ideas supported by knowledge of facts (Donovan & Bransford, 2005). In
studies comparing the learning of novices and experts, experts were found to know more
relevant information compared to novices at similar tasks and had a better memory of
those facts. For example, expert engineers are able to quickly identify a mass of circuitry
as an amplifier, and in turn are able to reproduce several smaller circuits from memory.
Comparably, novices would observe each circuit separately, and would remember fewer
details in total. This behavior is referred to, as chunking information in domains of factual
knowledge by overarching ideas is one stage highlights this concept. Building the on
work of Thomas Kuhn, researchers have examined the nature of conceptual change as it
relates to how students learn science. Here the process of how concepts develop and
evolve as knowledge is constructed. The basic premise is that students’ perceptions of the
natural world are dependent our prior knowledge. In a sense, students view the world
through ‘conceptual goggles’ that Kuhn calls ‘paradigms’ (Mintzes & Wandersee, 2005).

33
Discussed below are three main views of conceptual change. More specifically,
Vosnidaou’s (2010) change through framework theory approach and Chi’s (2010) three
grain sizes of conceptual change (both of which view conceptual knowledge as coherent
frameworks). The discussion also explores diSessa’s (1993, 2010) knowledge in pieces
model, which views conceptual knowledge frameworks as being fragmented in nature.
In the International Handbook of Research on Conceptual Change Vosniadou
(2010) describes how students can form various misconceptions and how these ideas can
change gradually with time. This theory of conceptual change suggests that as students
are presented with new problems, learners construct “mental models” based upon
conclusions from the student’s prior knowledge (Vosniadou et al. 2010). When new
information enters into the student’s mental model which conflicts with his/her previous
assumptions or beliefs, this information is incorporated into a new “synthetic model”
rather than changing the previous assumptions. Interestingly to the student, the newly
constructed synthetic model satisfies the scientific concept as well as his/her
misconceptions. Additionally, Vosniadou et al. (2010) argue that learning science
concepts are difficult because they may violate principles of students’ naïve framework.
According to Vosniadou et al. (2010), these synthetic models reflect both the
nature of the misconceptions, and the nature of conceptual change. The kinds of
conceptual changes that take place can be gradual, via spontaneous development, or more
radical through changes induced through instruction. In an example of children’s
conception of a spherical earth, Vosniadou (2010) describes that a small sample of
students held strange conceptions of the earth as various shapes, such as a wrapped flat
pancake forming a circular flat structure. Interviews with students suggested that their

34
initial concept is embedded into a larger knowledge structure of physics consisting of
various systems, observations, or beliefs that provide a sufficient explanation to the child.
Thus, the process of conceptual change indicates that students gradually alter their
existing mental framework with newly learned content, while still maintaining
components of the original ideas, until changes are needed in their understanding. Inagaki
and Hatano (2010) offer a similar example of conceptual change in biology involving the
concept of living and non-living objects. Here, Inagaki and Hatano (2010) examine the
reconstruction of existing knowledge systems induced through instruction as more facts
are incorporated into students’ initial naïve/ intuitive knowledge system. In their
example, the researchers evaluate students’ progression in explaining biological
phenomena from vitalistic (biological process possessing agency, “vital force” or “source
of energy”) to mechanistic causality. The results suggest that as students learned more
specific biological mechanisms, they begin to recognize mechanical causes as being more
reliable compare to vitalistic causes. Thus, the shift in mechanical causes induced an
abrupt shift in students’ conceptual framework of biology. In both examples students
begin by developing naïve theories to explain individual observations and experiences.
Through further experience and education individuals gradually transform scientifically
inaccurate synthetic models to ones that satisfy a more scientific explanation, or more
abrupt conceptual shifts induce through instruction.
Similarly to Vonsniadu’s (2010) Framework theory of conceptual change, Chi
(2008) describes that conceptual change occurring in three modes, or grain sizes: Belief
revision, mental model transformation, and categorical shifts. Each of the three different
grain sizes indicates how knowledge can be misconceived and the process through which

35
prior knowledge can be changed, and the kinds of instruction that are most likely to elicit
that change. The smallest type of change can occur through individual beliefs of the
learner. Here, a student’s prior understanding can be represented by a single idea that
refers to student’s belief. At this level, scientifically accepted norms often are in conflict
or are counter intuitive with the experiences observed in nature, leading students to
develop false beliefs about a particular natural phenomenon. Common examples of
personal ideas developed through observations of nature that are counter intuitive to
scientific norms include ideas such as, all blood vessels have valves (Chi, 2010).
Additionally, those false beliefs can be stable if those ideas appear consistently across
students. At the next grain size, students’ ideas can culminate into larger mental models
that the students use to explain a larger concept (such as a gene). Just as false beliefs can
be conflicting, so too can students’ mental models conflict with new knowledge.
However these conflicts can vary by degree as they can reveal how student relate a set of
interconnected ideas (Chi, 2010).
Similar to Vosniadu’s (2010) construction of synthetic mental models, Chi (2008)
explains that the students’ mental models appear to be coherent in nature, in that students
consistently use and rely on those conflicting models to make predictions about a concept
in question. These personal models can lead students to different predictions than
predictions developed by scientists. Thus for conceptual change to occur, an individual
needs evidence that a mental models needs further modification because the current
mental models appear flawed in light of a particular natural phenomena, or i.e.
transformation.

36
Lastly, the largest grain size of change considers more robust misconceptions that
can be resistant to change. At this level, misconceptions can arise from grouping
properties of a particular concept as its relation to other smaller ideas, such as the
identification of living and non-living objects. A categorical shift occurs as the student
transitions between properties a conflicting category to those in a parallel category. One
example Chi (2008) posits is students’ view of energy as an entity-based phenomenon
(i.e. a physical substance) rather than a process-based phenomenon (i.e. how heat
transfers between objects). In this example, the properties that constitute each category
are ontologically distinct from one another: viewing energy as something hot versus the
motion of molecules. Chi (2008) also explains another important categorical shift
common in science are direct versus emergent properties, in which students misconceive
phenomena as having a direct cause to some outcome.
While Vonsniadu (2010) and Chi (2008) view knowledge frameworks as being
more coherent regarding conceptual change, another view is that knowledge frameworks
are more fragmented in nature. In the fragmentation view of conceptual change, diSessa
(1993) proposes that knowledge develops in pieces. Here, the novices’ knowledge
consists of a collection of unstructured elements, called phenomenological primitives (p-
prims) stemming from superficial explanations of reality. Additionally, conceptual
development often depends upon the connections between p-prims to other conceptual
elements with a student’s knowledge framework (diSessa, 1993). Furthermore, the
process of learning occurs through the collection and systemizing pieces of knowledge
into larger components. At this stage p-prims are no longer self-explanatory, but indicate
more complex knowledge structures. In other words, as p-prims lose their status of

37
explaining natural phenomena, these shifts transition learners from intuitive novices to
more expert scientific models.
So what does all this mean in terms of learning science for understanding? In the
report, How People Learn, the NRC (2000) summarizes the research on cognitive
processes in learning. As discussed, educators need to develop students’ naïve theories
into a working scientific knowledge base. In other words the goal is the guided transition
of student understanding from that of a “novice” to an “expert.” According to the NRC
(2000) as well as Mintzes and Wandersee (2005), experts are able to observe meaningful
patterns in their knowledge domain, categorized knowledge into connected structures or
groups of concepts allowing them to access that knowledge quickly, and possess strong
metacognitive or self –monitoring processes that help them to identify and modify
knowledge discrepancies
Summary
This chapter presents a review of the literature regarding genetics concepts, such
as those relating the structure of a gene to its function, and how a gene is expression
into a functional protein unit. The chapter first discussed how scientists
conceptualize a gene, and how the gene concept has developed historically with
science. Here the literature indicates the progression of various gene models as
scientist developed a greater understanding of genes and how they function within
living systems. Second, this chapter examined what undergraduates are expected to
understand about gene structure and function relationships. Here the focus was the
boarder learning outcomes outlined in the report Vision and Change (2011) for
undergraduate science programs. Next was an examination of the literature in terms

38
what common misconceptions have been observed in K-12 and college students about
concepts of genes and gene expression. Additionally, this chapter also examined how
undergraduates reason across various levels of biological organization in regards to
tracing the flow of information from DNA to organisms. Lastly, the chapter related
student misunderstandings in science concepts within the theoretical framework of
conceptual change research, and the view of student knowledge construction using
mental models that a coherent versus fragmented in nature.

39
CHAPTER 3 METHODOLOGY
The previous section reviewed the literature about what undergraduates know
about gene expression. This section presents a description of the research methodology
employed in the study. The purpose of this study was to develop and field test a two-
tiered survey instrument used to identify student knowledge about gene expression, and
student reasoning regarding their ideas. The survey itself focuses on gene expression (the
processes in which DNA is expressed into proteins), and how expressed proteins interact
within a biological system. The research questions that guided this study are as follows:
1. How well does the two-tiered survey instrument measure student ideas about
gene expression?
2. What level of understanding do freshmen science majors have about the
nature of genes and gene expression?
3. What reasonings do students use to explain processes and outcomes of gene
expression?
The first section is a description of the study participants sampled for this study, followed
by a description of the research design. Lastly, the survey instrument used in this study is
discussed.
Study Participants
Study participants were collected from a freshmen level introductory biology lab
course during the spring 2015 semester. These students were enrolled during the spring
2015 registration period from November 2014 through January 2015. The introductory
biology lab is a one credit hour independent biology laboratory course that meets three

40
hours once a week, and offers multiple sections with each enrolling approximately 30
students. The approximate ages of enrolled students typically range from 18 to 21 years
of age. This particular population was chosen because the course is required of all
biology majors, and is one of the first courses in biology that incoming majors are
required to take before moving on to more advanced lecture and lab courses within the
department. The introductory biology laboratory course was also chosen because this
particular course is independent to other biology courses; meaning that no co-requisite
introductory lecture course is required for enrolling in the course. However, of the 97
freshmen surveyed in this study 75.2% indicated being currently enrolled in the biology
lecture course (16.4% of students previously enrolled in biology lecture, while 9.2% of
students were not enrolled in lecture course alongside BIO155). Being an independent lab
course, a portion of students can be sophomores, juniors or seniors.
Six sections of the introductory biology lab were sampled. Table 3.1 provides a
summary of the study participant demographics. Of the students enrolled in BIO 155
recruited for the study, only students that identified as freshmen were surveyed (n=97).
The gender ratio of study participants was approximately 70% female to 30% male,
which is typical enrollment for this course. Students’ ethnicity was self-reported and
included White or Caucasian (n=86), Asian (n=3), Black of African American (n=2),
Hispanic or Latino (n=1), and Unreported (n=5). Most of these students speak English as
their first language, although some international students enroll in the course. Participants
surveyed in this study were required to communicate using English both orally and in
writing. Information on students’ major of study also self-reported. Responses were
grouped by theme: Biology/pre-Medical majors (n=18), Chemistry/pre-Pharmacy (n=17),

41
Kinesiology/Physical Therapy (n=19), Animal Science/ Agricultural Biosystems (n=11),
and non-science majors (i.e. Business Management, n=31). Population demographics
between sections do depend mostly on student enrollment and will vary.
Table 3.1 Study Participant Demographics: Gender, Ethnicity, and Major of Study (n=97)
Ethnicity Male Female Total White/Caucasian 22 64 86 Asian 0 3 3 Black/African American 1 1 2 Hispanic/Latino 0 1 1 Unknown 3 2 5 Total 26 71 97 Major of Study N Biology/pre-med 18 Chemistry/ pre-Pharmacy 17 Kinesiology/Physical Therapy 19 Animal Science/ Agriculture Biosystems 11 Non-Majors 31 Total 97
Study Design
The purpose of this study was to field test a two-tiered survey instrument that
assesses student conceptions and understanding about genes and gene expression. The
two-tiered survey instrument was developed using student conceptual difficulties cited
literature, and was reviewed by two content experts in biology. The study followed a
mixed-methods design, and divided into two parts. In Part 1, 97 two-tiered surveys were
administered across six sections of introductory biology lab course. Surveys consisted of
multiple-choice (quantitative) and short answer (qualitative) items targeting common

42
preconceptions found in the literature. Multiple-choice data were analyzed using
descriptive statistics to identify frequencies of responses for each answer choice, the
correct responses, and the total number correct responses overall. Chronbach’s alpha
coefficients were used to establish internal consistency of test items for the entire
instrument, and for each of the four test item domains. Short answer data were analyzed
using a 0-5 scoring rubric [adapted from Saka et al. (2006), see Table 3.2]. Short answer
test items were also analyzed for common themes that emerged from students’ written
responses.
Table 3. 2 General Evaluation Rubric for Student Short Answers
Numeric Score
Level of Understanding Scoring Criteria
0 No Understanding
• No response, unclear response, or no explanation given.
• Unable to analyze
1 Incorrect/Scientific Misconceptions
• Very basic content knowledge. Does represent some sort of meaning
• Incorrect response with misconceptions
2 Scientific Fragments with Misconception
• Basic content knowledge with some
misconceptions but represents low level of knowledge (fragments/ facts).
• Partially incorrect but vague response
3 Partially Scientific Notion
• Generally correct response showing
developing knowledge with little/ no connections.
• Could repeat the question in response.
4 Scientific with minor
Justification
• Correct response & provides minor explanation with no misconceptions.
5 Scientific with Justification
• Response contains all parts of a scientific answer with a complete explanation.

43
In Part 2, 15 participants were selected for semi-structured student interviews
using student responses. Interview participants were randomly selected using preliminary
survey results grouped by high, medium and low ability scores (5 students per group).
Semi-structure interviews were guided using students’ survey responses. Interview data
were analyzed by comparing interview transcripts to student short answer responses as a
measure of instrument face validity. Figure 3.1 provides an outline of the research design.
Figure 3. 1 Outline of Study Design and Analyses
Two Tiered Survey Instrument
The Two tiered survey instrument (see Appendix A) was developed using student
misconceptions identified in the literature (Venville & Treagust, 1998; Flodin, 2009;
Bowling et al, 2008; Klymkowsky, Underwood & Garvin-Doxas, 2010; Tsui & Treagust,

44
2010; Wright et al., 2014). The survey design follows a two-tiered format, in which test
items are linked together by content and reasoning. In the first tier, content or domain
knowledge and misconceptions related to genetics concepts are assessed, while the
second tier is designed to measure students’ formal reasoning connected to knowledge
assessed in the first tier (Tsui & Treagust, 2009). Items on this survey are considered
correct if the answer choices from both tiers (content and reasoning) match or are
correctly answered. In addition to measuring student reasoning connected to knowledge;
this survey method allows the reviewer to detect student guesses by comparing the two
answer tiers for any inconsistencies (Tsui & Treagust, 2008).
The survey instrument includes 11 two-tier questions (designed to take
approximately 30 minutes for student to complete). Tier 1 consists of 8 multiple-choice
and 3 short answer items, while Tier 2 consists of 3 multiple choice and 8 short answer
items. Within the survey are multiple question groups. Each group assesses different
genetic concepts (Figure 3.2) and contains two to three survey items within each
grouping. These groups include: Nature of genes (Q1, Q7 & Q8), molecular properties in
a system (Q5, Q6 & Q9), genetic behaviors (Q10 & Q11), and gene expression (Q2, Q3
& Q4). These survey items are a mix of multiple-choice and short answer assessments.
As stated earlier, some questions were created using previously cited literature. Other
tasks were adapted from previously published genetics assessment instruments. More
specifically, five tasks were used from previously published assessments instruments.
These included Q1 taken from Tsui and Treagust (2009); Q7 gleaned from Bowling et al.
(2008); and tasks Q9, Q10 and Q11 were taken from Klymkowsky, Underwood and
Garvin-Doxas (2010). In these adapted items, the majority of the question the stem and

45
answers were kept the same; however, the researcher made modifications to the wording
of certain test items. Lastly, for question 8, the researcher consulted research literature
examining how the gene concept is presented to students in a popular college textbook
(Flodin, 2009).
When designing the two-tiered survey instrument, the researcher chose to create
short answer responses in order to gather data for future test items not currently present in
the research literature. Additionally, the researcher was unable to find other two-tiered
assessments related to the topics on gene expression. Because of this, short answer
responses were used to survey student ideas and prior knowledge related to concepts of
gene expression and their connected formal reasonings related to their answer choices.
These responses were then analyzed using common themes, with the future goal of using
students’ responses to develop multiple-choice options in further iterations of the
presented survey instrument.
Figure 3. 2 Overarching Concepts by Survey Item Groupings
Nature of genetic material (Q1, Q8, Q7)
• DNA is the genetic material of all cells and organisms • A gene is a segment of DNA sequence used to produce a protein • Structure of gene information relates to gene function
Gene expression (Q2, Q3, Q4) • How molecular components interact in a biological system • Genes code for many proteins via an RNA intermediate • Basic molecular characteristics of inputs influence the function in
biological system • Reasoning with a biological system
Molecular properties and functions (Q5, Q6, Q9)
• Molecular characteristics of DNA and RNA are important to function of biological systems
• Different cells are produced through differential gene activity or expression

46
Figure continued from page 45
• How molecular components interact in a biological system • Reasoning with a biological system
Genetic Behaviors (Q10 & Q11)
• Reasoning across ontological distinct levels • Mutations can be destructive, beneficial or silent in terms of gene
function • Recognize “dominance” in relation to recessive phenotype • Expressed gene products (proteins) produce individual traits
Data Analyses
Descriptive statistical analysis using the program SPSS, was used to analyze both
multiple-choice and short answer survey responses for student ideas about gene function
in tier one of survey questions, and student reasonings in tier 2 of survey questions. A
summary of the types of data analyses can be found in Figure 3.1.
As a general method to assess a survey’s reliably, a Chronbach’s alpha coefficient
is commonly generated to measure the internal consistency among a related set of test
items (Chronbach, 1951; Streiner, 2003). Two coefficients were generated for both
multiple choice and short answer survey items using the statistical analysis program,
SPSS. As another measure of survey reliability, students’ levels of understanding
following a 0 – 5 scoring rubrics for each short answer survey question were analyzed
using descriptive statistics. This was an added measure included to help resolve
consistency of all 0 – 5 scoring rubrics. Three independent reviewers analyzed all short
answer responses. Each of the reviewers assisted in creating all rubrics, and met multiple
times to refine each scoring rubric until an inter-rater reliability of 95 – 100% total

47
agreement was reached. All of the scoring rubrics for each short answer question were
generated using the general rubric found in Table 3.2.
The survey instrument was also assessed via content and face validity. During the
survey design, two content experts in biology independently reviewed the survey for
inaccuracies in the question stems or answer choices. Both content experts were within
the department of biology. Face validity was assessed qualitatively through student semi-
structured interviews. Interview transcripts were then compared to the student’s own
survey responses (both multiple choice and short answer data). As second measure of
face validity, all short answer survey responses were qualitatively analyzed through by
creating intermediate codes for common themes for all student responses, which were
then grouped into related larger categories (Wright & Newman, 2014) as demonstrated in
Figure 3.3. This allowed the researcher to analyze the content and variation of ideas, as
well as reasonings held by students in the short answer responses.

48
Figure 3. 3 Coding Example for Short Answer Responses
Summary
College freshmen ideas about gene structure and function were assessed using a
two – tiered survey instrument. The survey was developed using test items taken from
other assessments in the research literature, as well as new items were developed to
match the two-tiered format. The survey consisted of both multiple-choice and short
answer responses for students to articulate their formal reasonings for their selected
answers. The next chapter will present the data analyses and results of this study.

49
CHAPTER 4 FINDINGS
Results from each survey task regarding the undergraduate student ideas about
gene structure and function are discussed in this section. The topics are sub-divided by
the question grouping targeting different concepts in genetics (Figure 3.2). These include
the nature of genetic material (tasks 1, 8 and 7); gene expression (tasks 2 through 4);
molecular properties and functions (tasks 5, 6 and 9); and genetic behaviors (tasks 10 and
11). The complete two –tiered survey instrument can be found in Appendix A with the
correct answers indicated for multiple-choice responses, as well as the 0 – 5 scoring
rubrics for all short answer responses.
Each topic will begin with a summary of the concept(s) assessed by the survey
within the topic groupings. The findings for each two-tiered test item are presented in a
survey response matrix. Tier-one answer choices along the top of the table, and tier 2
answer choices along the left side of the table. Undergraduates level of understanding
was measured using the 0 – 5 scoring rubric (described in the Data Analyses section) for
short answer responses in the instrument. Following this is a presentation of the findings
from the common themes uncovered in student short answer responses. Lastly,
Interviews transcripts were compared to each student’s survey responses to examine how
well the instrument accurately captures student ideas and reasonings in genetics.
To evaluate the use of the two-tiered instrument, A Chronbach’s alpha coefficient
was used as a general measure of internal consistency of the survey instrument. Survey
response patterns to each sub-topic were also used to examine in more detailed how well
the instrument measured undergraduates ideas and misconceptions with the first tier

50
(research question 1), and the reasonings for those students ideas in the second tier
(research question 3). Response patterns in undergraduates’ level of understanding were
used to address research question 2. The findings from the semi-structured student
interviews used to evaluate the validity of the instrument. Additionally interviews were
used to uncover any issues regarding how the questions are contrasted
Chronbach’s Coefficient Alpha
Following the review on content experts and revision, the two-tier survey items
were administered to 97 college freshmen enrolled in an introductory biology laboratory.
An analysis of the 11 two-tiered survey items using the SPSS program generated a
Chronbach’s alpha value of 0.52. This value was moderately low considering an
acceptable threshold for most reliability measures is greater than 0.70 (Streiner, 2003).
However, other two-tiered instruments have reported similarly lower alpha values (e.g.,
Tan et al., 2002 – 0.68 and Tsui & Treagust, 2010 – 0.75 and 0.64). Although Tsui &
Treagust conducted a pretest and posttest analysis for Chronbach’s alpha, the results are
still comparable.
Another way to examine test reliability is to split the number of test items in half,
and generate an alpha coefficient for each of the two question groups. This is known as
split-half reliability (Streiner, 2003). The genetics survey instrument was designed with
multiple test item domains, which were grouped into four separate larger concepts (see
table 4.1). The Chronbach coefficient alpha values for each of the test item domains
included 0.287 (nature of genetic material), 0.639 (gene expression), 0.225 (molecular
properties in a system), and -0.084 (genetic behaviors). These results indicate major
issues of internal consistency within the survey instrument. A negative reliability

51
coefficient among students answering the test items within the gene behaviors domain
indicates a violation of the reliability assumptions. However because each of the answer
choices across both question tiers were linked to one another, this could influence the
coefficient alpha values. Additionally, this outcome could also be affected by students’
poor understanding. These poor alpha coefficients suggest students could also indicate
guessing in their responses; although, analysis of students short answer responses and
interview data reported below do suggest some level of understanding regarding the
content addressed in the question. Furthermore, as described through the chapter,
students made comments about the difficulty of the instrument, which could also
influence alpha values (Streiner, 2003).
Table 4. 1 Chronbach Coefficients of Instrument Question Domains
Instrument Domain Test Items Alpha Coefficient
Nature of genetic material Q1, Q7 Q8 0.287 Gene expression Q2, Q3, Q4 0.639
Molecular properties in a system Q5, Q6 0.225
Genetic behaviors Q10, Q11 *-0.084 Overall alpha coefficient 0.52 *Negative value indicates a violation reliability measure assumptions
Nature Of Genetic Material
Questions 1, 7 and 8 assessed college freshmen’s understanding about the gene
concept. That is the structure and function of genetic material. Specifically how do
student define genes and how do genes function. Additionally, the questions also assessed
students’ formal reasoning for selecting a particular answer choice. Question 1 focused
on identifying the structure of a gene. Students were expected to identify a gene as a
sequence of DNA that codes for a protein. It is then the information in the newly formed

52
protein product that relates to a particular trait. Additional understandings also related to
how genetic information is structured in the body and other relationships between genes
and how that material is organized in the body. Question 7 assesses student understanding
about how specialize cells and biological components arise through processes of
differently gene expression. Question 8 assessed students understanding about the
function of a gene. In this question, students must select the best answer that describes
their thinking of gene function. This question was designed with no correct answer in
mind, but to assess what types of ideas and understanding students possess related how
genes function. Additionally, this question assessed in what context do students think
about the gene concept.
Question 1: Structure Of A Gene
Question 1 response patterns. Question 1 was used to assess student
understanding of the gene concept at the molecular or submicroscopic level (Tsui &
Treagust, 2010). Table 4.2 presents the percentages of students who selected various
responses across both tiers. The first tier assessed how students describe a gene, while the
second tier assess why students chose that particular description of a gene. A Student’s
response was considered correct if they selected option B (a sequence of instructions that
codes for a protein) for the first tier, and option A (it is about the information of a gene
for producing a trait). This is what Tsui and Treagust (2010) indicated as the most
sophisticated conception of a gene given the other answer choices. Of the college
freshmen assessed (n=97), 31% (n=30) of students sampled correctly answered the test
item in both first and second tier answer choices; that is options B – A in the first and
second tier, respectively.

53
Even though about a third of freshmen (31%) were able to answer both tiers
correctly, comparing other response patterns suggests that freshmen biology students
possess a variety of combinations of tier one and tier two responses about a gene. Other
answer combinations that could be considered correct were options A – B (7%, n=7) and
C – C (5%, n=5); however, as Tsui and Treagust (2010) cite, these answer combinations
indicate other alternative conceptions of material genes. In these combinations students
reasoning about genes focus on physical descriptors of genes or described genes as
biophysical entities rather than information coding for proteins. Additionally, 18%
(n=17) of students selected the correct response in the first tier only (option A); while
28% (n=27) of students selected the correct response in the second tier only (option B).
This suggests that using the two-tiered is able to provide a more realistic view of student
understanding and reasonings. The second most common answer combination (18%,
n=17) were students who selected options D-A. Other answer combinations included
options B – C (9%, n=9) and C – B (8%, n=8).
Question 1 interview data. 15 semi-structured student interviews were used to
assess the face validity of the test items. When asked to answer the question and explain
why they chose that particular answer over others, student were able to articulate their
reasonings for selecting between answers. 11 of the students interviewed gave
descriptions and reasonings that matched with responses to question 1 on their survey.
Additionally, 5 out of 15 (33%) student interviewees were able to articulate a gene as a
sequence of information that codes for a protein. This percentage of students is nearly

54
Table 4.2 Question 1 Student Response Pattern Percentages
Question 1: Which of the following is the best description of a gene? (Adapted from Tsui & Treagust, 2010)
Choice (second tier)
Choice (first tier)
A. It is about the information of a gene for producing a trait.
B. It is about the structural relationship between a gene and a chromosome.
C. It is about the chemical nature of a gene.
D. It is about the gene being a protein.
Total (N=97)
A. The smallest unit of structure in a chromosome
3.1 7.3 0 0 10.4
B. A sequence of instructions that codes for a protein.
31.3 * 2.1 9.4 4.2 46.9
C. A segment in a DNA molecule
8.3 8.3 5.2 1 22.9
D. The smallest heritable unit for a physical characteristic.
17.7 0 2.1 0 19.8
Total 60.4 17.7 16.7 5.2 100
* Correct answer.
identical to the survey response patterns indicated above. Interestingly, when asked,
“What is a gene?” All five of those students were able to define genes as coding for
proteins, but also used other descriptions when elaborating their definition. One such
interview the represents this was with a freshmen female student, Queen (pseudonym).
LeVaughn: Ok, so what is a gene?

55
Queen: Codes for a protein. That’s the immediate thing that I think of – Um, then I
also pictured in class – like where I was - My professor and what slide she
was on.
LeVaughn: OK. Why did you pick B?
Queen: Well, ‘cause I thought codes for a protein, and that’s what I pick all the
time for that one. (laughs).
LeVaughn: Is that one of those things you just memorize?
Queen: Um, yeah. Well that is more of a definition. I have a harder time picking
answers when it comes to conceptual questions – that would apply to
certain situations. But, that one [question 1] I’m almost certain about that
specific answer
In the excerpt Queen’s description of genes coding for proteins, as a memorable fact she
learned from class highlights students use of class vocabulary in their reasoning rather
than describing the process. This finding was also a common theme in other student
interviews. However, Queen is also able to articulate more fully here understanding of a
gene as coding for proteins, as demonstrated in the continuation of Queen’s excerpt.
LeVaughn: Why not some of the other ones?
Queen: Well, C and D were also definitions for other – words I guess. Vocabulary.
Uh, I guess C is correct. That it’s a segment in the DNA molecule. I guess
that could also apply to definitions, but since it says best.
LeVaughn: what other kinds of vocabulary would the other answers be referring
to?

56
Queen: Um, smallest unit [answer B], I think of atom or cell. But not what does
into part of it [gene]. I associate smallest, that – I guess that word. So, I
wouldn’t put that with gene. I would put that with atom.
LeVaughn: So there’s a unit smaller than a gene itself?
Queen: Yeah.
LeVaughn: What would that be?
Queen: I am thinking atom, but smallest heritable unit. I would think DNA
molecule.
LeVaughn: What about for a physical trait?
Queen: That corresponds to phenotype to me. So then that just breaks it down into
a larger subset of possible answer. Yes genes to code for proteins, which
code for a particular phenotype. But that’s more detailed than I knew this
question was asking.
The above conversation illustrates how Queen is able to articulate of she conceptualizes
genes as coding for proteins. Queen is also able to differentiate and general navigate
various answers about gene structure, which was also representative of other interviews.
This conversation also matches her answer (a sequence of instructions that codes for a
protein) selected for the first tier of question 1. This suggests some face validity in that
the first tier is able to accurately measure student ideas about the structure of a gene.
Below is the final part of the conversation regarding the second tier.
LeVaughn: Let’s talk about the reasoning in the second part. Walk me through
your thoughts.

57
Queen: I picked A. So – that’s what I was saying with - how genes code for a
protein, which ultimately correspond with that genotype and phenotype for
that individual. So it’s just information of the gene itself.
LeVaughn: So it takes it a step further, like a code that does something?
Queen: Yeah. I think that could even be a description of a gene too.
LeVaughn: what about the other choices?
Queen: Um. (pause). Well C – the chemical nature – that’s not. (pause). I think of
more what its made of – so that’s when I would start thinking about the
components of a gene.
LeVaughn: what are those components?
Queen: Um. That’s when I think of – Switches. And the – you break it down
every further. Like the tails and the caps.
LeVaughn: so the chemical structures that makes up a gene?
Queen: yeah.
LeVaughn: What about D?
Queen: D. Uh. Well I think a gene codes for a protein. So a gene isn’t necessarily
a protein. I guess if you thought about it for a long time you could maybe
convince yourself they’re saying the same. But I think it’s different from
coding for something.
LeVaughn: So you feel like what you selected, A, accurately describes your
reasoning for the first part?
Queen: Yeah.

58
The excerpt above is representative of how other student’s approached responding
to the second tier in terms of reasoning. Here, Queen’s response show the question stem
and answers are clear and understandable given her knowledge of the structure of genes.
Additionally, her conversation highlights the benefit of connecting student reasoning to
content knowledge. The excerpt illustrates that Queen is able to connect a gene as coding
for a protein in tier one with her reasoning that the information coding is used to produce
a trait. This matches with her survey response (it is about the information of a gene for
producing a trait). This is also observed later in the above conversation with Queen
relates her answer to what she previously mentioned about the information within genes
coding for proteins, and that those protein continue to carry out a particular function or
trait.
Question 7: Differential Gene Expression
Question 7 response patterns. Question 7 was adapted from the Genetics Literacy
Assessment (Bowling et al., 2008). The survey item itself did not use a two-tiered format;
however, the question stem was borrowed and adapted to become the first tier, while
answer choices were created based on student conceptions cited in the literature. These
include students’ reasoning about gene expression related to the how genetic information
is organized in a cell (i.e. the number of genes or kinds of genes), or how the genetic
material functions to express certain cellular characteristics (i.e. the environment
determines a cell features or traits).
To correctly answer question 7, students need to understand that different cell
types arise from the activation or suppression of different genes, rather than different
cells possessing different types of genes or a different number of genes. This is reflected

59
in the majority of responses (80%, n=77) that correctly selected option C for the first tier.
Although, students need to also understand that a cell’s gene activity can be related to a
particular phenotype, in this case different cellular characteristics. A student’s answer
was considered correct when students selected an option combination of C – D. That is,
different cell functions are determined by the activation of different genes (option C),
which results from the flexibility of our genetic make-up in determining a particular
expressed trait, or phenotype. This was seen in 25% of students (n=24) selecting options
C – D for the first and second question tiers, respectively (Table 4.3).
However, 37% of students (n=35) selected the answer combination of C – B, that
different cell functions result from genes that are expressed differently, and that it’s those
genes that determine a cell’s function. Similarly, 13% (n=13) selected options C – A, that
different cell features arise from activation of different genes, because a cell’s genes
influences if physical traits. Both answer combinations reflect more of a superficial
reasoning: that a cell’s genotype determines phenotype.
Question 7 interview data. During the 15 student interviews, common themes
across student responses. One common them was students’ use of the terms gene
activators or switches to describe answers for the first tier of Question 7. In six of the
interviews, students used activators or switches to explain how different cell functions
can develop by turning on or off different genes. An excerpt from Ben (pseudonym)
illustrates this point.
Ben: I said activates different genes.
LeVaughn: Ok, walk me through why.

60
Table 4. 3 Question 7 Student Response Pattern Percentages
Question 7: Your muscle cells, nerve cells and skin cells all have different functions because each type of cell: (adapted from Bowling et al, 2008)
Choice (second tier)
Choice (first tier)
A. It refers to the cell's genetic make-up playing a role in its physical traits
B. It refers to the cell's function being determined by its genes
C. It refers to the cell's genetic make-up being shaped by its environment
D. It refers to the flexibility of the cell's genes in its function
Total (N=97)
A. Contains different kinds of genes.
9.4 6.3 0 0 15.6
B. Have experienced different mutations
0 2.1 0 0 2.1
C. Activates different genes.
13.5 36.5 5.2 25 * 80.2
D. Contains different number of genes.
1 1 0 0 2.1
Total 24 45.8 5.2 25 100
* Correct answer
Ben: Ok. This one - I’m fairly confident in, because I know that – your genes –
like your hair cells – have the entire genetic information in your entire
body. Your DNA is your DNA. Your DNA has every bit of genetic
material in entire strand of DNA in your body. Your [cells] have all that
genetic information, but they are only are activated – the switches turn the
promoter, I believe. Let’s see. The switches are the light switches and

61
something else is the finger as well – we were taught in biology. Like in
an example. So the genes that code for muscle cells are going to be turned
on, where your muscle cells are – Let’s say your trying to build arm
muscle. The skins cells aren’t going to be turned on if your trying to make
the actual muscle...
LeVaughn: …What about for your reasoning in the second part?
Ben: My reasoning. I said A [reads answer]. So like I said. Um, If your going to
make a muscle cell. You’re not going to use skin cell genetic information
to create a muscle cell. You’re going to use muscle cell genetic
information, or muscle genes.
This description also matches both the first and second tier answers provided in
Ben’s survey, option C (activates different genes) and option A (it refers to the cell's
genetic make-up playing a role in its physical traits). Similarly Ben’s second tier response
represents another emerging theme: even though a cell can activate different genes, its
traits are still determined by the cell’s genetic material. These students explained that
genes are not flexible, and that they only coded for what they are designed to create. This
kind of reasoning was present in half of interviews, and may help explain why only 25%
of student correctly selected options C – D. An excerpt from Jon also highlights this
point.
LeVaughn: You said something about the genetic makeup. What about that genetic
makeup?
Jon: Um, I guess it will - it will code for different structures. Like muscle cells are
long and stringy, which makes them very different from – Um, I guess nerve

62
cells are kind of long. Like a skin cell, which it’s more like a blob. And I
think that has a lot to do with their genes just different, therefore they make
completely different proteins, and that’s why they look different and do
different things.
LeVaughn: Ok, what about B?
Jon: Uh, refers to cells function being – uh. It’s not wrong. I just think A is more
specific about it. Uh, “ the cell’s genetic makeup being shaped by its
environment” – that’s true and that goes with the mutation one [tier 1
response], but – I don’t think its mutations that would have them so vastly
different from each other. Um, refers to flexibility and genes and its function
– (long pause) Um. [Repeats answer aloud]. I don’t think genes have a lot of
flexibility - I think, whatever they code for is what they do. So I don’t like
that.
LeVaughn: So, was it the word “flexibility” that made you not like that answer.
What about that word choice?
Jon: Well, when I think of a gene – I could be off here, but I think more like DNA
is blueprint for genetic information and genes kind of fit into that genetic
information – if it’s going to code for something, it’s going to do that. And
with flexibility – it’s going to do this or going to do that. That I don’t think
makes sense.
Question 8: Function Of A Gene
Question 8 response patterns. The concepts assessed in question 8 build upon the
concepts assessed in question 1. However, question 8 assesses students understanding of

63
how genes function. In other words, what are the roles of a gene? Here the students are
tasked to select a description of function based on their current understanding of genes.
Rather than one correct answer, the question mainly assesses in what context do student
view the function of genes. These options were developed using the findings from how
genes are presented in college textbooks (Flodin, 2009). In Question 8, the answer
choices were designed to reflect the contextual categories outlined by Flodin (2009),
which ranges across multiple biological research contexts; and across ontological levels
from the molecular level to population level. They include, molecular genetics (option
A), transmission genetics (option B) genomics (option C), and population genetics
(option D). The second tier of question 8 was made into a short answer response, in
which students were asked to explain why they selected their particular answer in the first
tier. Student responses were analyzed for level of understanding (Table 4.4) using a 0 – 5
scoring rubric (Appendix A), and were coded into common categorical themes for
analysis (Table 4.5).
Question 8 student response patterns (Table 4.4) show option A (provides an
information code) was the most commonly selected answer in the first tier (50%, n=48).
Option B (Determines a particular version of a character or trait) and option C (controls
how information is expressed) were the next picked answers with 28% (n=27) and 22%
(n=21) students respectively. This suggests that students generally view gene function in
terms of an information carrier. The findings also indicate that students view gene

64
Tab
le 4
. 4 Q
uest
ion
8 St
uden
t Res
pons
e Pa
tter
n Pe
rcen
tage
s
Que
stio
n 8:
Bas
ed o
n yo
ur u
nder
stan
ding
, whi
ch o
f the
follo
win
g de
scrib
es th
e fu
nctio
n of
a g
ene?
Le
vel o
f Und
erst
andi
ng (s
econ
d tie
r)
C
hoic
e (f
irst t
ier)
0
- No
Und
erst
andi
ng
1 - I
ncor
rect
/ Sc
ient
ific
Mis
conc
eptio
ns
2 - S
cien
tific
Fr
agm
ents
with
M
isco
ncep
tion
3 - P
artia
lly
Scie
ntifi
c N
otio
n
4 - S
cien
tific
M
inor
Ju
stifi
catio
n
5 - S
cien
tific
w
ith
Just
ifica
tion
Tota
l (N
=97)
A. P
rovi
des a
n in
form
atio
n co
de
2.1
6.2
37.1
4.
1**
0**
0**
49.5
B. D
eter
min
es a
pa
rticu
lar v
ersi
on o
f a
char
acte
r or t
rait
1 6.
2 18
.6
2.1
0 0
27.7
C. C
ontro
ls h
ow
info
rmat
ion
is e
xpre
ssed
1
9.3
11.3
0*
0*
0*
21
.6
D. U
sed
to m
ark
how
tra
its c
hang
e in
a
popu
latio
n 0
0 0
0 0
0 0
All
answ
ers
0 0
0 1
0 0
1
Tota
l 4.
1 21
.6
67
7.2
0 0
100
* C
orre
ct a
nsw
er. M
ultip
le a
nsw
ers w
ere
mar
ked
as c
orre
ct d
ue to
the
use
of th
e ge
nera
l 0-5
scor
ing
rubr
ic d
evel
oped
for t
he
shor
t ans
wer
que
stio
ns. I
n th
at ru
bric
, ans
wer
s tha
t wer
e ev
alua
ted
at a
leve
l of u
nder
stan
ding
of 3
or g
reat
er w
ere
cons
ider
co
rrec
t. Th
is w
as d
ue sh
ort a
nsw
er sc
ores
of 3
still
gen
eral
ly c
orre
ct b
ut v
ague
in n
atur
e, w
hile
scor
es o
f 4 a
nd 5
wer
e co
rrec
t bu
t sup
porte
d an
d re
ason
ed.
**
Gen
eral
ly c
orre
ct a
nsw
er, b
ut le
ss so
phis
ticat
ed a
nsw
er. M
ultip
le a
nsw
ers w
ere
mar
ked
as c
orre
ct d
ue to
the
use
of th
e ge
nera
l 0-5
scor
ing
rubr
ic d
evel
oped
for t
he sh
ort a
nsw
er q
uest
ions
.

65
T
able
4. 5
Que
stio
n 8
Tie
r T
wo
Cod
ing
Cat
egor
ies
C
ateg
ory
St
uden
t Exa
mpl
es
%
(N
=97)
Tier
2
Prov
ides
info
rmat
ion
to m
ake
prot
eins
•
Gen
es c
ode
for p
rote
ins.
The
gene
s pro
vide
info
rmat
ion
this
w
ay.
23.7
•
Gen
es a
re u
sed
to m
ake
prot
eins
, whi
ch in
retu
rn, f
orm
our
tra
its. A
n ex
ampl
e ca
n be
blo
nde
vers
us b
row
n ha
ir.
Pr
ovid
es In
form
atio
n to
de
term
ine
parti
cula
r tra
its
• B
ecau
se a
gen
e de
term
ines
not
con
trols
or u
sed
to m
ark
traits
or
pro
vide
s inf
orm
atio
n 21
.6
• A
gen
e is
mer
ely
a co
de o
f inf
orm
atio
n, w
hen
read
by
a ce
ll th
is c
ode
can
be u
sed
to d
eter
min
e al
l kin
ds o
f tra
its a
nd
func
tions
A
cod
e of
info
rmat
ion
abou
t tra
its
• G
enes
hav
e in
form
atio
n fo
r tra
its th
at a
re e
xpre
ssed
17
.5
• A
gen
e do
es n
ot n
eces
saril
y sh
ow in
phy
sica
l cha
ract
eris
tics,
or sh
ow e
volu
tiona
ry c
hang
e. It
onl
y pr
ovid
es in
form
atio
n.
Con
trols
exp
ress
ion
via
gene
tic
switc
hes/
act
ivat
ors
• W
ell t
he g
ene
uses
switc
hes t
o ac
tivat
e ce
rtain
trai
ts. T
hese
sw
itche
s are
con
trolle
d th
roug
h pr
otei
ns, a
llow
ing
the
body
to
acce
ss d
iffer
ent t
raits
whe
re th
ey a
re n
eede
d.
15.5
•
Gen
es e
xpre
ss tr
aits
. The
y in
fluen
ce th
e ph
ysic
al a
spec
t in
and
out o
f the
bod
y.

66
Ta
ble
cont
inue
d fr
om p
age
65
In
form
atio
n or
trai
ts p
asse
d do
wn
from
par
ent t
o of
fspr
ing
• B
ecau
se a
func
tion
of a
gen
e do
es c
arry
info
rmat
ion.
It c
an b
e pa
ssed
dow
n an
d it
is h
ered
itabl
e.
7.2
• G
enes
det
erm
ine
a pa
rticu
lar t
rait
beca
use
they
hav
e di
ffer
ent
code
s tha
t cod
e fo
r diff
eren
t tra
its &
func
tions
. Gen
es a
re a
lso
pass
ed d
own
so th
ey a
re v
ery
parti
cula
r in
diff
eren
t peo
ples
D
NA
.
Gue
ssed
, too
vag
ue o
r no
resp
onse
•
I've
lear
ned
the
defin
ition
of a
gen
e an
d ap
plie
d it.
I al
so u
sed
the
proc
ess o
f elim
inat
ion
6.2
A
segm
ent o
f DN
A th
at c
odes
fo
r Inf
orm
atio
n •
Each
gen
e (p
art o
f a D
NA
sequ
ence
) det
erm
ines
a d
iffer
ent
func
tion/
trai
t 5.
2
• A
gen
e is
mad
e up
of D
NA
a se
quen
ce. T
his s
eque
nce
is th
e sa
me
in e
very
gen
e.
Indi
cate
d m
ultip
le o
ptio
ns
corr
ect i
n re
spon
ses
• I c
hose
all
of th
e an
swer
s in
8 be
caus
e th
ey a
ll co
uld
be
supp
orte
d. A
gen
e pr
ovid
es in
form
atio
n an
d ca
n de
term
ine
a ve
rsio
n of
a c
hara
cter
or t
rait
beca
use
a ge
ne d
eter
min
es th
e se
quen
ce o
f am
ino
acid
s, w
hich
det
erm
ines
the
prot
ein
and
outs
ide
trait.
Thi
s con
trols
how
it is
exp
ress
ed. G
enes
can
als
o ev
olve
3.1

67
function in terms determining particular traits, and controlling how information is used.
None of students selected option D, while 1 student indicated as choosing all the answer
choices.
Moreover, second tier response patterns indicate a superficial understanding of
gene function. Sixty seven percent (n=65) of student responses were scored as having
scientific fragments with misconceptions (level 2), and 22% (n=21) of responses
possessed some form of misconception (level 1). In both of these instances, student
reasonings included information that was either general and partially correct (level 2) or
vague and incorrect (level 1). Only 7% (n=7) of second tier responses were correct but
general in nature (level 3). None of the students were scored at level 4 or level 5.
When comparing both answer tiers together, a small percentage of students (4%,
n=4) selected the description of genes as providing an information code (option A) in the
first tier provided reasoning at a level of understanding that was correct, although it was
general in nature (Rubric level 4, see Rubric in Appendix). However, the majority of
students (37%, n=36) who selected option A scored a level of understanding in the
second tier. This means their reasonings contained information that was partially correct,
or contained statements with factual information, or scientific fragments. Those students
that selected option B and C had similar results. Only 2% (n=2) students who selected
option B scored a level 3 in the second tier. Whereas none of the students who selected
option C scored higher than level 2.
Analyzing students’ second tier short answer responses by theme supports
students topical understanding of gene function. A summary of the short answer themes
and student examples can be found in Table 4.5. A majority of student tier two responses

68
contained reasonings related to genes acting as information – either to make proteins
(23%, n=23), determine particular traits (21%, n=20), or some information about those
traits (18%, n=17). Two interesting findings were the percentage of students whose
responses contained reasonings connecting gene function to controlling/ activating
expression via “genetic switches” (15%, n=15), and the idea that genes function as a
vehicle to pass genetic information from parent to offspring (7%, n=7). Responses that
fell into these two later categories tended to show option B or C selected for the first tier,
respectively.
Student interview data. In order to validate the response patterns shown above,
interview transcripts were reviewed to check for similar response patterns as well as
disconfirming evidence regarding question 8. During these interviews, student were
asked think aloud concerning how they responded to question 8 with specific focus on
what they thought about the function of a gene. Students were then asked to explain why
they selected that particular answer choice. During the interviews, students frequently
indicated they would have selected multiple answer choices if given the opportunity.
However, as they thought about the question students were able to arrive at an option that
best reflected their thinking. When probed further about simply guessed or actually
selecting an answer reflecting their understanding, students generally were able to explain
why they selected their particular answer, which were in agreement with their survey
responses. The following presented below excerpt from Ben (pseudonym) illustrates this
point.
LeVaughn: So walk me through your thinking about that question.

69
Ben: I answered C. Let’s start with A though. Provides an information code. Um -
That sounds OK. I understand - they code for DNA and stuff like that. B –
(reads aloud). That also sounds pretty good. Kind of what I just said. C
(reads aloud). That’s really like A and B – a lot of these are good answers.
D (reads aloud) Um - not necessarily. That more the alleles, I believe. Um,
I would be between A, B, and C. Probably the word expressed is what got
me. Because I know you can express genes in certain situations.
Sometimes that don’t get expressed and sometimes they do.
LeVaughn: So you said you were stuck between A, B, and C. Was it because they
were all somewhat true based on your understanding?
Ben: Yeah. I’m looking for the better answer between the three.
LeVaughn: How did you determine between which one would be the best?
Ben: Um, well on my paper I wrote down [reads response]. Um – that really
doesn’t help me. (pause) controls how information is expressed –
LeVaughn: Was it something about the word “expressed” that clued you into that
answer?
Ben: Yeah, because it says, describe the function. Yes, I do believe [genes] hold
information. That would probably narrow it down to A and C. (pause in
thought)(mumbles to self). Like – I’m seriously in the middle of these.
This is hard. I probably picked C, because I wasn’t really sure.
LeVaughn: Was it a guess? Or was does that accurately describe your thinking?
Ben: Yeah (nods to second question). Because – expressed really hung me up. I
know genes are expressed.

70
LeVaughn: So it wasn’t that you were confused by the answers. Option C
sounded better to you.
Ben: yeah (nods to first statement).
The above conversation illustrates the relative difficulty students had in selecting
between different descriptions of gene function. During interviews student grappled with
selecting an option that best reflected understanding of a gene. However, this behavior
differed from simple guessing or process of elimination. As Ben’s conversation shows,
stated students had difficulty in asked to consider what they understood about genes
before making a selection. Also, Ben’s conversation was representative of how students
utilized their prior understanding about how gene function to answer question 8. When
asked if he choose multiple answers if given the opportunity Ben agreed, as show in the
excerpt below.
LeVaughn: So, was this question really difficult? In that, you were trying to
decipher the truest answer.
Ben: yeah, because I knew they [A, B, and C] were all good answers – So that’s
three out of four answers, so yeah. That was a harder question on this
[test].
LeVaughn: So if you were given the option to choose more than one, would you?
Ben: Oh yeah. All – A, B, and C. Definitely. If there was an option E that said A,
B and C. I would have definitely picked it. (pause) that’s how a lot my
[biology lecture] teachers do it. They’ll have it A through F. And A will be
on. B will be another, and C will be another. And then option A and B, A
and C. Stuff like that.

71
Ben’s conversation highlights an issue with question 8. Students noticed that not
one particular answer stood out as being more correct over the other. Rather students
grappled with arriving at an answer that best described their understanding. Ben also
compared his past experiences with other exam in biology. This was also apparent in
other interviews, in which students explained that in their biology coursework they have
never been asked to explain their reasoning for particular answers. This finding of overall
test difficulty could be the result of the two-tiered format being new to students
(discussed in the following chapter).
Gene Expression
In this topic, students need to understand the fundamental process of how the
information in DNA is used to make a functional unit, protein. This process is commonly
referred to as gene expression (or central dogma), and is focus of questions 2, 3 and 4. All
three questions were designed to build directly upon each other. Question 2 focuses on a
smaller fundamental aspect of enzyme function as it relates to transcription (i.e., how
DNA is first converted in to RNA). Specifically, what do students understand in terms of
why enzymes in this process only function in one direction? Question 3 assesses student
understanding in how and RNA intermediate is produced during transcription. Question 4
assesses the final step in gene expression, how an RNA intermediate codes for amino
acids used to produce a protein, or translation. Additionally, students need to understand
how each of these separate processes influences each other in a larger complex biological
system (i.e. how molecular components interaction within a biological system.). Also,
question 2, 3 and 4 all consist of short answer responses for both the first and second tier.
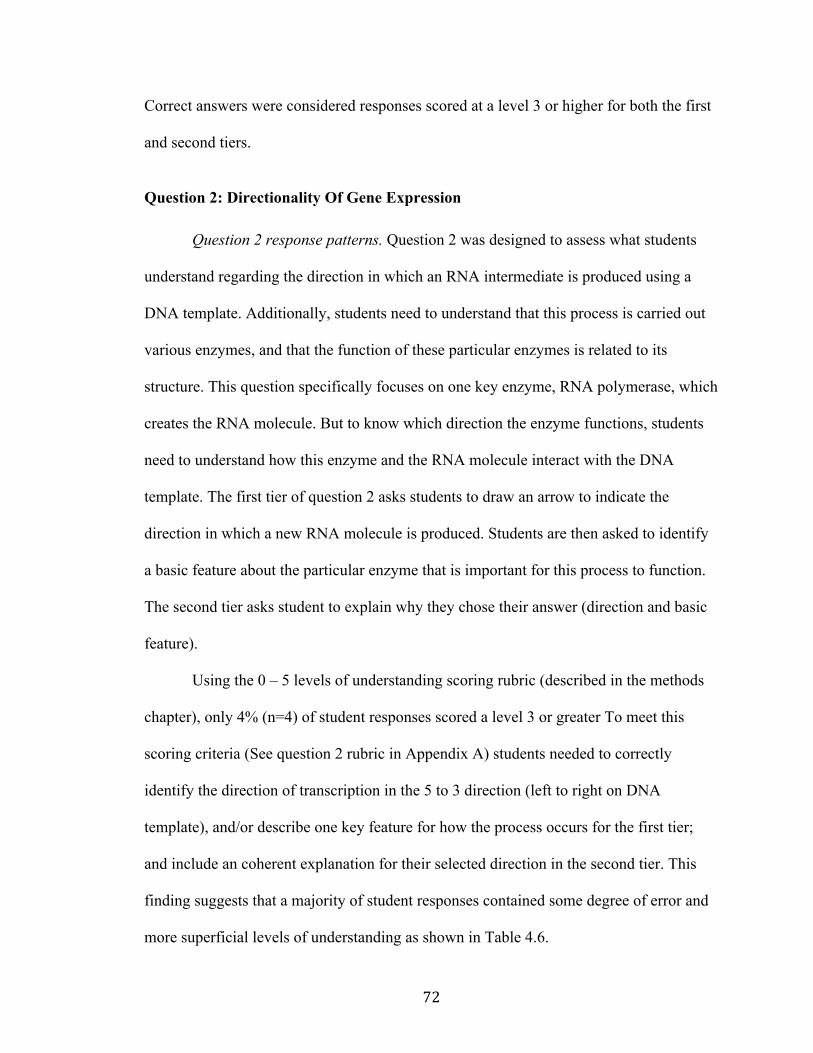
72
Correct answers were considered responses scored at a level 3 or higher for both the first
and second tiers.
Question 2: Directionality Of Gene Expression
Question 2 response patterns. Question 2 was designed to assess what students
understand regarding the direction in which an RNA intermediate is produced using a
DNA template. Additionally, students need to understand that this process is carried out
various enzymes, and that the function of these particular enzymes is related to its
structure. This question specifically focuses on one key enzyme, RNA polymerase, which
creates the RNA molecule. But to know which direction the enzyme functions, students
need to understand how this enzyme and the RNA molecule interact with the DNA
template. The first tier of question 2 asks students to draw an arrow to indicate the
direction in which a new RNA molecule is produced. Students are then asked to identify
a basic feature about the particular enzyme that is important for this process to function.
The second tier asks student to explain why they chose their answer (direction and basic
feature).
Using the 0 – 5 levels of understanding scoring rubric (described in the methods
chapter), only 4% (n=4) of student responses scored a level 3 or greater To meet this
scoring criteria (See question 2 rubric in Appendix A) students needed to correctly
identify the direction of transcription in the 5 to 3 direction (left to right on DNA
template), and/or describe one key feature for how the process occurs for the first tier;
and include an coherent explanation for their selected direction in the second tier. This
finding suggests that a majority of student responses contained some degree of error and
more superficial levels of understanding as shown in Table 4.6.
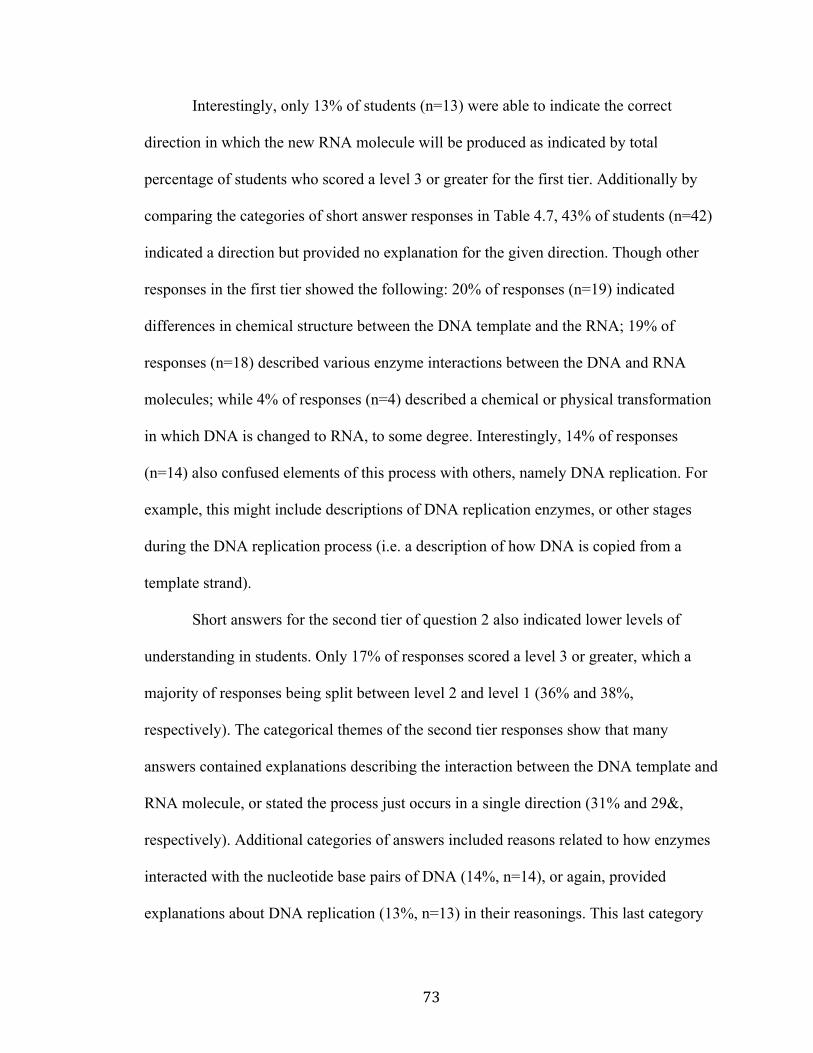
73
Interestingly, only 13% of students (n=13) were able to indicate the correct
direction in which the new RNA molecule will be produced as indicated by total
percentage of students who scored a level 3 or greater for the first tier. Additionally by
comparing the categories of short answer responses in Table 4.7, 43% of students (n=42)
indicated a direction but provided no explanation for the given direction. Though other
responses in the first tier showed the following: 20% of responses (n=19) indicated
differences in chemical structure between the DNA template and the RNA; 19% of
responses (n=18) described various enzyme interactions between the DNA and RNA
molecules; while 4% of responses (n=4) described a chemical or physical transformation
in which DNA is changed to RNA, to some degree. Interestingly, 14% of responses
(n=14) also confused elements of this process with others, namely DNA replication. For
example, this might include descriptions of DNA replication enzymes, or other stages
during the DNA replication process (i.e. a description of how DNA is copied from a
template strand).
Short answers for the second tier of question 2 also indicated lower levels of
understanding in students. Only 17% of responses scored a level 3 or greater, which a
majority of responses being split between level 2 and level 1 (36% and 38%,
respectively). The categorical themes of the second tier responses show that many
answers contained explanations describing the interaction between the DNA template and
RNA molecule, or stated the process just occurs in a single direction (31% and 29&,
respectively). Additional categories of answers included reasons related to how enzymes
interacted with the nucleotide base pairs of DNA (14%, n=14), or again, provided
explanations about DNA replication (13%, n=13) in their reasonings. This last category

74
Tab
le 4
. 6 Q
uest
ion
2 St
uden
t Res
pons
e Pa
tter
n Pe
rcen
tage
s
Que
stio
n 2:
Dra
w a
n ar
row
on
the
DN
A se
quen
ce b
elow
to in
dica
te th
e di
rect
ion
in w
hich
a n
ew R
NA
is p
rodu
ced?
Wha
t bas
ic fe
atur
e ab
out t
his
enzy
me
allo
ws t
he p
roce
ss to
occ
ur?
Writ
e yo
ur a
nsw
er b
elow
.
Le
vel o
f Und
erst
andi
ng (s
econ
d tie
r)
Le
vel o
f Und
erst
andi
ng
(firs
t tie
r)
0 - N
o U
nder
stan
ding
1 - I
ncor
rect
/ Sc
ient
ific
Mis
conc
eptio
ns
2 - S
cien
tific
Fr
agm
ents
w
ith
Mis
conc
eptio
n
3 - P
artia
lly
Scie
ntifi
c N
otio
n
4 - S
cien
tific
M
inor
Ju
stifi
catio
n
5 - S
cien
tific
w
ith
Just
ifica
tion
Tota
l (N
=97)
0 - N
o U
nder
stan
ding
0
0 0
0 0
0 0
1 - I
ncor
rect
/Sci
entif
ic
Mis
conc
eptio
ns
0 16
.5
18.6
21
0
0 37
.1
1.5
0 0
1 0
0 0
1 2
- Sci
entif
ic
Frag
men
ts w
ith
Mis
conc
eptio
n 4.
1 21
.6
11.3
10
.3
1 0
48.5
3 - P
artia
lly S
cien
tific
N
otio
n 3.
1 0
5.2
4.1
* 0
0 12
.4
4 - S
cien
tific
Min
or
Just
ifica
tion
1 0
0 0
0 0
1
5 - S
cien
tific
with
Ju
stifi
catio
n 0
0 0
0 0
0 0
Tota
l 8.
2 38
.1
36.1
16
.5
1 0
100
**
*Cor
rect
ans
wer
s
** T
otal
val
ues d
o no
t equ
al 1
00 d
ue to
roun
ding

75
Tab
le 4
. 7 Q
uest
ion
2 C
omm
on T
hem
e C
ateg
orie
s
C
ateg
ory
St
uden
t Exa
mpl
es
%
(N=9
7)
Tier
1
Dire
ctio
n w
ith n
o ex
plan
atio
n 3'
to 5
' 43
.2
5'
to 3
'
D
iffer
ence
s in
chem
ical
st
ruct
ure
betw
een
mol
ecul
es
à C
ompl
emen
tary
bas
e pa
iring
allo
ws t
he D
NA
to b
e ea
sily
cop
ied
19.6
à m
RN
A is
pro
duce
d in
the
5' to
3' d
irect
ion.
DN
A is
ant
ipar
alle
l.
En
zym
e in
tera
ctio
ns b
etw
een
mol
ecul
es
à T
he sh
ape
of th
e en
zym
e 18
.6
à
It w
orks
its w
ay d
own
and
adds
nuc
leot
ides
on
beca
use
it bi
nds t
o th
e D
NA
.
C
onfu
se e
lem
ents
from
oth
er
proc
esse
s
ß T
he D
NA
hel
icas
e al
low
s thi
s to
occu
r. A
tem
plat
e st
rand
is u
sed
to
trans
crib
e &
repl
icat
e 14
.4
ß
DN
A p
olym
eras
e co
pies
the
sequ
ence
from
5' t
o 3'
.
Tr
ansf
orm
atio
n fr
om o
ne
mol
ecul
e to
ano
ther
ß
The
abi
lity
of u
raci
l to
repl
ace
thym
ine
as a
bas
e pa
ir 4.
1
ß R
NA
pol
ymer
ase,
it c
hang
es th
e D
NA
tem
plat
e to
RN
A
Tier
2
Inte
ract
ions
with
the
DN
A a
nd
RN
A p
rodu
ced
RN
A is
synt
hesi
zed
in th
e 5'
to 3
' dire
ctio
n. B
ut, t
he R
NA
will
be
antip
aral
lel t
o th
e te
mpl
ate
stra
nd
30.9
R
NA
is re
ad 5
' to
5' b
ut c
reat
ed 5
' to
3'
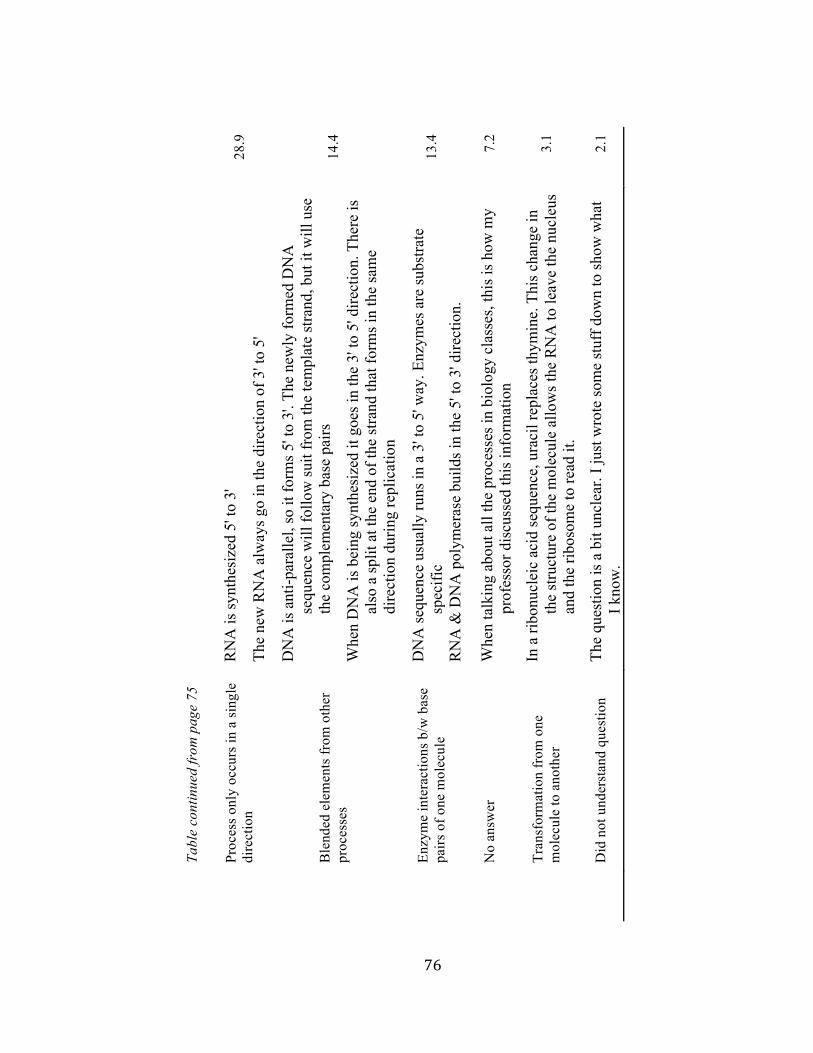
76
Ta
ble
cont
inue
d fr
om p
age
75
Pr
oces
s onl
y oc
curs
in a
sing
le
dire
ctio
n R
NA
is sy
nthe
size
d 5'
to 3
' 28
.9
Th
e ne
w R
NA
alw
ays g
o in
the
dire
ctio
n of
3' t
o 5'
B
lend
ed e
lem
ents
from
oth
er
proc
esse
s
DN
A is
ant
i-par
alle
l, so
it fo
rms 5
' to
3'. T
he n
ewly
form
ed D
NA
se
quen
ce w
ill fo
llow
suit
from
the
tem
plat
e st
rand
, but
it w
ill u
se
the
com
plem
enta
ry b
ase
pairs
14
.4
W
hen
DN
A is
bei
ng sy
nthe
size
d it
goes
in th
e 3'
to 5
' dire
ctio
n. T
here
is
also
a sp
lit a
t the
end
of t
he st
rand
that
form
s in
the
sam
e di
rect
ion
durin
g re
plic
atio
n
En
zym
e in
tera
ctio
ns b
/w b
ase
pairs
of o
ne m
olec
ule
DN
A se
quen
ce u
sual
ly ru
ns in
a 3
' to
5' w
ay. E
nzym
es a
re su
bstra
te
spec
ific
13.4
R
NA
& D
NA
pol
ymer
ase
build
s in
the
5' to
3' d
irect
ion.
N
o an
swer
W
hen
talk
ing
abou
t all
the
proc
esse
s in
biol
ogy
clas
ses,
this
is h
ow m
y pr
ofes
sor d
iscu
ssed
this
info
rmat
ion
7.2
Tr
ansf
orm
atio
n fr
om o
ne
mol
ecul
e to
ano
ther
In
a ri
bonu
clei
c ac
id se
quen
ce, u
raci
l rep
lace
s thy
min
e. T
his c
hang
e in
th
e st
ruct
ure
of th
e m
olec
ule
allo
ws t
he R
NA
to le
ave
the
nucl
eus
and
the
ribos
ome
to re
ad it
. 3.
1
D
id n
ot u
nder
stan
d qu
estio
n Th
e qu
estio
n is
a b
it un
clea
r. I j
ust w
rote
som
e st
uff d
own
to sh
ow w
hat
I kno
w.
2.1

77
(blending elements from other processes) was interesting, in that 5 out of the 15 students
elaborated on this and relied on picture representations by drawing the process of DNA
replication.
Question 2 interview data. During the interviews for questions 2 through 4,
students were asked to verbally walk the researcher through their thinking as they
answered each question regarding the different processes involved in gene expression.
During question 2 the focus was on why the process of transcription occurs in a particular
direction over another. However, a potential issue with the wording in question 2
frequently arose during the interviews. Nearly half the students (7 out of 15) indicated the
second part of tier one, What basic feature about this enzyme allows the process to occur,
tended to confuse students. In there conversations students stated that they were unsure if
basic feature about the enzyme related to its structure, its function, or molecular
properties. Jon’s conversation illustrates this potential source of confuse.
LeVaughn: [reads question 2 stem]. Talk to me how you answered that question.
Jon: I think I remember things are replicated 3’ to 5’. I could have that backwards.
[Indicates arrow in answer]. I was confused about –[rereads question
aloud] Um – Maybe its obvious. I unsure what ‘basic feature’ meant. Like,
what feature makes it go that direction? What feature makes it replicate
those letters [nucleotides] specifically? I wasn’t sure. Sorry
LeVaughn: Not your fault. (Laughs). When you see, “basic feature of an
enzyme,” what do you think that means?
Jon: I was thinking – I guess a “basic feature” would be its purpose, maybe. And
they would be to replicate the strand. So, I wasn’t that sure what would
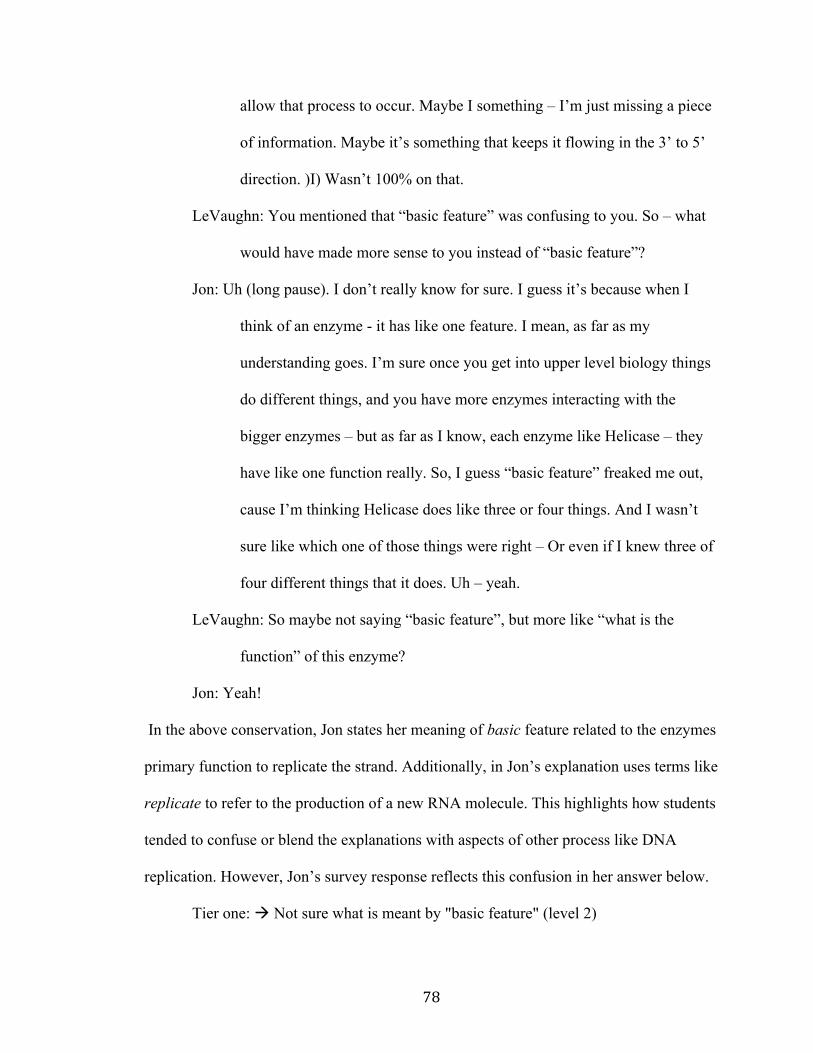
78
allow that process to occur. Maybe I something – I’m just missing a piece
of information. Maybe it’s something that keeps it flowing in the 3’ to 5’
direction. )I) Wasn’t 100% on that.
LeVaughn: You mentioned that “basic feature” was confusing to you. So – what
would have made more sense to you instead of “basic feature”?
Jon: Uh (long pause). I don’t really know for sure. I guess it’s because when I
think of an enzyme - it has like one feature. I mean, as far as my
understanding goes. I’m sure once you get into upper level biology things
do different things, and you have more enzymes interacting with the
bigger enzymes – but as far as I know, each enzyme like Helicase – they
have like one function really. So, I guess “basic feature” freaked me out,
cause I’m thinking Helicase does like three or four things. And I wasn’t
sure like which one of those things were right – Or even if I knew three of
four different things that it does. Uh – yeah.
LeVaughn: So maybe not saying “basic feature”, but more like “what is the
function” of this enzyme?
Jon: Yeah!
In the above conservation, Jon states her meaning of basic feature related to the enzymes
primary function to replicate the strand. Additionally, in Jon’s explanation uses terms like
replicate to refer to the production of a new RNA molecule. This highlights how students
tended to confuse or blend the explanations with aspects of other process like DNA
replication. However, Jon’s survey response reflects this confusion in her answer below.
Tier one: à Not sure what is meant by "basic feature" (level 2)

79
Tier two: replication occurs from 3' to 5', unsure what is meant by "basic feature"
so answer was provided (level 1)
In her response, Jon does not provide an explanation for her indicated direction on the
DNA template (à) other than her confusion about the wording, basic feature. This was
also representative in other student interviews. Furthermore, this finding could also
explain why a larger percentage of student answers contained a direction with no
explanation (43%), because students were potentially unsure what features the question
was referring about enzymes.
In her conversation related to her second tier response, Jon indicates her difficulty
remembering which the correct direction the transcription occurs. Her answer also
indicates confusing the processes of DNA replication with RNA transpiration. When
asked to explain why the enzyme functions in the direction indicated in her answer, Jon
response includes elements related to the two molecules being antiparallel.
LeVaughn: Why does it go this particular direction, from 3’ to 5’, versus the other
direction?
Jon: Yeah, versus 5’ to 3’. Um - I used to have a way to remember whether it was
5’ to 3’ or 3’ to 5’. I had forgotten it. I chose 3’ to 5’ because it was the
most natural. We read left to right. So, I felt like – I just felt I was right. It
was the most natural thing, left to right.
LeVaughn: So you said a new molecule is being made?
Jon: Yeah, in that direction [3’ à 5’].
LeVaughn: You didn’t label the ends here. Would they be the same? For
example, would these both be 5’, these both 3’ [gestures strands]?

80
Jon: I think they would be flipped once you replicated. I’m pretty darn sure. Like
if you have the new strand here is the 5’ – the complementary would be
the 3’ end.
LeVaughn: Why is that? That the ends are not the same, that they would be
switched?
Jon: Honestly, I think that’s why I get them mixed up. Because they switch, and
know which is which.
LeVaughn: You mentioned replication. What is that process?
Jon: That is the process of taking your – original DNA sequence, and copying it
into – RNA?– Yeah I think. Uh – Yeah, Yeah. That’s the answer.
Overall, Jon’s conversation was representative of other students’ difficulty
differentiating between the directionality of the enzyme function. These findings also
provide some degree of validity as represented in the comparisons between Jon’s
interview excerpts with her short answer response. Another method of validation came
from students use of drawings to represent their reasoning for why DNA is transcribe in a
particular direction. Interestingly enough, when students did utilize drawings to explain
direction they provided diagrams illustrating DNA replication and how two strands of
DNA are copied. This was observed in 5 of the 15 interviews. An example student
diagram from an interview with Queen is shown in Figure 4.1.

81
Figure 4. 1 Queen's Drawing used to Explain Question 2 Reasoning
The student diagram presented in Figure 4.1 shows how Queen used the process
of DNA replication to explain why the process in question 2 functions in a particular
direction. I there explanations showing the process of DNA replication, students
identified features such as the replication bubble, Okazaki fragments (dashed line
segments in Figure 4.1) as well as the leading and lagging strands (as shown by the solid
and dashed lines in Figure 4.1, respectively). The primary role students used these
diagrams, like Figure 4.1, was to indicate the opposite nature of the two strands of DNA
or strands of DNA and RNA. This is indicated by the corresponding 5’ and 3’ being
aligned with each other. When asked if the process reflected in Figure 4.1 was the same
as question 2. Queen responded yes, even though she continued to use DNA and RNA
interchangeably. That was also representative of other students you utilized hand drawn
diagrams to explain question 2. An excerpt of Queen’s conversation is presented below.
LeVaughn: So is the process here in questions 2 – that we are making RNA. Is that
the same process that you drew over here? - Or similar?

82
Queen: I think it’s the same. I think it’s the same. Yeah, it’s DNA replication.
LeVaughn: In here (gestures to drawing), do we have RNA and DNA here and
here (gestures to arrows)? Or DNA and DNA?
Queen: DNA and RNA. Yeah, because this is the – uh, it’s between the coding and
the template strand. And the RNA is made off of the template strand, which
is transcription. It makes these new –
LeVaughn: You used two words to describe the two. You said this was replication
(points to drawing) and this was transcription (points to question #2).
Queen: uh – Yeah.
LeVaughn: Are they different or the same thing?
Queen: Um. I think DNA replication is a process of – or not – I guess,
transcription is how DNA is replicated into RNA. (pause) to make a
completely new DNA structure.
Question 3: Process Of Transcription
Question 3 response patterns. Question 3 builds directly upon question 2, in that
students are now asked to transcribe the DNA template in question 2 into a new RNA
molecule and write this sequence for the first tier answer. The second tier asks students to
explain how they arrived at their answer. Using the rubrics for questions 3, responses
were considered correct when answers in both the first and second tiers scored a level 3
or greater. To meet that criteria, students were required to 1) provide an RNA transcript
with fewer than 3 incorrect/missing nucleotide bases, correctly label the ends of their
RNA molecule, and their RNA molecule should not contain the nucleotide thymine for
the first tier; and 2) describe the new RNA as messenger RNA, that the strand is
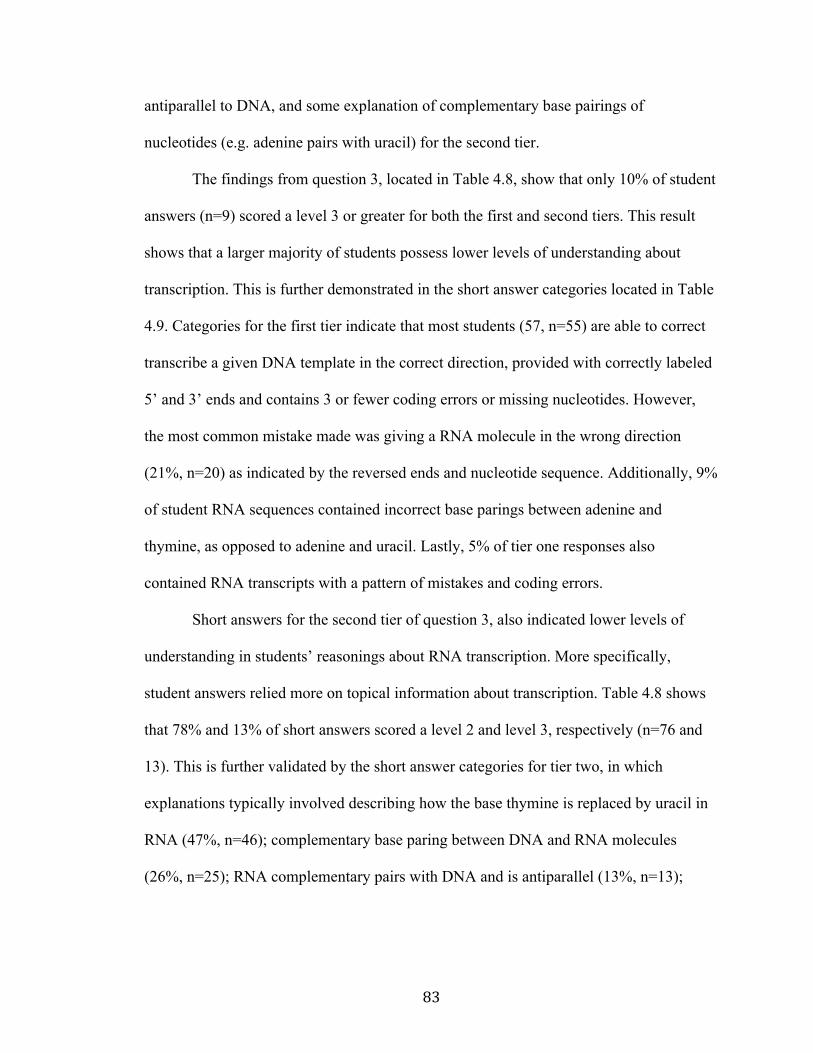
83
antiparallel to DNA, and some explanation of complementary base pairings of
nucleotides (e.g. adenine pairs with uracil) for the second tier.
The findings from question 3, located in Table 4.8, show that only 10% of student
answers (n=9) scored a level 3 or greater for both the first and second tiers. This result
shows that a larger majority of students possess lower levels of understanding about
transcription. This is further demonstrated in the short answer categories located in Table
4.9. Categories for the first tier indicate that most students (57, n=55) are able to correct
transcribe a given DNA template in the correct direction, provided with correctly labeled
5’ and 3’ ends and contains 3 or fewer coding errors or missing nucleotides. However,
the most common mistake made was giving a RNA molecule in the wrong direction
(21%, n=20) as indicated by the reversed ends and nucleotide sequence. Additionally, 9%
of student RNA sequences contained incorrect base parings between adenine and
thymine, as opposed to adenine and uracil. Lastly, 5% of tier one responses also
contained RNA transcripts with a pattern of mistakes and coding errors.
Short answers for the second tier of question 3, also indicated lower levels of
understanding in students’ reasonings about RNA transcription. More specifically,
student answers relied more on topical information about transcription. Table 4.8 shows
that 78% and 13% of short answers scored a level 2 and level 3, respectively (n=76 and
13). This is further validated by the short answer categories for tier two, in which
explanations typically involved describing how the base thymine is replaced by uracil in
RNA (47%, n=46); complementary base paring between DNA and RNA molecules
(26%, n=25); RNA complementary pairs with DNA and is antiparallel (13%, n=13);

84
Tab
le 4
. 8 Q
uest
ion
3 St
uden
t Res
pons
e Pa
tter
n Pe
rcen
tage
s
Que
stio
n 3:
Con
stru
ct a
mes
seng
er R
NA
sequ
ence
usi
ng th
e ta
rget
DN
A se
quen
ce a
bove
. Writ
e th
is R
NA
sequ
ence
in th
e sp
ace
belo
w. I
ndic
ate
the
5’ a
nd 3
’ pos
ition
s on
your
sequ
ence
.
Le
vel o
f Und
erst
andi
ng (s
econ
d tie
r)
Le
vel o
f U
nder
stan
ding
(firs
t tie
r)
0 - N
o U
nder
stan
ding
1 - I
ncor
rect
/ Sc
ient
ific
Mis
conc
eptio
ns
2 - S
cien
tific
Fr
agm
ents
with
M
isco
ncep
tion
3 - P
artia
lly
Scie
ntifi
c N
otio
n
4 - S
cien
tific
M
inor
Ju
stifi
catio
n
5 - S
cien
tific
w
ith
Just
ifica
tion
Tota
l (N
=97)
0 - N
o U
nder
stan
ding
0
0 0
0 0
0 0
1 - I
ncor
rect
/Sci
entif
ic
Mis
conc
eptio
ns
0 1
3.1
0 0
0 4.
1
2 - S
cien
tific
Fr
agm
ents
with
M
isco
ncep
tions
2.
1 2.
1 32
3.
1 0
0 39
.2
3 - P
artia
lly S
cien
tific
N
otio
n 0
1 8.
2 0
0 0
9.3
4 - S
cien
tific
Min
or
Just
ifica
tion
0 1
1 0
0 0
2.1
5 - S
cien
tific
with
Ju
stifi
catio
n 0
2.1
33
10.3
*
0 0
45.4
Tota
l 2.
1 7.
2 77
.3
13.4
0
0 10
0 *
Cor
rect
ans
wer

85
Tab
le 4
. 9 Q
uest
ion
3 C
omm
on T
hem
e C
ateg
orie
s
C
ateg
ory
St
uden
t Exa
mpl
es
%
(N=9
7)
Tier
1
Cor
rect
ly tr
ansc
ribed
mR
NA
(<3
codi
ng e
rror
s)
5'-A
CA
UG
A U
CG
AG
U G
AU
GU
A A
AU
AA
U C
AG
-3'
56.7
mR
NA
tran
scrib
ed in
the
reve
rse
dire
ctio
n 5'
-GA
C U
AA
UG
G A
UG
UA
G U
GA
GC
U A
GU
AC
A-3
' 20
.6
Inco
rrec
t nuc
leot
ide
pairi
ngs b
etw
een
aden
ine
and
urac
il
5'-G
AC
TA
A T
GG
ATG
TA
G T
GA
GC
T A
GT
AC
A-3
' 9.
3
Mis
labe
led
ends
but
tran
scrib
ed in
cor
rect
di
rect
ion
(<3
codi
ng e
rror
s)
3'-A
CA
UG
A U
CG
AG
U G
AU
GU
A G
GU
AA
U C
AG
-5'
8.2
Tran
scrib
ed m
RN
A sh
ows p
atte
rn o
f cod
ing
erro
rs &
mis
take
s. 3'
-AC
A U
GA
UC
G U
GU
GA
U G
GU
AA
T C
AG
-5'
5.2
Tier
2
Ura
cil r
epla
ces t
hym
ine
in R
NA
D
NA
cod
es fr
om 5
' to
3'. A
cod
es fo
r U in
RN
A
47.4
I rep
lace
d al
l A's
with
U's
like
in R
NA
& a
ll th
e ot
her
lette
rs w
ith th
eir b
ase
pairs
. Thi
s inc
lude
s: T
-A, G
-C, &
C-
G
C
ompl
emen
tary
RN
A v
ia D
NA
tem
plat
e I u
sed
the
DN
A se
quen
ce to
cre
ate
a m
RN
A se
quen
ce. I
ch
ange
d th
e nu
cleo
tides
to th
e co
mpl
emen
tary
bas
e pa
irs
25.8
G
ot m
y an
swer
by
goin
g 5'
to 3
' end
. A p
airs
with
T. G
pa
irs w
ith C
.

86
Ta
ble
cont
inue
d fo
rm p
age
85
RN
A p
airs
com
plem
enta
ry w
ith D
NA
+
antip
aral
lel
DN
A is
read
3' t
o 5'
whi
le R
NA
is sy
nthe
size
5' t
o 3'
. C
ompl
emen
tary
bas
e pa
iring
is u
sed
and
RN
A u
ses U
in
stea
d of
T.
12.4
The
answ
er a
bove
was
col
lect
ed b
y ta
king
the
paire
d se
quen
ce th
at w
ent w
ith q
uest
ion
2. th
e en
ds a
re o
ppos
ite o
f ea
ch o
ther
and
A-U
are
pai
red
as w
ell a
s C-G
.
R
NA
is a
ntip
aral
lel t
o D
NA
Th
e m
esse
nger
RN
A se
quen
ce m
ust b
e an
tipar
alle
l to
the
DN
A se
quen
ce. I
t mus
t als
o be
opp
osite
nuc
leot
ides
. 8.
2
The
mR
NA
is p
aire
d go
ing
5' to
3' i
n re
vers
e of
the
DN
A
sequ
ence
. Tha
t mea
ns th
e 5'
of m
RN
A m
ust m
atch
up
to
the
3' o
f DN
A.
Con
fuse
s tra
nscr
iptio
n w
ith e
lem
ents
of o
ther
pr
oces
ses
My
reas
on fo
r ans
wer
3 a
bove
is th
at I
know
the
trend
of
DN
A re
plic
atio
n an
d ba
se p
airin
g. I
also
kno
w th
e ne
ed fo
r ur
acil
3.1
Rep
licat
ion,
tran
scrip
tion
and
trans
latio
n co
mpl
emen
tary
ba
se p
air t
o cr
eate
com
plem
enta
ry st
rand
s of D
NA
and
R
NA
. G a
nd C
are
pai
rs, a
nd A
pai
rs w
ith T
in D
NA
and
U
in R
NA
. The
refo
re, I
tran
slat
ed th
e se
quen
ce in
mR
NA
by
com
plem
enta
ry b
ase
pairi
ng.
D
o no
t kno
w
I kno
w R
NA
mat
ches
with
DN
A I
thin
k ur
acil
mig
ht b
e us
ed b
ut I
don’
t kno
w fo
r whi
ch le
tter
3.1

87
RNA is antiparallel to DNA (8%, n=8); and confusion with other molecular processes
(3%, n=3).
Question 3 interview data. In order to validate the findings presented in the
student response patterns above, students were asked verbally explain their thought
processes as they answered Question 3. A general theme across all the interviews was the
student use of complementary base paring rules to construct their messenger RNA
molecule. When probed further about why the nucleotides pair-up following those rules,
students were unable to provide an answer. Furthermore, because questions 2 and 3 were
directly related, student responses regarding transcription direction were again validated.
A representative conversation with Bethany and Jon are presented below.
LeVaughn: So walk me through how you answered this question.
Bethany: Um. I just did the base pairings with the, the base sequence. So like the
opposite of, like T and A then like G and C always pair together.
LeVaughn: And then, so did you follow the same direction that you indicated up
here [refers to question 2]?
Bethany: Yes.
Jon: Uh, this is – I followed the rules of A to U and C to G. There’s no T in RNA,
and I just copied that down [gestures to new sequence] from the original
strand. And put the primes at the ends in little caps.
LeVaughn: So you still went that direction [gestures left to right]
Jon: Yeah, I still went left to right.
LeVaughn: But you said that the ends here [gestures to response]

88
Jon: yeah the ends could be switched, but I’m not 100% sure. But I see a
possibility.
LeVaughn: So, in mentioning how you arrived at your answer – You had
mentioned base pairing. Could you repeat that?
Jon: Sure. Any T goes to A. Any C goes to G. But where there’s a A it doesn’t go
back to T – In RNA there is no thymine - It’s uracil, so it’s a U instead.
In both excerpts, the letters A, U, C, T and G mentioned refer to the nucleotide
bases and how they interacted through complementary pairing. In their conversations
both students indicated using the DNA template located in question 2, then paired the
nucleotides with their complements following the same direction as indicated in question
2. Additionally, these responses match the short answer responses provided in their
surveys, as shown below.
Bethany’s short answer response:
Tier one: 5'-ACAUGAUCGAGUGAUGUAGGUAAUCAG-3’ (level 5)
Tier two: I found my answer because of complementary base pairing. In RNA, the
T will pair with A, the G will pair with C, and the A will pair with U. (level
2)
Jon’s short answer response:
Tier one: 3'-ACA UGA UCG UGU GAU GUA GGU AAT CAG-5' (level 2)
Tier two: replication occurs 3' to 5'. C-G, A-U, this is because there is no thymine
in RNA (level 2)

89
Comparing Bethany and Jon’s interview and survey responses illustrates the topical level
of understanding representative of students who scored at the level 2 of understanding.
Both interview excerpts and short answers focus on the surface details related to
complementary base pairing rules. In regards to question 3, both were representative of
other student interviews. Furthermore, these findings also support the observed response
patterns presenting the large percentage of students whose responses fell into uracil
replaces thymine (47%) and complementary RNA via DNA template (26%) categories.
Question 4: Process Of Translation
Question 4 response patterns. Similar to the other questions regarding gene
expression, question 4 was designed to assess student understanding about the process of
how information carried by an RNA intermediate codes for a amino acid sequence, which
ultimately becomes a fully folded protein. This is commonly known as translation.
Students are asked to use the messenger RNA produced in question 3 to construct an
amino acid sequence using the provided genetic coding chart (Appendix A) in first tier.
The second tier task requires students to explain how they arrived at their answer for tier
one. To be considered correct, answers must score a level 4 or greater in the first tier and
a level of 3 or greater in tier two. This includes the following: 1) the first tier must
include the correct amino acid sequence beginning at the start codon in the 5à 3
direction, and the peptide terminates at the stop codon (e.g. students peptide does not
include stops within their sequence); and 2) the second tier includes an explanation that
describes the start codon, a codon sequence, and termination sequence. The results in
Table 4.10 show that 11% of answers (n=11) were scored as correct (levels 4 and 5 of the
rubric) for both tiers.

90
For the first tier in question 4, 30% of answers (n=29) contained the correct amino
acid sequence while answers scored at levels 3 through level 1 contained peptides that
included one coding error (5%); began at the wrong start code, included stop signals
within the peptide (55%); and showed multiple types of coding mistakes (9%) –
respectively. Table 4.11 shows the types of mistakes present in students’ amino acid
sequences. The most common mistake in tier one answers that included the wrong start
codon but correct stop signal (21%). Followed by the amino acid sequences that ignored
the stop signal (17%), or included the correct start codon but had more than two coding
errors (14%).
Similar to the previous question about gene expression; even though students
were able to correct construct an amino acid sequence, their reasonings in the second tier
illustrated a topical understanding about the process of translation. Overall, the short
answer for the second tier of question 4 highlight a superficial level of understanding
about translation. Only 13% of answers were scored at a level 3 while 63% and 21% of
answer fill within level 2 and level 1, respectively. In addition, a large percentage of
student answers (35%) were scored at level 2 for both tiers. This finding is particularly
interesting as student who fell into this level of understanding not constructed an
incorrect amino acid sequence but also possessed answer categories referencing: the
mRNA codon sequence coding for amino acids (40%); the start and stop sequences
determine the peptide sequence (34%); or used the chart to match RNA codons with the
amino acid (10%). Others answers included themes such as the start sequence AUG
coding for methionine (4%) and complementary pairing with matching codons (3) while
others failed to provide any reasoning at all (5%).

91
Tab
le 4
. 10
Que
stio
n 4
Stud
ent R
espo
nse
Patt
ern
Perc
enta
ges
Que
stio
n 4:
Con
stru
ct a
n am
ino
acid
sequ
ence
from
you
r mes
seng
er R
NA
in q
uest
ion
3. W
rite
your
sequ
ence
bel
ow.
Le
vel o
f Und
erst
andi
ng (s
econ
d tie
r)
Le
vel o
f U
nder
stan
ding
(f
irst t
ier)
0 - N
o U
nder
stan
ding
1 - I
ncor
rect
/ Sc
ient
ific
Mis
conc
eptio
ns
2 - S
cien
tific
Fr
agm
ents
with
M
isco
ncep
tion
3 -
Parti
ally
Sc
ient
ific
Not
ion
4 - S
cien
tific
M
inor
Ju
stifi
catio
n
5 - S
cien
tific
w
ith
Just
ifica
tion
Tota
l (N
=97)
0 - N
o U
nder
stan
ding
1
0 0
0 0
0 1
1 - I
ncor
rect
/ Sc
ient
ific
Mis
conc
eptio
ns
1 2.
1 6.
2 0
0 0
9.3
2 - S
cien
tific
Fr
agm
ents
with
M
isco
ncep
tion
1 16
.5
35.1
2.
1 0
0 54
.6
3 - P
artia
lly
Scie
ntifi
c N
otio
n 0
0 5.
2 0*
0
0 5.
2
4 - S
cien
tific
M
inor
Ju
stifi
catio
n 0
2.1
10.3
5.
2 *
0 0
17.5
5 - S
cien
tific
w
ith Ju
stifi
catio
n 0
0 6.
2 6.
2 *
0 0
12.4
Tota
l 3.
1 20
.6
62.9
13
.4
0 0
100
* C
orre
ct a
nsw
er. M
ultip
le a
nsw
ers w
ere
mar
ked
as c
orre
ct d
ue to
the
use
of th
e ge
nera
l 0-5
scor
ing
rubr
ic d
evel
oped
for t
he
shor
t ans
wer
que
stio
ns. I
n th
at ru
bric
, ans
wer
s tha
t wer
e ev
alua
ted
at a
leve
l of u
nder
stan
ding
of 3
or g
reat
er w
ere
cons
ider
co
rrec
t. Th
is w
as d
ue sh
ort a
nsw
er sc
ores
of 3
still
gen
eral
ly c
orre
ct b
ut v
ague
in n
atur
e, w
hile
scor
es o
f 4 a
nd 5
wer
e co
rrec
t bu
t sup
porte
d an
d re
ason
ed.
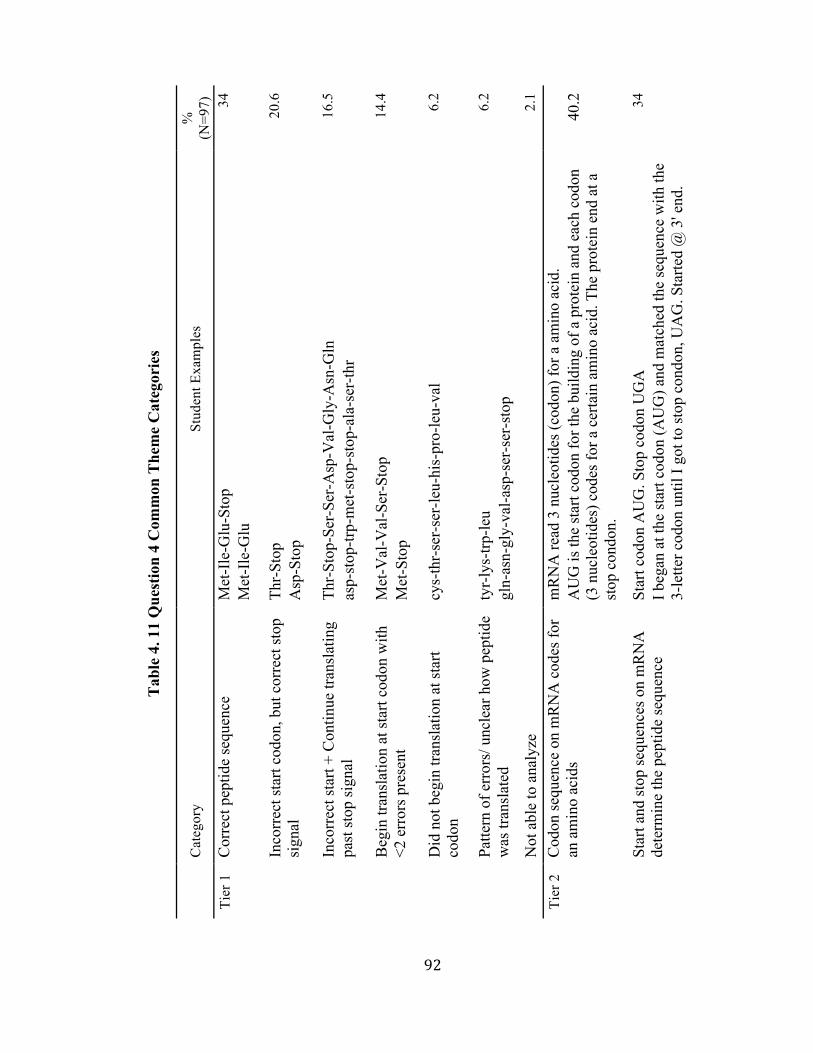
92
Tab
le 4
. 11
Que
stio
n 4
Com
mon
The
me
Cat
egor
ies
C
ateg
ory
St
uden
t Exa
mpl
es
%
(N=9
7)
Tier
1
Cor
rect
pep
tide
sequ
ence
M
et-I
le-G
lu-S
top
34
M
et-I
le-G
lu
In
corr
ect s
tart
codo
n, b
ut c
orre
ct st
op
sign
al
Thr-
Stop
20
.6
A
sp-S
top
In
corr
ect s
tart
+ C
ontin
ue tr
ansl
atin
g pa
st st
op si
gnal
Th
r-St
op-S
er-S
er-A
sp-V
al-G
ly-A
sn-G
ln
16.5
as
p-st
op-tr
p-m
et-s
top-
stop
-ala
-ser
-thr
B
egin
tran
slat
ion
at st
art c
odon
with
<2
err
ors p
rese
nt
Met
-Val
-Val
-Ser
-Sto
p 14
.4
M
et-S
top
Did
not
beg
in tr
ansl
atio
n at
star
t co
don
cys-
thr-
ser-
ser-
leu-
his-
pro-
leu-
val
6.2
Pa
ttern
of e
rror
s/ u
ncle
ar h
ow p
eptid
e w
as tr
ansl
ated
ty
r-ly
s-trp
-leu
6.2
gl
n-as
n-gl
y-va
l-asp
-ser
-ser
-sto
p
N
ot a
ble
to a
naly
ze
2.
1
Tier
2
Cod
on se
quen
ce o
n m
RN
A c
odes
for
an a
min
o ac
ids
mR
NA
read
3 n
ucle
otid
es (c
odon
) for
a a
min
o ac
id.
AU
G is
the
star
t cod
on fo
r the
bui
ldin
g of
a p
rote
in a
nd e
ach
codo
n (3
nuc
leot
ides
) cod
es fo
r a c
erta
in a
min
o ac
id. T
he p
rote
in e
nd a
t a
stop
con
don.
40.2
St
art a
nd st
op se
quen
ces o
n m
RN
A
dete
rmin
e th
e pe
ptid
e se
quen
ce
Star
t cod
on A
UG
. Sto
p co
don
UG
A
34
I beg
an a
t the
star
t cod
on (A
UG
) and
mat
ched
the
sequ
ence
with
the
3-le
tter c
odon
unt
il I g
ot to
stop
con
don,
UA
G. S
tarte
d @
3' e
nd.

93
Ta
ble
cont
inue
d fr
om p
age
92
U
sed
tabl
e to
loca
te m
atch
ing
amin
o ac
id
I gro
uped
eac
h 3
nucl
eotid
es to
geth
er. T
hen
I loo
ked
for t
he
corr
espo
ndin
g am
ino
acid
on
the
char
t. 10
.3
Th
e se
quen
ce w
as e
nter
ed a
nd tr
ansl
ated
usi
ng th
e da
ta ta
ble
abov
e
N
o an
swer
5.2
Beg
in a
t sta
rt se
quen
ce A
UG
, m
ethi
onin
e I s
impl
y fo
llow
ed th
e se
quen
ce. A
UG
wou
ld b
e M
et a
nd th
is is
the
info
rmat
ion
I use
d.
4.2
The
amin
o ac
id st
arts
at t
he st
art c
odon
, met
hion
ine,
and
end
s at t
he
stop
cod
on. E
ach
codo
n is
com
pris
ed o
f 3 a
min
o ac
ids.
Com
plem
enta
ry p
arin
g of
mat
chin
g co
dons
I a
rriv
ed a
t thi
s ans
wer
by
usin
g th
e ba
se p
airs
& m
atch
ing
them
w/
the
char
t. Si
nce
UG
A c
odes
for s
top,
it st
ops e
arly
3.
1
Pept
ide
sequ
ence
is te
rmin
ated
fo
llow
ing
a st
op c
odon
Th
e U
AG
cod
es fo
r a st
op c
odon
so th
ere
wou
ldn'
t be
anot
her a
min
o ac
id a
fter t
hat
3

94
Question 4 interview data. In question 4, students were asked to verbally describe their
thought processes as they constructed their amino acid sequence. Additionally, students
were further probed on why they selected they way they provided. Similarly as shown
from interviews excerpts in questions 2 and 3, students typically relied on superficial
explanations for how mRNA codes for amino acids. A common them represented in the
interviews was how reference to the use of codons in determining the amino acid
sequence via the genetic code chart provided in their survey. This is demonstrated in an
excerpt from Jon’s interview response provided below.
Jon: … You take them [nucleotides] 3 at a time. And that’s – Uh, codon. Here I
had ACA. And you read it as first letter [gestures to Genetic Code Table
in survey]. So here’s A [first base], here’s C [second base] – Uh – Hang
on (giggles). Here’s A [third base]. And they all code for Thr. And then
you do that for each three [nucleotides] – And you just kind of match up
from here to here [gestures from mRNA sequence to columns in chart].
LeVaughn: And you just keep going?
Jon: Left to right. Until you’re all done
In her conversation, Jon describes how she separated the mRNA, created in
question 3, into smaller groups consisting of three nucleotide bases or codons, which she
then used to identify the correct amino acid using the genetic code chart. Following this
response, Jon was probed to further elaborate on what is occurring during this process.
Jon’s interview response also reflects the answer provided in the survey shown below.

95
T1: thr-cys-leu-leu-ser-asp-val-gly-asn-gln (Level 1)
T2: amino acids are constructed 3 nucleotides at a time. I matched the codons to
the chart and made a chain (Level2)
Comparing the Jon’s interview and short answer transcript demonstrates one of the
common categories observed in the survey response patterns in question 4, incorrect start
+ continuing past the stop signal (17%). Within this answer category students typical
begin translation at one end of the RNA molecule then continue coding amino acids until
the end of the RNA sequence is reached. Additionally, Jon’s responses validate the focus
on superficial details related the process of transcription and translation.
Molecular Properties And Functions
Questions 5, 6 and 9 were designed to assess students understanding of molecular
properties and their interactions within a biological system, within the context of gene
expression and gene function. Students need to understand that the basic chemical and
structural components within a system are related to how that complex system can
function. Stated another way, students need to have a grasp on how molecular
components can interact with a biological system to elicit an outcome. These include,
how DNA and RNA interact with one another and other molecules in a system of gene
expression (question 5 and 6), How differential gene activity can lead to vastly different
cellular outcomes (question 7).
Question 5 focuses on students being able to accurately identify an anticodon
sequence to a given codon sequence. Additionally, students need to understand why this
interaction is important and how the anticodon is important to gene expression. Similarly
question 6 assess what students understand regarding how the molecular components

96
involved in the process of gene expression can accurately identify the proper amino acid
in a peptide chain. Question 9 seeks to assess students’ understanding of genetic material
within a new context, enzymatic activity. In question 9, students need to understand the
structure properties of DNA within a new context. Because major issues regarding the
question difficulty and question wording were uncovered prior to data analysis after the
survey was administered, any findings from question 9 were removed in this study.
Question 5: Molecules In A Biological System
Question 5 response patterns. Question 5 was designed to assess whether students
to identify an anticodon sequence given a corresponding amino acid, and how that
interaction takes place within gene expression. The concepts assessed in this question
further build off those assess in Questions 3 and 4 in the previous section. However, Here
students must be able to makes connections between structure and function of chemical
components and interactions that contribute the process of gene expression. The format
of question 6 is similar to question 8 above with the first tier consists of a multiple-choice
response followed by a short answer response, in which students must explain their
reasoning for their particular answer choice.
Student response patterns for question 5 are located in Table 4.12. Overall, the
results show that the majority of college freshmen in this study can correctly identify an
anticodon sequence if given the corresponding amino acid. Seventy one percent (n=69) of
students correctly identified the anticodon nucleotide sequence for tryptophan as ACC
(option C) using the provided genetic code chart (Appendix A). However, an interesting
finding was that a 20% of freshmen (n=19) identified the anticodon sequence as UGG
(option A), which is actually the corresponding codon nucleotide sequence for

97
tryptophan. The remaining answer choices variants of the two, written in antiparallel
direction from the original codon sequence (8% of students, n=7).
Analyses of tier two short answer responses (Tables 4.12 and 4.13) provided by
students generally reflects an overall less sophisticated level of understanding with a
focus on topical details or facts related to DNA/ RNA interactions of the codon sequence
with the corresponding anticodon sequence. Only 9% of students (n=9) short answer
responses indicated a level of understanding of 3 that was general in nature, but showed a
coherent thought process. No students scoring higher that level 3. This also matched with
the percentage of students who both selected option C and scored a level of
understanding 3 or greater.
However, most student short answer responses (53%, n=51) were scored at level 2
consisting of short scientific fragments, and reasonings that included partially correct
information. Similarly, 33% (n=32) were scored at level 1, while 5.2% were scored at
level 1. Student response categories also illustrate less sophisticated in the level of
understanding. Table 4.13 indicates the most common theme in student reasoning (33%,
n=32) related to students’ knowledge of nucleotide base pairing rules. Under this
category, students indicated “matching” nucleotides together with their complementary
partners (e.g. adenine to thymine, and Guanine to cytosine). Student responses also
contained themes related to codons on the mRNA are complementary the anticodon
(10%, n=9), or that the anticodon sequence as “opposite to the codon” (25%, n=24).
However, in the third most common category students’ responses equated to both the
anticodon and codon sequences, or identified the anticodon as identical to the codon
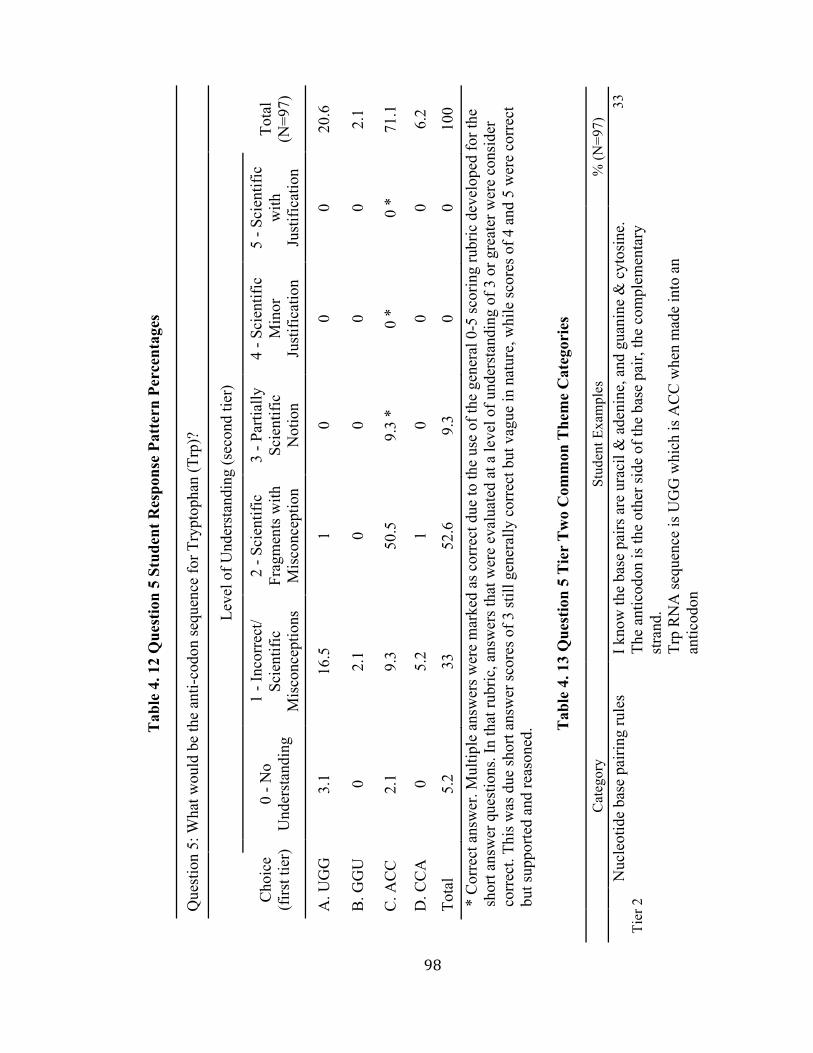
98
Tab
le 4
. 12
Que
stio
n 5
Stud
ent R
espo
nse
Patt
ern
Perc
enta
ges
Que
stio
n 5:
Wha
t wou
ld b
e th
e an
ti-co
don
sequ
ence
for T
rypt
opha
n (T
rp)?
Le
vel o
f Und
erst
andi
ng (s
econ
d tie
r)
C
hoic
e (f
irst t
ier)
0
- No
Und
erst
andi
ng
1 - I
ncor
rect
/ Sc
ient
ific
Mis
conc
eptio
ns
2 - S
cien
tific
Fr
agm
ents
with
M
isco
ncep
tion
3 - P
artia
lly
Scie
ntifi
c N
otio
n
4 - S
cien
tific
M
inor
Ju
stifi
catio
n
5 - S
cien
tific
w
ith
Just
ifica
tion
Tota
l (N
=97)
A. U
GG
3.
1 16
.5
1 0
0 0
20.6
B. G
GU
0
2.1
0 0
0 0
2.1
C. A
CC
2.
1 9.
3 50
.5
9.3
* 0
* 0
* 71
.1
D. C
CA
0
5.2
1 0
0 0
6.2
Tota
l 5.
2 33
52
.6
9.3
0 0
100
* C
orre
ct a
nsw
er. M
ultip
le a
nsw
ers w
ere
mar
ked
as c
orre
ct d
ue to
the
use
of th
e ge
nera
l 0-5
scor
ing
rubr
ic d
evel
oped
for t
he
shor
t ans
wer
que
stio
ns. I
n th
at ru
bric
, ans
wer
s tha
t wer
e ev
alua
ted
at a
leve
l of u
nder
stan
ding
of 3
or g
reat
er w
ere
cons
ider
co
rrec
t. Th
is w
as d
ue sh
ort a
nsw
er sc
ores
of 3
still
gen
eral
ly c
orre
ct b
ut v
ague
in n
atur
e, w
hile
scor
es o
f 4 a
nd 5
wer
e co
rrec
t bu
t sup
porte
d an
d re
ason
ed.
T
able
4. 1
3 Q
uest
ion
5 T
ier
Tw
o C
omm
on T
hem
e C
ateg
orie
s
C
ateg
ory
St
uden
t Exa
mpl
es
% (N
=97)
Tier
2
Nuc
leot
ide
base
pai
ring
rule
s I k
now
the
base
pai
rs a
re u
raci
l & a
deni
ne, a
nd g
uani
ne &
cyt
osin
e.
The
antic
odon
is th
e ot
her s
ide
of th
e ba
se p
air,
the
com
plem
enta
ry
stra
nd.
33
Tr
p R
NA
sequ
ence
is U
GG
whi
ch is
AC
C w
hen
mad
e in
to a
n an
ticod
on

99
Tabl
e co
ntin
ued
from
pag
e 98
Ant
icod
on se
quen
ce
"opp
osite
" to
cod
on
This
is m
y an
swer
bec
ause
the
antic
odon
of a
sequ
ence
had
to p
air w
ith th
e op
posi
te le
tter o
n th
e ge
netic
cod
e. T
he c
odon
is th
e am
ino
acid
, the
ant
i-co
don
wou
ld b
e op
posi
te.
24.7
Th
e an
ticod
on is
the
oppo
site
of t
he g
iven
sequ
ence
UG
G. T
hat o
ppos
ite
pairi
ng is
AC
C.
Id
entic
al to
cod
on se
quen
ce
I cho
se U
GG
by
goin
g to
the
char
t & lo
okin
g fo
r trp
. Sin
ce th
is is
RN
A I
did
not c
hang
e th
e ba
se p
airs
. 18
.6
I cho
se U
GG
by
goin
g to
the
char
t & lo
okin
g fo
r trp
. Sin
ce th
is is
RN
A I
did
not c
hang
e th
e ba
se p
airs
.
Com
plem
enta
ry to
co
rres
pond
ing
trypt
opha
n co
don
sequ
ence
Bec
ause
cod
ons a
re c
ompl
imen
tary
to a
nti-c
odon
s. Th
e co
don
for
Tryp
toph
an is
UG
G so
I fo
und
the
com
plem
enta
ry n
ucle
otid
es.
10.3
A
ntic
odon
com
plem
enta
ry
& a
ntip
aral
lel t
o co
don
It is
the
com
plem
enta
ry b
ase
pair
of th
e m
RN
A st
rand
. It i
s als
o an
tipar
alle
l.
5.2
Ant
icod
ons a
re th
e re
vers
e an
d op
posi
te b
ase
pair
of a
real
cod
on. T
his i
s be
caus
e th
e co
dons
mus
t mat
ch u
p to
the
antic
odon
s in
orde
r to
conn
ect a
t th
e rib
osom
e to
mak
e a
poly
pept
ide
chai
n
Con
fuse
d lo
catio
n of
cod
on
with
ant
icod
on
The
anti-
codo
n w
ould
be
the
DN
A se
quen
ce so
the
sequ
ence
for t
rypt
opha
n w
ould
nee
d to
be
UG
G b
ut p
re-m
RN
A w
ould
be
AC
C. A
t mR
NA
its
trans
late
d to
UG
G.
4.1
G
uess
ed
4.
1

100
(19%, n=18). This suggests that students tended to confuse or misidentify the
location of the anticodon. See Table 4.13 for examples of student responses.
Question 5 interview data. A common theme that emerged from students’
explanations regarding question 5 related to the concept of complementary nucleotide
base pairing that was also present in answer for question 3 and 4. This was represented in
all 15 student interviews. The explanations typically included the use of the chart to work
backwards to identify to codon sequence, followed by matching of the base pairs using
the codon sequence. This shows the degree of comfort student have in navigating the
genetic code chart. When probed further about anticodon specifically, most students were
able to identify the anticodon as opposite or complementary to the codon sequence. Only
two students mentioned tRNA in their explanations. An excerpt of Mina’s interview
represents other student conversations.
Mina: So, I find tryptophan – Wherever that is [looking at chart] – there it is! So
that UGG, and you find the opposite. So the same rules, A to U; C to G.
And there it is. ACC.
LeVaughn: Talk to me about this anticodon. What is the anticodon?
Mina: Uh. (long pause) You know, I am not sure. I know “anti” means opposite,
so I picked the opposite.
LeVaughn: What about it – makes it opposite to this codon?
Mina: I don’t know what function it would serve. But maybe it’s more – like uh.
No wait! The anticodon is a – one of the RNA. I think tRNA – No, is that
the complementary codon or the anticodon? [pause]

101
Mina: … Yeah. I think “anti” is the bulk. Obviously it wouldn’t be itself. Cause -
I don’t think itself could be it’s own anticodon. That doesn’t make sense.
And the other two [answer choices] don’t follow the rules of the letters.
So it ended up being C.
LeVaughn: You said it couldn’t be itself. Meaning the anticodon couldn’t also be
UGG
Mina: Well it just doesn’t make sense. That this could also be its opposite. That
just doesn’t make any logical sense.
LeVaughn: What do you mean by opposite?
Mina: I guess the complementary letters would be a better explanation than
opposite.
LeVaughn: So how these individual letters pair up with one another?
Mina: yes.
The expert from Mina’s interview demonstrates how students think about the
anticodon as it related to codon sequence. This was also validated when comparing
Mina’s excerpt to her response provided on the survey.
Tier 1: ACC
Tier 2: Trp is UGG, using the rules you find the opposite. U-A G-C (level 2)
Here, Mina was able to correctly identify the anticodon sequence for a codon. However,
her tier two response she does not indicate the location of the tRNA, only that the two
interact through complementary base pairing.
102
Question 6: Molecular Property Related To Function
Question 6 response patterns. Question 6 was designed to assess student
knowledge and reasoning related to the interactions between various components within
the process of gene expression. Specifically, how the cellular components incorporate the
correct amino acid in a growing peptide sequence. Here student need to understand the
fundamental characteristics of molecular components and how those molecules interact in
a system that expresses genetic information in the form of peptide chains. The second tier
of question 6 was adapted from a question in the Biological Concept Inventory
(Klymkowsky, Underwood & Garvin-Doxas, 2010) related to concepts involving
enzyme-substrate interactions, specifically how correct binding results in changes in
energy, rather than molecules “sensing” correct binding.
In Question 6 the overall concept is how the anticodon on tRNA interacts with
codon on the mRNA strand and the ribosome. Table 4.14 shows the student response
patterns. Student answers were considered correct if they selected option B in the first tier
(the chemical bonding between RNA molecules) and option C in the second tier (correct
binding results in lower energy than incorrect binding). Only 5% (n=5) of students
correctly selected the answer combination of B – C. Other answer combinations such as
A – C (6%, n=6) can be considered partially correct; however, this combination indicates
students do not consider the interactions of tRNA important in comparison to the correct
order of codons on the mRNA molecule when determining the correct peptide sequence.
The other most commonly selected answer combination was A – D (31%, n=30).
Here students consider the order of codons on mRNA important, but their reasoning
reflects the misconception that binding between molecules results from the two

10
Tab
le 4
. 14
Que
stio
n 6
Stud
ent R
espo
nse
Patt
ern
Perc
enta
ges
Que
stio
n 6:
Whi
ch o
f the
follo
win
g be
st d
escr
ibes
how
the
corr
ect a
min
o ac
id is
inco
rpor
ated
into
a p
eptid
e se
quen
ce th
roug
h R
NA
?
C
hoic
e (s
econ
d tie
r)
Cho
ice
(firs
t tie
r)
A. T
he m
olec
ules
se
nd si
gnal
s to
each
oth
er.
B. T
he m
olec
ules
ha
ve se
nsor
s tha
t ch
eck
for "
inco
rrec
t"
pairi
ngs
C. C
orre
ct b
indi
ng
resu
lts in
low
er
ener
gy th
an
inco
rrec
t bin
ding
.
D. C
orre
ctly
bo
und
mol
ecul
es
fit p
erfe
ctly
, lik
e pu
zzle
pie
ces.
Tota
l (N
=97)
A. T
he o
rder
of c
odon
s in
the
RN
A tr
ansc
ript
19.6
9.
3 6.
2 30
.9
66
B. T
he c
hem
ical
bon
ding
be
twee
n R
NA
mol
ecul
es
1 1
5.2
* 6.
2 13
.4
C. H
ow w
ell t
he tr
ansf
er
RN
A m
olec
ule
fits w
ithin
th
e R
ibos
ome.
0
2.1
1 3.
1 6.
2
D. T
he ri
boso
me
chec
ks
for c
orre
ct R
NA
pai
rings
. 1
9.3
0 4.
1 14
.4
Tota
l 21
.6
21.6
12
.4
44.3
10
0
*Cor
rect
ans
wer

104
connecting like “puzzle-pieces.” Only 12% (n=12) of students selected option C in the
second tier. This suggests that not many even consider the changes in energy level as
molecules interact with one another within the process of gene expression. If we further
breakdown the percentages of the two, only 13% (n=13) of students considered the
chemical bonding interactions between tRNA and mRNA (option B in tier one).
Similarly, 14% (n=14) of students indicated that ribosome plays a role in incorporating
the correct peptide sequence (option D) in the first tier.
Question 6 interview data. A common theme that appeared during question 6
interviews was the importance of codon order on the messenger RNA sequence as a
descriptor for the first tier of responses. This also matches what was observed in survey
response patterns (66%), and can de demonstrated in Ben’s response. His interview
response also agrees with the answer selected in the first tier of the survey, option A (the
order of codons in the RNA transcript).
LeVaughn: So you selected A. Talk to me about Why. Why the order of the codons
on the RNA transcript?
Ben: An amino acid is the Trp. (pause) OK, it’s the order of these – UGG, which
that creates Trp. And if your wanting the correct peptide sequence of this
here [reference to responses #3 & #4). You have to have the correct order of
UGG to start it off, then AAA will have to code for this right here [codon].
So the order of those is how – this [peptide] is created. Like you have to
have the correct order of these [codons] to get the correct order of that
[peptide], which would have your peptide sequence.

105
However, students varied in their reasoning provided in the second tier of question
6. Of the 15 interviews, 5 students indicated that their second tier response accurately
reflected their reasoning, while 6 students stated either that the felt the answer choice
they were looking for was not present. In those 6 interviews, students raised issues
regarding the second tier, but also mentioned that they were somewhat unsure of their
original answer in tier one. Presented below is an excerpt from Ben’s interview.
LeVaughn: Talk to me about the reasoning. How did you select those for the second
part?
Ben: I put A, the molecules send signals to each other. [reads other answer choice
aloud]. OK, A and D sound very good to me. B and C. I can mark those out
I believe. Um, but for answer A. (confused look) I not really sure –
LeVaughn: Walk me through your thoughts.
Ben: … [read answer D] That one sounds correct – like, in my amino acid
sequence. AAA is going to be – its going to fit into this peptide sequence
like it should when coding for this peptide sequence. Um, but answer A.
(long pause) This is difficult.
LeVaughn: Was it because your reason wasn’t here in the second part?
Ben: yeah, none of those was really what I was looking for. A and D sound the best.
LeVaughn: So what would be your reason?
Ben: The reason why the correct amino acid is incorporated is because – well if you
don’t have the order of your codons correct – the peptide sequence is not
going to be the one you wanted. Therefore – lets say you had something
different than UGG. If you don’t have UGG exactly then it’s not going to
106
make your Trp peptide. Or like if you had the wrong mRNA sequence – So
– the mRNA - send signals? That’s not what I said. That didn’t sound like
anything I said. If I could change my answer, I would pick D right now.
LeVaughn: Does that more accurately match your reasoning?
Ben: yeah. Because if you missing a piece of the puzzle – your missing your UGG
here, you’re not going to have your Trp. Which in turn you’ll have a
different peptide.
In his survey, Ben had selected option A in the second tier (The molecules send
signals to each other). However upon further probing, Ben begins to doubt his original
answer selection and comments on the general difficult nature of the two-tier testing
format. Ben’s excerpt is representative of those 6 interviews in which students become
unsatisfied the second tier answers. This finding may indicate a potential issue with
question 6, or that students do not even consider the types of interactions between
molecules involved in translation.
Genetic Behaviors
Questions 10 and 11 were adapted from the Biological Concept Inventory
(Klymkowsky, 2008). For the purposes of this study both questions were selected and
adapted to become two-tiered. The first tier of both was kept the same, but short answer
responses were included to assess student reasonings related to the concepts testing in
both question. According to Klymkowsky (2008) question 10 was designed to assess
student understanding about how mutations might produce novel affects. Additionally
students need to be able to move conceptually between ontological levels in order to
explain how changes are the sub-microscopic (chemical) level can translate to changes

107
observed in the microscopic (cellular) or even the macroscopic (organismal) level. In
question 10, students should understand that mutations result from random changes in a
DNA sequence, which can lead changes in the expressed protein product or changes in
cell function. Similarly Question 11 was designed as a way to assess if students can make
the conceptual jump between properties of DNA to larger phenotypic effects within the
context of dominant traits. Here students should understand that a dominant phenotype
means the dominant allele is present, which leads to those traits being expressed more
often.
Question 10: Mutations To Protein Function
Question 10 response patterns. Question 10 was used to assess how students
reason across ontological levels of organization. Here students need to be able to connect
concepts of gene function, mutation, and phenotypic changes. In order to be scored
correct students needed to select the correct response in the first tier (option C, (if the
mutation altered the activity of a gene product), and score a level 3 or greater in the
second tier (Appendix A). Surprising, none of the responses in the survey met this
criteria. However, 38.1% of students (n=37) selected option C in the first tier, but scored
a level 2 in the second tier; conversely10% of students what selected option C, scored a
level 0 in the second tier (Table 4.15). The two most commonly selected answers in the
first tier were options C (56% of responses) and B (36% of responses). This suggests
overall students may be able to select the correct answer, but possessed reasoning that is
vague or partially correct [70% (n=68) of students scored level 2 in the second tier].
Interestingly, Comparisons of other answer choices suggest other patterns in student
reasonings. For example, 27% of students who selected option B (if the mutation

108
inactivated a gene that was harmful) in the first tier also score a level 2 for the second
tier.
In the analysis of the short answer categories (Table 4.16) found in the second
tier, students typically described creative mutations as producing beneficial outcomes by
inactivating harmful outcomes (29%, n=27), or as producing a different protein or new
function (25% n=24). Surprising, another theme in the short answer responses included
leading to new traits or improved fitness (13%, n=13); and changes/alteration in genetic
information (11%, n=11). Two more interesting were those the reviewers were not able to
analyze (12%, n=12) due to vague responses or guessing. Lastly, were those students
whose short answers that were unsure what was meant by creative in the question stem in
the context of mutations (9%, n=9); however student typically associated creative with
beneficial outcomes, or some new function.
Question 10 interview data. During the interviews, the most common theme to
emerge was a potential issue regarding the wording of question 10. In 10 of the 15
interviews, students expressed confusion related to mutations being creative. When ask
what they think creative means, students typically link creative with beneficial outcomes
or producing a new function. An excerpt from Jon illustrates this point.
Jon: I thought creative was an interesting word to use. I think of – I’m sure it
means a DNA sequence to be – able to create. I saw creative and thought,
Art. Arts and sculpture. I didn’t particularly like that word. I don’t know if
that’s me being picky.
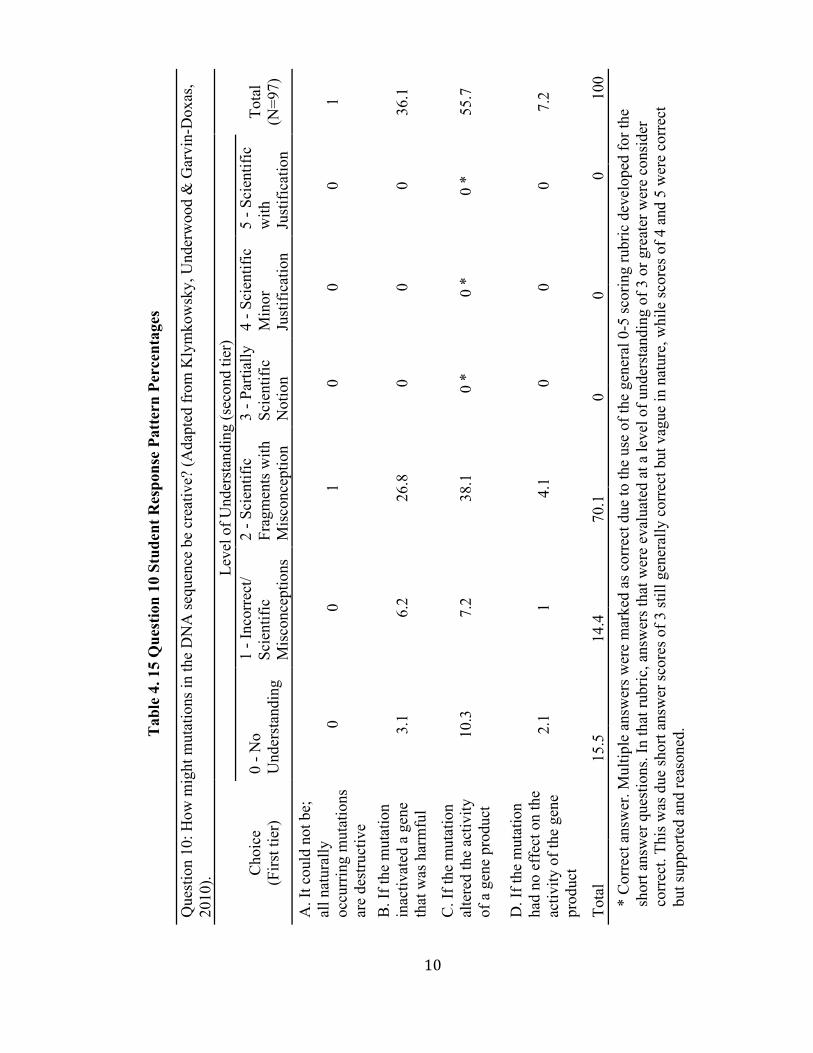
10
Tab
le 4
. 15
Que
stio
n 10
Stu
dent
Res
pons
e Pa
tter
n Pe
rcen
tage
s
Que
stio
n 10
: How
mig
ht m
utat
ions
in th
e D
NA
sequ
ence
be
crea
tive?
(Ada
pted
from
Kly
mko
wsk
y, U
nder
woo
d &
Gar
vin-
Dox
as,
2010
).
Le
vel o
f Und
erst
andi
ng (s
econ
d tie
r)
C
hoic
e
(F
irst t
ier)
0
- No
Und
erst
andi
ng
1 - I
ncor
rect
/ Sc
ient
ific
Mis
conc
eptio
ns
2 - S
cien
tific
Fr
agm
ents
with
M
isco
ncep
tion
3 - P
artia
lly
Scie
ntifi
c N
otio
n
4 - S
cien
tific
M
inor
Ju
stifi
catio
n
5 - S
cien
tific
w
ith
Just
ifica
tion
Tota
l (N
=97)
A. I
t cou
ld n
ot b
e;
all n
atur
ally
oc
curr
ing
mut
atio
ns
are
dest
ruct
ive
0 0
1 0
0 0
1
B. I
f the
mut
atio
n in
activ
ated
a g
ene
that
was
har
mfu
l 3.
1 6.
2 26
.8
0 0
0 36
.1
C. I
f the
mut
atio
n al
tere
d th
e ac
tivity
of
a g
ene
prod
uct
10.3
7.
2 38
.1
0 *
0 *
0 *
55.7
D. I
f the
mut
atio
n ha
d no
eff
ect o
n th
e ac
tivity
of t
he g
ene
prod
uct
2.1
1 4.
1 0
0 0
7.2
Tota
l 15
.5
14.4
70
.1
0 0
0 10
0
*
Cor
rect
ans
wer
. Mul
tiple
ans
wer
s wer
e m
arke
d as
cor
rect
due
to th
e us
e of
the
gene
ral 0
-5 sc
orin
g ru
bric
dev
elop
ed fo
r the
sh
ort a
nsw
er q
uest
ions
. In
that
rubr
ic, a
nsw
ers t
hat w
ere
eval
uate
d at
a le
vel o
f und
erst
andi
ng o
f 3 o
r gre
ater
wer
e co
nsid
er
corr
ect.
This
was
due
shor
t ans
wer
scor
es o
f 3 st
ill g
ener
ally
cor
rect
but
vag
ue in
nat
ure,
whi
le sc
ores
of 4
and
5 w
ere
corr
ect
but s
uppo
rted
and
reas
oned
.

11
Tab
le 4
. 16
Que
stio
n 10
Tie
r T
wo
Com
mon
The
me
Cat
egor
ies
C
ateg
ory
St
uden
t Exa
mpl
es
%
(N=9
7)
Tier
2
Prod
ucin
g be
nefic
ial
outc
omes
by
inac
tivat
ing
harm
ful o
nes
DN
A m
utat
ions
mig
ht b
e cr
eativ
e if
a ha
rmfu
l mut
atio
n is
des
troye
d. T
hus,
help
ing
the
host
. 28
.9
Mor
e pe
ople
thin
k m
utat
ions
are
bad
, but
if th
ey p
reve
nted
a b
ad g
ene
from
bei
ng
activ
ated
, thi
s it w
ould
ben
efit
you
Prod
ucin
g a
diff
eren
t pr
otei
n or
new
func
tion
I cho
se th
is a
nsw
er b
ecau
se if
the
mut
atio
n al
tere
d th
e ac
tivity
of a
gen
e pr
oduc
t it
wou
ld p
rodu
ce a
diff
eren
t pro
tein
, cau
sing
som
ethi
ng d
iffer
ent a
nd c
reat
ive.
If th
e m
utat
ion
had
no e
ffec
t on
the
activ
ity, t
here
wou
ldn'
t be
any
chan
ges.
24.7
The
mut
atio
n is
obv
ious
whe
n th
e en
d pr
oduc
t is a
ffec
ted.
Thi
s mea
ns th
e pr
otei
n pr
oduc
ed is
diff
eren
t.
Evol
utio
nary
out
com
es
lead
ing
to n
ew tr
aits
or
impr
ove
fitne
ss
This
wou
ld b
e a
bene
ficia
l mut
atio
n an
d no
t all
mut
atio
ns a
re h
arm
ful,
so th
is
wou
ld a
dd d
iver
sity
into
a p
opul
atio
n 13
.4
C is
bas
ical
ly e
xpla
in a
n ad
apta
tion
-> g
enes
can
cha
nge
and
have
a b
enef
icia
l ou
tcom
e th
at in
crea
ses f
itnes
s.
Mut
atio
ns a
re n
ot a
lway
s bad
som
etim
e th
ey h
elp
the
orga
nism
bet
ter p
erfo
rm.
Una
ble
to a
naly
ze
Uns
ure
of m
y an
swer
, bes
t gue
ss. W
e di
d no
t get
to le
arn
abou
t mut
atio
ns (a
nd I
have
n't p
revi
ousl
y) in
BIO
148
beca
use
of sn
ow d
ays.
12.4

11
Ta
ble
cont
inue
d fr
om p
age
110
Cha
nges
/alte
rnat
ion
in
gene
tic in
form
atio
n Th
e ge
nes,
alth
ough
mut
ated
, cou
ld c
orru
pt o
r alte
r any
info
rmat
ion
and
mak
e th
e da
ught
er D
NA
that
doe
s dam
age.
11
.3
Mut
atio
ns a
re c
hang
es. T
he m
utat
ions
are
nor
mal
. Eve
ryon
e ha
s mut
atio
ns th
at
wha
t mak
es u
s, us
.
Uns
ure
wha
t is m
eant
by
crea
tive
in q
uest
ion
stem
I’
m n
ot su
re w
hat i
t mea
ns b
y cr
eativ
e, b
ut I
assu
me
it ha
d a
bene
ficia
l co
nnot
atio
n
9.3
I don
't re
ally
und
erst
and
this
que
stio
n. I
gues
sed
the
answ
er.
O
nce
agai
n, I
am n
ot su
re w
hat i
s mea
nt b
y cr
eativ
e. Is
it ta
lkin
g ab
out m
utat
ions
be
ing
bene
ficia
l?

112
Jon: …I thought that was a weird word. When you think of the adjective, creative
– I’m sure it’s a verb here – but I’m thinking, oh it’s purple. And my DNA
sequence needs to be shiny and purple.
LeVaughn: So, in the context of mutations in DNA, what do think it refers to?
Jon: Yeah, I’m thinking how might mutations in DNA be – maybe used to make
something – other things. I mean – Em.
LeVaughn: … Did creative throw you off?
Jon: Yeah. I knew what it meant, but I didn’t like it.
LeVaughn: What might be a better a better word choice?
Jon: Yeah, um. How might mutations in DNA give rise to – new traits? Eh, give
rise to new – traits, new functions. New – insert word that’s scientifically
best.
LeVaughn: After reading the answers, was it more clear what the meaning [of
creative] was in this case?
Jon: Well, I saw things like mutations that are harmful, are good or have no effect.
I think, Oh, these are mutation that give rise to – like new traits in
organisms. Like longer neck, or shorter legs. It was definitely clear. I just
didn’t like it.
Jon’s conversation above was typical of student who voiced their confusion regarding
mutation being creative. Here Jon states that the wording initially sidetracked her in
answering the question, and explains that as an adjective to describe mutation did not
makes sense to her, but she was still able to answer the question. This can be seen by
probing further about answer choices, as demonstrated in the following excerpt with Jon.

113
LeVaughn: Talk to me about the answer choices.
Jon: Sure. A is wrong. We have mutation that give species an advantage over
other ones, and it would be advantageous to them because they would
survive and reproduce. [Reads C aloud] Uh, [repeats C]. Uh. Uh. I don’t
know about that one.
LeVaughn: what about that answer don’t you like?
Jon: I think it’s saying – if it alters. – How a gene produces a trait. I think that’s
what it’s saying. And that could create a new trait I suppose. [reads D
aloud] Well then there would be a mutation. If the mutation doesn’t do
anything, then that’s not going to give rise to anything new, or creative – if
you will. Um, so that’s wrong. So I chose B [reads B aloud] I think that
would – I guess that would be creative. I don’t know if that’s creative, or
destructive in a positive sense. If you get rid of something harmful, it – it
goes away. I don’t know if that’s creating anything. Its creating better
survival, but I think what it means in the context of the problem. Oh boy!
LeVaughn: Using your first definition for creative, meaning make some thing
new. Would you still choose B?
Jon: I think I would choose C. If I’m interpreting the question right then altering
the activity might create a new function. It might produce things faster, or
slower. I think that’s more creative than getting rid of something.
The above excerpt shows that even though Jon initially struggled with what question 10
was referring to, she was still provide a sufficient expiation for her reasonings for her

114
particular answers. Jon’s answer choice for the first tier, and reasoning in the second tier
are also in agreement with the answers provide in her survey.
Question 11:Mutations To Traits
Question 11 response patterns. In question 11, students were given a theoretical
situation in which a particular mutation led to a dominant trait. The students were then
asked to make inference about that particular mutation’s effect. Responses were
considered correct if students selected option D (It depends upon the nature of the genetic
product and the mutation) in the first tier, and scored a level 3 or greater in the second
tier. Overall the response patterns (Table 4.17) were very similar to question 10.
Similarly to question 10, only 1% (n=1) met these criteria. Although, 38% (n=37) of
students who correctly selected option D in the first tier, scored a level 2 in the second
tier; while 11% (n=11) scored a level 1. This suggests students possess weak levels of
understanding even though they were able to identify the correct answer choice. The most
commonly select tier one answer was option D (36% of responses), option C (30% of
responses) and option A (10% of responses), respectively. Furthermore the most common
level of understanding in students second tier responses scored was at a level 1 (50%,
n=48), indicating that student reasonings were too vague to illustrate an understanding,
and/or contained information that was factually inaccurate.
The response pattern findings suggest that students typically view dominant traits
as those that produce changes in function, or that the outcome will depend on the
mutation. Overall, this is also represented in the content analysis of student short answers
(Table 4.18). The two most common categories are that mutations lead to changes in cell
function (17%, n=16); and the outcome will depend on the type of mutation (17%, n=16).

11
Tab
le 4
. 17
Que
stio
n 11
Stu
dent
Res
pons
e Pa
tter
n Pe
rcen
tage
s
Que
stio
n 11
: A m
utat
ion
lead
s to
a do
min
ant t
rait;
wha
t can
you
con
clud
e ab
out t
he m
utat
ion’
s eff
ect?
(Ada
pted
from
K
lym
kow
sky,
Und
erw
ood
& G
arvi
n-D
oxas
, 201
0).
Le
vel o
f Und
erst
andi
ng (s
econ
d tie
r)
C
hoic
e
(f
irst t
ier)
0
- No
Und
erst
andi
ng
1 - I
ncor
rect
/ Sc
ient
ific
Mis
conc
eptio
ns
2 - S
cien
tific
Fr
agm
ents
w
ith
Mis
conc
eptio
n
3 - P
artia
lly
Scie
ntifi
c N
otio
n
4 - S
cien
tific
M
inor
Ju
stifi
catio
n
5 - S
cien
tific
w
ith
Just
ifica
tion
Tota
l (N
=97)
A. I
t res
ults
in a
n ov
erac
tive
gene
pr
oduc
t 5.
2 5.
2 0
0 0
0 10
.4
B. I
t res
ults
in a
no
rmal
gen
e pr
oduc
t tha
t ac
cum
ulat
es in
hi
gher
leve
ls th
an
norm
al
4.2
15.6
4.
2 0
0 0
24
C. I
t res
ults
in a
ge
ne p
rodu
ct w
ith
a ne
w fu
nctio
n 2.
1 17
.7
9.4
0 0
0 29
.2
D. I
t dep
ends
upo
n th
e na
ture
of t
he
gen
prod
uct a
nd
the
mut
atio
n
9.4
11.5
14
.6
1 *
0 *
0 *
36.5
Tota
l 20
.8
50
28.1
1
0 0
100
* C
orre
ct a
nsw
er

11
Tab
le 4
. 18
Que
stio
n 11
Tie
r T
wo
Com
mon
The
me
Cat
egor
ies
C
ateg
ory
St
uden
t Exa
mpl
es
%
(N=9
7)
Tier
2
Mut
atio
n le
ads t
o a
chan
ge in
ce
ll fu
nctio
n
The
dom
inan
t tra
it is
dep
ende
nt o
n th
e ge
ne. I
f its
dom
inan
t its
pr
obab
ly p
rodu
ced
with
a n
ew fu
nctio
n.
16.5
Dom
inan
t tra
its a
re g
enes
, bef
ore
the
mut
atio
n if
a ge
ne w
as
rece
ssiv
e, th
e do
min
ant g
ene
wou
ld h
ave
a ne
w fu
nctio
n
O
utco
me
will
dep
end
on th
e ty
pe o
f mut
atio
n (g
ood
or b
ad)
I thi
nk a
ll m
utat
ions
are
diff
eren
t and
dep
endi
ng o
n th
e no
rmal
fu
nctio
n, th
e m
utat
ion
coul
d be
goo
d/ba
d.
16.5
The
natu
re o
f the
gen
e pr
oduc
t and
the
mut
atio
n ar
e im
porta
nt
beca
use
not e
very
mut
atio
n ac
ts in
the
sam
e w
ay.
C
hang
e in
gen
e ex
pres
sion
for a
tra
it If
a g
ene
is d
omin
ant,
this
gen
e w
ill b
e tu
rned
on
no m
atte
r wha
t. U
nlik
e a
rece
ssiv
e ge
ne, i
t can
not b
e hi
dden
. 10
.3
Dom
inan
t tra
its o
ccur
mor
e in
a
popu
latio
n A
gen
e m
utat
ing
to b
ecom
e do
min
ant w
ould
indi
cate
a h
ighe
r pr
esen
ce. B
ut th
at is
not
an
optio
n. A
dom
inan
t mut
atio
n do
es n
ot
mea
n it
is b
ad, s
o th
at’s
whe
y I c
hose
D
10.3
D
omin
ance
incr
ease
s a tr
aits
fit
ness
Th
e m
utat
ion
will
cha
nge
the
expr
essi
on o
f the
gen
es. T
here
fore
if
the
mut
atio
n is
wel
l ada
pted
, the
fitn
ess l
evel
will
impr
ove.
8.
2
A
mut
atio
n th
at in
crea
ses f
itnes
s will
be
pass
ed o
n ne
w
gene
ratio
ns th
at le
ad to
a d
omin
ant t
rait
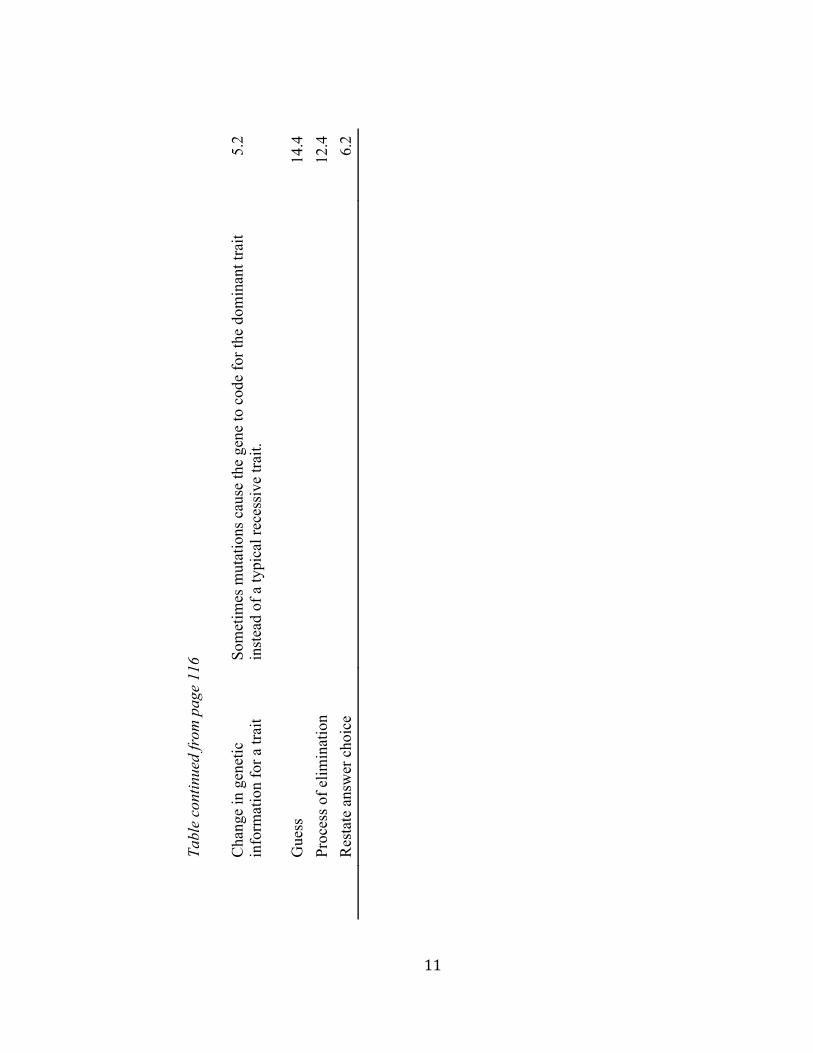
11
Ta
ble
cont
inue
d fr
om p
age
116
C
hang
e in
gen
etic
in
form
atio
n fo
r a tr
ait
Som
etim
es m
utat
ions
cau
se th
e ge
ne to
cod
e fo
r the
dom
inan
t tra
it in
stea
d of
a ty
pica
l rec
essi
ve tr
ait.
5.2
G
uess
14.4
Pr
oces
s of e
limin
atio
n
12.4
Res
tate
ans
wer
cho
ice
6.
2

118
Other answer categories included: changes in gene expression (10%, n=9); dominant
traits occur more in a population (10%, n=9); dominance increases fitness (8%, n=8); and
a change in genetic information for a trait (5%, n=5). Overall, these findings suggest that
student generally possess very low levels of understanding in regards to connecting the
properties of DNA to larger phenotypic effects.
Question 11 interview data. During the interviews, student responses varied
somewhat between students. However, some common themes did emerge. Typically
students described dominant traits within the context of an organism’s fitness, or in
producing a new function for either a protein or a particular physical trait. This is
represented in a conversation with Jon as she explains her reasoning for selecting option
C in the first tier of question 11 (It results in a gene product with a new function).
Jon: When I see dominant I think of something – its produced – it’s shown more
in a population. (pause) It should be advantageous if it keeps popping up
over and over again. A would be wrong, because this is showing up, and
that might be a good trait to have, not because it’s just produced a lot. B
that’s similar to A in that its being produced more and that’s not
necessarily true. It’s passed down so you see it a lot. D – Eh, no. It
doesn’t really depend, because If something is dominant, then it’s a good
thing and it’s passed down a lot. And it hides like a recessive [trait], which
may or may not be good for the species. So, that’s wrong. And then C, the
new function – Uh, I kind of assumed that new function meant good
function. But – I’m going to go with that assumption. If it’s a new
function, and it’s being passed down then it’s going to be dominant.

119
LeVaughn: And that’s why you chose C
Jon: yeah.
In her discussion, Jon elaborates in how she thinks about dominant traits in general. Here
dominant traits are those that are reoccurring and are passed down in a population. For
Jon, the idea dominance is related the production of something that is advantageous. In
her conversation, Jon also describes dominant traits in the context of good or new
functions, which also supports her reasoning for conveying a net positive outcome for a
population. This explanation is also in agreement to her original answer given in the
survey provided below.
Tier1: It results in a gene product with a new function Tier 2: dominant traits increase fitness. Therefore a gene that creates a new
function could increase fitness (level 1)

120
CHAPTER 5 DISCUSSION
This chapter will discuss the major findings presented in Chapter 4 regarding the
evaluation of a two-tiered survey instrument, and understandings college freshman held
about gene expression uncovered by the instrument. These findings are also juxtaposed to
others cited in the literature. Additionally conclusions, implications, study limitations and
further recommendations for educators and future research are presented.
The purpose of this research study was to field test a two-tiered survey instrument
that was designed to assess student knowledge about the gene structure and function
relationships. This study builds upon the recommendations proposed in Vision and
Change (AAAS, 2011) to improve undergraduate biological literacy, in addition to
conceptual difficulties cited in the literature. Three research questions guided this study:
1. How well does the two-tiered survey instrument measure student ideas about
gene expression?
2. What level of understanding do freshmen have about the nature of genes and
gene expression?
3. What reasonings do students use to explain processes and outcomes of gene
expression?
The following section will summarize the research findings in relation to the three
research questions.
Ideas Uncovered in Survey Instrument
In this section is a discussion of research questions 2 and 3, which deal with
students level of understand and reasoning assessed in the instrument. The two-tiered

121
survey instrument includes 10 assessment tasks that were organized by four concept
topics: the nature of genetic material (questions 1, 7 & 8), gene expression (questions 2 –
4), properties and functions of molecules in a biological system (questions 5 & 6), and
the behavior of genetic material (questions 10 – 11). Each question consists of two levels,
or tiers. Tier one assesses a student’s content knowledge about a particular topic or
concept, while tier two assesses student reasonings related to their responses in tier one.
The survey was developed using other assessments published in the literature (Venville &
Treagust, 1998; Flodin, 2009; Bowling et al, 2008; Klymkowsky, Underwood & Garvin-
Doxas, 2010; Tsui & Treagust, 2010; Wright et al., 2014).
Questions 1, 7 & 8: Nature Of Genetic Material
These questions were designed to assess how students conceptualize a gene in
regards to its basic structure and function. Other work has shown that learners have
difficulties in describing a gene. Examples of this are how high school students
conceptualize a gene’s function to confer a particular feature or trait separate from its
chemical and molecular structure (Venville & Treagust, 1998; Newman et al., 2012), and
students describing genes as passive particles of inheritable traits (Lewis, Leach &
Woods-Robinson, 2000; Lewis & Kattmann, 2004). In the current study students were
first asked to select the best description of a gene (question 1), and describe how a gene
functions based on their current understanding (question 8). Question 1 of the survey was
adapted from Tsui and Treagust (2010). The only change made was the replacement of
the “I don’t know” distractor option with a common misconception describing how genes
determine physical traits.
122
The findings from Question 1 showed that 31% of students described genes as a
sequence of instructions coding for a protein, which was related to the information for a
gene producing a trait. In other words, in the tier one question, students answered that a
gene is a sequence of instructions that code for proteins. In contrast, in tier two, students
reasoned that genetic information goes on to produce an observed trait. Tsui and Treagust
(2010) noted comparable findings in their evaluation of another two-tiered genetics
instrument used to assess the level of understanding of grade 12 students. This concept of
a gene also aligns with what Venville and Treagust (1998) define as a more sophisticated
description of a gene. Still, question 1 did uncover that approximately 18% of freshmen
described genes as a smallest unit of heritable information for a trait, and that this
information is used for producing that trait. This finding is similar to what Lewis and
Kattmann (2004) observed during interviews with German secondary students
descriptions of genes as ‘particles’ coding for genetic information that are involved in the
production of a given trait (Lewis & Kattmann, 2004). The most frequently selected
reasoning response (60.4% of all student responses) in tier two for both descriptions was
that information of a gene is used in producing a trait. This finding indicates
undergraduates still possess similar ideas about genes as heritable ‘particles’ of
information that confer traits as observed by Lewis and Kattmann (2004) in middle
school students. This finding also suggests that college freshman have weak conceptions
in the structure and function relationships of genes in protein synthesis (gene expression).
In Question 7, students were asked how different cell types can possess functions
in the context how genetic information is organized in the cell. In their tier one responses,
a majority of students (80%) were able to identify that different cell functions arise from
123
activation of different genes. However, their reasoning suggested that students viewed a
cell’s genetic material as being relatively fixed in determining cell function. Lewis and
Wood-Robinson (2000) also observed this in middle school children, in which they found
that younger children reasoned that the information in genes were fixed; that different
cells possessed different genes rather than each having the same genes but using those
genes differently.
Only 25% of students selected reasonings that more accurately described the
flexible nature of genetic information that allows for a diversity of cell types and
functions. During student interviews students often described the role of “genetic
switches” in activating certain genes in one cell but not others, thus determining cell
structure and function. Another common description of gene switches included activation
of certain genes present in one cell type but not others. This is different from the later
description in that the different genes in certain cells are switched on or off in certain cell
type but not others. This could explain why approximately 36% of students reasoned
different cell types activate different genes because of a cell’s function being determined
by its genes. This finding was interesting, in terms of the seemingly contradictory reasons
for the concept of gene regulation in terms of larger genetic literacy of undergraduates.
However, the student interviews also uncovered possible issues with the tier-two answer
choices for the question. Some students commented on the meaning of the word
“flexibility” in a cell’s genes.
In question 8, students were asked describe the function of a gene based on their
understanding. Approximately 50% of student responses for tier one described gene
function as providing an information code. However when connected to their tier two

124
answer, 37% of students level of understanding about gene function reflected scientific
fragments with misconceptions present. This was scored at a level 2 on the 0 – 5 scoring
rubric. Their answers included themes such as providing information to make proteins
(24%), providing information to determine particular traits (22%), and coding
information about traits (18%). Marbach-Ad (2001) similarly found high school and
university students fail to understand the relationship between genes and traits, rather
than between genes and DNA. Similarly, Marbach-Ad (2001) also observed that high
school students tend to offer more general responses that are familiar to them, while
relying on vocabulary terms.
The observation of students falling back on more familiar and naïve ideas or
vocabulary regarding gene function was also uncovered in this study through the student
interviews. During interviews, students described their difficultly in identifying the best
tier one response as they felt that each answer was true in some regard. However when
asked about their reasonings, students explained that they focused on familiar elements or
aspects of each response to arrive at their selected answer. Even though this finding is
supported in the literature, it also suggests potential issues with the survey question as
students may have relied on guessing to arrive at their response. This in turn would also
partially explain the lower than expected Chronbach’s value for this survey instrument.
Questions 2 – 4: Gene Expression
In Questions 2, 3, and 4, students were given a sample DNA template and were
asked to indicate the direction that transcription would occur. In the second tier task,
students were asked to identify an important feature that allows the enzyme to function
(question 2). Students then used the given template (and indicated direction) to construct

125
an RNA molecule (question 3). Lastly, students used the newly formed RNA to code for
an amino acid sequence (question 4). A variety of ideas were uncovered during these
survey items, which will be discussed in the following paragraphs.
Responses to question 2 show that most students were able to indicate the correct
direction for transcription; however their reasoning for the direction reflected a lower
level of understanding (level 2) containing both scientific fragments and misconceptions
or naïve notions. Furthermore, approximately 43% of students provided no explanation
for their provided direction. Other explanations reflected in the tier two reasonings
included descriptions identifying that the process simply occurred one direction (29%)
rather than the direction for the process of transcription to occur. An example of this
would be stating that RNA is produced/constructed in the 5’ to 3’ direction. Similarly,
themes that emerged in students’ responses included interactions between DNA and RNA
(31%), which included describing the interaction between DNA and RNA nucleotide
base paring, or how the DNA is used as a template for producing the new RNA strand.
Other tier one short answers contain themes such as differences in chemical structure
between DNA and RNA (20%), suggesting the RNA strand must be antiparallel to the
DNA template. In all of these response themes, students tended to focus on superficial
details or individual aspects of the process. Wright et al. (2014) observed similar findings
in their study of undergraduate biology students. More specifically, the researchers gave
students a diagram of Central Dogma (DNA à RNA à Protein), and asked them to
describe what occurs during the first stage (transcription) represented by the first arrow.
Wright et al. (2014) found that students often described the process of transcription as the
chemical transformation from DNA into RNA and focused on aspects of chemical

126
interactions between the strands of DNA and RNA. Although the current study found a
small percentage of students (3.1%) explicitly described the chemical transformation of
one molecule into another, the findings support the assertion that college freshmen
responses focused more on chemical structure rather than the interactions between
molecules and enzymes.
Only 19% of students provided tier one responses describing enzyme interactions
between molecules. In these responses, students demonstrated either limited
understanding (level 1) or developing understanding (level 2) of the transcription process.
Interestingly, a common theme in students’ responses was the confusion between DNA
replication and RNA transcription in question 2. The most common element of confusion
was the identification of the enzyme(s) and enzyme functions between the two processes.
For example students would identify the enzyme helicase as playing a key role in
transcription with the reasoning being that the two DNA strands need to be separated for
RNA to be produced. Although helicase is mainly involved in separating the two DNA
strands at the initial stages of DNA replication, helicase is not involved in the
transcription process to create a strand of mRNA. Another common conceptual difficulty
reflected in student responses included the tendency to mismatch appropriate terms or
vocabulary to describe transcription. Most often, these errors substituted vocabulary used
to identify other processes, such as replication (of DNA) or translation (from mRNA to
protein), rather than transcription (DNA to mRNA) (see question 4). Another error in
vocabulary was reflected in students’ interchanging elements of the DNA replication in
eukaryotic organisms to the processes that occur in prokaryotic organisms (i.e.
aspects/differences of DNA replication between animal and plant cells with those in

127
bacteria). One example of this was observed in student interviews in which one student
described the origin of replication (where the process is initiated). In their descriptions
students would indicate the presence of a single origin as the DNA is copied, which is
present in bacterial models. This was also indicated in drawings students created during
interviews.
These findings suggest that students rarely consider the enzymes involved within
the system or how the process of transcription are largely driven by underlying key
feature(s) of the enzyme that allow this particular process to function the way it does;
specifically, the reason RNA is constructed in a single direction is that polymerase only
interacts with the 3’ end of RNA (the difference is that the 3’ end has a –OH functional
group on RNA). This is very different from the process being driven by the chemical
differences between the DNA template and the new RNA molecule. In question 2 (as
well as the questions 3 and 4), students demonstrated a fragmented understanding of the
process that relied on factual details of chemical players. Interestingly enough, because of
these isolated pieces of knowledge, students commonly superimposed aspects of a
similar, but very different process, of DNA replication or confused scientific vocabulary
with other key concepts or processes.
Questions 3 findings highlight how students were able to construct a correct RNA
sequence using a provided DNA template. Their reasonings also reflected a lower level of
understanding. Approximately 74% of students’ tier two responses included scientific
fragments with misconceptions (level 2). Students’ answer themes included statements
about nucleotide base paring rules (e.g. guanine pairs with cytosine, and adenine pairs
with thymine). Specifically, students commonly mentioned that uracil replaces thymine
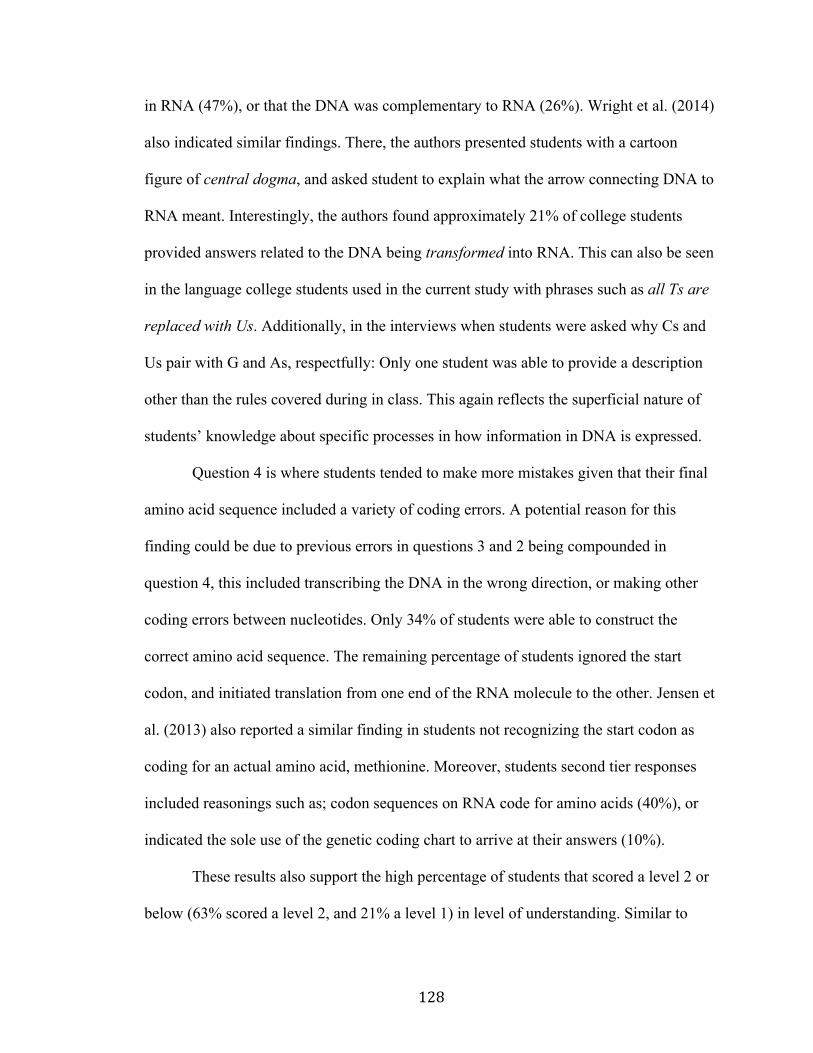
128
in RNA (47%), or that the DNA was complementary to RNA (26%). Wright et al. (2014)
also indicated similar findings. There, the authors presented students with a cartoon
figure of central dogma, and asked student to explain what the arrow connecting DNA to
RNA meant. Interestingly, the authors found approximately 21% of college students
provided answers related to the DNA being transformed into RNA. This can also be seen
in the language college students used in the current study with phrases such as all Ts are
replaced with Us. Additionally, in the interviews when students were asked why Cs and
Us pair with G and As, respectfully: Only one student was able to provide a description
other than the rules covered during in class. This again reflects the superficial nature of
students’ knowledge about specific processes in how information in DNA is expressed.
Question 4 is where students tended to make more mistakes given that their final
amino acid sequence included a variety of coding errors. A potential reason for this
finding could be due to previous errors in questions 3 and 2 being compounded in
question 4, this included transcribing the DNA in the wrong direction, or making other
coding errors between nucleotides. Only 34% of students were able to construct the
correct amino acid sequence. The remaining percentage of students ignored the start
codon, and initiated translation from one end of the RNA molecule to the other. Jensen et
al. (2013) also reported a similar finding in students not recognizing the start codon as
coding for an actual amino acid, methionine. Moreover, students second tier responses
included reasonings such as; codon sequences on RNA code for amino acids (40%), or
indicated the sole use of the genetic coding chart to arrive at their answers (10%).
These results also support the high percentage of students that scored a level 2 or
below (63% scored a level 2, and 21% a level 1) in level of understanding. Similar to

129
those responses in questions 2 and 3, these findings show students reliance on specific
details rather than larger ideas regarding each process in gene expression. This is directly
comparable to How People Learn (Donovan & Bransford, 2005). The key feature that
separates novice learners to a more expert level of thinking is the use of common patterns
or themes rather than a reliance on factual details. Similar to the earlier example with
engineering students provided by Donovan and Bransford (2005) (see the Literature
Review section), as students begin to connect factual details within a larger theme or
category this can aid in the retention of specific factual knowledge.
It is important to note students’ difficulties. Specifically the length of the DNA
and RNA sequences students were expected to transcribe (question 2 and 3) and translate
(question 4). By far, the most common coding errors were the result of missed base pairs
that were overlooked as students coded the nucleotide sequences. This most likely is due
the 27 base pairs being in close proximity to each base, which in turn could have resulted
in students generating an incorrect amino acid sequence through a simple mistake in
reading the previous sequence. This is further supported by student interview data in
which student explanations reflected proper coding of the messenger RNA sequence, but
upon closer inspection the students noted missing a letter. Ironically, the researchers
involved in developing and coding student responses made similar reading errors at first,
but each developed methods to limit reading miscues and other reading errors. This is
important, as it is common practice for teachers to provide students with sample DNA
sequences that are long enough to assess if student can properly identify and code an
genetic sequence. It should be noted that test makers should provide proper support to
prevent simple errors not due to misunderstanding. During interviews students commonly

130
rewrote the sequence, separating it into 3 base pair segments (illustrating the concept of
codons consisting of 3 nucleotide coding segments). However, students would commonly
rewrite the entire sequence, rather than at the start codon (where the process of translation
is initiated), which was also a misconception present in the literature (Jensen et al. 2013).
This could also force students to not consider the concept of the translated region prior to
the start codon in translation, which is also an important larger concept in gene
expression and gene regulation.
Questions 5 & 6: Molecular Properties And Functions
In question 5 and 6, students’ reasonings about the chemical properties of
molecules interacting in a system were examined. In question 5 students were asked to
identify the anticodon sequence for a given amino acid. Similarly, students were able to
identify the correct anticodon in the first tier (71%), but their second tier reasonings
demonstrated a superficial level of understanding (over 60% scoring at a level 2 or
below). Interestingly, approximately 20% of students equated the anticodon with the
codon in their first tier responses. This result was also validated in the percentage of the
answer category: Identical to codon sequence (19%). However, most of the other answer
categories included themes related to complementary pairing rules or base pairing with
the codon sequence. Interestingly, none of the responses described or identified the
transfer RNA or that the anticodon was located on a transfer RNA molecule. Likewise,
Jensen et al. (2013) observed that college students did not understand the role of transfer
RNA and anti-codons. This finding also illustrates that freshmen may not think about the
processes of gene expression in terms of a biochemical system in which students consider
how/why subsequent components interact to produce a larger effect or product.

131
In question 6, students asked to describe how a correct amino acid is integrated
into a peptide chain through the RNA coding sequence. Thirty one percent of student
responses identified that the order of the codons in the RNA transcript, rather than the
chemical bonding between RNA molecules, was the best description for incorporating the
correct amino acid into a peptide. Additionally, the reasons provided by those students
involved correctly bound molecules coming together like puzzle pieces. This indicates
misconceptions similar to those observed in enzyme-substrate interactions inventories,
where students view the interactions of RNA and enzyme construction as fitting together
like a lock and key (Bretz & Linenberger, 2012). One possible explanation is that students
fail to make connections between nucleotide interactions with other intermediate
molecules (Guzman & Bartlett, 2012; Jensen et al. 2013). As Bretz and Lineberger
(2012) note this lock and key model is a common misunderstanding students possess,
While a more scientific accurate would be more of an induced fit model which takes into
account binding energies and formation of intermediate molecules during the biochemical
reactions between protein and substrate molecules. Similarly, this puzzle-piece view of
biological systems could be the result of personal experience with the macroscopic world
in which physical objects within a machine or system are precisely arranged and
calibrated with one another. Additionally, another likely source of this idea could be
images, applets and simulations used in textbooks, or even other multimedia platforms
video platforms. Instructors may further reinforce these metaphors through their lectures
and illustrations, as indicated in Figure 4.1 in Queen’s description of her drawing of the
transcription process.
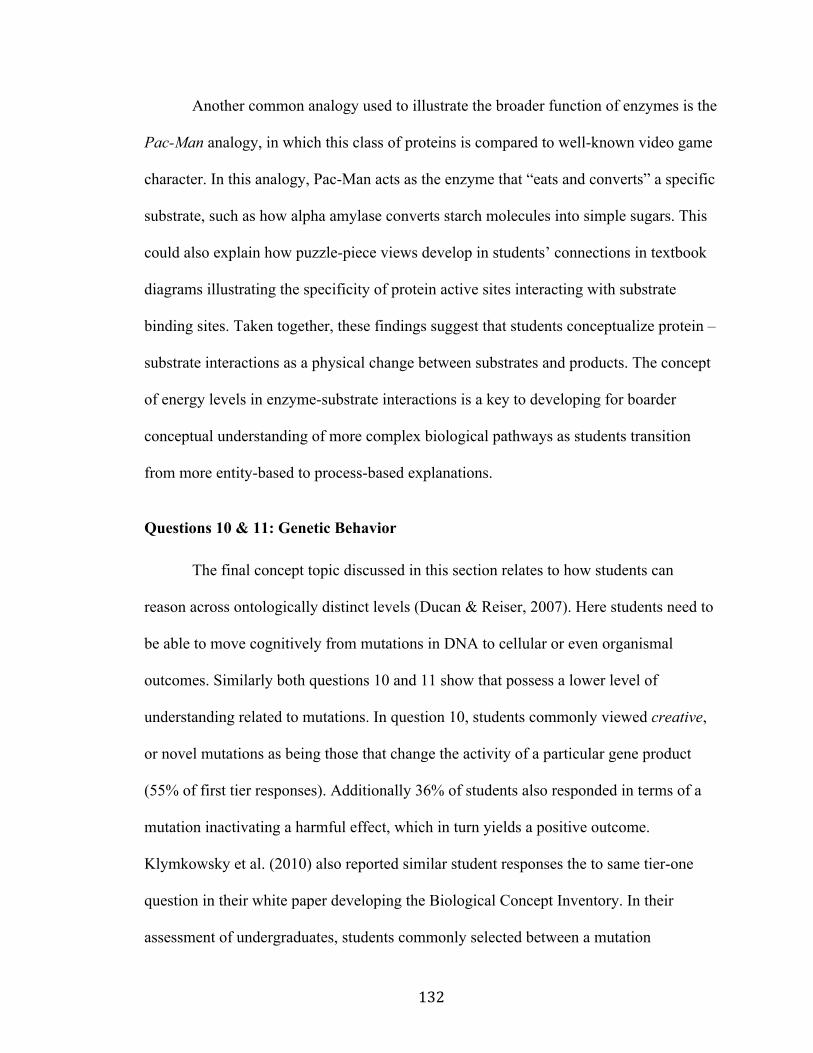
132
Another common analogy used to illustrate the broader function of enzymes is the
Pac-Man analogy, in which this class of proteins is compared to well-known video game
character. In this analogy, Pac-Man acts as the enzyme that “eats and converts” a specific
substrate, such as how alpha amylase converts starch molecules into simple sugars. This
could also explain how puzzle-piece views develop in students’ connections in textbook
diagrams illustrating the specificity of protein active sites interacting with substrate
binding sites. Taken together, these findings suggest that students conceptualize protein –
substrate interactions as a physical change between substrates and products. The concept
of energy levels in enzyme-substrate interactions is a key to developing for boarder
conceptual understanding of more complex biological pathways as students transition
from more entity-based to process-based explanations.
Questions 10 & 11: Genetic Behavior
The final concept topic discussed in this section relates to how students can
reason across ontologically distinct levels (Ducan & Reiser, 2007). Here students need to
be able to move cognitively from mutations in DNA to cellular or even organismal
outcomes. Similarly both questions 10 and 11 show that possess a lower level of
understanding related to mutations. In question 10, students commonly viewed creative,
or novel mutations as being those that change the activity of a particular gene product
(55% of first tier responses). Additionally 36% of students also responded in terms of a
mutation inactivating a harmful effect, which in turn yields a positive outcome.
Klymkowsky et al. (2010) also reported similar student responses the to same tier-one
question in their white paper developing the Biological Concept Inventory. In their
assessment of undergraduates, students commonly selected between a mutation

133
inactivating a harmful gene, or if the mutation had no effect on the gene product in
describing how mutations in DNA might be creative. In question 11, students were found
to relate a mutation leading to a dominant trait as those producing changes in cell
function. Additionally students also reasoned that the outcome would be dependent how
the mutation affected the organism in terms of beneficial or harmful effects. Although, it
should be noted that Klymkowsky et al. (2010) concept inventory did not use a two-tiered
format. They explain this decision in the case of a sample two-tier question being thrown
out because the students found the question confusing or difficult to answer. This was
also a common theme during student interviews as students continually commented about
never taking a test that asked for why they thought the way they did. Furthermore,
students’ interview data for questions 10 and 11 also reinforce the finding of students
continually fall back on more familiar terms and vocabulary with responding to
questions, and their described confusion in non-scientific terms used to describe
biological phenomenon (e.g. mutations that can be creative).
Evaluation of the Survey Instrument
This section will provide an evaluation of the two-tier survey instrument on gene
expression, which will include a discussion regarding survey reliability and validity
measures and will provide possible explanations for the lower measure of survey reliably
including potential concerns with specific questions and overall survey difficulty.
Chronbach’s alpha and Issues with survey reliability
The current study yielded a Chronbach’s alpha value of 0.52 for the entire survey,
which is below the commonly acceptable 0.70. Other moderately lower alpha coefficient

134
values have also been reported in the literature (Tan et al., 2002; Tsui & Treagust, 2010).
However, the authors described using a test – retest methodology for assesses survey
reliability.
Other works have also reported potential issues in using coefficient alpha values
as a single measure of reliability (Streiner, 2003; Sijtsma, 2009). Streiner (2003)
summarizes four common myths in regards to use of coefficient as a reliability measure.
The author notes that alpha is not a fixed property and can vary depending on the sample
tested. This means that an alpha coefficient can indicate a high reliability for a scale with
one sample, but could have marginal reliability for another sample. Streiner (2003) and
Sijtsma (2009) also explains that the term internal consistency is not well defined in the
literature, and that alphas can only reveal the interrelatedness of items on a scale.
Interrelatedness of items refers to the degree in which a set of items measures a similar
scale. In this instrument, four different domains were used to measure students content
related to gene structure and function relations and the process of gene expression.
Furthermore, establishing internal consistency among items in two-tiered instruments
may also require measures other than coefficient alpha, as data reported in the interview
data and common theme analysis of students’ written responses show; students had
difficulty providing reasoning statements connected to their content knowledge in tier
one. Additionally, the fact that tiers 1 and 2 within each of the individual test item were
linked, meaning that performance in tier 1 influences the student’s score in tier two also
suggest that coefficient alpha may be a poor measure of reliability for this given
instrument. This paper recommends further analyses that examine other tests of
reliability, as they may be better indicators of internal consistency than coefficient alpha.

135
Other measures of reliability. Overall the findings indicate that the 0 – 5 scoring
rubrics (Table 3.2 and Appendix A) were a reliable method to assess students level of
understanding. The findings reported in this study, indicate that students generally had a
lower level of understanding based on the short answer analysis (chapter4 4). In each of
the question breakdowns, a larger percentage of students were reported at level 2. At this
level, students’ understanding focused on superficial details, scientific fragments and
answer with partial accurate details. Moreover, this suggests that student’s knowledge
about genetics is still developing. Similar results have also been published in the
literature in regards to students understanding of genetics concepts (Saka et al. 2006;
Marbach-Ad & Stavy, 2000). Additionally, scores of students’ level of understanding
were also validated through student interviews and answer categories.
Measures of Validity. This study utilized two methods to measure the degree of
instrument face validity including: semi-structured student interviews about there survey
responses, and content analysis of short answer responses by category theme. Overall the
findings reported in chapter 4 indicate a high degree of validity in survey responses. In
the semi-structured interviews, students were able to articulate their understanding.
Additionally, the current study reports an overall agreement between student’s interview
responses and their answers provided in the survey. Furthermore, common themes
reported in students’ short answers reflected similar findings both in the level of
understanding scores and overall survey response patterns between the first and second
tier responses. This is related to the argument above for other measures of test reliability
in that a test-retest assessment approach might be more appropriate in future iterations
and evaluations of the two-tiered instrument presented in this paper and others. By

136
following a test-retest approach, students would become more familiar with the new test
format. As indicated in the findings in Chapter 4, students commented on how they had
never seen a test constructed in a two-tier format; in addition to not being accustomed to
providing a reasoning statement connected to their understanding. This suggests that
students need to acclimate to the testing format, and a test-retest method would ease
student apprehension to new testing methods that measure what they understanding about
a given topic.
Potential Issues with Survey Questions
The low value for Chronbach’s alpha for the entire instrument (0.52) does
suggests the possibility of student guessing on particular survey items. Superficially on
those test items in which student noted potential confusion with words or phrases used in
the questions, which include questions 2, 7, 8 and 10. For example as discussed in the
previous section regarding tier one response for question 8. During interviews, students
noted that they felt that each of the possible answer choices were correct in some regard.
Because of this students grappled with selecting the best answer choice based on their
current understanding of how genes function. Furthermore, students indicated that if
given the opportunity, they would have selected multiple answers. Because the option
was not available they relied on familiar vocabulary or specific terms in choosing the
appropriate answer. This behavior does suggest guessing when selecting answers;
however, students tier two reasonings for their selected answer choice does not support
simple guessing. Although responses were commonly general or vague in nature,
students were able to articulate their reasonings for answering they way they did. This

137
was also validated in the student interview responses being in agreement to the responses
provided on the instrument.
Another interesting issue that was repeatedly observed were students comments
on the language used in several questions; specifically the lack of scientific terms or
common vernacular used in reference to larger ideas being assessed. This was in turn a
source of confusion among students. An example of this can be seen with question 2 and
10. In question 2, students noted confusion with the phrase “basic feature of this
enzyme,” which during interviews were indicated to mean the common characteristic of
the enzyme. Although, this was the intended meaning of the researcher, this could also
explain 43.2% of students not providing and explanation for the selected direction in tier
one of the question due to the perceived ambiguous meaning of the phrase. Similarly, in
question 10 students noted the use of the word “creative” as being odd to the students.
This was interesting, as this particular question was adapted from the Biological Concept
Inventory, which was also reported by Klymkowsky et al. (2010). Klymkowsky et al.
(2010) assessed college freshmen in an introductory biology course. When creating the
question stem, the authors identified common words or phrases used by students when
field-testing the original inventory. One possible explanation is that students are
accustomed to the use of scientific terminology when assessing student understanding.
Because of this, students can often rely on test-taking strategies in weeding out possible
answer choices through the use of familiar terms or vocabulary. This type of strategy was
uncovered during student interviews, with question 8 in particular. Additionally, this
falling-back on familiar terms has also been observed with other learners’ explanations of
gene expression (Fisher, 1983; Bahar, Johnstone, & Sutcliffe, 1999; Marbach-Ad ,2001).

138
Another possible explanation for the low alpha value is likely due to the difficulty
level of the survey instrument itself. The interviews indicated that the structure of the test
was unfamiliar to the students. Additionally, students noted the survey asked about
boarder and larger concepts rather than more specific knowledge. Even though this was
the main intention in the development of the instrument, students found this type of test
both cognitively and conceptually difficult, which likely affected the observed alpha
value. This conclusion is explained in Streiner (2003) and Sijtsma (2009), stating that the
robustness of alpha can vary largely depending on the sample assessed. Although the
intended sample was indeed introductory biology students (in this case freshmen),
explicitly asking students to explain their reasoning for particular answer choices rather
than the content itself poses cognitive strain on the students. For example, the instrument
in this study asked freshmen to think about genetic processes in a way they have never
been asked, in this case thinking about the process of gene expression in a systems
thinking approach. Furthermore some of the test items, particularly questions 10 and 11
asked freshmen to reason from molecular processes to higher population interactions.
Although it is the opinion of the researcher, that many instructors would want their
students to be at this level conceptually; however, evaluators need to take into account
the conceptual difficulty of the tasks. In this case future iterations or this instrument could
include other lower level questions. This would help to better assess and reflect students’
level of knowledge. Yet, providing additional test items could also greatly increase the
testing time, and in turn the cognitive load student experience as they complete a greater
variety of test items.

139
This also presents other implications regarding how instructors teach and how
students learn for greater conceptual understanding of key biological concepts. Namely,
this suggests that students formal reasonings regarding their conceptual understanding is
rarely asked by teachers; which can provide a rich and meaningful amount of information
on student learning as suggested in the diversity of ideas uncovered in the previous
section.
Summary
The above section discusses the findings related to research question 1 in how
well the instrument was able to measure students understanding and reasoning about
genetics concepts. Overall the findings presented in this research suggest the two-tier
instrument on genetics is a reliably and valid method of assessing students conceptual
understanding and reasoning. However, not all the questions were equally valid and
reliable. The paper also presented potential issues with a number of test items. An
example can be found in question 10, in student comments to mutations being creative
during interviews. Further more students also commented about the relative difficulty of
the two-tiered test. This can be observed in the interview data presented in question 7, in
addition to other interview excerpts. These findings could influence the overall internal
consistency of the instrument as noted by the lower than expected alpha estimate.
Furthermore, this discussion presents important implications and recommendations to
teaching and learning concepts in gene expression, as well as for further refinement of the
survey instrument.

140
Implications to Teaching and Learning Gene Expression
This section will further consider the implications of the research findings
concerning the teaching and learning of gene expression. This will include a discussion
between the observed levels of understanding connected to historical gene models.
Following this will be a discussion about theories of conceptual change in terms of
helping students to develop more sophisticated conceptual understanding about gene
expression. This will conclude with recommendations to teaching gene expression.
Levels of Understanding and Historical Gene Models
Overall the findings from this study suggest that college freshmen possess a
limited or developing level of conceptual understanding regarding concepts in gene
expression. This can be seen in the general and vague nature of students’ short answer
responses, their formal reasonings for selected answers, and the emerging themes in their
responses. But what does this mean in terms of historical and modern conceptual models
of gene structure and function? For a detailed description of the various historical gene
models, see the Literature Review chapter. To summarize, there are four major historical
models that have developed in order to describe what is a gene and how those genes
function. These include the Mendelian, classical, neo-classical and modern gene models.
These models reflect the ever-changing scientific understanding about gene function that
has developed over the past 200 years. Starting with the Mendelian model, which
described patterns of genetic inheritance and transmission of heritable information from
parent to offspring. After the discoveries about the chemical structure of DNA, the
understanding of gene function began to shift towards the chemical structure of a gene
and how those molecules behave. This later began to shift towards the understanding of a

141
gene conveying a chemical sequence that codes for a specific protein molecule in the
neoclassical model, and finally away from the one gene – one protein concept, towards
the current modern model of gene function (see Figure 2.1) in which genes interact
within biological systems in order to code for various intermediate molecules that in turn
express a variety of functions. This is a generalization of course, but the point is that
each of these models reflects how science’s level of understanding about genes as they
developed over time.
The description also implies that these models have developed in a logical and
linear fashion. However, these shifts in gene models were anything but logical or linear
at the time as new data and information had to be integrated and reworked within the
current model at the time. The scientific development of the gene model is almost
identical to how learners develop their own mental models in science learning (Bradford
& Donovan, 2005). Specifically, the learner takes in new information and attempts to
organize or re-organize that knowledge within an existing mental framework.
Additionally, the learning progression of genetics in students from k-12 through the
college level follows a very similar trajectory. Students begin learning about genetic
inheritance, followed by chemical nature of genetic information in DNA and
chromosomes, to genes consisting of a segment of DNA that codes for proteins, and so
on. Yet, as the scientific model did not develop linearly, why should we as teachers
expect students' mental models of genes to develop linearly and logically over time?
As the findings above from questions 1, 8, 6, 7 and 10 illustrate, not only do
students possess conceptually weak levels of understanding about genes and gene
function, they also seem to confuse or overlap different contexts and models about genes.

142
An example of this is seen in how students describe genes as a segment of DNA that
codes for a protein, but function as a particle of information for producing a given trait.
In this example, the students’ model of a gene overlaps two differing historical gene
models: a neoclassical gene model with a more Mendelian gene model. In other words,
students may conceptualize gene expression in terms of a more neoclassical
understanding (a chemical sequence that codes for and expresses a protein molecule), but
genes in general function in order to convey information that determines a particular trait.
Similarly, Flodin (2008) and Santos et al. (2011) explain that these hybrid gene
models present a conceptual challenge to students in terms understanding gene function.
One potential outcome noted by the authors is that students then tend to develop
conceptual misunderstanding that result in genetic deterministic explanation for genetic
phenomena (i.e. genes determine traits or functions). Furthermore, some of the major
findings from this study also suggest that college students still hold ideas about genes
using the Mendelian gene model, as seen from the findings in questions 1 and 8.
So how do instructors begin to cultivate and develop students’ conceptual models
pertaining to genes and gene expression towards the modern gene model (Figure 2.1)?
The next section will discuss this in relation to conceptual change theories.
Conceptual Change and Understanding Gene Structure/Function Relationships
How do students develop conceptual understanding about gene expression? As
the above findings illustrate, college freshmen commonly presented superficial
understanding that relied heavily on topical details about various processes and factual
knowledge rather than categorizing details within larger knowledge patterns and
concepts. In questions 2 through 4 student responses suggest an understanding of gene

143
expression occurs through a collection of knowledge in a piecemeal fashion, which
would support diSessa’s theory of conceptual change in the use of p-prims in students, as
described in students fragmented and topical descriptions of the steps in gene expression.
However, this is only one domain within the larger gene structure and function
relationships assess in this instrument. Considering the findings as a whole, suggests that
college freshmen understanding uses a coherent mental model about the gene structure in
order to make generalizations about the function of a gene. This more closely aligns with
Vosniadou (2010) in the construction of synthetic mental models in order to explain
newly learned material as students incorporate factual details about genetic processes to
build upon prior naïve models of genes as passive particles of information. For example,
students’ responses to questions 1 and 8, suggests that students’ hybrid gene modals of
genes were consistently organized around genes being an entity that provides information
for a particular trait, but also incorporated concepts at the molecular level. Additionally,
in trying to reason through gene structure and function relationships during interviews in
question 8, students attempted to integrate new information about genetic processes with
prior conceptions of genes as carriers of information.
Furthermore, elements of Chi’s (2008) view of conceptual change can also be
applied to how students reason about genetic phenomena across different hierarchical
levels of organization in biology (i.e. molecular, cellular, and organismal processes).
These reflect the hierarchical categories student assign to describe and explain certain
biological phenomena. This is illustrated in the two representations depicted in figure 5.1,
which builds upon previous work of Johnston’s (1991) model in panel A of how student
make connections (solid lines) in chemistry between the sub-micro scale (atoms and

144
molecules), symbolic scale (chemical formulas and representations) and the macro scale
(the arrangement of molecules in liquid vs. frozen water). In order to develop a deeper
conceptual understanding of chemistry, students need to process information between all
three scales (Johnstone, 1991). For the purposes of this study, Johnstone’s (1991) model
needed modification to reflect the genetics misconceptions found in the literature;
specifically, how students reason between hierarchical scales in biology (Duncan &
Reiser, 2007). Panel B of Figure 5.1 depicts the modified model that integrates Johnston
(1991) to the work of Duncan and Reiser (2007). In Panel B illustrates three ontologically
distinct hierarchical categories commonly used in biology learning: the molecular
(consisting of genes and proteins), the microscopic (consisting of cellular process and
tissues), and the macroscopic level (consisting of organisms and population interactions).
Just as in chemistry, biology students need to make connections (solid lines) across all
three levels in order to develop deeper conceptual understanding (Duncan & Reiser,
2007).
Extending both Chi (2008) and figure 5.1b, the findings suggest that while
students can reason through genetic processes within a particular level, they have
difficulty extending that reasoning between different levels. This indicates that students
have difficulty making certain categorical shifts between hierarchical categories (dashed
lines in figure 5.1b). For example, in examining the findings between different instrument
domains students were able to reason through concepts with relating molecular
interactions to microscopic interactions on the cellular level (questions1 and 6 to 7 and 8
respectively). The findings also suggest students are able to relate concepts between the
microscopic and macroscopic levels (questions 7 and 8 to questions 10 and 11). In

145
Contrast, students showed the greatest difficulty in relating concepts at the molecular
level to the macroscopic level (questions 1-4 to questions 10 and 11). The dashed arrows
in figure 5.1b illustrate these conceptual movements described above.
Figure 5. 1 Applying Student Reasoning Across Ontologically Distinct Levels of Organization
In the ideas uncovered through the survey instrument, students’ levels of
understanding commonly fell at a level 1 or level 2, which indicated general or vague
scientific fragments and ideas, some of which included misconceptions. Additionally, the
common themes in students’ responses suggest students’ grapple with their prior hybrid
gene mental models as they attempt to make sense of new information or apply that
Sub-Micro
Macro
Symbolic
A).
Microscopic
Macroscopic
Molecular Genes & Proteins
Organisms & Populations
Cells & Tissues
B).
A) Johnstone’s (1991) model of chemical reasoning: solid lines indicate the connections between different scales in chemistry learning. B) Modified model of reasoning across ontological levels in biology applying Johnstone (1991) to Duncan and Reiser (2007): Reflects how biological levels are structured in a hierarchy with connections between levels indicated by sold lines. Dashed arrows illustrate the categorical shifts and cognitive movements students can make in learning.

146
knowledge to new situations, as described in the findings in questions 10-11 above. For
instructors, knowing this could provide a means an avenue to foster students’ mental
model transformation and categorical shifts in learning critical genetics concepts, such as
relating the consequences of DNA mutations to boarder outcomes both molecular and on
the population level. In addition know these conceptual difficulties can potentially inform
instructional decisions in order to facilitate more sophisticated understanding. So, how
can instructors utilize these findings in their teaching? The final piece in this section will
explore potential implications of the research findings to improving teaching and learning
regarding gene expression.
Potential Impacts and Improving Learning
One of the major findings from the current study that relates to teaching as the
need for undergraduate biology students to explain their reasoning in understanding the
key concepts or processes involved in gene expression, rather than memorizing isolated
factual details. As demonstrated by there developing levels of understanding, students
were unable to connect their factual knowledge on the nucleotide differences between
DNA and RNA. An example of this is through the use of charts to construct a proper
amino acid sequence, and the role of other intermediate RNA molecules, such as tRNA,
in producing that peptide sequence. In the students’ mental models, these details on their
own provide sufficient explanations. But more often than not when these explanations
were challenged during interviews, these models quickly broke down as student can be
seen trying to rationalize and re-organize those details within the challenged reasoning.
As educators, this is the type of cognitive activity we desire in our students: to take an
active role in the process of knowledge construction. In this way, teaching through

147
conceptual change, as described by Vosnidau (2010) and Chi (2008), provides a more
holistic approach in the understanding the interrelatedness among concepts and
mechanistic thinking about the processes in gene structure and function. Currently the
way we teach genetics leads towards students developing a puzzle-piece model of these
processes. To an instructor, knowing how students’ knowledge develops and the common
ways students organize their mental models around concepts is necessary in moving
towards developing meaningful conceptual understanding.
Furthermore, the use of student drawings and their models connected to students’
formal reasonings can also provide a route to teaching and learning practices that develop
student systems thinking about gene function. A direct example can be seen in students
ideas uncovered in questions 2 through 4. During the interviews, students commonly
utilized physical models and modeling processes to explain their understanding. This
highlights the added benefit to actively having student model biochemical processes, as
well as challenging those models or revising current models based on new information.
Overall, the results summarized in this study present several implications related
to the teaching and learning of gene expression. Lastly, it is important to note the positive
benefits of implementing a two-tier assessment format in uncovering student
understanding. Although this instrument used both multiple choice and short answer, the
presented instrument can be utilized into large-scale university biology courses, such as
lecture classes where student enrollment is over 300 students. Although short answer test
items can provide a wealth of information on student understanding; analyzing student
responses can take an incredible amount of time (as the evaluation team for this study can
attest) through the development of reliable scoring rubrics. Ultimately, the instrument

148
developed in this study could fulfill this need, as this study has already developed scoring
rubrics instructors can implement in their own instruction. However, for larger and larger
class sizes, the need to further refine the instrument and develop a completely multiple
choice version of the gene expression instrument remains.
Study Limitations and Future Research
Despite the careful planning, thought and design involved in the research process,
there were some limitations. With the purpose of this research project being to field-test a
two-tier survey instrument, issues regarding test reliability and validity are noteworthy.
First, is the low alpha coefficient described earlier in this paper. Even though, this study
utilized other sources of test reliability, a low estimate of internal consistency among test
items could influence the reproducibility of the findings. Additionally, the student
interview data raised some concerns regarding the clarity of several tasks, including the
phrase basic feature about this enzyme in question 2, as well as the adjective creative
when describing mutations leading to novel features as asked in question 10. Another
limitation can be the difficulty of the assessment. In the interviews students commonly
commented on how they had never experienced a two-tier test format. Similarly the
general nature in some of the questions initially confused students, but they later realized
that this was intentional so they would not rely on specific details giving away answers.
The findings in this study also add to a growing body of research on
undergraduate students’ understanding of biology concepts. In addition to the other
studies discussed in this paper, future research needs to be conducted on
undergraduates systems thinking in other biology concepts as well as understanding
of how the structure of biological systems (e.g. genetics) interact to produce a given

149
function. Additional research is also needed regarding the present two-‐tier survey
instrument. Specifically, research needs to address the potential issues and
limitations with a few of the survey questions. Likewise, future research should also
assess different student populations of undergraduates such as students in higher-‐
level biology course in order to begin to 1) further develop and test the proposed
two-‐tiered survey instrument, and 2) to aid in developing a learning progression of
genetics understanding in college students. This will also help add to the validity
and reliability of the propose survey instrument and further refine its effectiveness
in addition to help educators improve students understanding in biology.
Conclusions and Recommendations
The results of this study suggest that the two-‐tiered survey instrument
presented can be valid and reliable measure of students’ ideas about genetics.
Although, the two-‐tiered survey instrument did show a lower than expected
estimate of internal consistency using Coefficient alpha, this study did utilize other
measures to support the high reliability through semi-‐structured interviews and
item analysis per task using scoring rubrics of short answer responses. These
results consistently indicate that the undergraduates assessed in this study have a
lower level of understanding that relies primarily on the use of scientific fragments
and partially accurate factual information about the gene concept and gene
expression. The findings also illustrate a high degree of validity through
comparisons between student interview transcripts to survey item responses, in

150
addition to analysis of the common themes provided in students short answer
Reponses.
Furthermore, the results presented in this study are also reflected in the
literature regarding students’ conceptual difficulties in genetics (Marbach-Ad &
Stavy, 2000; Lewis & Kattmann, 2004; Saka et al. 2006; Klymkowsky, Underwood &
Garvin-Doxas; Tsui & Treagust, 2010; Jensen et al., 2013; Wright et al., 2014).
Similarly, these findings also indicate that undergraduates’ reasonings about
genetics concepts are less developed in connection to their knowledge about
concepts of gene function (Jensen et al, 2013). Additionally, several of the noted
misconceptions of undergraduates in this study were developmentally similar to
those observed in K-‐12 students. An example of this can be seen in students
understanding of gene function assessed in question 8. Here, nearly 10 percent of
students still held on the idea of genes functioning as information passed down from
parent to offspring (passive particles of information) observed by Lewis and
Karrmann (2004). Moreover, students had difficulty tracing the flow of information
from DNA to RNA to a protein product as observed in their responses to questions 2
through 4, which was also observed by Guzman and Bartlett (2012), and Jensen et
al. (2013).
According to the reports Vision and Change (2011) and BIO2010 (2003),
biology students will need to have a deeper conceptual understanding of
fundamental concepts such as the flow and storage of information influence by gene
expression to be successful in their future work. Similarly, other researchers have
called on a renewed genetics curriculum that breaks the canonical view of terms of
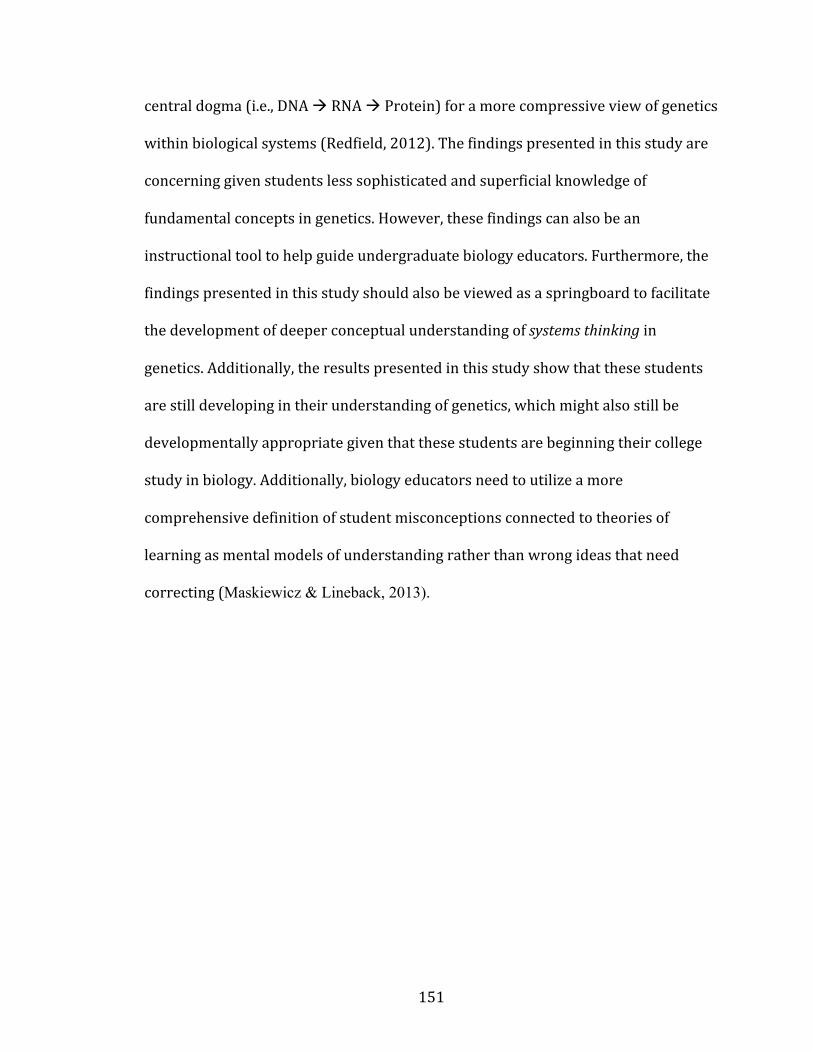
151
central dogma (i.e., DNA à RNA à Protein) for a more compressive view of genetics
within biological systems (Redfield, 2012). The findings presented in this study are
concerning given students less sophisticated and superficial knowledge of
fundamental concepts in genetics. However, these findings can also be an
instructional tool to help guide undergraduate biology educators. Furthermore, the
findings presented in this study should also be viewed as a springboard to facilitate
the development of deeper conceptual understanding of systems thinking in
genetics. Additionally, the results presented in this study show that these students
are still developing in their understanding of genetics, which might also still be
developmentally appropriate given that these students are beginning their college
study in biology. Additionally, biology educators need to utilize a more
comprehensive definition of student misconceptions connected to theories of
learning as mental models of understanding rather than wrong ideas that need
correcting (Maskiewicz & Lineback, 2013).

152
APPENDIX
Two Tiered Survey Instrument With Evaluation Rubrics
Below is the two-tiered genetics survey used for this study. Answers for multiple
choice test items are indicated with an X next to the appropriate answer choice. Rubrics
for each of the short answer test item are provided in italics below the appropriate test
item. The analysis team evaluated each short answer response described in chapter 4, and
each rubric was created using the general scoring rubric criteria.
Name_______________________________________ Section________________ 1a. Which of the following is the best description of a gene? (Adapted from Tsui & Treagust,
2010) [ ] A. The smallest unit of structure in a chromosome. [X] B. A sequence of instructions that codes for a protein. [ ] C. A segment in a DNA molecule. [ ] D. The smallest heritable unit for a physical characteristic
1b. My reason for answer 1 above:
[X] A. It is about the information of a gene for producing a trait. [ ] B. It is about the structural relationship between a gene and a chromosome. [ ] C. It is about the chemical nature of a gene. [ ] D. It is about the gene being a protein.
Below is a target single-stranded DNA sequence. Use this sequence to answer questions 2– 4 below. 2a. Draw an arrow on the DNA sequence below to indicate the direction in which a new RNA
is produced? What basic feature about this enzyme allows the process to occur? Write your answer below.
3’--TGTACTAGCTCACTACATCCATTAGTC--5’
5’ ààààààààààààààààààà3’ Level of
Knowledge 2a: Scoring Criteria
0 Insufficient information to make evaluation; no response; “I guessed”/”I don’t know”; answer is illegible.
1 A. May draw arrow but incorrect direction (3’ to 5’). B. May provide explanation but incorrect C. May misidentify the enzyme other than RNA polymerase D. May contain misconceptions/incorrect information, but all information is

153
incorrect. May be somewhat correct, but answer is irrelevant to question or contains erroneous information.
2 A. May draw arrow from 5’to 3’ direction OR drew correct arrow without labeled ends.
B. Provides no explanation for 5’to 3’ direction OR explanation is incorrect C. May misidentify the enzyme other than RNA polymerase D. Some misconceptions/incorrect information, but some information must
be correct. 3 A. Draws labeled arrow from 5’ to 3’ Or provides sufficient enough
description to indicate 5’ to 3’ direction. B. Restate the question: because they go that way OR RNA strand is created
5’ to 3’ OR (RNA strand) It is created in opposite direction (of DNA strand), Or is anti-parallel.
C. All information must be correct (may be vague). May confuse connections with other processes (Translation or Replication)
4 A. Correct direction of new RNA strand as 5’ to 3’ (labeled) B. Enzyme adds new nucleotides to the new template RNA strand
5 A. Correct direction of new RNA strand as 5’ to 3’ B. Enzyme adds new nucleotides to the new template RNA strand to the 3’
end. C. ID the enzyme as RNA polymerase
2b. In at least 2-3 complete sentences, explain why you chose your answer. My reason for
answer 2 above: Level of
Knowledge 2b: Scoring Criteria
0 Insufficient information to make evaluation; no response; “I guessed”/”I don’t know”/ “I learned it in class”; answer is illegible.
1 A. Provides explanation that is incorrect or irrelevant OR does not answer question
B. All information must be incorrect OR too vague 2 A. Some explanation to support direction of RNA strand, but explanation
may be partially incorrect or vague. May mentions 3A or 3B, but not both.
B. May identify enzyme as RNA polymerase, OR misidentify the enzyme as other than RNA polymerase
C. May confuse RNA transcription with DNA replication. D. Some misconceptions/incorrect information/vague, but some scientific
fragments included 3 A. State the RNA strand is created from 5’ to 3’, AND
B. State the RNA strand is created in opposite direction (of DNA strand), or anti-parallel, or restate their answer. RNA is paired
C. May identify enzyme as RNA Polymerase or polymerase D. All information must be correct (may be vague). General in nature &
shows a coherent thought process. 4 A. Correct direction of new RNA strand as 5’ to 3’
B. Enzyme adds new nucleotides to the new template RNA strand C. May state RNA strand is antiparallel to DNA strand. D. All information must be correct, but explanations may lack connectedness
across concepts.

154
5 A. Correct direction of new RNA strand as 5’ to 3’ B. Enzyme adds new nucleotides to the new template RNA strand to the 3’
end. C. Explanation states that strands are antiparallel. D. ID the enzyme as RNA polymerase E. May state that new RNA nucleotides can only be added to a free 3’ –OH
group of a nucleotide sequence. F. All information must be correct, and explanations have connectedness
across concepts 3a. Construct a messenger RNA sequence using the target DNA sequence above. Write this
RNA sequence in the space below. Indicate the 5’ and 3’ positions on your sequence.
3’--TGT - ACT - AGC -TCA - CTA - CAT - CCA - TTA - GTC--5’ 5’--ACA - UGA - UCG - AGU - GAU - GUA - GGU - AAU - CAG--3' Level of
Knowledge 3a: Scoring Criteria
0 Insufficient information to make evaluation; no response; “I guessed”/”I don’t know”/ “I learned it in class”; answer is illegible.
1 A. Ends may be labeled but incorrect (3’to 5’) B. Incorrect complementary base pair sequence. Show clear mismatch
pattern of base pairings C. A-U pairing incorrect
2 A. May have correctly labeled 5’ & 3’ ends (5’to 3’) B. One or more pairings incorrect: T-A, G-C & C-G. (A-U may be
correct) C. Pattern of errors present (not a one time copying error) D. May code RNA strand in reverse (3’-->5’) to DNA template
3 A. Correctly labeled 5’ & 3’ ends (5’-->3’), or not labeled B. Correct complementary base pair sequence in coding DNA to RNA (T-
A, G-C & C-G) (A-U pairing incorrect) C. May have small errors in complementary base pairing, but not a
pattern (no more than 3 incorrect/missing bases). 4 A. Correctly labeled 5’ & 3’ ends (5’-->3’), or not labeled
B. Correct complementary base pair sequence in coding DNA to RNA (A-U, T-A, G-C & C-G)
5 A. Labeled 5’ & 3’ ends & correct sequencing of complementary base pairs (5’-->3’).
B. Correct complementary base pair sequence in coding DNA to RNA (A-U, T-A, G-C & C-G)
3b. In at least 2-3 complete sentences, explain how you arrived at your answer. My reason for
answer 3 above:
Level of Knowledge
3b: Scoring Criteria
0 Insufficient information to make evaluation; no response; “I guessed”/”I don’t know”/ “I learned it in class”; answer is illegible.
1 A. Misidentify RNA

155
B. “Opposite nucleotides match.” No mention of nucleotides pairs C. all information incorrect
2 A. May misidentify new RNA strand (tRNA) B. May State strands are antiparallel to each other (or may be vague or
incorrect). May mention opposite or complementary orientation (stating 5’-->3’ is too vague for evaluation).
C. Nucleotide complementary pairs: A-T & G-C (may be vague). No mention of Uracil
D. Some information incorrect / all information correct, but missing opposite orientation of RNA to DNA or strands.
3 A. May ID new strand as mRNA. B. State strands are antiparallel to each other (or may be vague and state
“antiparallel”). May mention opposite or complementary orientation. C. Nucleotides pair up/complementary base pairs (T-A & G-C, or may be
vague). RNA uses U instead of T. D. All Must be correct
4 A. ID new strand as mRNA B. State RNA strand is antiparallel to DNA strand (can describe
antiparallel C. Complementary base pairing: T-A & G-C (A-U in RNA). D. Hydrogen bonding between nucleotide pairs. May ID number of bonds
between nucleotides. 5 A. ID that newly created strand is messenger RNA, and is antiparallel to
DNA template. B. Complementary base pairing between A-T & G-C. In RNA, U pairs
with A from DNA template. C. Hydrogen bonding between Purines (A,G) and pyrimidines (T/U,C).
(chemical interaction with structure). D. May ID number of hydrogen bonds (Two hydrogen bonds between
A&T/U, and Three hydrogen bonds between G&C)
Figure 1:

156
Use Figure 1 above to help you answer the questions 4 - 5. 4a. Construct an amino acid sequence from your messenger RNA in question 3. Write your
sequence below. Met – Ile – Glu Level of
Knowledge 4a: Scoring Criteria
0 Insufficient information to make evaluation; no response; “I guessed”/”I don’t know”/ “I learned it in class”; answer is illegible.
1 A. Incorrect amino acid sequence. Does not match with mRNA coding B. Does not begin with Start codon C. Peptide coded in the reverse direction. (Refer to 3a in mRNA coding) D. Continue past a stop codon. E. Pattern of Mistakes (unclear that the student can properly code correct
amino acid) F. All must be incorrect
2 A. May begin at the start codon (use Met or “start”). B. More than 2 amino acids are coded incorrectly C. May code Peptide in the reverse direction. (Refer to 3a in mRNA coding) D. May Continue past a stop codon E. Pattern of correctness (clear that the student can code the proper amino
acid even though they got an incorrect amino acid sequence) F. At least two correct levels of coding (start, stop, translate direction,
transcribing codon) 3 A. Start from start codon.
B. May code remaining peptide correctly (at least 2 amino acids correct/ minor mistake).
C. Does not continue past a stop codon (may include stop nucleotide sequence at the end, e.g. UGA)
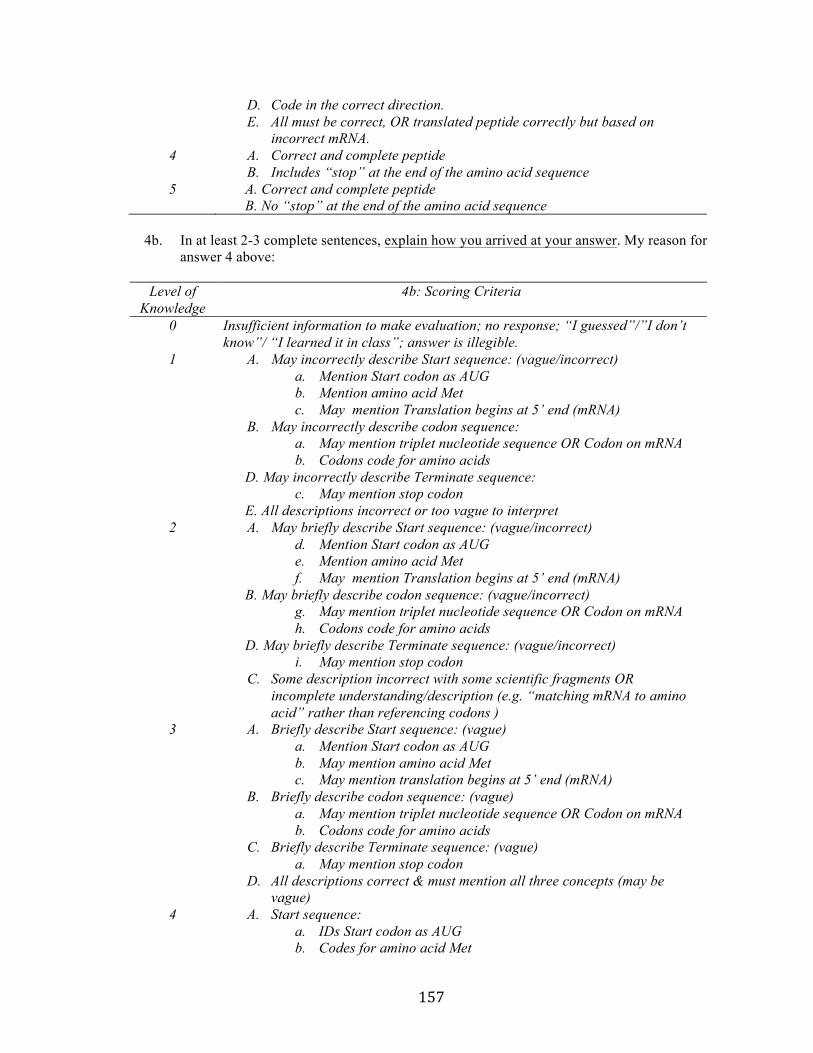
157
D. Code in the correct direction. E. All must be correct, OR translated peptide correctly but based on
incorrect mRNA. 4 A. Correct and complete peptide
B. Includes “stop” at the end of the amino acid sequence 5 A. Correct and complete peptide
B. No “stop” at the end of the amino acid sequence
4b. In at least 2-3 complete sentences, explain how you arrived at your answer. My reason for answer 4 above:
Level of
Knowledge 4b: Scoring Criteria
0 Insufficient information to make evaluation; no response; “I guessed”/”I don’t know”/ “I learned it in class”; answer is illegible.
1 A. May incorrectly describe Start sequence: (vague/incorrect) a. Mention Start codon as AUG b. Mention amino acid Met c. May mention Translation begins at 5’ end (mRNA)
B. May incorrectly describe codon sequence: a. May mention triplet nucleotide sequence OR Codon on mRNA b. Codons code for amino acids
D. May incorrectly describe Terminate sequence: c. May mention stop codon
E. All descriptions incorrect or too vague to interpret 2 A. May briefly describe Start sequence: (vague/incorrect)
d. Mention Start codon as AUG e. Mention amino acid Met f. May mention Translation begins at 5’ end (mRNA)
B. May briefly describe codon sequence: (vague/incorrect) g. May mention triplet nucleotide sequence OR Codon on mRNA h. Codons code for amino acids
D. May briefly describe Terminate sequence: (vague/incorrect) i. May mention stop codon
C. Some description incorrect with some scientific fragments OR incomplete understanding/description (e.g. “matching mRNA to amino acid” rather than referencing codons )
3 A. Briefly describe Start sequence: (vague) a. Mention Start codon as AUG b. May mention amino acid Met c. May mention translation begins at 5’ end (mRNA)
B. Briefly describe codon sequence: (vague) a. May mention triplet nucleotide sequence OR Codon on mRNA b. Codons code for amino acids
C. Briefly describe Terminate sequence: (vague) a. May mention stop codon
D. All descriptions correct & must mention all three concepts (may be vague)
4 A. Start sequence: a. IDs Start codon as AUG b. Codes for amino acid Met

158
c. Translation begins at 5’ of RNA B. Explanation of codon sequence:
a. triplet nucleotide sequence located on mRNA b. May reference complementary pairs to the anti-codon located
on tRNA c. Sequence of codons code for amino acids
C. Terminate sequence: a. ID stop codon b. does not code for amino acid c. ends translation
5 A. Start sequence: a. IDs Start codon as AUG b. Codes for amino acid Met c. Translation begins at 5’ of RNA
B. Explanation of codon sequence: a. triplet nucleotide sequence located on mRNA b. complementary pairs to the anti-codon located on tRNA c. Peptide created using the sequence of codons.
C. Terminate sequence: a. ID stop codon b. does not code for amino acid c. ends translation
D. May reference the process occurring in the ribosome 5a. What would be the anti-codon sequence for Tryptophan (Trp)? [ ] A. UGG [ ] B. GGU
[X] C. ACC [ ] D. CCA 5b. In at least 2-3 complete sentences, explain why you chose your answer or why you rejected other answers. My reason for answer 5 above:
Level of
Knowledge 5b: Scoring Criteria
0 Insufficient information to make evaluation; no response; “I guessed”/”I don’t know”/ “I learned it in class”; answer is illegible.
1 A. Incorrectly describe the anti-codon sequence OR misidentify the codon as the anticodon.
a. flipping/reverse to table, might mention nucleotide sequence B. Incorrect explanation of anti-codon.
a. Equate anti-codon to codon in the table C. May support with nucleotide base pairing D. All information incorrect, OR too vague to interpret
2 A. Vaguely describe the anti-codon sequence (or incorrect): a. Matching/opposite/complementary to table, might mention
nucleotide sequence b. may describe relation of anti-codon OR codon to amino acid
B. Vague explanation of anti-codon. a. complementary pairs to codon from the table
C. May support with nucleotide base pairing

159
D. Some information incorrect, OR incomplete understanding/description. Could just state factual fragments.
3 A. Explanation of anti-codon sequence: a. triplet nucleotide sequence b. complementary pairs to codon c. may describe relation of anti-codon OR codon to amino acid
B. Brief explanation of anti-codon. a. complementary pairs to the codon from the table
C. May support with nucleotide base pairing D. All must be correct, but general in nature & shows a coherent thought
process. 4 A. Explanation of anti-codon sequence:
a. triplet nucleotide sequence from mRNA b. complementary pairs to codon c. relation of anti-codon to amino acid
B. Explanation of what is an anti-codon. a. May mention tRNA; complementary pairs to codon on mRNA
C. May support with nucleotide base pairing (A-U, G-C) D. Show coherent thought processes with details.
5 A. Explanation of anti-codon sequence: a. triplet nucleotide sequence from mRNA b. complementary pairs to codon c. relation of anti-codon to amino acid
B. Explanation of what is an anti-codon. a. located on tRNA; complementary pairs to codon on mRNA
C. May include explanation supported with nucleotide base pairing (A-U, G-C) between anti-codon and codon.
D. May describe role of tRNA in translation E. Show coherent thought processes with supporting details.
6a. Which of the following best describes how the correct amino acid is incorporated into a
peptide sequence through RNA? [ ] A. The order of codons in the RNA transcript.
[X] B. The chemical bonding between RNA molecules. [ ] C. How well the transfer RNA molecule fits within the ribosome. [ ] D. The ribosome checks for correct RNA pairings.
6b. My reason for answer 6 above: [ ] A. The molecules send signals to each other. [ ] B. The molecules have sensors that check for "incorrect" pairings. [X] C. Correct binding results in lower energy than incorrect binding. [ ] D. Correctly bound molecules fit perfectly, like puzzle pieces.
7a. Your muscle cells, nerve cells and skin cells all have different functions because each type
of cell: (adapted from Bowling et al, 2008) [ ] A. Contains different kinds of genes.
[ ] B. Have experienced different mutations. [X] C. Activates different genes. [ ] D. Contains different number of genes.
7b. My reason for answer 7 above:

160
[ ] A. It refers to the cell’s genetic make-up playing a role in its physical traits. [ ] B. It refers to the cell’s function being determined by its genes [ ] C. It refers to the cells genetic make-up being shaped by its environment [X] D. It refers to the flexibility of a cell’s genes in it’s function
8a. Based on your understanding, which of the following describes the function of a gene? [ ] A. Provides an information code. [ ] B. Determines a particular version of a character or trait. [ ] C. Controls how information is expressed. [ ] D. Used to mark how traits change in a population.
8b. In at least 2-3 complete sentences, explain why you chose your answer or why you rejected other answers. My reason for answer 8 above:
Level of
Knowledge 8b: Scoring Criteria
0 Insufficient information to make evaluation; no response; “I guessed”/”I don’t know”/ “I learned it in class”; answer is illegible.
1 A. Confuse genes with traits OR genes are traits; mis-describe the relationship between genes and traits
B. Overgeneralize... a. genes as DNA b. the role of genes OR genes in the body (e.g. genes activate
different DNA segments/ areas) C. All information incorrect, OR too vague to interpret
2 A. May state 2B OR 2C, but not both B. Genes code for proteins OR vaguely state that genes are information /code
for /determine traits C. Proteins, not genes, correspond to a particular trait - the phenotype D. May connect gene across multiple levels of organization (i.e. DNA &
proteins (molecular) TO chromosomes & alleles OR interactions across different genes
E. Some information incorrect, OR incomplete understanding/description. Could just state factual fragments.
3 A. Genes code for proteins; does not state genes determine traits. B. Proteins, not genes, correspond to a particular trait - the phenotype;
could also correspond to a particular function/ job. C. May connect gene to a segment of DNA that provides information for
constructing proteins OR describe a gene as a nucleotide sequence OR specific location on chromosomes.
D. May connect gene across multiple levels of organization (i.e. DNA & proteins (molecular) TO chromosomes & alleles OR interactions across different genes
E. All must be correct, but general in nature & shows a coherent thought process.
4 A. Connect gene to a segment of DNA that provides information for constructing proteins OR describe a gene as a nucleotide sequence OR specific location on chromosomes
B. Proteins, not genes, correspond to a particular trait - the phenotype. C. May connect gene across multiple levels of organization (i.e. DNA &
proteins (molecular) TO chromosomes & alleles OR interactions across

161
different genes D. May also mention that genes can control the expression of other genes E. Show coherent thought processes with details.
5 A. Connect gene to a segment of DNA that provides information for constructing proteins OR describe a gene as a nucleotide sequence OR specific location on chromosomes
B. Proteins, not genes, correspond to a particular trait - the phenotype. C. Connect gene across multiple levels of organization (i.e. DNA & proteins
(molecular) TO chromosomes & alleles (organism). OR interactions across different genes
D. May also mention that genes can control the expression of other genes E. Response is reasoned and shows coherent thought processes with
supporting details. 9a. Why is double-stranded DNA not a good catalyst? (Adapted from Klymkowsky,
Underwood & Garvin-Doxas, 2010). [ ] A. It is stable and does not bind to other molecules. [X] B. It isn't very flexible and can't fold into different shapes. [ ] C. It easily binds to other molecules. [ ] D. It is located in the nucleus.
9b. In at least 2-3 complete sentences, explain why you chose your answer or why you rejected other answers. My reason for answer 9 above:
10a. How might mutations in the DNA sequence be creative? (Adapted from Klymkowsky,
Underwood & Garvin-Doxas, 2010). [ ] A. It could not be; all naturally occurring mutations are destructive.
[ ] B. If the mutation inactivated a gene that was harmful. [X] C. If the mutation altered the activity of a gene product. [ ] D. If the mutation had no effect on the activity of the gene product.
10b. In at least 2-3 complete sentences, explain why you chose your answer or why you rejected other answers. My reason for answer 10 above:
Level of Knowledge
10b: Scoring Criteria
0 Insufficient information to make evaluation; no response; “I guessed”/”I don’t know”/ “I learned it in class”; answer is illegible.
1 A. Explains mutations incorrectly (generally) a. may not mention random changes/reading errors in the nucleotide
sequence during DNA replication b. may not mention errors in nucleotide sequence can be passed on
to next generation. B. May state mutations can lead to changes in the gene product (amino acid
sequence) or cell function a. do not recognize that mutations can be beneficial, destructive or
silent b. do not recognize alterations change protein functions.
C. All information incorrect, OR too vague to interpret 2 A. Generally explains mutations:
a. random changes/reading errors in the nucleotide or gene
162
sequence during DNA replication b. may mention errors in nucleotide or gene sequence can be passed
on to next generation. B. May state mutations can lead to changes in the gene product (amino acid
sequence) or cell function a. May recognize that mutations can be beneficial, destructive or
silent b. alter how the protein currently functions.
i. may state creates reduced or enhanced activity. ii. may mention changes in protein shape/structure
C. Some information incorrect, OR incomplete understanding/description. Could just state factual fragments; Makes a general statement without explanation/reasoning. Does not restate answer
3 A. Generally explains mutations: a. random changes/reading errors in the nucleotide sequence during
DNA replication b. may mention errors in nucleotide sequence can be passed on to
next generation. B. State mutations can lead to changes in the gene product (amino acid
sequence) or cell function a. May recognize that mutations can be beneficial, destructive or
silent b. alter how the protein currently functions.
i. may state creates reduced or enhanced activity. ii. may mention changes in protein shape/structure
C. All must be correct, but general in nature & shows a coherent thought process.
4 A. Explain mutations: a. random changes/reading errors in the nucleotide sequence during
DNA replication b. errors in nucleotide sequence passed on to next generation.
B. Mutations can lead to changes in amino acid sequence of the protein. a. May recognize that mutations can be beneficial, destructive or
silent b. alter how the protein currently functions.
i. may state creates reduced or enhanced activity. ii. may mention changes in protein shape/structure
C. Show coherent thought processes with details. D. May describe Evolutionary changes, such as fitness or changes in alleles.
5 A. Explain mutations: a. random changes/reading errors in the nucleotide sequence during
DNA replication b. errors in nucleotide sequence passed on to next generation.
B. Mutations can lead to changes in amino acid sequence of the protein. a. recognize that mutations can be beneficial, destructive or silent b. alter how the protein currently functions.
i. creates reduced or enhanced activity. ii. may mention changes in protein shape/structure
C. May describe Evolutionary changes, such as fitness or changes in alleles.

163
11a. A mutation leads to a dominant trait; what can you conclude about the mutation’s effect? (Adapted from Klymkowsky, Underwood & Garvin-Doxas, 2010).
[ ] A. It results in an overactive gene product. [ ] B. It results in a normal gene product that accumulates in higher levels than normal. [ ] C. It results in a gene product with a new function. [X] D. It depends upon the nature of the gene product and the mutation. 11b. In at least 2-3 complete sentences, explain why you chose your answer or why you rejected
other answer. My reason for answer 11:
Level of Knowledge
11b: Scoring Criteria
0 Insufficient information to make evaluation; no response; “I guessed”/”I don’t know”/ “I learned it in class”; answer is illegible.
1 A. May vaguely/incorrectly state 2B. or 2C., OR supporting detail(s) of 2B. or 2C.
B. All information incorrect, OR too vague to interpret a. Can be correct but does not answer question
2 A. May state 2B. or 2C., OR supporting detail(s) of 2B. or 2C. B. Generally define dominance: when dominant allele is present, the
dominant phenotypic traits will appear a. May mention: does not mean beneficial or detrimental; OR
dominance does not mean “better” than recessive. b. May mention: do not “repress” recessive phenotypic traits
C. Generally describe the nature of mutations a. May Identify/differentiate between phenotype and genotype b. May mention patterns of inheritance for a trait
D. May recognize Interaction between dominance and benefits a. changes in trait frequency within population
E. Some information incorrect, OR incomplete understanding/description. Could just state factual fragments.
3 A. Generally define dominance in relation to the recessive phenotype, OR when dominant allele is present, the dominant phenotypic traits will appear
a. May also mention: does not mean beneficial or detrimental; OR dominance does not mean “better” than recessive.
b. May also mention: do not “repress” recessive phenotypic traits B. Generally describe the nature of mutations
a. May also Identify/differentiate between phenotype and genotype b. May also mention patterns of inheritance for a trait
C. May recognize Interaction between dominance and benefits a. changes in trait frequency within population
D. All must be correct, but general in nature & shows a coherent thought process
4 A. Recognize dominance in relation to the recessive phenotype, OR when dominant allele is present, the dominant phenotypic traits will appear.
a. does not mean beneficial or detrimental; OR dominance does not mean “better” than recessive.
b. May mention: do not “repress” recessive phenotypic traits B. Generally describe the nature of mutations
a. Identify/differentiate between phenotype and genotype

164
b. mention patterns of inheritance for a trait C. May recognize Interaction between dominance and benefits
a. changes in trait frequency within population D. Show coherent thought processes with details.
5 A. Recognize dominance in relation to the recessive phenotype, OR when dominant allele is present, the dominant phenotypic traits will appear
a. does not mean beneficial or detrimental; OR dominance does not mean “better” than recessive.
b. do not “repress” recessive phenotypic traits B. Generally describe the nature of mutations
a. Identify/differentiate between phenotype and genotype b. mention patterns of inheritance for a trait
C. Interaction between dominance and benefits a. changes in trait frequency within population
D. Show coherent thought processes with supporting details. (sickle-cell). 13. Would you be willing to talk with Justin LeVaughn about this survey?
[ ] A. Yes [ ] B. No
Demographic Information: Questions 14 - 23 below ask about basic information used to determine eligibility for participation in this study, as well as your background in science. Please answer questions honestly and accurately. 14. Are you at least 18 years of age?
[ ] A. Yes [ ] B. No
15. Do you identify as: [ ] A. Male [ ] B. Female [ ] C. Other: _____________________________
16. What ethnicity do you identify with? :__________________________ 17. What is the level of your undergraduate education?
[ ] A. Freshmen [ ] B. Sophomore [ ] C. Junior [ ] D. Senior
18. What is your current Major? Write your response in the space below. 19. Have you taken BIO148 at UK before? [ ] A. Yes [ ] B. No [ ] C. I am currently taking BIO148 this semester. 20. Have you previously taken BIO155 at UK before? [ ] A. Yes [ ] B. No

165
21. What high school level science courses have you taken (e.g. biology, environmental science, chemistry, etc.)? Write your response in the space below.
22. What college level science courses have you taken (e.g. biology, environmental science,
chemistry, etc.)? Write your response in the space below. 23. What outside class experiences you have had relating to biology (e.g. work-study, student
research, previous jobs, etc.)? Write your response in the space below.

166
REFERENCES
American Association for the Advancement of Science. (2011). Vision and change in
undergraduate biology education a call to action. Washington, DC: Author.
Bahar, M., Johnstone, A.H., & Sutcliffe, R.G. (1999). Investigation of students' cognitive
structure in elementary genetics through word association tests. Journal of Biological
Education, 33(3), 134-141.
Bretz, S. L. and Linenberger, K. J. (2012), Development of the enzyme–substrate
interactions concept inventory. Biochem. Mol. Biol. Educ., 40: 229–233.
doi: 10.1002/bmb.20622
Bowling, B.V., Acra, E.E., Wang, L., Myers, M.F., Dean, G.E., Markle, G.C., . . . Huether, C.A.
(2008). Development and evaluation of a genetics literacy assessment instrument for
undergraduates. Genetics, 178(1), 15-22. doi: 10.1534/genetics.107.079533
Bowling, B.V., Huether, C.A., Wang, L., Myers, M.F., Markle, G.C., Dean, G.E., . . . Jacob,
G.A. (2008). Genetic literacy of undergraduate non-science majors and the impact of
introductory biology and genetics courses. Bioscience, 58(7), 654-660.
Chi, M.T.H. (2008). Three types of conceptual change: Belief revision, mental model
transformation, and categorical shift. In S.Vosniadou (Ed.), Handbook of research on
conceptual change (pp. 61-82). Hillsdale, NJ: Erlbaum
Coley, J.D., & Tanner, K.D. (2012). Common origins of diverse misconceptions: Cognitive
principles and the development of biology thinking. CBE Life Science Education, 11(3),
209-215. doi: 10.1187/cbe.12-06-0074

167
diSessa, A. (1993). Toward an epistemology of physics. Cognition and instruction.
10(2/3). 105-225.
Driver, R. (1994). Making sense of secondary science: Research into children's ideas.
London: Routledge.
Donovan and Bransford (2005). How people learn: Brain, mind, experience, and school:
Expanded edition (pp. 31 – 78). (2000). Washington, DC: National Academy Press.
Duncan, R.G., & Reiser, B.J. (2007). Reasoning across ontologically distinct levels: Students'
understandings of molecular genetics. Journal of Research in Science Teaching, 44(7),
938-959. doi: 10.1002/tea.20186
Fisher, K.M. (1985). A misconception in biology: Amino acids and translation. Journal of
Research in Science Teaching, 22(1), 53-62.
Flodin, V.S. (2007). The necessity of making visible concepts with multiple meanings in science
education: The use of the gene concept in a biology textbook. Science & Education,
18(1), 73-94. doi: 10.1007/s11191-007-9127-1
Gericke, N.M., & Hagberg, M. (2006). Definition of historical models of gene function and their
relation to students’ understanding of genetics. Science & Education, 16(7-8), 849-881.
doi: 10.1007/s11191-006-9064-4
Gericke, N.M., Hagberg, M., Santos, V.C., Joaquim, L.M., & El-Hani, C.N. (2012). Conceptual
variation or incoherence? Textbook discourse on genes in six countries. Science &
Education, 23(2), 381-416. doi: 10.1007/s11191-012-9499-8
Guzman, K., & Bartlett, J. (2012). Using simple manipulative to improve student comprehension
of a complex biological process. Biochem Mol Biol Educ, 40(5), 320-327. doi:
10.1002/bmb.20638
168
Jensen, J.L., Kummer, T.A., & Banjoko, A. (2013). Assessing the effects of prior conceptions on
learning gene expression. Journal of College Science Teaching, 42(4), 82-91.
Johnstone, A. H. (1991). Why is science difficult to learn? Things are seldom what they
seem. Journal of computer assisted learning, 7(2), 75-83.
Klymkowsky MW,Underwood SM,Garvin-Doxas K (2010). Biological Concepts
Instrument (BCI): a diagnostic tool for revealing student thinking.
arXiv:1012.4501v1.
Lewis, J., & Kattmann, U. (2004). Traits, genes, particles and information: Revisiting students’
understandings of genetics. International Journal of Science Education, 26(2), 195-206.
doi: 10.1080/0950069032000072782
Lewis, J., Leach, J., & Wood-Robinson, C. (2000). All in the genes? - young people's
understanding of the nature of genes. Journal of Biological Education, 34(2), 74-79.
Longden, B. (1982). Genetics-are there inherent learning difficulties? Journal of Biological
Education, 16(2), 135-140.
Marbach-Ad, G. (2001). Attempting to break the code in student comprehension of genetics
concepts. Journal of Biological Education, 35(4), 183-189.
Marbach-Ad, G., & Stavy, R. (2000). Students' cellular and molecular explanations of genetic
phenomena. Journal of Biological Education, 34(4), 200-205.
Maskiewicz, A.C., & Lineback, J.E. (2013). Misconceptions are "so yesterday!". CBE Life Sci
Educ, 12(3), 352-356. doi: 10.1187/cbe.13-01-0014
Mintzes, J. J., Wandersee, J. H., & Novak, J. D. (Eds.). (2005). Teaching science for
understanding: A human constructivist view. Academic Press.
Mil, M.H.W., Boerwinkel, D.J., & Waarlo, A.J. (2011). Modelling molecular mechanisms: A

169
framework of scientific reasoning to construct molecular-level explanations for cellular
behavior. Science & Education, 22(1), 93-118. doi: 10.1007/s11191-011-9379-7
National Research Council. (1997). Science teaching reconsidered: A handbook (pp.27-32).
(1997). Washington, DC: National Academy Press,.
National Research Council. (2003). Bio2010: Transforming undergraduate education for future
research biologists. Washington, DC: National Academy Press.
Newman, D.L., Catavero, C.M., & Wright, L.K. (2012). Students fail to transfer knowledge of
chromosome structure to topics pertaining to cell division. CBE Life Sci Educ, 11(4),
425-436. doi: 10.1187/cbe.12-01-0003
Ozmen, H. (2004). Some student misconceptions in chemistry: A literature review of chemical
bonding. Journal of Science Education and Technology, 13(2), 147-159.
Pearson, H. (2006). What is a gene? Nature, 441, 398-401.
Redfield, R. J. (2012). “Why do we have to learn this stuff?”—a new genetics for 21st century
students. PLoS Biol, 10(7), e1001356.
Saka, A., Cerrah, L., Akdeniz, A.R., & Ayas, A. (2006). A cross-age study of the understanding
of three genetic concepts: How do they image the gene, DNA and chromosome? Journal
of Science Education and Technology, 15(2), 192-202. doi: 10.1007/s10956-006-9006-6
Santos, V.C., Joaquim, L.M., & El-Hani, C.N. (2011). Hybrid deterministic views about genes in
biology textbooks: A key problem in genetics teaching. Science & Education, 21(4), 543-
578. doi: 10.1007/s11191-011-9348-1
Shi, J., Wood, W.B., Martin, J.M., Guild, N.A., Vicens, Q., & Knight, J.K. (2010). A diagnostic
assessment for introductory molecular and cell biology. CBE Life Sci Educ, 9(4), 453-
461. doi: 10.1187/cbe.10-04-0055

170
Sijtsms, K., (2009). On the use, the misuse, and the very limited usefulness of chronbach’s alpha.
psychometrika, 74(1), 107 – 120.
Smith. J. P., diSessa. A. A. & Roschelle, .I. (1993). Misconceptions reconceived: A
constructivist analysis of knowledge in transition. The Journal of the Learning
Sciences. 3, 115-163.
Smith, M.K., Wood, W.B., & Knight, J.K. (2008). The genetics concept assessment: A new
concept inventory for gauging student understanding of genetics. CBE Life Sci Educ,
7(4), 422-430. doi: 10.1187/cbe.08-08-0045
Streiner, D. L., (2003). Starting at the beginning: An introduction to coefficient alpha and
internal consistency. Journal of personality assessment, 80(1), 99 – 103.
Tan, K. C. D., Goh, N. K., Chia, L. S. and Treagust, D. F. (2002), Development and
application of a two-tier multiple choice diagnostic instrument to assess high
school students' understanding of inorganic chemistry qualitative analysis. J. Res.
Sci. Teach., 39: 283–301. doi: 10.1002/tea.10023
Tanner, K.D., & Deborah, A. (2005). Approaches to biology teaching and learning-
understanding the wrong answers. Cell Biology Education, 4, 112-117. doi:
10.1187/cbe.05-02-0068
Templin, M.A., & Fetters, M.K. (2002). A working model of protein synthesis using LEGO
building blocks. The American Biology Teacher, 64(9), 673-678. doi: 10.1662/0002-
7685(2002)064[0673:awmops]2.0.co;2
Tsui, C.Y., & Treagust D.F (2010). Evaluating secondary students’ scientific reasoning in
genetics using two-tier diagnostic instrument. International Journal of Science
Education. 32(8), 1073 - 1098
171
Venville, G.J., & Treagust, D.F. (1998). Exploring conceptual change in genetics using a
multidimensional interpretive framework. Journal of Research in Science Teaching,
35(9), 1031-1055.
Vosniadou, S. Vamvakoussi, X., & Skopeliti I. (Ed.). (2010).1 International handbook of
research on conceptual change. Routledge. (pp. 3 – 33)
Wilson, C.D., Anderson, C.W., Heidemann, M., Merrill, J.E., Merritt, B.W., Richmond, G.,
Parker, J.M. (2006). Assessing students' ability to trace matter in dynamic systems in cell
biology. CBE Life Sci Educ, 5(4), 323-331. doi: 10.1187/cbe.06-02-0142
Woodin, T., Carter, V.C., & Fletcher, L. (2010). Vision and change in biology undergraduate
education, a call for action--initial responses. CBE Life Sci Educ, 9(2), 71-73. doi:
10.1187/cbe.10-03-0044
Wright LK, Fisk JN, Newman DL. DNA to RNA: What Do Students Think the Arrow
Means? Campbell AM, ed. CBE Life Sciences Education. 2014;13(2):338-348.
doi:10.1187/cbe.CBE-13-09-0188.

172
VITA
Education University of Kentucky Graduate School: Non-Degree Post Baccalaureate (2011) Lexington, KY Biology (20.0 Credit hrs.)
University of Kentucky Biology Bachelor’s of Science (2008)
Lexington, KY Professional Positions Graduate Research Assistant: January 2015 – June 2016 University of Kentucky, Dept. of Stem Education – Lexington KY Council on Postsecondary Education Grant, PI: Rebecca Krall Ph.D. Teaching Assistant SEM328 – Teaching Science in Elementary School: August 2015 -May 2016 University of Kentucky, Dept. of Elementary Education, Lexington KY
Practicum Supervisor EDC322 – Elementary Practicum: August 2015 – Present University of Kentucky, Dept. of Elementary Education, Lexington KY Co-Instructor Adventures in Math and Science– Uncovering the Secret of GMOs: May 2015 Murray State University, Adventures in Math and Science, Murray KY Teaching Assistant BIO155 – Intro Biology I Lab: August 2013 – December 2014 University of Kentucky, Dept. of Biology, Lexington KY Teaching Assistant BIO315 – Introduction to Cell Biology: June 2014 – July 2014 University of Kentucky, Dept. of Biology – Lexington KY Instructional Laboratory Coordinator: December 2009 – August 2013 University of Kentucky, Dept. of Biology – Lexington KY Teaching Assistant BIO151/153 – Principles of Biology: August 2009 – December 2009 University of Kentucky, Dept. of Biology – Lexington KY
Research Assistant: November 2008 – August 2009 University of Kentucky, Graduate Center for Nutritional Sciences – Lexington KY Understanding Development of Diabetes and Obesity, PI: Jianhua Shao M.D., Ph.D.

173
Undergraduate Research Assistant: August 2006 – May 2007 University of Kentucky, Dept. of Biology – Lexington KY HoAP Structure/Function & Localization, PI: Rebecca Kellum Ph.D. Presentations Krall, R. M., LeVaughn J. M. & Kumar B. (2016) A Comparison of Three Teacher-
Created Project-based Investigations on Local Watersheds: Successes and Limitations. National Association for Research in Science Teaching. Baltimore, MD
LeVaughn, J. M. & Krall, R. M. (2015). Evaluation of Two-Tired Assessment on Gene
Expression for Undergraduates. Mid Atlantic Association for Science Teacher Education. Lore City, OH.
Krall, R. M., LeVaughn J. M. & Kumar B. (2015) Project-Based Investigations of Local
Watersheds: From Teacher Institute to Classroom Practice. Mid Atlantic Association for Science Teacher Education. Lore City, OH.
LeVaughn, J. M. (2007). HOAP structure/Function and Localization. Undergraduate
Research Showcase. University of Kentucky. Lexington, KY. Publications Toland, M. D., Love, A. M. A., & LeVaughn, J. (submitted). Structure coefficients,
standardized beta, and dividing by two standard deviations. The Social Science Journal.
Kinney, B. P., Qiao, L., LeVaugh, J. M., & Shao, J. (2010). B56a/Protein Phosphatase 2A
Inhibits Adipose Lipolysis in High-Fat Diet-Induced Obese Mice. Endocrinology, 151(8), 3624-3632.
Honors
Acknowledgment in BIO155 Laboratory Manual; Assistance in course development (2014)
Justin LeVaughn
4/28/2016

174