what's in a crowd? analysis of face-to-face behavioral ...barrat/jthbio271_166_2011.pdfwhat’s...
TRANSCRIPT

Journal of Theoretical Biology 271 (2011) 166–180
Contents lists available at ScienceDirect
Journal of Theoretical Biology
0022-51
doi:10.1
� Corr
Marseil
E-m
journal homepage: www.elsevier.com/locate/yjtbi
What’s in a crowd? Analysis of face-to-face behavioral networks
Lorenzo Isella a, Juliette Stehle b, Alain Barrat a,b,�, Ciro Cattuto a, Jean-Franc-ois Pinton c,Wouter Van den Broeck a
a Complex Networks and Systems Group, Institute for Scientific Interchange (ISI) Foundation, Turin, Italyb Centre de Physique Theorique, CNRS UMR 6207, Marseille, Francec Laboratoire de Physique de l’ENS Lyon, CNRS UMR 5672, Lyon, France
a r t i c l e i n f o
Article history:
Received 4 June 2010
Received in revised form
24 November 2010
Accepted 24 November 2010Available online 3 December 2010
Keywords:
Dynamic networks
Face-to-face proximity
Information spreading
Behavioral social networks
Complex networks
93/$ - see front matter & 2010 Elsevier Ltd. A
016/j.jtbi.2010.11.033
esponding author. Centre de Physique Th
le, France.
ail address: [email protected] (A. B
a b s t r a c t
The availability of new data sources on human mobility is opening new avenues for investigating the
interplay of social networks, human mobility and dynamical processes such as epidemic spreading. Here
we analyze data on the time-resolved face-to-face proximity of individuals in large-scale real-world
scenarios. We compare two settings with very different properties, a scientific conference and a long-
running museum exhibition. We track the behavioral networks of face-to-face proximity, and
characterize them from both a static and a dynamic point of view, exposing differences and similarities.
We use our data to investigate the dynamics of a susceptible–infected model for epidemic spreading that
unfolds on the dynamical networks of human proximity. The spreading patterns are markedly different
for the conference and the museum case, and they are strongly impacted by the causal structure of the
network data. A deeper study of the spreading paths shows that the mere knowledge of static aggregated
networks would lead to erroneous conclusions about the transmission paths on the dynamical networks.
& 2010 Elsevier Ltd. All rights reserved.
1. Introduction
Access to large data sets on human activities and interactionshas long been limited by the difficulty and cost of gathering suchinformation. Recently, the ever increasing availability of digitaltraces of human actions is widely enabling the representation andthe analysis of massive amounts of information on human beha-vior. The representation of this information in terms of complexnetworks (Anon, 2009; Dorogovtsev and Mendes, 2003; Newman,2003; Pastor-Satorras and Vespignani, 2004; Caldarelli, 2007;Barrat et al., 2008; Wasserman and Faust, 1994; Watts, 2007)has led to many research efforts because of the naturally inter-linked nature of these new data sources.
Tracing human behavior in a variety of contexts has becomepossible at very different spatial and temporal scales: frommobility of individuals inside a city (Chowell et al., 2003) andbetween cities (De Montis et al., 2007), to mobility and transporta-tion in an entire country (Brockmann et al., 2006), all the way toplanetary-scale travel (Barrat et al., 2004; Balcan et al., 2009).Mobile devices such as cell phones make it possible to investigatemobility patterns and their predictability (Gonzalez et al., 2008;Song et al., 2010). On-line interactions occurring between indivi-duals can be monitored by logging instant messaging or email
ll rights reserved.
eorique, CNRS UMR 6207,
arrat).
exchange (Eckmann et al., 2004; Kossinets and Watts, 2006; Golderet al., 2007; Leskovec and Horvitz, 2008; Rybski et al., 2009;Malmgren et al., 2009). Recent technological advances furthersupport mining real-world interactions by means of mobiledevices and wearable sensors, opening up new avenues forgathering data on human and social interactions. Bluetooth andWifi technologies give access to proximity patterns (Hui et al.,2005; Eagle and Pentland, 2006; O’Neill et al., 2006; Pentland,2008; Clauset and Eagle, 2007), and even face-to-face presence canbe resolved with high spatial and temporal resolution (http://www.sociopatterns.org; Cattuto et al., 2010; Alani et al., 2009; Vanden Broeck et al., 2010). The combination of these technologicaladvances and of heterogeneous data sources allow researchers togather longitudinal data that have been traditionally scarce insocial network analysis (Padgett and Ansell, 1993; Lubbers et al.,2010). A dynamical perspective on interaction networks paves theway to investigating interesting problems such as the interplay ofthe network dynamics with dynamical processes taking place onthese networks.
In this paper, we capitalize on recent efforts (http://www.sociopatterns.org; Cattuto et al., 2010; Alani et al., 2009; Vanden Broeck et al., 2010) that made possible to mine behavioralnetworks of face-to-face interactions between individuals in avariety of real-world settings and in a time-resolved fashion. Wepresent an in-depth analysis of the data we collected at two widelydifferent events. The first event was the INFECTIOUS exhibition(http://www.sciencegallery.com/infectious) held at the ScienceGallery in Dublin, Ireland, from April 17th to July 17th, 2009.

L. Isella et al. / Journal of Theoretical Biology 271 (2011) 166–180 167
The second event was the ACM Hypertext 2009 conference (http://www.ht2009.org/) hosted by the Institute for Scientific Inter-change Foundation in Turin, Italy, from June 29th to July 1st,2009. In the following, we will refer to these events as SG and HT09,respectively. Intuitively, interactions among conference partici-pants differ from interactions among museum visitors, and theconcerned individuals have very different goals in both settings.The study of the corresponding networks of proximity and inter-actions, both static and dynamic, reveals indeed strong differencesbut also interesting similarities. We take advantage of the avail-ability of time-resolved data to show how dynamical processes thatcan unfold on the close proximity network—such as the propaga-tion of a piece of information or the spreading of an infectiousagent—unfold in very different ways in the investigated settings. Inthe epidemiological literature, traditionally, processes of this kindhave been studied using either aggregated data or under assump-tions of stationarity for the interaction networks: here we leveragethe time-resolved nature of our data to assess the role of networkdynamics on the outcome of spreading processes. At a morefundamental level, simulating simple spreading processes overthe recorded interaction networks allows us to expose severalproperties of their dynamical structure as well as to probe theircausal structure.
The paper is organized as follows: first, we briefly describe thedata collection platform and our data sets in Section 2; in Section 3we discuss the salient features of the networks of interactionsaggregated on time windows of one day. These networks are staticobjects, carrying only information about the cumulative timethat—daily—each pair of individuals has spent in face-to-faceproximity. Section 4 analyzes the dynamical properties of face-to-face interactions between conference participants and museumvisitors. Section 5 further characterizes the aggregated networkstructures by investigating the effect of incremental link removal.Finally, Section 6 investigates the role played by causality ininformation spreading along the proximity network, and Section7 concludes the paper and defines a number of open questions.
2. Data
The data collection infrastructure uses active Radio-FrequencyIDentification (RFID) devices embedded in conference badges tomine face-to-face proximity relations of persons wearing the badges.RFID devices exchange ultra-low power radio packets in a peer-to-peer fashion, as described in http://www.sociopatterns.org,Cattuto et al. (2010), Alani et al. (2009), and Van den Broecket al. (2010). Exchange of radio packets between badges is onlypossible when two persons are at close range (1–1.5 m) and facingeach other, as the human body acts as a RF shield at the carrierfrequency used for communication. The operating parameters ofthe devices are programmed so that the face-to-face proximityof two individuals wearing the RFID tags can be assessed with aprobability in excess of 99% over an interval of 20 s, which is a fineenough time scale to resolve human mobility and proximity atsocial gatherings. False positives are exceedingly unlikely, as theultra-low power radio packets used for proximity sensing cannotpropagate farther than 1.5–2 m, and a sustained excess of packetsis needed in order to signal a proximity event. When a relation offace-to-face proximity (or ‘‘contact’’, as we will refer to it in thefollowing) is detected, the RFID devices report this information toreceivers installed in the environment (RFID readers). The readersare connected to a central computer system by means of a local areanetwork. Once a contact has been established, it is consideredongoing as long as the involved devices continue to exchange atleast one radio packet for every subsequent interval of 20 s.Conversely, a contact is considered terminated if an interval of
20 s elapses with no packets exchanged. For a detailed descriptionof the sensing platform and some of its deployments, see http://www.sociopatterns.org, Cattuto et al. (2010), Alani et al. (2009),and Van den Broeck et al. (2010).
The deployments at the Science Gallery in Dublin (http://www.sciencegallery.com/infectious) and at the HT09 conference in Turin(http://www.ht2009.org/) involved vastly different numbers ofindividuals and stretched along different time scales. The formerlasted for about three months and recorded the interactions ofmore than 14,000 visitors (more than 230,000 face-to-face contactsrecorded), whereas the latter took place over the course of threedays and involved about 100 conference participants (about 10,000contacts). Behaviors are also very different: in a museum, visitorstypically spend a limited amount of time on site, well below themaximum duration permitted by the museum opening hours, theyare not likely to return, and they follow a rather pre-defined path,touching different locations that host the exhibits. In a conferencesetting, on the other hand, most attendees stay on-site for the entireduration of the conference (a few days), and move at will betweendifferent areas such as conference room, areas for coffee breaks andso on. The coverage of the community was different in bothsettings. At the Science Gallery, visitors were equipped with aRFID tag upon entering the venue, as part of an interactive exhibit,and therefore almost the totality of them were tracked. On theother hand, at HT09, about 75% of the participants volunteeredto being tracked. This sampling may introduce some biases in theresults. Sampling issues are also commonly encountered in thestudy of static complex networks (Willinger et al., 2002; Petermannand De Los Rios, 2004; Clauset and Moore, 2005; Dall’Asta et al.,2005). Cattuto et al. (2010) have shown that for a broad variety ofreal-world deployments of the RFID proximity-sensing platformused in this study, the behavior of the statistical distributions ofquantities such as contact durations is not altered by unbiasedsampling of individuals. On the other hand, we cannot completelyrule out that a systematic bias is introduced by the selection ofvolunteers, if volunteers and non-volunteers have different beha-vioral patterns. Accurately checking this point would requiremonitoring an independent data source for face-to-face contacts,and because of scalability issues this would be feasible only forsmall control groups. Issues regarding the effect of missing data andincomplete sampling on the properties of dynamical processesunfolding on the networks also deserve attention and will be thesubject of future investigations.
3. The static interaction network
We start by analyzing aggregated networks of interactionobtained by aggregating the raw proximity data over one day.This aggregation yields a social graph where nodes representindividuals, and an edge is drawn between two nodes if at leastone contact was detected between those nodes during the intervalof aggregation. Therefore, every edge is naturally weighted by thetotal duration of the contact events that occurred between the tagsinvolved, i.e., by the total time during which the correspondingindividuals have been in face-to-face proximity.
The choice of daily time windows seems quite natural in oursettings. It would represent, for instance, a typical time scale for adescription of articulated social networks based on surveys, inwhich each participant would (ideally) declare who s/he hasencountered during the course of the day. Such a choice for theduration of the time-window, albeit natural, is by no means unique(Clauset and Eagle, 2007). For instance, it is possible to aggregatethe data over longer periods of time (weeks or months) toinvestigate the stationarity of the collected data (Cattuto et al.,2010). Shorter aggregation times of the order of a few minutes are

HT09: June 30th SG: July 14th
SG: May 19th SG: May 20th
Fig. 1. Daily aggregated networks in the HT09 and SG deployments. Nodes represent individuals and edges drawn between nodes if at least one contact event was detected
during the aggregation interval. Clockwise from top: aggregated network for one day of the HT09 conference, and for three representative days at the SG deployment. In each
case, the network diameter is highlighted. All the network visualizations in this study were produced using the igraph library (Csardi and Nepusz, 2006).
Fig. 2. Number of connected components (CCs) in the daily aggregated networks of
the SG deployment as a function of the number of visitors.
L. Isella et al. / Journal of Theoretical Biology 271 (2011) 166–180168
also useful, for instance, to resolve circadian activity patterns at thevenue under investigation.
Fig. 1 displays the aggregated contact networks for June 30th atthe HT09 conference (top left), and for three representative days forthe SG museum deployment. Despite the large variation in thenumber of daily museum visitors, ranging from about 60 to 400,the chosen days illustrate many features of the SG aggregatednetworks, in particular the presence of either a single or two largeconnected components (CC) in the network. Days with smallernumbers of visitors can also give rise to aggregated networks madeof a larger number of small isolated clusters. As shown in Fig. 2,depending on the number of visitors the number of CC can in factvary substantially. For a large number of visitors, typically only oneCC is observed. For a low number of visitors, on the other hand,many clusters are formed. Overall one also notices that the networkdiameter (highlighted in all the plots of Fig. 1) is considerablylonger for SG than for HT09 aggregated networks, reflecting thedifferent behavioral patterns in these settings.
The small-world nature—or lack thereof—of the aggregatednetworks can be investigated statistically by introducing a propernull model. To this end, we construct a randomized network usingthe rewiring procedure described by Maslov et al. (2004). Theprocedure consists in taking random pairs of links (i,j) and (l,m)involving four distinct nodes, and rewiring them as (i,m) and (j,l).This procedure preserves the degree of each node and the degreedistribution P(k), while destroying the degree correlations betweenneighboring nodes, as well as any other correlations linked to nodeproperties. The procedure is carried out so that initially distinct CCsdo not get merged. Since the rewiring procedure cannot beimplemented for the rare CCs with less than four nodes, thesesmall CCs are removed from the aggregated networks beforerewiring. Fig. 3 displays a single realization of the null model forthe networks in the top row of Fig. 1. We notice that the rewired
version of the aggregated HT09 network is very similar to theoriginal version, whereas the null model for the aggregatednetwork of the SG data on July 14th is more ‘‘compact’’ than theoriginal network and exhibits a much shorter diameter. Similarconsiderations hold for the other aggregated networks of the SGdeployment.
More quantitatively, we measure the mean number of nodesone can reach from a randomly chosen node by making l steps onthe network, a quantity hereafter called M(l). For a networkconsisting of a single connected component, the definition of

Fig. 4. Average number of nodes reachable from a randomly chosen node by making l steps on the network, M(l), divided by its saturation limit Mð1Þ, for daily aggregated
networks (circles) and their randomized versions (triangles). For the randomized case, data are averaged on 100 realizations. Left: network aggregated on June 30th for the
HT09 case. Right: SG deployment, July 14th. The solid lines are only guides for the eye.
Fig. 5. Degree distributions P(k) averaged over all daily aggregated networks, for the HT09 (left) and the SG (right) cases.
HT09: June 30th (rewired) SG: July 14th (rewired)
Fig. 3. Randomized versions of the daily aggregated networks in the top row of Fig. 1. Left: HT09 deployment, June 30th. Right: SG deployment, July 14th. The network
diameters are highlighted as in Fig. 1. In the SG case, the randomized network is much more ‘‘compact’’ than the original one, with a much shorter diameter.
L. Isella et al. / Journal of Theoretical Biology 271 (2011) 166–180 169
M(l) implies that
Mð1Þ ¼/kSþ1 and Mð1Þ ¼N, ð1Þ
where /kS is the average node degree, N is the total number ofnodes in the network and Mð1Þ the saturation value of M on thenetwork. The saturation value Mð1Þ is reached when l is equal tothe length of the network diameter, and may vary for differentrealizations of the random networks. For a network consisting ofseveral CCs one has to take into account the probability Ni/N thatthe chosen node belongs to a given CC, where Ni is the number of
nodes in the i-th CC. As a consequence, Eq. (1) generalizes to
Mð1Þ ¼1
N
XiNið/kSiþ1Þ and Mð1Þ ¼
1
N
XiN2
i , ð2Þ
where /kSi is the average node degree on the i-th CC. This ensuresthat the quantity MðlÞ=Mð1Þ, regardless on the number of CC,assumes the same value when l¼1, and saturates to unity for boththe aggregated and rewired network. Fig. 4 displays MðlÞ=Mð1Þ forthe aggregated networks on the top row of Fig. 1, as well as its valueaveraged on 100 randomized networks (the average value of M(l)

L. Isella et al. / Journal of Theoretical Biology 271 (2011) 166–180170
converges rapidly already when calculated on a few tens ofrandomized networks). We notice the striking similarity betweenthe results for the HT09 original and randomized networks, whereabout 90% of the individuals lie, in both cases, within two degrees ofseparation. In the SG case, conversely, the same 90% is reached withsix degrees of separation for the original network, but with onlythree degrees of separation on the corresponding randomizednetworks. The same calculation, performed on other aggregatedSG networks, yields qualitatively similar results, always exposing adramatic difference from the null model.
One of the standard observables used to characterize a networktopology is the degree distribution P(k), i.e., the probability that arandomly chosen node has k neighbors. Fig. 5 reports the degreedistributions of the daily aggregated networks, averaged over thewhole duration of the HT09 deployment (left) and SG deployment(right). For the SG case, we left out the few isolated nodes thatcontribute to the degree distribution for k¼0 only. The P(k)distributions are short-tailed in all cases: P(k) decreases exponen-tially in the SG case, and even faster for HT09. We notice that theHT09 degree distribution exhibits a peak at k around 15–20,pointing to a characteristic number of contacts established duringthe conference. Moreover, the average degree in the HT09 case,/kS, close to 20, is more than twice as high as that for the SGnetworks, /kS which is close to 8. This represents another clearindication of the behavioral difference of conference participantsversus museum visitors (the fact that the average degree is high forconference attendees can be regarded as a goal of the conference
Fig. 6. Visit duration distribution at the SG museum (histogram) and fit to a
lognormal distribution (red line). (For interpretation of the references to color in this
figure legend, the reader is referred to the web version of this article.)
12:00 t13:00 t14:00 t15:00 t16:00 t17:00 t18:00 t19:00 t
Fig. 7. Aggregated networks for two different days of the SG museum deployment. Nod
diameter is highlighted in each case.
itself). Finally, we observe that a large fraction of the recordedcontacts are sustained for a short time: for instance, removing allthe contacts with a cumulated duration below 1 min yields /kSabout 7.5 for HT09 and /kS about 3.5 for SG.
4. Temporal features
The availability of time-resolved data allows one to gain muchmore insight into the salient features of the social interactionstaking place during the deployments than what could be possibleby the only knowledge of ‘‘who has been in face-to-face proximityof whom’’.
We first investigated the presence duration distribution in bothsettings. For the conference case, the distribution is rather trivial, asit essentially counts the number of conference participants spend-ing one, two or three days at the conference. The visit durationdistribution for the museum, instead, can be fitted to a lognormaldistribution (see Fig. 6), with geometric mean around 35 min. Thisshows that, unlike the case of the conference, here one canmeaningfully introduce the concept of a characteristic visit dura-tion that turns out to be well below the cutoff imposed by museumopening hours. The existence of a characteristic visit duration shedslight on the elongated aspect of the aggregated networks of visitorinteractions (see Fig. 1). Indeed museum visitors are unlikely tointeract directly with other visitors entering the venue more than1 h after them, thus preventing the aggregated network fromexhibiting small-world properties. Fig. 7 reports the SG aggregatednetworks for two different days, where the network diameter ishighlighted and each node is colored according to the arrival timeof the corresponding visitor. One notices that, as expected from theaforementioned properties of the visit duration distribution, thereis limited interaction among visitors entering the museum atdifferent times. Furthermore, the network diameter clearly definesa path connecting visitors that enter the venue at subsequent times,mirroring the longitudinal dimension of the network. These find-ings show that aggregated network topology and longitudinal/temporal properties are deeply interwoven.
Let us now focus on the temporal properties of social interac-tions. At the most detailed level, each contact between twoindividuals is characterized by its duration. The correspondingdistributions are shown in Fig. 8. As noted before, in both the HT09and SG cases most of the recorded interactions amount to shortlysustained contacts lasting less than 1 min. However, both distribu-tions show broad tails—they decay only slightly faster than apower law. This behavior does not come as a surprise, as it has beenobserved in social sciences in a variety of context ranging fromhuman mobility to email or mobile phone calls networks (Eckmannet al., 2004; Hui et al., 2005; Cattuto et al., 2010; Oliveira andBarabasi, 2005). More interestingly, the distributions are very close(except in the noisy tail, due to the different number of contributing
o 13:00o 14:00o 15:00o 16:00o 17:00o 18:00o 19:00o 20:00
es are colored according to the corresponding visitor’s entry time slot. The network

L. Isella et al. / Journal of Theoretical Biology 271 (2011) 166–180 171
events), showing that the statistics of contact durations are robustacross two very different settings. This robustness has beenobserved by Cattuto et al. (2010) across different scientific
Fig. 10. Strength distributions P(s) in the HT09 (left) and SG (right) aggregated networks
interaction of the corresponding individual with other individuals.
Fig. 8. Distributions of the contact durations for the HT09 (triangles) and SG
(circles) deployments, averaged over all days. Despite the differences in the
measurement contexts, the distributions are superimposed.
Fig. 9. Weight distributions for the daily aggregated networks of one HT09
conference day (triangles) and for the SG aggregated networks (circles), averaged
over all daily aggregated networks. The weight of a link represents the total time
spent in face-to-face proximity by the two linked individuals during the aggregation
interval (here one day).
conferences, but the museum setting corresponds to a situationin which a flux of individuals follows a predefined path, and thisstrong similarity between distributions was therefore not expecteda priori. At a coarser level, aggregated networks are characterizedby weights on the links, that quantify for how long two individualshave been in face-to-face proximity during the aggregation inter-val. Fig. 9 displays the distributions of these weights w. Thesedistributions are very broad (Cattuto et al., 2010): while most linkscorrespond to very short contacts, some correspond to very longcumulated durations, and all time scales are represented, that is, nocharacteristic interaction timescale (except for obvious cutoffs) canbe determined. We note that at this coarser level of analysis thedistributions are again very similar.
For each individual, the cumulated time of interaction withother individuals is moreover given by the strength s of thecorresponding node (Barrat et al., 2004), i.e., by the sum of theweights of all links inciding on it. The strength distributions P(s) aredisplayed in Fig. 10 for the aggregated networks of the HT09conference (left) and of the SG museum case (right). Unlike k, thenode strength s spans several orders of magnitude, ranging from afew tens of seconds to well above 1 h. The node strength s can becorrelated with the node degree k by computing the averagestrength /sðkÞS of nodes of degree k (Barrat et al., 2004). Whilea completely random assignment of weights yields a lineardependency with /sðkÞS proportional to /wSk, where /wS isthe average link weight, super-linear or sub-linear behaviors havebeen observed in various contexts (Barrat et al., 2004; Cattuto et al.,2010; Onnela et al., 2007a). A super-linear dependence such as theone observed in some conference settings (Cattuto et al., 2010)hints at the presence of super-spreader nodes that play a promi-nent role in processes such as information diffusion (Pastor-Satorras and Vespignani, 2001; Anderson and May, 1992). Onthe other hand, the sub-linear dependence observed for large-scalephone call networks (Onnela et al., 2007a) corresponds to the factthat more active individuals spend on average less time in each call.Fig. 11 displays the ratio /sðkÞS=ð/wSkÞ for the SG and HT09 dailyaggregated networks. Two different trends appear despite the largefluctuations: a slightly increasing trend in the conference setting,and a clearly decreasing one in the museum setting. In particular,the behavior of /sðkÞS=ð/wSkÞ for the HT09 case (left plot inFig. 11) can be fitted linearly yielding a linear coefficient D¼ 0:01(p-value¼0.007). By reshuffling 4000 times the weights of thenetwork links and performing the same linear fit for each reshuf-fling, we obtain a distribution of linear coefficients D. Suchdistribution, whose mean is zero, is shown in the inset of the leftplot in Fig. 11 together with the value of D from the HT09 dailyaggregated networks (vertical line). The observed value of D at the
(data for all daily networks). The strength of a node quantifies the cumulated time of

Fig. 11. Correlation between node’s strength and degree, as measured by the average strength /sðkÞS of nodes of degree k. The figures show /sðkÞS=ð/wSkÞ (circles), for the
HT09 (left) and SG (right) deployments (the solid line is only a guide for the eye). The dashed lines stand for a linear fit and a power law fit to the data for the HT09 and SG
deployments, respectively. Distinct increasing and decreasing trends are respectively observed. The inset for the HT09 deployment shows a distribution of linear coefficientsDcalculated for 4000 reshufflings of the network weights and the fitted value from the data collected at HT09 (vertical line). The inset for the SG deployment shows
/sðkÞS=ð/wSkÞ on a doubly logarithmic scale (circles) together with the power law fit to the data (dashed line).
L. Isella et al. / Journal of Theoretical Biology 271 (2011) 166–180172
HT09 is an outlier of the distribution (96th percentile), thusshowing that the observed behavior of /sðkÞS=ð/wSkÞ can hardlyarise by a random assignment of link weights. On the other hand,the observed behavior of /sðkÞS=ð/wSkÞ at the SG can be fitted to apower law with a negative exponent i.e. it decreases linearly on adouble logarithmic scale such as the one shown in the inset ofthe right plot in Fig. 11. These results indicate that individualswho encountered the same number of distinct persons canhave different spreading potentials, depending on the setting. Italso gives a warning about characterizing spreading by onlymeasuring the number of encounters, which can yield a rathermisleading view.
5. Percolation analysis
The issue of network vulnerability to successive node removalhas attracted a lot of interest in recent years starting from thepioneering works of Albert et al. (2000) and Cohen et al. (2000), thathave shown how complex networks typically retain their integritywhen nodes are removed randomly, while they are very fragilewith respect to targeted removal of the most connected nodes.While the concepts of node failures and targeted attacks arepertinent for infrastructure networks, successive removals ofnodes or links is more generally a way to study network structures(Holme et al., 2002; Girvan and Newman, 2002; Radicchi et al.,2004; Dall’Asta et al., 2006). For instance, detecting efficientstrategies for dismantling the network sheds light on the networkcommunity structure, as it amounts to finding the links that act asbridges between different communities (Girvan and Newman,2002; Radicchi et al., 2004). Moreover, in the context of informationor disease spreading, the size of the largest connected componentgives an upper bound on the number of nodes affected by thespreading. Identifying ways to reduce this size, by removingparticular links, in order to break and disconnect the network asmuch as possible, is analogous in terms of disease spreading tofinding efficient intervention and containment strategies.
In order to test different link removal strategies, we considerdifferent definitions of weight for a link connecting nodes i and j inthe aggregated contact network:
�
1 As shown by Holme et al. (2002) and Dall’Asta et al. (2006) and verifiednumerically (not shown) for the present case, a procedure that does not update the
The simplest definition of link weight is given by the cumulatedcontact duration wij between i and j. In the following, we willrefer to this weight as ‘‘contact weight’’.
�
The topological overlap Oij, introduced by Onnela et al. (2007b),is defined asOij ¼nij
ðki�1Þþðkj�1Þ�nijA ½0,1�, ð3Þ
where ki(j) is the degree of node i(j) and nij measures the numberof neighbors shared by nodes i and j. This measure is reminiscentof the edge clustering coefficient (Radicchi et al., 2004), andevaluates the ratio of the number of triangles leaning upon the ij
edge with the maximum possible number of such trianglesgiven that i and j have degrees ki and kj, respectively. Edgesbetween different communities are expected to have a lownumber of common neighbors, hence a low value of Oij.
� Finally, the structural similarity of two nodes is defined as thecosine similarity
simij ¼
PlAVwilwjlffiffiffiffiffiffiffiffiffiffiffiffiffiffiffiffiffiffiffiffiffiffiffiffiffiP
lw2il
Plw
2jl
q A ½0,1�, ð4Þ
where V is the set of neighbors shared by nodes i and j, and thesums at the denominator are computed over all the neighbors ofi and j. Cosine similarity, which is one of the simplest similaritymeasures used in the field of information retrieval (Newmanet al., 2004; van Rijsbergen; Baeza-Yates and Ribeiro-Neto,1999), takes into account not only the number of sharedneighbors of i and j, but also the similarity of the correspondingedge strengths, i.e. the similarity of individuals in terms of thetime they spent with their neighbors. Once again, edgesconnecting different communities are expected to have a lowvalue of simij.
Based on these three weight definitions, we consider fourdifferent strategies for link removal, namely: removing the linksin increasing/decreasing order of contact weight, in increasingorder of topological overlap, and in increasing order of cosinesimilarity. The former two strategies are the simplest one candevise, as they do not consider the neighborhoods’ topology. Thelatter two strategies were implemented in an incremental fashion,by recomputing the lists of links ranked in order of increasingoverlap or cosine similarity whenever a link was removed, and thenremoving the links in the updated list order.1 An issue also arises

Fig. 12. Effect of four different ways of removing 60% of the links on the SG museum daily aggregated network of July 14th. Clockwise from top: links removed in decreasing
contact weight order, increasing contact weight order, increasing topological overlap order and increasing cosine similarity order. The largest CC is highlighted in each case.
L. Isella et al. / Journal of Theoretical Biology 271 (2011) 166–180 173
from the fact that all the generalized weights mentioned aboveproduce a certain amount of link degeneracy (in particular whenusing the contact weight): for instance, many links may have thesame (small) value wij, or exactly 0 overlap or similarity. Each linkremoval procedure carries therefore a certain ambiguity, and theresults may depend on which links, among those with the samecontact weight/overlap/similarity, are removed first.
The impact of link removal on network fragmentation can bemeasured by monitoring the variations of the size of the largest CC,hereafter called N1, as a function of link removal. If the network isinitially divided into two CCs, labeled C0
1 and C02 , of similar initial
sizes N01 ZN0
2, we call N1 the size of the largest CC surviving in thenetwork (which does not need to be a subnetwork of C0
1). We usedthe apex ‘‘0’’ to denote quantities expressed for the originalnetwork, before any link removal. In order to alleviate the problemsarising from link degeneracy, we averaged N1 on 100 different linkorderings (i.e. we reshuffled the list of links of equal generalizedweight before removing them).
An example of a single realization of the removal strategies forthe SG aggregated network of July 14th is shown in Fig. 12.We observe that a removal of 60% of the network links has a fardeeper impact on the network when the removal is based onthe topological overlap (the size of the largest CC is N1¼30) orcosine similarity (N1¼155) rather than on decreasing (increasing)contact weight (N1¼204 (205)). More quantitatively, Fig. 13 showsthat removing links according to their topological overlap isthe most efficient strategy. This is in agreement with previous
(footnote continued)
link ranking upon every link removal, based on the quantities (3) and (4), leads to
sub-optimal results. The deviation from the updating strategy becomes apparent
only when more than 20% of links have been removed since Oij and simij deal with
local quantities only. As a consequence, each link removal amounts to a local
perturbation of the network, contrary to what happens with non-local quantities
such as the betweenness centrality (Holme et al., 2002; Dall’Asta et al., 2006).
results (Holme et al., 2002; Girvan and Newman, 2002;Radicchi et al., 2004; Dall’Asta et al., 2006; Onnela et al., 2007b)that have shown that topological criteria detect efficiently the linksthat act as bridges between communities. Due to their highdegeneracy, removing first the links with small contact weightsapproximates a random removal strategy that is far from optimal.Despite this limitation, removing the links with small contactweights can outperform the removal of links with high contactweight since the latter are usually found within dense commu-nities, while links between communities have typically smallcontact weights.
The strategy based on link topological overlap proves slightlymore effective than the strategy based on link similarity: theinformation on the link contact weights incorporated in thedefinition of simij (Eq. (4)) does not enhance the decrease of N1.This can be explained through the following argument: topologicaloverlap link ranking usually leads to a higher degeneracy withrespect to similarity-based link ranking. As a consequence, for anetwork with similar values of N1
0 and N20, a strategy based on
topological overlap is more likely to dismantle in parallel both C01
and C02 than a similarity-based strategy, as it has no bias towards a
specific component. The opposite strategy of a complete disman-tling of C0
1 that leaves C02 intact would result in N1 ¼N0
2 even afterthe complete disintegration of C0
1 . This effect is illustrated in Fig. 13for the SG aggregated networks of May 19th–20th, which areindeed composed of two large CCs (see Fig. 1).
Interestingly, and as expected from the previous comparisons,rather different results are obtained for the HT09 and SG aggre-gated networks. The conference network is more resilient to allstrategies, and significant levels of disaggregation are reached onlyby removing large fractions (Z40260%) of the links, sorted bytheir topological overlap. For the SG aggregated networks, on theother hand, targeting links with small topological overlap or cosinesimilarity is a quite effective strategy, which can be intuitivelyrelated to the modular structure visible in Fig. 1.
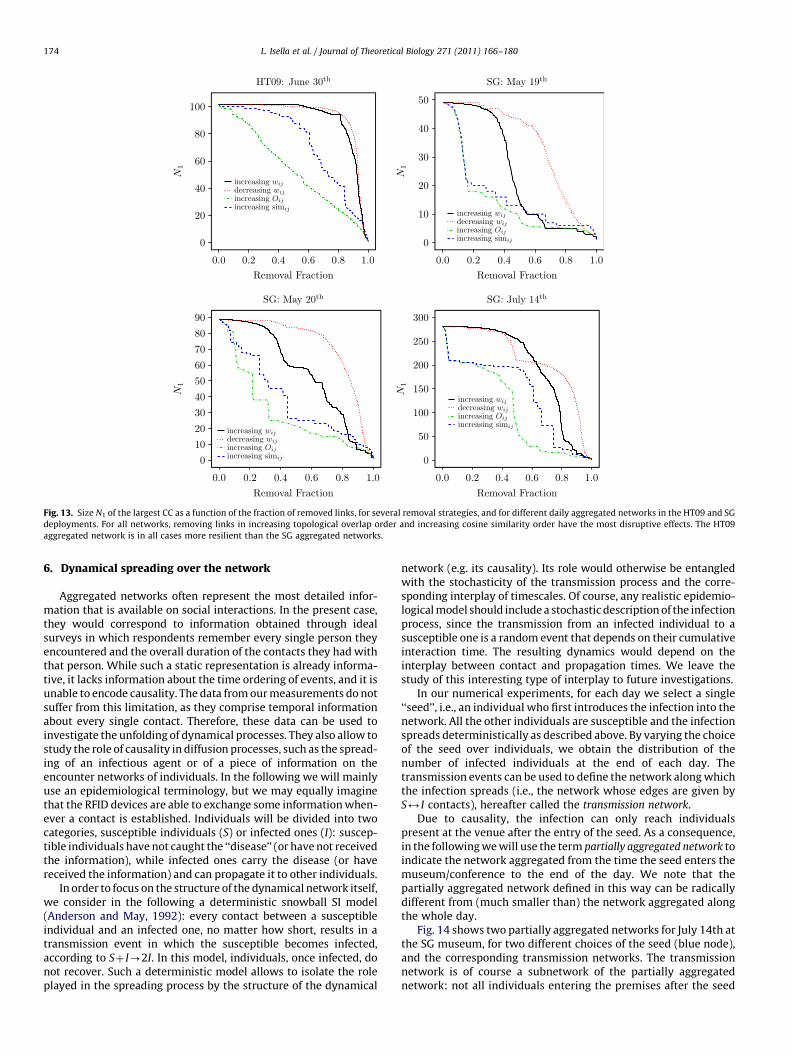
Fig. 13. Size N1 of the largest CC as a function of the fraction of removed links, for several removal strategies, and for different daily aggregated networks in the HT09 and SG
deployments. For all networks, removing links in increasing topological overlap order and increasing cosine similarity order have the most disruptive effects. The HT09
aggregated network is in all cases more resilient than the SG aggregated networks.
L. Isella et al. / Journal of Theoretical Biology 271 (2011) 166–180174
6. Dynamical spreading over the network
Aggregated networks often represent the most detailed infor-mation that is available on social interactions. In the present case,they would correspond to information obtained through idealsurveys in which respondents remember every single person theyencountered and the overall duration of the contacts they had withthat person. While such a static representation is already informa-tive, it lacks information about the time ordering of events, and it isunable to encode causality. The data from our measurements do notsuffer from this limitation, as they comprise temporal informationabout every single contact. Therefore, these data can be used toinvestigate the unfolding of dynamical processes. They also allow tostudy the role of causality in diffusion processes, such as the spread-ing of an infectious agent or of a piece of information on theencounter networks of individuals. In the following we will mainlyuse an epidemiological terminology, but we may equally imaginethat the RFID devices are able to exchange some information when-ever a contact is established. Individuals will be divided into twocategories, susceptible individuals (S) or infected ones (I): suscep-tible individuals have not caught the ‘‘disease’’ (or have not receivedthe information), while infected ones carry the disease (or havereceived the information) and can propagate it to other individuals.
In order to focus on the structure of the dynamical network itself,we consider in the following a deterministic snowball SI model(Anderson and May, 1992): every contact between a susceptibleindividual and an infected one, no matter how short, results in atransmission event in which the susceptible becomes infected,according to Sþ I-2I. In this model, individuals, once infected, donot recover. Such a deterministic model allows to isolate the roleplayed in the spreading process by the structure of the dynamical
network (e.g. its causality). Its role would otherwise be entangledwith the stochasticity of the transmission process and the corre-sponding interplay of timescales. Of course, any realistic epidemio-logical model should include a stochastic description of the infectionprocess, since the transmission from an infected individual to asusceptible one is a random event that depends on their cumulativeinteraction time. The resulting dynamics would depend on theinterplay between contact and propagation times. We leave thestudy of this interesting type of interplay to future investigations.
In our numerical experiments, for each day we select a single‘‘seed’’, i.e., an individual who first introduces the infection into thenetwork. All the other individuals are susceptible and the infectionspreads deterministically as described above. By varying the choiceof the seed over individuals, we obtain the distribution of thenumber of infected individuals at the end of each day. Thetransmission events can be used to define the network along whichthe infection spreads (i.e., the network whose edges are given byS2I contacts), hereafter called the transmission network.
Due to causality, the infection can only reach individualspresent at the venue after the entry of the seed. As a consequence,in the following we will use the term partially aggregated network toindicate the network aggregated from the time the seed enters themuseum/conference to the end of the day. We note that thepartially aggregated network defined in this way can be radicallydifferent from (much smaller than) the network aggregated alongthe whole day.
Fig. 14 shows two partially aggregated networks for July 14th atthe SG museum, for two different choices of the seed (blue node),and the corresponding transmission networks. The transmissionnetwork is of course a subnetwork of the partially aggregatednetwork: not all individuals entering the premises after the seed

Fig. 14. Partially aggregated networks on July 14th at the SG museum, for two different choices of the seed (blue node at the bottom). Transparent nodes and light gray edges
represent individuals not infected and contacts not spreading the infection, respectively. Red nodes and dark gray links represent infected individuals and contacts spreading
the infection, respectively. The diameter of the transmission network and of the partially aggregated networks are shown respectively with blue and orange links. The black
node represents the last infected individual. (For interpretation of the references to color in this figure legend, the reader is referred to the web version of this article.)
Fig. 15. Distribution of the path lengths nd from the seed to all the infected individuals calculated over the transmission network (circles) and the partially aggregated
networks (triangles). The distributions are computed, for each day, by varying the choice of the seed over all individuals.
L. Isella et al. / Journal of Theoretical Biology 271 (2011) 166–180 175
can be reached from the seed by a causal path, and not all links areused for transmission events. In order to emphasize the branchingnature of infection spreading, we represent the transmissionnetwork with successively infected nodes arranged from thebottom to the top of the figure. We notice that the diameter ofboth the transmission and the partially aggregated network maynot include the seed and/or the last infected individual.
The presence of a few triangles in the transmission network isdue to the finite time resolution of the measurements. Let usconsider, for instance, the case of an infected visitor A who infects B,followed by a simultaneous contact of A and B with the susceptible
C. In this case it is impossible to attribute the infection of C to eitherA or B, and both the C2A and the C2B links are highlighted inthe transmission network as admissible transmission events. As aconsequence, we slightly overestimate the number of links in thetransmission network of Fig. 14. In the case of Fig. 14, the number oflinks is between 1% and 8% larger than for a tree with the samenumber of nodes. At finer time resolutions, some of the diffusionpaths of Fig. 14 would actually be forbidden by causality.
A general feature exemplified by Fig. 14 is that the diameter ofthe transmission network (blue path) is longer than the diameterof the partially aggregated network (orange path), a first signature

L. Isella et al. / Journal of Theoretical Biology 271 (2011) 166–180176
of the fact that the fastest paths between two individuals, whichare the ones followed by the spreading process, do not coincidewith the shortest path over the partially aggregated network(Kossinets et al., 2008).
The difference between the fastest and the shortest paths for aspreading process can be quantitatively investigated. Fig. 15 reportsthe distribution of the network distances nd between the seed andevery other infected individual along both the transmission networksand the aggregated networks. When calculated on the partiallyaggregated network, nd measures the length of the shortest seed-to-infected-individual path, whereas it yields the length of the fastest
seed-to-infected-individual path when calculated on the transmis-sion network. We observe that the length distribution of fastestpaths, i.e., the P(nd) distribution for the transmission network, alwaysturns out to be broader and shifted towards higher values of nd
than the corresponding shortest path distribution, i.e., P(nd) for thepartially aggregated network. The difference is particularly notice-able in the case of May 20th and July 14th for the SG deployment, andJune 30th for the HT09 conference, where the longest paths on thetransmission network are about twice as long as the longest pathsalong the partially aggregated network.
These results clearly underline that in order to understandrealistic dynamical processes on contact networks, informationabout the time ordering of the contact events turns out to beessential: the information carried by the aggregated network maylead to erroneous conclusions on the spreading paths.
It is also possible to study the length of the path connecting thefirst (seed) to the last infected individual along the transmissionnetwork. We measure the fastest seed-to-last-infected-individualpath (a quantity hereafter called ‘‘transmission nd’’) as a function ofthe duration of the spreading process, defined as the time between
Fig. 16. Scatterplot of the seed-to-last-infected-individual distance (transmission nd) alon
from the entry of the seed to the last infection event).
the entry of the seed and the last transmission event. As shown byFig. 16, a clear correlation is observed between the transmission nd
and the duration of the spreading process for the SG case (Pearsoncoefficients 0.76 for May 20th and May 19th, and 0.9 for July 14th). Nosignificant correlation is instead observed for the HT09 conference.This highlights the importance of the longitudinal dimension in theSG data, and gives a first indication of the strong differences in thespreading patterns, that we further explore in the following.
Let us now consider some other quantitative properties of thespreading process, in particular the number of individuals reachedby the infection/information at the end of one day. In the SG caseFig. 17 shows the distributions for each day, as boxplots, displayingthe median together with the 5th, 25th, 75th and 95th percentiles.Days are arranged horizontally from left to right, in increasingnumber of visitors. A high degree of heterogeneity is visible. Theblue line corresponds to the number of daily visitors, that is themaximum number of individuals who can potentially be infected.We observe that the number of infected individuals is usually wellbelow this limit. The number of reached individuals also dependson the number of CC in the aggregated network, as the spreadingprocess cannot propagate from one CC to another. In fact, the limitfor which all visitors are infected can be reached only if theaggregated network is globally connected, that occurs only whenthe global number of visitors is large enough. These results hint atthe high intrinsic variability of the final outcome of an epidemic-like process in a situation where individuals stream through abuilding. A totally different picture emerges for the HT09 con-ference, where the infection is almost always able to reach all theparticipants.
As mentioned previously, the spreading process cannot reachindividuals who have left the venue before the seed enters, or the
g the transmission network, versus the total duration of the epidemics (time interval

Fig. 17. Results of spreading dynamics in the SG data: the figure shows panel boxplots of the final number of infected individuals in one day, versus the number of visitors in
that day. The blue line represents the total number of daily visitors, giving an upper bound for the number of infected. The bottom and top of the rectangular boxes correspond
to the 25th and 75th quantile of the distribution of infected individuals at the end of each day, and the red lines correspond to the median (50th quantile). The 5th and 95th are
also shown (black horizontal lines). (For interpretation of the references to color in this figure legend, the reader is referred to the web version of this article.)
L. Isella et al. / Journal of Theoretical Biology 271 (2011) 166–180 177
individuals who belong to a CC different from that of the seed.Therefore, we consider the ratio of the final number of infectedindividuals, Ninf to the number Nsus of individuals who can bepotentially reached through causal transmission paths starting atthe seed. The distributions of this ratio is reported in Fig. 18. Weobserve that in the case of HT09 (left) almost all the potentiallyinfected individuals will be infected by the end of the day, whereasthe distribution of Ninf=Nsus is broader in the SG case (right). Wenotice that a static network description would inevitably lead to allindividuals in the seed’s CC catching the infection, a fact that can bea severe (and misleading) approximation of reality.
For each day the chosen seed generates a deterministic spread-ing process for which we can compute the cumulative number ofinfected individuals as a function of time, a quantity hereafterreferred to as an incidence curve. Fig. 19 shows the results for aselected day of the HT09 conference and for three different days ofthe SG data.
In the case of the HT09 conference, the earliest possible seedsare the conference organizers, but little happens until conference
participants gather for the coffee break and/or meet up at the end ofthe first talk, between 10:00 and 11:00. A strong increase in thenumber of infected individuals is then observed, and a secondstrong increase occurs during the lunch break. Due to the con-centration in time of transmission events, spreading processesreach very similar (and high) incidence levels after a few hours,regardless of the initial seed or its arriving time. Even processesstarted after 15:00 can reach about 80% of the conference parti-cipants. Thus, the crucial point for the spreading process does notconsist in knowing where and when the epidemic trajectory hasstarted, but whether the seed or any other subsequently infectedindividual attend the coffee break or not.
A different picture is obtained in the SG case: First, in order toreach almost all participants the epidemics must spread on aglobally connected network and start early (black curves for July14th data). Even in such a favorable setting for spreading, theincidence curves do not present sharp gradients, and later epi-demics are unable to infect a large fraction of daily visitors.The incidence curves for May 19th and 20th of Fig. 19 show that

Fig. 19. Incidence curves, giving the number of infected versus time for a spreading phenomenon simulated in the HT09 and SG data. Clockwise from top: HT09, June 30th
(aggregated network consisting of a single CC with N1¼102 individuals); SG network for July 14th (one CC, N1¼282 individuals), May 19th (two CCs, N1¼N2¼49 individuals)
and May 20th (two CCs, N1¼N2¼89 individuals). Each curve corresponds to a different seed, and is color-coded according to the starting time of the spreading.
Fig. 18. Distribution of the ratio Ninf=Nsus for the HT09 (left) and the SG (right) data, averaged over all potential seeds. Ninf is the final number of infected individual at the end of
one day, while Nsus is the number of individuals that could potentially be reached by a causal transmission path starting at the seed. Nsus is given by the number of individuals
visiting the premises in the same day, from the time the seed enters the premises, and belonging to the same CC as the seed.
L. Isella et al. / Journal of Theoretical Biology 271 (2011) 166–180178
different scenarios can also occur: due to the fragmented nature ofthe network, the final fraction of infected individuals can fluctuategreatly, and sharp increases of the incidence can be observed whendense groups such as those visible in Fig. 1 are reached.
7. Conclusions
In this paper we have shown that the analysis of time-resolvednetwork data can unveil interesting properties of behavioral
networks of face-to-face interaction between individuals. Weconsidered data collected in two very different settings, represen-tative of two types of social gatherings: the HT09 conference is a‘‘closed’’ systems in which a group of individuals gathers andinteracts in a repeated fashion, while the SG museum deploymentis an ‘‘open’’ environment with a flux of individuals streamingthrough the premises.
We took advantage of the accurate time-resolved nature of ourdata sources to build dynamically evolving behavioral networks.We analyzed aggregated networks, constructed by aggregating the

L. Isella et al. / Journal of Theoretical Biology 271 (2011) 166–180 179
face-to-face interactions during time intervals of one day, andprovided a comparison of their properties in both settings. Weassessed the role of network dynamics on the outcome of dyna-mical processes such as spreading processes of informations or ofan infectious agent.
Our analysis shows that the behavioral networks of individualsin conferences and in a museum setting exhibit both similaritiesand important differences. The topologies of the aggregated net-works are widely different: the conference networks are ratherdense small-worlds, while the SG networks have a larger diameterand are possibly made of several connected components—they donot form small-worlds, and their ‘‘elongated’’ shape can be put inrelation with the fact that individuals enter the premises atdifferent times and remain there only for a limited amount oftime. The networks’ differences are also unveiled by a percolationanalysis, which reveals how the SG aggregated networks can easilybe dismantled by removing links that act as ‘‘bridges’’ betweengroups of individuals; on the contrary, aggregated networks at aconference are more ‘‘robust’’, even with respect to targeted linkremoval.
Interestingly, some important similarities are also observed: thedegree distributions of aggregated networks, for example, areshort-tailed in both cases. Moreover, despite the higher socialactivity at a conference, both the distribution of the contact eventdurations and the distribution of the total time spent in face-to-faceinteractions by two individuals are very similar.
The study of simple spreading processes unfolding on thedynamical networks of interaction between individuals allowedus to delve deeper into the time-resolved nature of our data.Comparison of the spreading dynamics on the time-dependentnetworks with the corresponding dynamics on the aggregatednetworks show that the latter easily yields erroneous conclusions.In particular, our results highlight the strong impact of causality inthe structure of transmission chains, that can differ significantlyfrom those obtained on a static network. The temporal properties ofthe contacts are crucial in determining the spreading patterns andtheir properties. Studies about the role of the initial seed and itsproperties on the spreading patterns, or the determination of themost crucial nodes for propagation, can be misleading if only thestatic aggregated network is considered. In more realisticdynamics, the fastest path is typically not the shortest path ofthe aggregated network, and the role of causality is clearly visible inthe analysis of the seed-to-last-infected paths.
Spreading phenomena unfold in very different ways in the twosettings we investigated: at a conference, people interact repeat-edly and with bursts of activity, so that transmission events alsooccur in a bursty fashion, and most individuals are reached at theend of the day; in a streaming situation, instead, the fraction ofreached individuals can be very small due to either the lack ofglobal connectivity or the late start of the spreading process.Detailed information on the temporal ordering of contacts istherefore crucial. We also note that in more realistic settings withnon-deterministic spreading, information about the duration ofcontacts, and not only their temporal ordering, would also turn outto be very relevant and lead to an interesting interplay between thecontact timescale and the propagation timescale (Stehle et al.,submitted for publication). Future work will also address the issueof sampling effects: the fact that not all the conference attendeesparticipated to the data collection may lead to an underestimationof spreading, since spreading paths between sampled attendeesinvolving unobserved persons may have existed, but are not takeninto account.
We close by stressing that as the data sources on person-to-person interactions become richer and ever more pervasive, thetask of analyzing networks of interactions is unavoidably shiftingaway from statics towards dynamics, and a pressing need is
building up for theoretical frameworks that can appropriately dealwith streamed graph data and large scales. At the same time, wehave shown that access to these data sources challenges a numberof assumptions and poses new questions on how well-knowndynamical processes unfold on dynamic graphs.
Acknowledgments
Data collections of the scale reported in this manuscript are onlypossible with the collaboration and support of many dedicatedindividuals. We gratefully thank the Science Gallery in Dublin forinspiring ideas and for hosting our deployment. Special thanks goto Michael John Gorman, Don Pohlman, Lynn Scarff, DerekWilliams, and all the staff members and facilitators who helpedto communicate the experiment and engage the public. We thankthe organizers of the ACM Hypertext 2009 conference andacknowledge the help of Ezio Borzani, Vittoria Colizza, DanielaPaolotti, Corrado Gioannini and the staff members of the ISIFoundation, as well as the help of several Hypertext 2009 volun-teers. We also thank Harith Alani, Martin Szomszor and GianlucaCorrendo of the Live Social Semantics team. We warmly thankBitmanufaktur and the OpenBeacon project, and acknowledgetechnical support from Milosch Meriac and Brita Meriac. Weacknowledge stimulating discussions with Alessandro Vespignaniand Vittoria Colizza. This study was partially supported by theFET-Open project DYNANETS (Grant no. 233847) funded by theEuropean Commission. Finally, we are grateful for the valuablefeedback, the patience and the support of the tens of thousands ofvolunteers who participated in the deployments.
References
Alani, H., Szomsor, M., Cattuto, C., Van den Broeck, W., Correndo, G., Barrat, A., 2009.Live social semantics. In: 8th International Semantic Web ConferenceISWC2009. Lecture Notes in Computer Science, vol. 5823, pp. 698–714./http://dx.doi.org/10.1007/978-3-642-04930-9_44S.
Albert, R., Jeong, H., Barabasi, A.-L., 2000. Error and attack tolerance of complexnetworks. Nature 406, 378–382.
Anderson, R.M., May, R.M., 1992. Infectious Diseases of Humans: Dynamics andControl. Oxford Science Publications, Oxford, UK.
Anon, 2009. Special issue of Science on complex networks and systems. Science 325,357–504.
Baeza-Yates, R., Ribeiro-Neto, B., 1999. Modern Information Retrieval. ACM Press/Addison-Wesley.
Balcan, D., Colizza, V., Gonc-alves, B., Hu, H., Ramasco, J.J., Vespignani, A., 2009.Multiscale mobility networks and the spatial spreading of infectious diseases.Proc. Natl. Acad. Sci. USA 106, 21484–21489.
Barrat, A., Barthelemy, M., Pastor-Satorras, R., Vespignani, A., 2004. The architectureof complex weighted networks. Proc. Natl. Acad. Sci. USA 101, 3747–3752.
Barrat, A., Barthelemy, M., Vespignani, A., 2008. Dynamical Processes on ComplexNetworks. Cambridge University Press, Cambridge.
Brockmann, D., Hufnagel, L., Geisel, T., 2006. The scaling laws of human travel.Nature 439, 462–465.
Caldarelli, G., 2007. Scale Free Networks. Oxford University Press, Oxford.Cattuto, C., Van den Broeck, W., Barrat, A., Colizza, V., Pinton, J.-F., Vespignani, A.,
2010. Dynamics of person-to-person interactions from distributed RFID sensornetworks. PLoS ONE 5 (7) e11596.
Chowell, G., Hyman, J.M., Eubank, S., Castillo-Chavez, C., 2003. Scaling laws forthe movement of people between locations in a large city. Phys. Rev. E 68,066102.
Clauset, A., Eagle, N., 2007. Persistence and periodicity in a dynamic proximitynetwork. In: DIMACS Workshop on Computational Methods for DynamicInteraction Networks.
Clauset, A., Moore, C., 2005. Accuracy and scaling phenomena in Internet mapping.Phys. Rev. Lett. 94, 018701.
Cohen, R., Erez, K., ben-Avraham, D., Havlin, S., 2000. Resilience of the Internet torandom breakdowns. Phys. Rev. Lett. 85, 4626–4628.
Csardi, G., Nepusz, T., 2006. The igraph software package for complex networkresearch. InterJ. Complex Syst., 1695.
Dall’Asta, L., Alvarez-Hamelin, I., Barrat, A., V�azquez, A., Vespignani, A., 2005.Statistical theory of Internet exploration. Phys. Rev. E 71, 036135.
Dall’Asta, L., Barrat, A., Barthelemy, M., Vespignani, A., 2006. Vulnerability ofweighted networks. J. Statist. Mech. P04006.

L. Isella et al. / Journal of Theoretical Biology 271 (2011) 166–180180
De Montis, A., Barthelemy, M., Chessa, A., Vespignani, A., 2007. The structure ofinter-urban traffic: a weighted network analysis. Environ. Plann. J. B 34,905–924.
Dorogovtsev, S.N., Mendes, J.F.F., 2003. Evolution of Networks: From Biological Netsto the Internet and WWW. Oxford University Press, Oxford.
Eagle, N., Pentland, A., 2006. Reality mining: sensing complex social systems. Pers.Ubiquitous Comput. 10, 255–268.
Eckmann, J.-P., Moses, E., Sergi, D., 2004. Entropy of dialogues creates coherentstructures in e-mail traffic. Proc. Natl. Acad. Sci. USA 101, 14333–14337.
Girvan, M., Newman, M.E.J., 2002. Community structure in social and biologicalnetworks. Proc. Natl. Acad. Sci. USA 99, 7821–7826.
Golder, S., Wilkinson, D., Huberman, B., 2007. Rhythms of social interaction:messaging within a massive online network, Communities and technologies2007. Proceedings of the Third Communities and Technologies Conference,Michigan State University.
Gonzalez, M.C., Hidalgo, C.A., Barabasi, A.-L., 2008. Understanding individual humanmobility patterns. Nature 453, 779–782.
Holme, P., Kim, B.J., Yoon, C.N., Han, S.K., 2002. Attack vulnerability of complexnetworks. Phys. Rev. E 65, 056109.
Hui, P., Chaintreau, A., Scott, J., Gass, R., Crowcroft, J., Diot, C., 2005. Pocket switchednetworks and human mobility in conference environments. In: Proceedings ofthe 2005 ACM SIGCOMM Workshop on Delay-tolerant Networking, Philadel-phia, Pennsylvania, USA, pp. 244–251.
Kossinets, G., Kleinberg, J., Watts, D., 2008. The structure of information pathways ina social communication network. In: Proceedings of the 14th ACM SIGKDDInternational Conference on Knowledge Discovery and Data Mining.
Kossinets, G., Watts, D., 2006. Empirical analysis of an evolving social network.Science 311, 88–90.
Leskovec, J., Horvitz, E., 2008. Planetary-scale views on a large instant-messagingnetwork. In: Proceeding of the 17th International Conference on World WideWeb, ACM, New York, NY, USA, pp. 915–924.
Lubbers, M.J., Molina, J.L., Lerner, J., Brandes, U., Avila, J., McCarty, C., 2010.Longitudinal analysis of personal networks. Soc. Networks 32, 91–104.
Malmgren, R.D., Stouffer, D.B., Campanharo, A.S.L.O., Nunes Amaral, L.A., 2009.On universality in human correspondence activity. Science 325, 1696–1700.
Maslov, S., Sneppen, K., Zaliznyak, A., 2004. Detection of topological patterns incomplex networks: correlation profile of the Internet. Physica A 333,529–540.
Newman, M.E.J., 2003. The structure and function of complex networks. SIAM Rev.45, 167–256.
Newman, E., Doran, W., Stokes, N., Carthy, J., Dunnion, J., 2004. Comparingredundancy removal techniques for multi-document summarisation. In: Pro-ceedings of STAIRS, pp. 223–228.
Oliveira, J.G., Barabasi, A.-L., 2005. Darwin and Einstein correspondence patterns.Nature 437, 1251.
O’Neill, E., Kostakos, V., Kindberg, T., Fatah gen Schieck, A., Penn, A., Stanton Fraser,D., Jones, T., 2006. Instrumenting the city: developing methods for observingand understanding the digital cityscape. In: Lecture Notes in Computer Science,vol. 4206, pp. 315–332.
Onnela, J.-P., Saramaki, J., Hyvonen, J., Szabo, G., Argollo de Menezes, M., Kaski, K.,Barabasi, A.-L., Kertesz, J., 2007a. Analysis of a large-scale weighted network ofone-to-one human communication. New J. Phys. 9, 179.
Onnela, J.P., Saramaki, J., Hyvonen, J., Szabo, G., Lazer, D., Kaski, K., Kertesz, J.,Barabasi, A.-L., 2007b. Structure and tie strengths in mobile communicationnetworks. Proc. Natl. Acad. Sci. USA 104, 7332–7336.
Padgett, J.F., Ansell, C.K., 1993. Robust action and the rise of the Medici. Am. J. Sociol.98, 1259–1319.
Pastor-Satorras, R., Vespignani, A., 2001. Epidemic spreading in scale-free networks.Phys. Rev. Lett. 86, 3200–3203.
Pastor-Satorras, R., Vespignani, A., 2004. Evolution and Structure of the Internet:A Statistical Physics Approach. Cambridge University Press, Cambridge.
Pentland, A., 2008. Honest Signals: How They Shape Our World. MIT Press,Cambridge, MA.
Petermann, T., De Los Rios, P., 2004. Exploration of scale-free networks: do wemeasure the real exponents? Eur. Phys. J. B 38, 201–204.
Radicchi, F., Castellano, C., Cecconi, F., Loreto, V., Parisi, D., 2004. Definingand identifying communities in networks. Proc. Natl. Acad. Sci. USA 101,2658–2663.
Rybski, D., Buldyrev, S.V., Havlin, S., Liljeros, F., Makse, H.A., 2009. Scaling laws ofhuman interaction activity. Proc. Natl. Acad. Sci. USA 106, 12640–12645.
Song, C., Qu, Z., Blumm, N., Barabasi, A.-L., 2010. Limits of predictability in humanmobility. Science 327, 1018–1021.
Stehle, J., Voirin, N., Barrat, A., Cattuto, C., Colizza, V., Isella, L., Regis, C., Pinton, J.-F.,Khanafer, N., Van den Broeck, W., Vanhems, P. Infectious disease spread on adata-driven dynamic contact network, submitted for publication.
Van den Broeck, W., Cattuto, C., Barrat, A., Szomsor, M., Correndo, G., Alani, H., 2010.The live social semantics application: a platform for integrating face-to-facepresence with on-line social networking. In: First International Workshop onCommunication, Collaboration and Social Networking in Pervasive ComputingEnvironments (PerCol 2010). Proceedings of the 8th Annual IEEE InternationalConference on Pervasive Computing and Communications, Mannheim, Germany,pp. 226–231.
van Rijsbergen, C.J., Information Retrieval. At /http://www.dcs.gla.ac.uk/Keith/Preface.htmlS.
Wasserman, A., Faust, K., 1994. Social Network Analysis: Methods and Applications.Cambridge University Press, Cambridge.
Watts, D., 2007. Connections a twenty-first century science. Nature 445, 489.Willinger, W., Govindan, R., Jamin, S., Paxson, V., Shenker, S., 2002. Scaling
phenomena in the Internet: critically examining criticality. Proc. Natl. Acad.Sci. USA 99, 2573–2580.