what the #html is gis? data collection...
TRANSCRIPT
Data Collection Instructions What the #HTML is GIS?
1
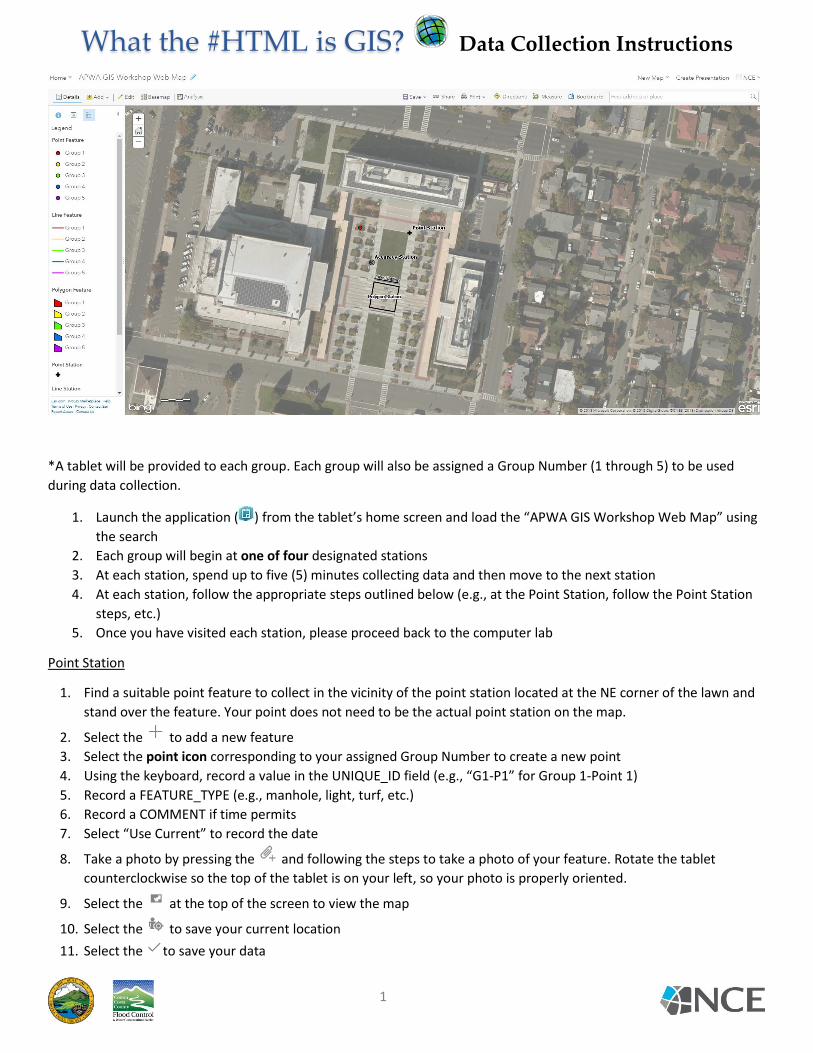
*A tablet will be provided to each group. Each group will also be assigned a Group Number (1 through 5) to be used
during data collection.
1. Launch the application ( ) from the tablet’s home screen and load the “APWA GIS Workshop Web Map” using
the search
2. Each group will begin at one of four designated stations
3. At each station, spend up to five (5) minutes collecting data and then move to the next station
4. At each station, follow the appropriate steps outlined below (e.g., at the Point Station, follow the Point Station
steps, etc.)
5. Once you have visited each station, please proceed back to the computer lab
Point Station
1. Find a suitable point feature to collect in the vicinity of the point station located at the NE corner of the lawn and
stand over the feature. Your point does not need to be the actual point station on the map.
2. Select the to add a new feature
3. Select the point icon corresponding to your assigned Group Number to create a new point
4. Using the keyboard, record a value in the UNIQUE_ID field (e.g., “G1-P1” for Group 1-Point 1)
5. Record a FEATURE_TYPE (e.g., manhole, light, turf, etc.)
6. Record a COMMENT if time permits
7. Select “Use Current” to record the date
8. Take a photo by pressing the and following the steps to take a photo of your feature. Rotate the tablet
counterclockwise so the top of the tablet is on your left, so your photo is properly oriented.
9. Select the at the top of the screen to view the map
10. Select the to save your current location
11. Select the to save your data
Data Collection Instructions What the #HTML is GIS?
2
12. If time permits, collect another point record
Line Station
1. Find a suitable line feature to collect in the vicinity of the line station located along the southern edge of the
northern grassy area and stream a new line feature. Your line feature does not have to correspond exactly with
the line on the map.
2. Select the to add a new feature
3. Select the line icon corresponding to your assigned Group Number to create a new line
4. Using the keyboard, record a value in the UNIQUE_ID field (e.g., “G1-L1” for Group 1-Line 1)
5. Record a FEATURE_TYPE (e.g., manhole, light, turf, etc.)
6. Record a COMMENT if time permits
7. Select “Use Current” to record the date
8. While standing over the end of the line feature, press STREAM at the bottom of the window and slowly walk to the
other end of the line feature and press PAUSE
9. Take a photo by pressing the and following the instructions
10. Select the at the top of the screen to view the map
11. Select the to update your current location
12. Select the to save your data
13. If time permits, collect another line record
Polygon (Area) Station
1. Find a suitable polygon feature to collect within the polygon station surrounding the fountain south of the
northern grassy area. Your polygon feature can be anywhere inside the squared depicted on the map.
2. Select the to add a new feature
3. Select the polygon icon corresponding to your assigned Group Number to create a new polygon
4. Using the keyboard, record a value in the UNIQUE_ID field (e.g., “G1-A1” for Group 1-Area 1)
5. Record a FEATURE_TYPE (e.g., manhole, light, turf, etc.)
6. Record a COMMENT if time permits
7. Select “Use Current” to record the date
8. Select STREAM at the bottom of the window and slowly walk the perimeter of the polygon
9. When you return to where you have started, select PAUSE
10. Take a photo by pressing the and following the instructions
11. Select the to save your data
12. If time permits, collect another area record
Accuracy Station (another point station)
1. Stand directly over the Accuracy Station point depicted on the map.
2. Select the to add a new feature
3. Select the point icon corresponding to your assigned Group Number to create a new point
4. Select on the to modify the settings
5. Turn on GPS averaging by moving toggle to ON
6. The value under “Number of locations” has been pre-programmed for each device; however, type in the following
number if it is incorrect:

Data Collection Instructions What the #HTML is GIS?
3
a. Group 1: 1 second
b. Group 2: 15 seconds
c. Group 3: 30 seconds
d. Group 4: 45 seconds
e. Group 5: 60 seconds
7. Select OK
8. Using the keyboard, record a value in the UNIQUE_ID field (e.g., “G1-P5” for Group 1-Point 5 [or whatever your
next point number might be])
9. Record a FEATURE_TYPE (e.g., manhole, light, turf, etc.)
10. Record a COMMENT if time permits
11. Select “Use Current” to record the date
12. Take a photo by pressing the and following the instructions
13. Select the at the top of the screen to view the map
14. Stand over the point and select the to update your current location and wait until averaging is complete (see
top of screen)
15. Select the to save your data
16. If time permits, collect another point record.
Discussion Topics
1. View data in web map
a. Layers and symbology
b. Legend
c. Click to view popup and attributes
2. Project Planning
a. Answer basic questions before you’re in the field -> Efficient data collection
i. Where you’re going; What you’re collecting; How to collect; Why to collect; Who will be
collecting?
b. Data Dictionary/Data Model/Schema -> Data Management
i. How is the GIS organized, what feature classes, domains, and attributes?
ii. TIP: Only collect data you need
c. Accuracy (Trimble vs. smartphone/tablet)
3. If you are invested in ESRI, you are entitled to use ArcGIS Collector!
a. If you a part of an ESRI Organization:
i. Link to group, request to join: http://arcg.is/01nXbD
ii. Group Name: “2018 APWA Conference GIS Workshop”
b. If you are not part of an ESRI Organization:
i. Download ArcGIS Collector, click on “Try It”
c. Collector is just one option for field data collection and GIS (e.g., QGIS)
Contact Information
Mark Boucher, Sr. Hydrologist, Contra Costa County Public Works, [email protected]
Jeremy Hall, GIS Administrator, NCE, [email protected]
Dave Rios, Senior Scientist, NCE, [email protected]
Sara Dowling, Staff Engineer, NCE, [email protected]

Terms Demystified What the #HTML is GIS?
4
GIS lingo can be confusing at times. You are not alone!
Geographic Information System (GIS)
GIS integrates hardware, software, and data for capturing, managing, analyzing, and displaying all forms of geographically referenced information.
ESRI The company that sells the ArcGIS software and data products Pronounced “E.S.R.I” or “ez-ree”.
ArcGIS, ArcMap, ArcCatalog,
ESRI software for viewing, analyzing and mapping data. There are other software packages available, but ESRI is the industry standard.
MXD file This is an ArcMap file with the .mxd extension used to view/display GIS data, process data processing, make maps, and perform data analysis (buffering, querying, etc.)
GIS Data Data containing both location and attribute information. GIS data contains horizontal (x,y) coordinates, sometimes elevation (z) information, and tabular information (i.e., attributes) about each piece of data. Data types are: Point, Polyline, Polygon, Raster.
Coordinate System & Datum
This is the horizontal and vertical geographic reference for a GIS project. All data in a GIS project has to have the same coordinate systems and datum. If not, it won’t line up correctly. Find out from your agency what they use.
Feature Class vs. Shapefile
A feature class is a collection of common features, each having the same data type (points, polylines, polygons, rasters), and a common set of attributes. A shapefile is a type of feature class, but rather than being stored in a geodatabase (see definition below), shapefiles are a collection of files that are read together by the software. Feature classes have more functionality, but shapefiles are more portable.
Point, Polyline, Polygon
Points are represented by one set of coordinates. Polylines have two or more sets of connected coordinates and don’t have to “close”. Polygons have three or more sets of coordinates connected by a closed line to define an area. This data is stored in feature classes or shapefiles.
Raster A matrix of cells (or pixels) organized into rows and columns (or a grid) where each cell contains a value representing information, like elevation, pollution concentration, etc. Rasters can also be spatially referenced photos or images.
Georectify or “Rubber sheet”
To take an image and make it line up with other features in your data. Example: Scan an old drainage map to a .jpg format, put it in an MXD, georectify it and overlay it on other GIS data to see if the old map has data we might be missing.
Asset Facilities that you want to keep track of such as roads, bridges, manholes, catch basins, pipes, valves, signs, sidewalks, buildings, etc.
Attribute A piece of information relating to an asset, such as size, age, type, dimension, etc.
Attribute Table A “spreadsheet like” table of attributes. Each GIS record is in a row within the attribute table and each attribute is in a column (field) that shows the associated attribute.
Geodatabase A collection of geographic data of various types (points, lines, polygons, rasters) held in a common file system folder. Allows the data to be integrated in a more complex database. You can also set up “rules” like: “Catch basins must touch at least one pipe.”
Symbology This term refers to colors, sizes, and symbols a shapefile is given when displayed in a GIS program or map.
Layer When opened in a GIS program data becomes a layer in that GIS program. It can be displayed with symbols of certain colors and sizes. The layer information can be saved and assigned to other similar datasets when they are opened in a GIS program.
Domain A list that limits the possible entries in a field. It is like a rule that says, “Only use these materials and always spell them this way.” Domains can be thought of as “picklists” for a given attribute. Example: Choose type A, B, C, D, E, or F (only) for the inlet type.
Schema The organization of attributes, and domains for a given feature class.
Metadata This is data about the data. It can include when the data was collected/created, who created it, its intended accuracy, its coordinate system, who maintains it, etc.
Query
A search like function used to select records within a feature class or set of feature classes that meet attribute and or spatial selection criteria. Examples: Select manholes that are more than 6 feet deep. Or select the catch basins that are not connected to a pipe (used for data error checking or missing data).
Table Join Connecting datasets using a common field. Example: Temporarily linking data with unique ID values to another dataset that has the same unique ID values. This temporarily puts the two tables together so you can perform additional analysis or queries.