what public opinion says about school...
TRANSCRIPT

What Public Opinion Says About School Choice
An Analysis of Attitudes toward Educational Options in America
For more than 20 years, public polling has indicated strong support for school choice in America at both the national and state levels. Polls show the strongest support in communities that are already home to school choice programs and have seen the benefits they provide.
Each of the surveys cited in the report below was subject to rigorous methodological review for adherence to fundamental, nonpartisan standards of the public polling industry. Although some polls were conducted by institutions with ideological leanings, all were held to a high standard of transparency regarding both methodology and the results presented. As such, the final section of this report includes the specifications of each of the surveys used, including the sponsoring organizations.
National surveys are consistent with results from states: people support school choice programs.
■ According to a May 2012 poll commissioned by the American Federation for Children (AFC) and the Hispanic Council for Reform and Educational Options (HCREO) and conducted by Beck Research, a Democratic-leaning firm, 85 percent of likely voters and 91 percent of Latinos in five battleground states—Arizona, Florida, New Mexico, New Jersey, and Nevada — think vouchers and scholarship tax credit programs should be available in some form, while majorities of likely voters and Latinos also support specific school choice proposals. Support is especially high for special needs scholarship programs, which are favored by 74 percent of voters and an astounding 80 percent of Latino voters.1
100 20 30 40 50 60 70 80 90 100
74%
OF VOTERSSUPPORT
OF LATINOSSUPPORT
78%
OF VOTERSOPPOSE
23%
OF LATINOSOPPOSE
22%
School Choice Options
100 20 30 40 50 60 70 80 90 100
OF LATINOSSUPPORT
71%
OF LATINOSOPPOSE
26%
Scholarship Tax Credit Programs
OF VOTERSSUPPORT
65%
OF VOTERSOPPOSE
31%
Voucher Programs
100 20 30 40 50 60 70 80 90 100
OF LATINOSSUPPORT
69%
OF LATINOSOPPOSE
29%
OF VOTERSSUPPORT
57%
OF VOTERSOPPOSE
39%
Education Saving Account Programs
100 20 30 40 50 60 70 80 90 100
OF LATINOSSUPPORT
70%
OF LATINOSOPPOSE
26%
OF VOTERSSUPPORT
60%
OF VOTERSOPPOSE
31%53%27%
7%
8%
45%29%
11%
12%
Support by Voters of Special Needs Scholarships
Support by Latinos of Special Needs Scholarships
■ Strongly Support: 53%■ Somewhat Support: 27%■ Somewhat Oppose: 7%■ Strongly Oppose: 8%
53%27%
7%
8%
45%29%
11%
12%
Support by Voters of Special Needs Scholarships
Support by Latinos of Special Needs Scholarships
■ Strongly Support: 45%■ Somewhat Support: 29%■ Somewhat Oppose: 11%■ Strongly Oppose: 12%
P U B L I C S U P P O R T F O R S C H O O L C H O I C E
■ One of the most recent national polls gauging public support for comprehensive education reforms came from Education Next, a national education reform journal, in spring 2011. Among the topics surveyed were school vouchers. When asked whether they would support or oppose a proposal allowing students to attend private schools with tuition paid in part by the government, supporters outnumbered opponents by 20 points (47 percent to 27 percent). Although support drops when the question is asked in a “voucher unfriendly” manner, a plurality still supports vouchers.* A majority of national respondents also favored tax credits, and there was a 25-point gap between supporters and opponents on the subject of charter schools (43 percent to 18 percent). Fewer than one in 10 (9 percent) of those polled rated the nation’s public schools with an “A” or a “B” grade.2
Communities already home to school choice programs have some of the strongest support for the expansion and introduction of additional educational options.
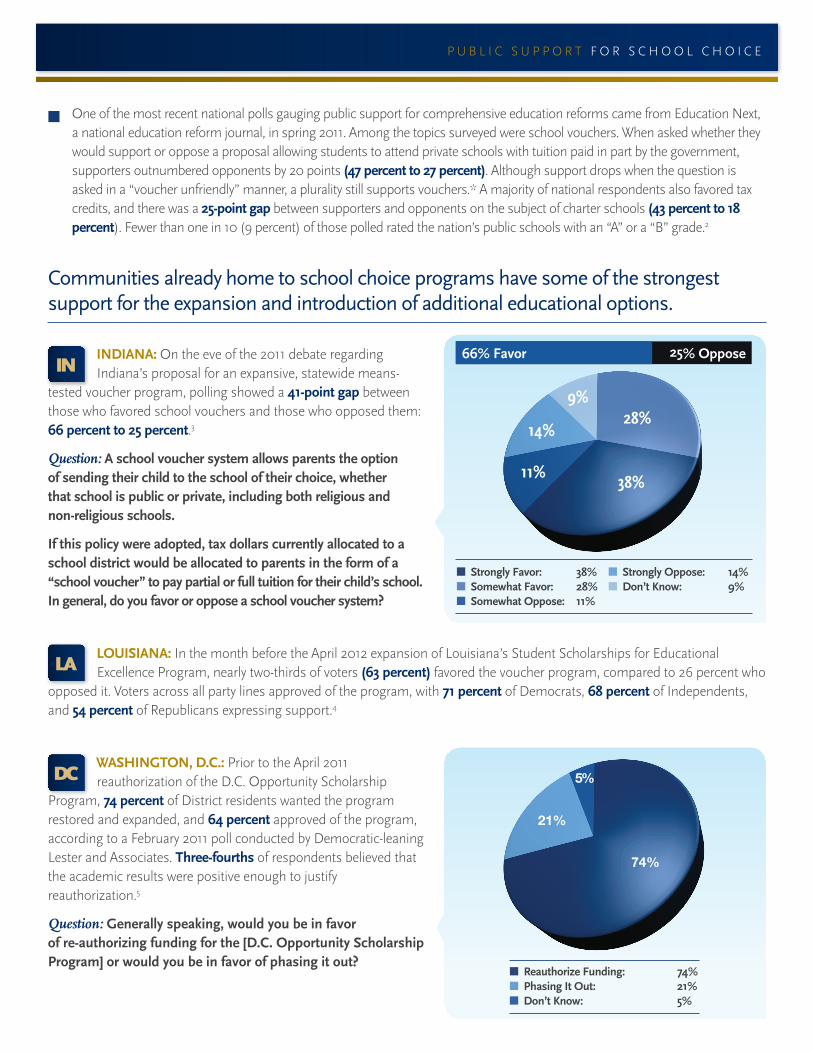
ININDIANA: On the eve of the 2011 debate regarding Indiana’s proposal for an expansive, statewide means-
tested voucher program, polling showed a 41-point gap between those who favored school vouchers and those who opposed them: 66 percent to 25 percent.3
Question: A school voucher system allows parents the option of sending their child to the school of their choice, whether that school is public or private, including both religious and non-religious schools.
If this policy were adopted, tax dollars currently allocated to a school district would be allocated to parents in the form of a “school voucher” to pay partial or full tuition for their child’s school. In general, do you favor or oppose a school voucher system?
LALOUISIANA: In the month before the April 2012 expansion of Louisiana’s Student Scholarships for Educational Excellence Program, nearly two-thirds of voters (63 percent) favored the voucher program, compared to 26 percent who
opposed it. Voters across all party lines approved of the program, with 71 percent of Democrats, 68 percent of Independents, and 54 percent of Republicans expressing support.4
DCWASHINGTON, D.C.: Prior to the April 2011 reauthorization of the D.C. Opportunity Scholarship
Program, 74 percent of District residents wanted the program restored and expanded, and 64 percent approved of the program, according to a February 2011 poll conducted by Democratic-leaning Lester and Associates. Three-fourths of respondents believed that the academic results were positive enough to justify reauthorization.5
Question: Generally speaking, would you be in favor of re-authorizing funding for the [D.C. Opportunity Scholarship Program] or would you be in favor of phasing it out?
74%
21%
5%
■ Reauthorize Funding: 74%■ Phasing It Out: 21%■ Don’t Know: 5%
28%
38%11%
14%
9%
■ Strongly Favor: 38%■ Somewhat Favor: 28%■ Somewhat Oppose: 11%
■ Strongly Oppose: 14%■ Don’t Know: 9%
25% Oppose66% Favor
P U B L I C S U P P O R T F O R S C H O O L C H O I C E
GAGEORGIA: Two separate polls conducted during summer 2008 found strong demand for school choice. In one poll, almost seven in 10 (69 percent) Atlanta voters favored allowing students in failing schools to receive vouchers. In another, two-thirds (66 percent) of statewide respondents approved of a failing schools voucher program, making clear
that school choice does not divide along rural-urban lines.6 Georgia enacted the Georgia Special Needs Scholarship Program in 2007 and the Georgia Scholarship Tax Credit Program in 2008.
PAPENNSYLVANIA: An April 2011 survey of likely voters in the Keystone State showed that a majority (54 percent) favored the private school voucher bill being considered in the state. Those in support of the proposed statewide voucher
legislation, Senate Bill 1, said that the most popular attributes of the bill were that it gave parents more control and gave alternatives to children from low-income families stuck in failing schools. The results could have consequences for legislators—a large proportion of respondents (57 percent) said they were more likely to vote for a legislator who supports school choice, compared to just 33 percent who said they would be less likely.7
In November 2010, prior to the formal introduction of the voucher plan, a statewide survey found support for scholarship tax credit programs (46 percent to 30 percent) and school voucher programs (50 percent to 30 percent). Both Democrats (45 percent to 31 percent) and Republicans (51 percent to 25 percent) were in favor of choice, as were respondents across all age, gender, and racial groups.8
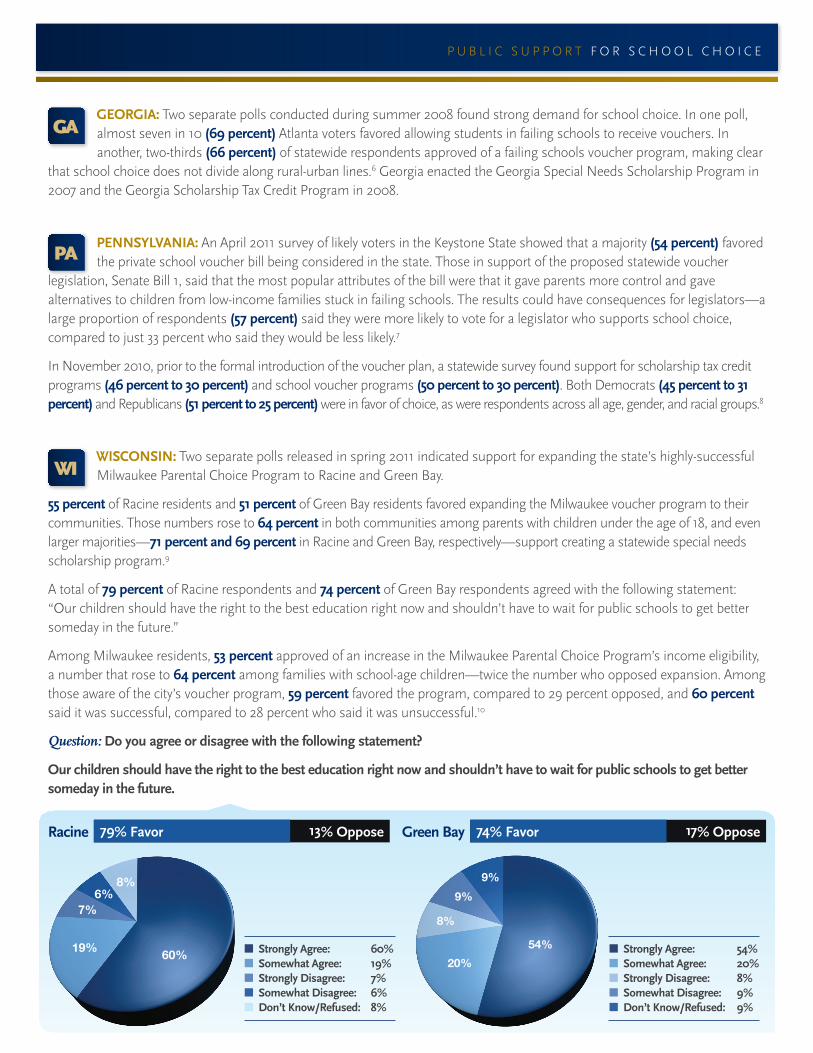
WIWISCONSIN: Two separate polls released in spring 2011 indicated support for expanding the state’s highly-successful Milwaukee Parental Choice Program to Racine and Green Bay.
55 percent of Racine residents and 51 percent of Green Bay residents favored expanding the Milwaukee voucher program to their communities. Those numbers rose to 64 percent in both communities among parents with children under the age of 18, and even larger majorities—71 percent and 69 percent in Racine and Green Bay, respectively—support creating a statewide special needs scholarship program.9
A total of 79 percent of Racine respondents and 74 percent of Green Bay respondents agreed with the following statement: “Our children should have the right to the best education right now and shouldn’t have to wait for public schools to get better someday in the future.”
Among Milwaukee residents, 53 percent approved of an increase in the Milwaukee Parental Choice Program’s income eligibility, a number that rose to 64 percent among families with school-age children—twice the number who opposed expansion. Among those aware of the city’s voucher program, 59 percent favored the program, compared to 29 percent opposed, and 60 percent said it was successful, compared to 28 percent who said it was unsuccessful.10
Question: Do you agree or disagree with the following statement?
Our children should have the right to the best education right now and shouldn’t have to wait for public schools to get better someday in the future.
54%20%
8%
9%9%
■ Strongly Agree: 60%■ Somewhat Agree: 19%■ Strongly Disagree: 7%■ Somewhat Disagree: 6%■ Don’t Know/Refused: 8%
■ Strongly Agree: 54%■ Somewhat Agree: 20%■ Strongly Disagree: 8%■ Somewhat Disagree: 9%■ Don’t Know/Refused: 9%
Racine 13% Oppose79% Favor Green Bay 17% Oppose74% Favor
60%19%
7%6%
8%

P U B L I C S U P P O R T F O R S C H O O L C H O I C E
NCNORTH CAROLINA: In August 2011, a North Carolina survey of unaffiliated voters found that, by a 61 percent to 28 percent margin, respondents want more educational choice in the Tar Heel State. It transcends ideology, too—64
percent of Republican-leaning voters and 53 percent of Democratic-leaners support more school choice.11
VAVIRGINIA: An October 2011 poll showed that majorities across all ideological lines support broad school choice measures in Virginia. Voucher supporters are the majority across the board (53 percent of Democrats, 67 percent of Republicans, and 58 percent of Independents), while supporters of tax credit scholarships exist in even larger numbers
(64 percent of Democrats, 68 percent of Republicans, and 66 percent of Independents).
That support helped spur legislative action in 2012, as lawmakers approved a scholarship tax credit program for low- and middle-income families statewide. Special needs scholarships enjoy especially strong support: 81 percent of Democrats, 79 percent of Republicans, and 76 percent of Independents approve of special needs scholarships.12
Question: Some states give tax credits to individuals and businesses if they contribute money to nonprofit organizations that distribute private school scholarships. This policy supports a “tax-credit scholarship system.” In general, do you favor or oppose a tax-credit scholarship system?
Question: A school voucher system allows parents the option of sending their child to the school of their choice, whether that school is public or private, including both religious and non-religious schools.
If this policy were adopted, tax dollars currently allocated to a school district would be allocated to parents in the form of a “school voucher” to pay partial or full tuition for their child’s school. In general, do you favor or oppose a school voucher system?
Question: Some states allow parents of children with special needs the option of sending their child to the school of their choice, whether that school is public or private, including both religious and non-religious schools.
This policy allocates tax dollars to parents of children with special needs in the form of a “special needs scholarship” to pay partial or full tuition for their child’s school. In general, do you favor or oppose special needs scholarships?
10
0
20
30
40
50
60
64% 68% 66%
70
80
90
10
0
20
30
40
50
60
70
80
90
81% 79% 76% 20
0
40
60
(Source: Education Next) (Source: Associated Press) (Source: Gallup)
20% 11% 40%
10
0
20
30
40
50
60
70
80
90
53% 67% 58%
■ Democrats: 64%■ Republicans: 68%■ Independents: 66%
10
0
20
30
40
50
60
64% 68% 66%
70
80
90
10
0
20
30
40
50
60
70
80
90
81% 79% 76% 20
0
40
60
(Source: Education Next) (Source: Associated Press) (Source: Gallup)
20% 11% 40%
10
0
20
30
40
50
60
70
80
90
53% 67% 58%
■ Democrats: 53%■ Republicans: 67%■ Independents: 58%
10
0
20
30
40
50
60
64% 68% 66%
70
80
90
10
0
20
30
40
50
60
70
80
90
81% 79% 76% 20
0
40
60
(Source: Education Next) (Source: Associated Press) (Source: Gallup)
20% 11% 40%
10
0
20
30
40
50
60
70
80
90
53% 67% 58%
■ Democrats: 81%■ Republicans: 79%■ Independents: 76%
P U B L I C S U P P O R T F O R S C H O O L C H O I C E
There is strong demand for expanding school choice to new states.
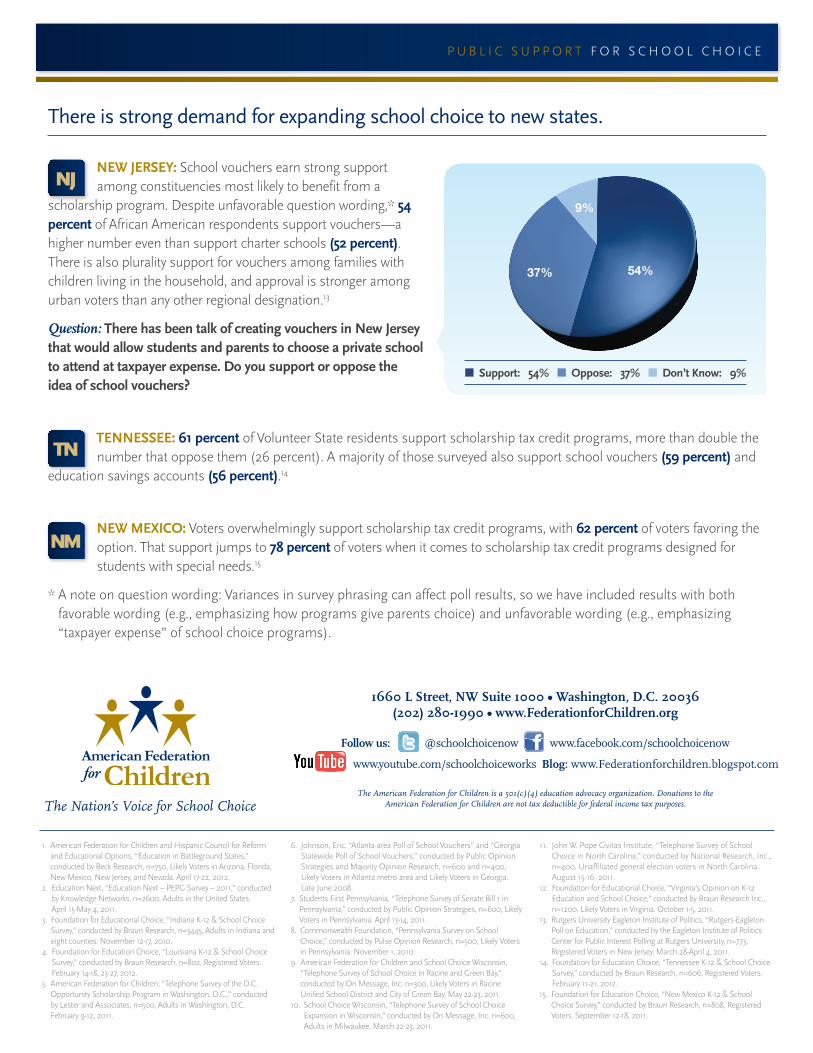
NJNEW JERSEY: School vouchers earn strong support among constituencies most likely to benefit from a
scholarship program. Despite unfavorable question wording,* 54 percent of African American respondents support vouchers—a higher number even than support charter schools (52 percent). There is also plurality support for vouchers among families with children living in the household, and approval is stronger among urban voters than any other regional designation.13
Question: There has been talk of creating vouchers in New Jersey that would allow students and parents to choose a private school to attend at taxpayer expense. Do you support or oppose the idea of school vouchers?
TNTENNESSEE: 61 percent of Volunteer State residents support scholarship tax credit programs, more than double the number that oppose them (26 percent). A majority of those surveyed also support school vouchers (59 percent) and
education savings accounts (56 percent).14
NMNEW MEXICO: Voters overwhelmingly support scholarship tax credit programs, with 62 percent of voters favoring the option. That support jumps to 78 percent of voters when it comes to scholarship tax credit programs designed for students with special needs.15
* A note on question wording: Variances in survey phrasing can affect poll results, so we have included results with both favorable wording (e.g., emphasizing how programs give parents choice) and unfavorable wording (e.g., emphasizing “taxpayer expense” of school choice programs).
■ Support: 54% ■ Oppose: 37% ■ Don’t Know: 9%
54%37%
9%
1660 L Street, NW Suite 1000 • Washington, D.C. 20036(202) 280-1990 • www.FederationforChildren.org
The Nation’s Voice for School ChoiceThe American Federation for Children is a 501(c)(4) education advocacy organization. Donations to the
American Federation for Children are not tax deductible for federal income tax purposes.
Follow us: @schoolchoicenow www.facebook.com/schoolchoicenow
www.youtube.com/schoolchoiceworks Blog: www.Federationforchildren.blogspot.com
1. American Federation for Children and Hispanic Council for Reform and Educational Options, “Education in Battleground States,” conducted by Beck Research, n=750, Likely Voters in Arizona, Florida, New Mexico, New Jersey, and Nevada. April 17-22, 2012.
2. Education Next, “Education Next – PEPG Survey – 2011,” conducted by Knowledge Networks, n=2600, Adults in the United States. April 15-May 4, 2011.
3. Foundation for Educational Choice, “Indiana K-12 & School Choice Survey,” conducted by Braun Research, n=3445, Adults in Indiana and eight counties. November 12-17, 2010.
4. Foundation for Education Choice, “Louisiana K-12 & School Choice Survey,” conducted by Braun Research, n=802, Registered Voters. February 14-18, 23-27, 2012.
5. American Federation for Children, “Telephone Survey of the D.C. Opportunity Scholarship Program in Washington, D.C.,” conducted by Lester and Associates, n=500, Adults in Washington, D.C. February 9-12, 2011.
6. Johnson, Eric. “Atlanta-area Poll of School Vouchers” and “Georgia Statewide Poll of School Vouchers,” conducted by Public Opinion Strategies and Majority Opinion Research, n=600 and n=400, Likely Voters in Atlanta metro area and Likely Voters in Georgia. Late June 2008.
7. Students First Pennsylvania, “Telephone Survey of Senate Bill 1 in Pennsylvania,” conducted by Public Opinion Strategies, n=600, Likely Voters in Pennsylvania. April 13-14, 2011.
8. Commonwealth Foundation, “Pennsylvania Survey on School Choice,” conducted by Pulse Opinion Research, n=500, Likely Voters in Pennsylvania. November 1, 2010.
9. American Federation for Children and School Choice Wisconsin, “Telephone Survey of School Choice in Racine and Green Bay,” conducted by On Message, Inc. n=300, Likely Voters in Racine Unified School District and City of Green Bay. May 22-23, 2011.
10. School Choice Wisconsin, “Telephone Survey of School Choice Expansion in Wisconsin,” conducted by On Message, Inc. n=600, Adults in Milwaukee. March 22-23, 2011.
11. John W. Pope Civitas Institute, “Telephone Survey of School Choice in North Carolina,” conducted by National Research, Inc., n=400, Unaffiliated general election voters in North Carolina. August 15-16, 2011.
12. Foundation for Educational Choice, “Virginia’s Opinion on K-12 Education and School Choice,” conducted by Braun Research Inc., n=1200, Likely Voters in Virginia. October 1-5, 2011.
13. Rutgers University Eagleton Institute of Politics, “Rutgers-Eagleton Poll on Education,” conducted by the Eagleton Institute of Politics Center for Public Interest Polling at Rutgers University, n=773, Registered Voters in New Jersey. March 28-April 4, 2011.
14. Foundation for Education Choice, “Tennessee K-12 & School Choice Survey,” conducted by Braun Research, n=606, Registered Voters. February 11-21, 2012.
15. Foundation for Education Choice, “New Mexico K-12 & School Choice Survey,” conducted by Braun Research, n=808, Registered Voters. September 12-18, 2011.