what next for chaos theory? from … · in the management and organizational theory realms, the use...
TRANSCRIPT

ISSN: 2163-9280 Spring 2013 Volume 12, Number 1
52
WHAT NEXT FOR CHAOS THEORY?
FROM METAPHOR TO PHASE SPACE
William “Rick” Crandall , University of North Carolina at Pembroke
Richard E. Crandall, Appalachian State University, [email protected]
John A. Parnell, University of North Carolina at Pembroke, [email protected]
ABSTRACT
In the management and social sciences literature, chaos theory has been used primarily
as a metaphor to understand organizational phenomena. Using metaphors to understand
organizations is a novel idea that has gained much acceptance, thanks to the pioneering work of
Morgan (1986). However, chaos theory's value as a metaphor has been overused and offers little
that cannot already be explained using existing theories and frameworks.
Because chaos theory is a mathematical theory, we believe its mathematical principles
offer the greatest application to the management literature. In this paper, we offer the use of
phase space, a tool of chaos theory, as a way to analyze firm performance.
INTRODUCTION
The use of chaos theory in management research has been confined mainly to a
metaphorical approach. In the management and organizational theory realms, the use of
metaphor is well known, thanks to the pioneering work of Morgan (1986). However, none of
Morgan’s metaphors are based solely on a field of mathematics. In contrast, chaos theory is
grounded in mathematical principles. Herein lies the problem; what are management scholars to
do with this theory? Two options can be identified. First, scholars can continue to apply chaos
theory primarily as a metaphor. Second, the mathematical concepts inherent to chaos theory,
particularly its use of phase space, can be more actively applied. A review of the literature
suggests that the first option has been overused while the second option is currently
underutilized.
In this paper, we address the unwarranted enthusiasm and often imprecise application of
chaos theory as a metaphor, as well as its underuse as a formidable mathematical application for
management research. The paper begins with a brief history of chaos theory and its
misapplication as a metaphor in management research. We then discuss how one relatively
simple tool of chaos theory, phase space, can be used to examine firm performance history. We
conclude with implications for management researchers.
BACKGROUND
Although there are a number of important figures in the history of chaos theory, a key
ISSN: 2163-9280 Spring 2013 Volume 12, Number 1
53
starting point would begin with Edward Lorenz. As a meteorologist, Lorenz was working with
equations in a weather forecasting model he was developing involving data on temperature, air
pressure, and wind direction (Briggs & Peat, 1989). At one point in his work he decided to take
a shortcut. Instead of inputting the values to six decimal places, he used three. The results he
obtained were considerably different from what he had anticipated. This discovery later became
the trigger event that led to a key component of chaos theory – sensitive dependence to initial
conditions. Lorenz had stumbled on a discovery that indicated a small change in the initial
conditions of a system could lead to very different outcomes as the system evolved. This
discovery evolved into an explanation known by many as the butterfly effect: When a butterfly
flaps its wings in one part of the world, it can initiate a series of air currents that influence
weather events that can eventually cause a hurricane in another part of the world, say Florida. Of
course, should the butterfly flap its wings in a different direction, the hurricane could develop
somewhere else, perhaps Cuba or Mexico. In the butterfly illustration, we see an explanation of
how a slight change in initial conditions can lead to a vastly different outcome in the life of the
system under study.
The bestselling book by James Gleick (1987) made chaos theory more understandable to
those outside the mathematical and physics disciplines. Soon, social scientists, psychologists,
and even a few management scholars found an interest in chaos theory. To these researchers,
chaos theory offered an interesting, nonlinear framework that could be used as a lens to
understand the complex social and psychological interactions that comprise individual and
organizational behavior.
Chaos theory also inspired those who identified with the concept in nonmathematical
ways. One viewpoint was that chaos carried with it a sense of mystery and excitement about life
(Stoppard, 1995). The appeal of chaos theory has also been compared to a romantic appreciation
of disorder that accompanies a corresponding reaction against the scientific appreciation for
order and symmetry (Friedrich, 1988; Smith & Higgins, 2003). Polkinghorne (1993), a priest,
articulated that chaos theory helps to describe the divine plan for the universe. While these
viewpoints are interesting, they are amazingly off-base with the original intentions of chaos
theory. In fact, in one sense, chaos theory is not actually a theory at all, but an extension of
nonlinear mathematics (Bolland, & Atherton, 1999). Put another way, chaos theory is somewhat
of a mathematical anomaly.
One of the aspects of chaos theory that has also contributed to its increasing popularity is
its visual dimension (Smith & Higgins, 2003). Attractors, a key component of chaos theory, can
be graphed and often display an aesthetic appeal similar to computer art (Carey, 1995). A
number of the papers reviewed for the present study depicted the famous Lorenz butterfly
attractor. Add some color to this attractor and one can create an amazingly beautiful graphic.
Certainly, this ability to take a seemingly difficult mathematical process and make it visually
appealing adds to the mystique and popularity of chaos theory.
ISSN: 2163-9280 Spring 2013 Volume 12, Number 1
54
THE TWO BASIC CONDITIONS OF A SYSTEM IN CHAOS
Chaos is not a state of randomness or disorder, but one whereby phenomena that appear
to be unrelated actually follow an unknown or hidden pattern (Smith, 2002; Tetenbaum, 1998;
van Staveren, 1999). This pattern is called an attractor and it can be visually observed through
the plotting of data in phase space. Moreover, the relationships among the variables in a chaotic
system are existent, but are “rather vague and at best, difficult to discern” (Kiel & Elliott,
1996:2). Chaotic systems possess two characteristics, sensitive dependence to initial conditions
and unpredictability in the long run.
Sensitive Dependence to Initial Conditions
Lorenz noted above that a slight change in the initial input of his data led to vastly
different results in his weather model. In his book on chaos theory (Lorenz, 1993), he also
discussed the paths of sleds descending down a snowy slope. In this example, he illustrated with
diagrams how seven sleds can end up in different stopping areas at the bottom of a hill, even
though they may have started their descent less than ten centimeters apart. Of course, the paths
the sleds take change directions, depending on the location of small humps or moguls along the
route of the descent. Nonetheless, the stopping point ultimately depends on the starting point,
thus, the importance of sensitivity to initial conditions.
Unpredictability in the Long Run
The behavior of a chaotic system cannot be predicted in the long run. At best, there may
be some accuracy in making short-term predictions. The weather is an example of a chaotic
system that cannot be determined on a long-term basis, but can be predicted successfully in the
short run (Lorenz, 1993). For example, as the authors prepare this manuscript, the weather is
cool and breezy in this location of the country. And yet, a year ago, nobody could have
predicted with certainty the weather for this location of the country on this particular day. In
fact, making such a prediction is all but impossible only a month in advance; hence, weather is
unpredictable in the long-run, and so are systems in chaos.
CHAOS THEORY AS A METAPHOR IN MANAGEMENT RESEARCH
During the 1990s, social scientists began to take an interest in chaos theory (Guastello,
2008). In the field of management research, its use has primarily been invoked as a metaphor.
The practice of using metaphors to help explain the workings of an organization is not new.
Gareth Morgan (1986) was a key player in generating enthusiasm for the use of metaphors to
explain organizational behavior. However, Morgan did not use metaphors that were based on
deep mathematics, an underpinning of chaos theory.

ISSN: 2163-9280 Spring 2013 Volume 12, Number 1
55
The dilemma of using chaos theory as a metaphor concerns the theory’s intended use, to
explain a unique mathematical state—chaos—where system behavior is neither completely
orderly nor completely random. Herein lies the irony: Social scientists and organizational
scholars do not readily use elaborate concepts from chemistry or physics to explain social
behavior, so why the attraction to chaos theory? Indeed, the appeal of metaphors is a strong
attracting force, one that can cause some misunderstandings, as we examine in the next section.
The Metaphor Problem
Misunderstandings concerning chaos theory stem primarily from its overuse as a
metaphor, not in its mathematical use, because the latter is extremely limited in the management
literature. While metaphors are useful to understanding complex systems, there is a tendency to
extend them beyond their usefulness. Commenting on Gleick’s book, Eigenauer (1993: 455)
noted:
While Gleick’s work is solid, it has led some to be captivated by chaos theory’s fecund
metaphorical terminology and elegant computer aided graphical images. Although those
images … show striking instances of order hidden within chaotic systems, too often they
are used to forward the thesis that there are other systems, ranging from modern literary
theory to stock market fluctuations, that also house deep structure amid their apparent
disorder. The result is, on occasion, analysis that is based only on metaphor.
Smith (2002:523) also concurred with a similar thought, “… some disciplines have already
displayed a tendency to rely too heavily on purely conceptual applications of chaos theory. This
is in danger of reducing chaos theory to a collection of metaphors, or worse still reducing it to
just semantic innovation if the application is trivial.”
One problem with using chaos theory as a metaphor is that it offers little that cannot
already be explained using existing theories or frameworks. For example, Bright and Pryor
(2005) compare the four types of attractors to career decisions. While their work is interesting
and describes the various career dilemmas employees face, their discussion of attractors does not
augment our knowledge of careers. Put differently, the same paper without the discussion on
attractors would have been sufficient. In another example, Sellnow, Seeger, & Ulmer (2002)
offer an excellent assessment of the 1997 Red River flood in Minnesota and North Dakota.
However, their attempts to tie in chaos theory to the discussion add little to our knowledge and
even distracts from the central point; their analogy of the strange attractor to the support agencies
involved in managing the flood is interesting, but not necessary.
While metaphors are useful in gaining new insights, their overuse can lead to problems.
Metaphors begin to break down in their usefulness when exact parallels between the metaphor
and the phenomena under study are either not possible or inappropriate (Barton, 1994, Chubb,
1990). While chaos theory can enable us to think about our research question in a different
perspective, the metaphor must not be overextended. For example, the field of psychology was

ISSN: 2163-9280 Spring 2013 Volume 12, Number 1
56
one of the first social sciences to embrace chaos theory as a tool of analysis. However, as Barton
(1994) noted, some misunderstandings of what chaos actually means have emerged. He cited
Bütz’s (1992) use of chaos as “overwhelming anxiety,” a state that bears little resemblance to the
mathematical state of chaos described in the original theory.
To summarize at this point, chaos theory is a mathematical concept and one that is
difficult to use as a metaphor to social phenomena, particularly in management research.
However, within chaos theory, there is a rather simple tool that does not require an advanced
knowledge of mathematics to understand, the concept of phase space. It is in phase space where
chaotic behavior can be deciphered and analyzed.
EXAMINING FIRM PERFORMANCE IN PHASE SPACE
Chaos theory is a mathematical theory and therefore, its use should include mathematics
(Elliott & Kiel, 1996; Faber & Koppelaar, 1994; Smith, 1995; Smith, 2002). In this section, we
reflect on use of chaos theory in management research by offering an application of phase space
analysis, a mathematical tool of chaos theory. To understand phase space, it is first necessary to
review the concept of attractors.
Attractors
In chaos theory, an attractor is a pattern that forms when the behavior of the system is
plotted in phase space (Lorenz, 1993). When the points are joined by a line in a chronological
order, a pattern develops that can resemble a point, orbit, or some kind of unusual pattern. The
unusual pattern is also referred to as a strange attractor.
Attractors range from being fairly simple to vastly complex. Four types of attractors have
been identified: Point, pendulum, torus (which is a type of orbit), and strange (Barton, 1994;
Hudson, 2000; Stam, 2003). In phase space, a point attractor is depicted as a single plot on a
graph. This occurs because the system behavior remains consistent over time. The pendulum
attractor, also referred to as a period attractor, resembles a narrow back-and-forth pattern when
graphed in phase space. The torus attractor is a more complex pattern that forms an orbit, but
also contains sub-orbits within the orbit, thus resembling a donut when graphed in phase space.
Finally, the strange attractor, sometimes referred to as a fractal, is a complicated pattern that
exists when the system is in chaos. The attractor is called strange because its shape may or may
not resemble any known pattern
Graphing Variables in Phase Space
In phase space, the properties of the system under study are plotted at a point in time.
With each iteration, another plot is made, which eventually results in a pattern (i.e., an attractor)
when the plots are joined in chronological order by a line. “Diagramming the movement of a
system’s variables in phase space reveals the curious byways of an otherwise hidden reality”
(Briggs & Peat, 1989: 32). Put another way, the pattern of a time series that looks haphazard

ISSN: 2163-9280 Spring 2013 Volume 12, Number 1
57
may actually have a hidden structure to it if we look at it in a different manner, through phase
space.
Phase space can be graphed using variables that the researcher desires to study. With one
variable, phase space is typically graphed by placing the current data point from a time series on
the y-axis and the prior data point from the previous period on the x-axis. This one variable
arrangement is also referred to as pseudo phase space (Williams, 1997). Within the medical
field, Stam (2003) studied the single variable, EEG patterns (brainwaves), and plotted attractors
in an attempt to identify conditions that can lead to an epileptic seizure. Yambe and associates
(2003) looked at cardiac functions via the variable maximum ventricular elastance (E max) to
determine phase space patterns that might indicate heart problems. In the production operations
management literature, Giannelos and associates (2007) used the single variable, flow time, in
assessing dispatching policies for manufacturing jobs.
Plotting with two variables is also possible in phase space. For example, mechanical
systems have been examined in phase space using position and velocity while ecological systems
have been studied in terms of the population size of the species being studied (Briggs & Peat,
1989). In medical research, Reidbord and Redington (1992) constructed a phase space with heart
rate and the patient’s behavior state as the study variables. In the area of public administration
research, Kiel (1993) constructed an attractor in phase space using time series data involving
labor costs associated with service requests. In the strategic management literature, Priesmeyer
and Baik (1989) examined revenue and profit changes among retailers and identified attractors in
phase space.
Priesmeyer and Baik’s (1989) work set the stage for the following discussion. Their
examination of two business variables in phase space is both conceptually easy to understand and
useful in tracking patterns in firm performance. In the next section, we assess the movement of
revenue and income variables in phase space. We then offer a glimpse into how one firm
exhibited a strange attractor in phase space.
Choosing Variables to Study
Management scholars typically seek to identify the influence of selected independent
variables on a dependent variable. A standard approach is to conduct a correlation analysis to
check for multicollinearity, and then multiple regression analysis to determine the strength of the
independent variables on the dependent variable. However, in chaos research, scholars seek to
identify the pattern of movement of the system under study through time by graphing the system
variables in phase space.
In this paper, we graph the two variables of revenue and profits. These variables were
selected based on the following criteria:
Both variables can be captured in time series data.
Revenue and profits are absolutely essential for the long-term sustainability of the firm.

ISSN: 2163-9280 Spring 2013 Volume 12, Number 1
58
Both variables function as a proxy for how the firm is operating.
Understanding Phase Space
The first requirement for analyzing a system in phase space is time series data, as it is the
primary domain area for studying chaotic behavior (Haynes, Blaine, & Meyer, 1995; Hudson,
2000). In this paper, we examine total sales and net income as they appear in phase space. In
phase space, we need to capture the movement of these variables through time. To accomplish
this, we adjust our two study variables to reflect this requirement. Thus, we need to capture the
variables as the “change in total sales”, which will be shown on the x-axis, and the “change in
net income”, which will be depicted on the y-axis.
To obtain the change in total sales (x-axis coordinate), the difference between the present
total sales for the fiscal quarter and the total sales for the previous quarter are calculated. The
same procedure is used to calculate the change in net income (y-axis coordinate), using the net
income (loss) figures.
Change in Total Sales = Total Sales current – Total Sales previous
Change in Net Income (loss) = Net Income current – Net Income previous
Figure 1 depicts the two study variables, change in total sales (X-axis) and change in net
income (Y-axis). The figure also depicts the resulting four quadrants. Note that the upper right
quadrant would be the most desirable for the firm, as it depicts a situation where the firm
increased both sales and net income from the previous fiscal period. Points in the lower right
quadrant indicate the firm increased sales, but experienced a decrease in net income from the
previous fiscal period, an undesirable situation with any company. The upper left quadrant
depicts a situation where sales decreased, but income increased from the previous fiscal period.
Such a scenario might occur when a firm is downsizing and/or divesting one or more of its
business units. Finally, the lower left quadrant depicts a decrease in sales and net income from
the previous fiscal period. Points in this quadrant do not necessarily indicate the firm is
performing poorly. A more likely scenario is that the company is experiencing a seasonal factor
in its business cycle. Many companies rebound the next fiscal period and actually vacillate
between increasing and decreasing sales and net income. However, there would be cause for
concern if the company continued to experience decreased sales and income over successive
fiscal periods. Such performance would not be sustainable in the long-run.

ISSN: 2163-9280 Spring 2013 Volume 12, Number 1
59
Figure 1 – The Four Quadrants in Phase Space
Adapted from Priesmeyer, H.R. (1992). Organizations and Chaos: Defining the Methods of
Nonlinear Management. Westport, CT: Quorum Books, page 29.
An Example of Firm Performance in Phase Space
Suppose that a firm increased sales for three fiscal periods by exactly $400, while net
income by exactly $200. If this oversimplified situation were graphed in phase space, it would be
plotted as a single point. The resulting point attractor is shown in Figure 2.
Y-
Axis
: C
han
ge
in N
et I
nco
me
X- Axis: Change in Total Sales
Quadrant 3 - Points falling in this quadrant indicate the firm experienced a decrease in sales and net income from the previous fiscal period.
Quadrant 1 - Points falling in this quadrant indicate the firm experienced an increase in sales and net income from the previous fiscal period. This is the most desirable quadrant for the firm.
Quadrant 4 - Points falling in this quadrant indicate the firm experienced an increase in sales but a decrease in net income from the previous fiscal period. Performance in this quadrant is not sustainable in the long run.
Quadrant 2 - Points falling in this quadrant indicate the firm experienced a decrease in sales, and yet, an increase in net income from the previous fiscal period.

ISSN: 2163-9280 Spring 2013 Volume 12, Number 1
60
Figure 2 - A Point Attractor
Now, suppose that in the next fiscal quarter, the firm experienced a decrease in sales by
$400 and a decrease in net income of $200. The resulting plots would look like the ones in
Figure 3. When the two points are joined, the line slopes from the top right to the bottom left.
Plots in the lower left or right quadrants do not necessarily mean the firm experienced a net loss,
only that it experienced a decrease in net income for that fiscal period.
Figure 3 - Movement through Phase Space after One Fiscal Period
-250
-200
-150
-100
-50
0
50
100
150
200
250
-600 -400 -200 0 200 400 600
Y-
Axis
: C
han
ge
in N
et I
nco
me
X- Axis: Change in Total Sales

ISSN: 2163-9280 Spring 2013 Volume 12, Number 1
61
Assume that in the next fiscal quarter, the firm experienced an increase in total sales of
$200 and an increase in net income of $200. Remember, these are changes from the previous
fiscal period. This is not the same as saying that the firm’s sales and net income were $200, an
all but impossible situation. Figure 4 illustrates this change, which is a return to the original
quadrant.
Figure 4 - Two Fiscal Periods Graphed in Phase Space
Assume also that in the subsequent quarter the firm experienced a decrease in total sales
of $175 and a decrease in net income of $200. When the plots are joined, one can see the
beginnings of a pendulum or more accurately, a period two attractor as shown in Figure 5.
Figure 5 - Three Fiscal Periods Graphed and the Beginning of a Period Two Attractor
-250
-200
-150
-100
-50
0
50
100
150
200
250
-600 -400 -200 0 200 400 600
Y-
Axis
: C
han
ge
in N
et I
nco
me
X- Axis: Change in Total Sales

ISSN: 2163-9280 Spring 2013 Volume 12, Number 1
62
When the remaining points in this example are graphed, what results is an obvious pattern, an
attractor that cycles between the two quadrants. In fact, this pattern could be quite normal for any
business that experiences seasonal business cycles where sales and net income fluctuate. One of
the characteristics of the period two attractor is that is the subsequent quadrant is easy to
determine. In addition, we propose this particular attractor is typical for a firm that is operating
well. The completed example of the period two attractor appears in Figure 6. The dataset used to
generate this hypothetical example is in Table 1.
-250
-200
-150
-100
-50
0
50
100
150
200
250
-600 -400 -200 0 200 400 600
Y-
Axis
: C
han
ge
in N
et I
nco
me
X- Axis: Change in Total Sales

ISSN: 2163-9280 Spring 2013 Volume 12, Number 1
63
Figure 6 – A Period Two Attractor
Table 1 - Data Set for the Above Example
Fiscal
Period
Change in Total
Sales
Change in Net
Income
1 400 200
2 -400 -200
3 200 200
4 -175 -200
5 250 150
6 -300 -250
7 250 250
8 -300 -200
Consider another example of a period two attractor using data from an actual company.
Home Depot exhibits a relatively consistent two phase oscillation from the upper right to the
lower left quadrants; an indication that sales and net profits are moving in a cyclical pattern.
Figure 7 illustrates Home Depot’s performance in phase space.
-300
-200
-100
0
100
200
300
-600 -400 -200 0 200 400 600
Y-
Axis
: C
han
ge
in N
et I
nco
me
X- Axis: Change in Total Sales

ISSN: 2163-9280 Spring 2013 Volume 12, Number 1
64
Figure 7 – Home Depot’s Performance in Phase Space
Data Source – Mergent Online
The performance for Home Depot shows visits to quadrants 1 and 3 oscillating in a clear
period two attractor. There is one visit to quadrant 4, indicating an increase in sales and a slight
decrease in income from the previous fiscal period. Other than this one exception, the phase
space is depicts a regular pattern of performance and we can conclude that the system is not in
chaos.
Figure 8 depicts the performance for Apple.

ISSN: 2163-9280 Spring 2013 Volume 12, Number 1
65
Figure 8 – Apple’s Performance in Phase Space
The performance for Apple also depicts a clear period two attractor. However, there are some
distinct differences from its performance compared to Home Depot’s period two attractor. First,
the attractor is positioned more to the right of the phase space than Home Depot. In other words,
the points go deeper into quadrant 1 relative to quadrant 3. Recall that Home Depot’s attractor
oscillated evenly from quadrants 1 and 3. Put differently, the visits into quadrant 1 went about as
deep as into quadrant 3. With Apple, the visits are deep into quadrant 1 and shallow into
quadrant 3, an indication of strong performance.
Another difference from the Home Depot attractor is that Apple experiences “consecutive
visits” within quadrant 1. In other words, there are several trajectories that contain consecutive
points within quadrant 1. This indicates that both sales and net income are increasing marginally

ISSN: 2163-9280 Spring 2013 Volume 12, Number 1
66
over two consecutive fiscal periods. Again, this observation is an indication of strong firm
performance. We can conclude that Apple is not in chaos.
Chaos and Phase Space
Those who study phase space will ultimately seek to determine if time series data exhibits
the characteristics of chaos. It should be noted that systems that exhibit a point or period two
attractor (discussed above) are not in chaos because the system remains predictable over a period
of time; recall that a condition of chaos is unpredictability in the long run. The question now
becomes, what does a system in chaos look like in phase space? It will resemble a complex shape
or pattern, often referred to as a strange attractor. We should remember though that the strange
shape is more than just an object to observe; it is an indication that the system is experiencing the
two conditions of chaos, 1) sensitive dependence to initial conditions, and 2) unpredictability in
the long run. In the next section, we analyze a firm that exhibits chaotic behavior as indicated by
its strange attractor.
CHAOTIC PERFORMANCE IN PHASE SPACE
In this section, we analyze the performance of the company, Pizza Inn, in phase space.
Specifically, we suspected that the company would depict a chaotic attractor when the variables
of sales and income (loss) were graphed in phase space. This observation is based on the fact
that Pizza Inn’s performance has been suboptimal over the past decade.
We suspected that a poor performing firm would be more difficult to predict in terms of
performance from one fiscal quarter to the next. Hence, its phase space history would be
chaotic. The result would be a strange attractor that did not appear to follow a point or period
two attractor. This methodology is consistent with Priesmeyer and Baik’s (1989) assessment of
retail firms.
To test our proposition, we collected nine years of time series data from Mergent Online
for the company, Pizza Inn. Next, we plotted two variables, change in sales (x-axis) and change
in income (y-axis), in phase space.
RESULTS
Figure 9 depicts performance for Pizza Inn for fiscal years 2002 to 2010. Immediately, it
can be seen that this graph does not depict a period two attractor like was seen with Home Depot
and Apple. Indeed, there are plots in all four quadrants and the trajectory paths do not seem to

ISSN: 2163-9280 Spring 2013 Volume 12, Number 1
67
follow any organized pattern. The phase space attractor takes on a strange shape, and based on
this, we can make a preliminary conclusion that the system is chaotic. Figure 9 – Pizza Inn Firm Performance in Phase Space
Chaos theorists seek to examine the characteristics of the attractor to determine the nature
of the system under study. While this system appears to be chaotic, there is additional
information available if we look at the phase space on a smaller scale. Figure 10 shows that
there is a sub-attractor that exhibits a fairly constant pattern. This area is shown within the
dashed oval pattern on the graph. Note also that those points outside the attractor boundary have
been identified by the large arrows.

ISSN: 2163-9280 Spring 2013 Volume 12, Number 1
68
Figure 10 – The Sub-Attractor and the Outlier Points
The sub-attractor displays a consistent pattern of change for sales and income. The long
and narrow shape of the attractor indicates that variation in sales exceeded the variation in
income. For sales, the variation within the attractor went from - 1689 to +1317 (in thousands).
For income, the various was much lower, from - 436 to +617 (in thousands). Intuitively, this
should not surprise us since sales are always going to be a higher figure than income. However,
a phase space graph shows the change in sales and income from the previous fiscal period.
Hence, it is possible that some points will still lie outside the attractor. Indeed, that is the case in
this phase space graph. For example, the outlier point in quadrant 4 displays a large increase in
sales, and yet, a decrease in income. A somewhat similar situation exists in quadrant 2, where
three points lie outside the attractor. The two points along the y-axis indicate an increase in
income despite a decrease in sales. The one point along the x-axis depicts a large decrease in
sales, and a slight increase in income. Recall that points in quadrant 3 should be considered
undesirable if they continue to exist over consecutive fiscal periods.
ISSN: 2163-9280 Spring 2013 Volume 12, Number 1
69
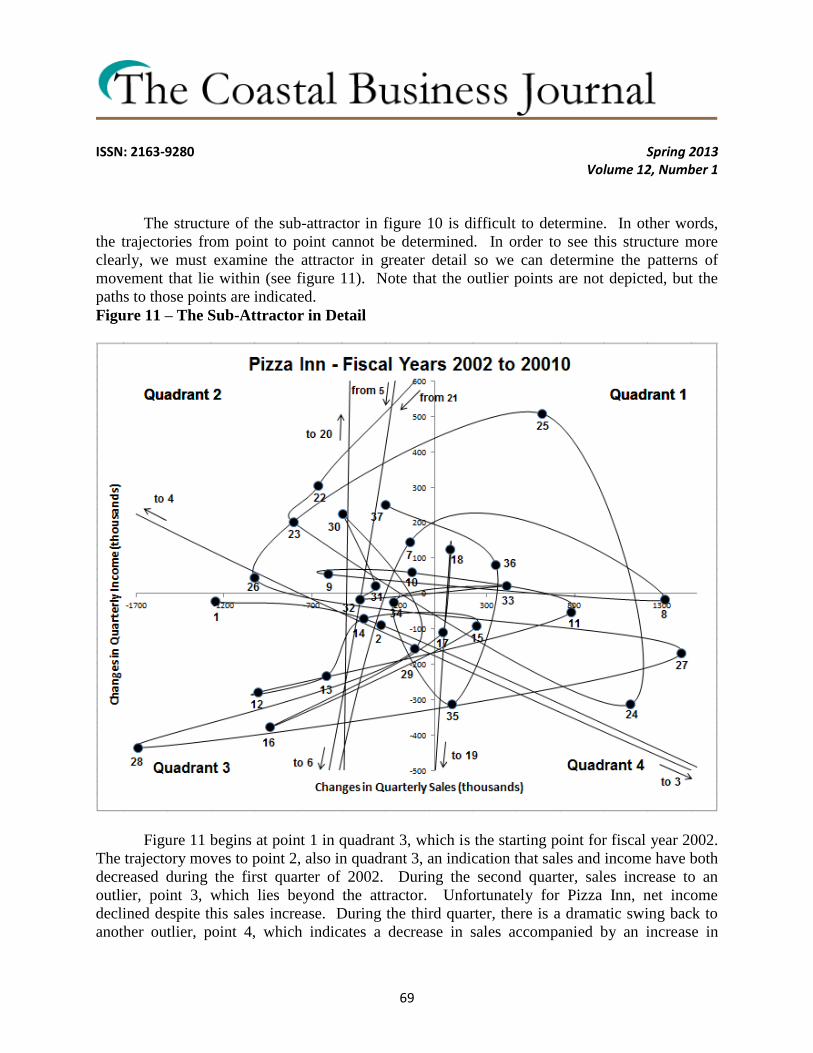
The structure of the sub-attractor in figure 10 is difficult to determine. In other words,
the trajectories from point to point cannot be determined. In order to see this structure more
clearly, we must examine the attractor in greater detail so we can determine the patterns of
movement that lie within (see figure 11). Note that the outlier points are not depicted, but the
paths to those points are indicated.
Figure 11 – The Sub-Attractor in Detail
Figure 11 begins at point 1 in quadrant 3, which is the starting point for fiscal year 2002.
The trajectory moves to point 2, also in quadrant 3, an indication that sales and income have both
decreased during the first quarter of 2002. During the second quarter, sales increase to an
outlier, point 3, which lies beyond the attractor. Unfortunately for Pizza Inn, net income
declined despite this sales increase. During the third quarter, there is a dramatic swing back to
another outlier, point 4, which indicates a decrease in sales accompanied by an increase in

ISSN: 2163-9280 Spring 2013 Volume 12, Number 1
70
income. Finally, the 2002 fiscal year ends at point 5, another outlier, in which income increases
but sales decrease.
The first quarter of 2003 ends at point 6, another outlier, which depicts a decrease in both
sales and income. At point 7, the second quarter ends with an increase in income, but a
continued decline in sales. Points 8 to 18 lie within the attractor and the paths can be traced
fairly easily. The trajectories are not consistent however; instead, they follow a haphazard
pattern that is impossible to predict. In other words, the system is chaotic. Recall that for a
consistent period two attractor, we could discern a clear back and forth pattern of trajectories
between quadrants 1 and 3. That is not the case here.
Points 19 to 21 are outliers and not shown on the graph. The trajectory returns to point
22 in quadrant 3, which corresponds with the end of the first quarter in 2007. The remaining
points lie in the attractor. The final fiscal quarter in 2010 ends with point 37.
DISCUSSION
In the previous section, we illustrated how a tool of chaos theory, phase space, can be
used to track the firm performance variables of sales and income. We identified a strange
attractor in the ten year operating period of Pizza Inn and concluded that it was a system that was
chaotic. In the following discussion, we examine more closely what it means to be in chaos.
A Chaotic System
We have concluded that Pizza Inn’s performance in terms of sales and income is chaotic.
This conclusion meets the two criteria of chaos, (1) sensitive dependence to initial conditions,
and (2) unpredictability in the long run. In regards to the first condition, chaos researchers have
learned that when systems move from a period two to a period four cycle, that system is also
moving towards chaos (Briggs & Peat, 1989; Gleick, 1987). We illustrated a period two cycle
with Home Depot and Apple, which is considered a stable cycle and non-chaotic. It should be
acknowledged that period four cycles can also exist, but these are considered less stable. A
period four cycle would indicate a system is visiting four distinct areas in phase space in an
alternating manner. Certainly, there are business cycles that can fall into this category, but they
are less likely to occur and more fragile than a period two cycle. A period eight cycle is less
stable than a period four cycle. When systems are pushed beyond eight period cycles, then chaos
is fast approaching. In fact, Priesmeyer (1992) maintains that for all practical purposes,
businesses operating in a period eight cycle are already in chaos.
As for the second condition, unpredictability in the long-run, our data does support this
conclusion with the Pizza Inn chain. The haphazard or strange shape of the attractor displays a
pattern of firm movement in phase space that is difficult to determine. It is impossible to predict
ISSN: 2163-9280 Spring 2013 Volume 12, Number 1
71
what Pizza Inn will look like next year. Indeed, we cannot even predict which quadrant the phase
space plot will fall on in the next fiscal quarter.
Phase Space Quadrants
The plots in the phase space quadrants can reveal important information about the
performance of Pizza Inn. Each quadrant represents the degree to which sales and income
increase or decrease. Assume that the period two cycle from quadrant 1 to quadrant 3 and back
to 1, and so on, is the normal healthy cycle. If the system departs from that cycle by going to
quadrants 2 or 4, then it will need to correct itself in order to return to the quadrants 1 – 3
sequence.
As mentioned above, quadrant 1 is the most desirable because points in this area indicate
an increase in both sales and income. However, of the 37 possible points, only five reside in
quadrant 1 (points 18, 21, 25, 33, and 36). The low presence in quadrant 1 indicates Pizza Inn’s
inability to sustain growth.
Although consecutive points plotted in quadrant 1 would be ideal, healthy firms in a
normal business cycle would most likely move to quadrant 3 during their next fiscal quarter.
This back and forth movement is the path that marks the now familiar period two cycle discussed
above. For Pizza Inn however, only two points (18 and 33) move to quadrant 3. The others
three points (21, 25, and 36) depart from the healthy period two cycle and move to quadrant 2
indicating a decrease in sales, but an increase in income. While the increase in income is
positive, it also indicates the firm performance is chaotic, that is, it is not approaching a regular
period two.
Quadrant 2 contains 12 of the 37 points in the system. The strong presence in this
quadrant is not sustainable because of the problem of decreasing sales. If we assume that a
period two is the normal cycle, then what would follow is a countermovement from quadrant 2
over to quadrant 1. Once the system is reset at quadrant 1, it would move to quadrant 3, and then
back to 1. However, this is not the case with Pizza Inn as the trajectories continue to move all
over the graph in various locations in an inconsistent manner.
Quadrant 3 contains 12 of the 37 points in the system. If Pizza Inn operated in a normal
period two cycle, we would expect an equal number of points in quadrants 3 and 1. As
mentioned, this is not the case. What exists is a disproportionately high number of points in
quadrant 3 relative to quadrant 1, a sign of chaotic financial performance. This does not
necessarily imply poor financial performance, as phase space does not indicate if Pizza Inn is in
the black or the red in term of net income. However, chaotic performance is of concern since
there is an inability to establish a consistent pattern in terms of sales and income.
Quadrant 4 contains 8 of the 37 points. This is of concern since this quadrant indicates an
increase in sales and a decrease in net income. Again, this does not mean Pizza Inn went into the
ISSN: 2163-9280 Spring 2013 Volume 12, Number 1
72
red; only a traditional time series graph can identify such a situation. Instead, it displays a
pattern of movement that may be signaling a problem if it continues.
ADVANTAGES, LIMITATIONS AND FUTURE DIRECTIONS
Advantages
The main advantage of using phase space is its ability to illustrate changes in system
behavior in an interesting visual format. Because phase space graphs changes in the system
variables, it is well suited for showing shocks to the system that are not as noticeable using
traditional time series data. Phase space is also suitable for identifying patterns in system
behavior that are periodic, random, or chaotic.
Phase space is not a technique to replace any of the more traditional approaches to time
series analysis; instead, it can supplement our understanding of firm performance. Hence, we
believe the use of chaos theory is not a superior approach to analysis, but rather represents
another valuable technique for scholars.
Limitations
The primary limitation of this study was the limited number of data points, 37, within the
time series under study (see Williams, 1997). Moreover, some theorists maintain that chaos is
difficult to identify with real world data (Williams, 1997). In this study we used the term chaotic
instead of chaos to describe the Pizza Inn time series data.
Future Directions
Two key research opportunities have been identified.
Are there common phase space attractors for specific industries? We know that certain
industries can be volatile due to market influences and supply chain uncertainty (e.g. the
airline industry). Is it possible that a number of companies in the same industry exhibit a
common attractor?
What other variables should be displayed in phase space? For example, if research and
development (R&D) expenditures were graphed in phase space with net income or net
sales as accompanying variables, would the resulting attractors yield meaningful
information? R&D is mentioned because of its use as a means of differentiation. R&D is
particularly characteristic of the prospector business strategy and the differentiation
strategy (Parnell, 2008).
CONCLUSION
The use of chaos theory as a metaphor is limited and, at times, inappropriate. Rather,
chaos theory should be interpreted as a mathematical phenomenon, and more accurately, a subset
of nonlinear dynamics. We propose that using phase space analysis is a suitable way to

ISSN: 2163-9280 Spring 2013 Volume 12, Number 1
73
incorporate chaos theory into management research. However, chaos theory is not a superior
tool of analysis, but an additional tool with specific strengths that can aid in the understanding of
firm performance over time.
REFERENCES
Barton, S. (1994). Chaos, self-organization, and psychology. American Psychologist, 49(1), 5-
14.
Bolland, K & Atherton, C. (1999). Chaos theory: An alternative approach to social work practice
and research. Families in Society: The Journal of Contemporary Human Services, 80(4),
367-373.
Briggs, J., & Peat, F.D. (1989). Turbulent Mirror: An Illustrated Guide to Chaos Theory and the
Science of Wholeness. New York: Harper & Row, Publishers.
Bright, J., & Pryor, R. (2005). The chaos theory of careers: A user’s guide. The Career
Development Quarterly, 53, 291-305.
Bütz, M.R. (1992). The fractal nature of the development of the self. Psychological Reports, 71,
1043-1063.
Carey, J. (1995). The Faber book of science. London: Faber & Faber.
Chubb, H. (1990). Looking at systems as process. Family Process, 29, 1669-1675.
Crandall, W.R., Parnell, J., & Spillan, J. (2009). Crisis Management in the New Strategy
Landscape. Thousand Oaks, CA: Sage Publishing.
Eigenauer, J.D. (1993). The humanities and chaos theory: A response to Steenburg’s “Chaos at
the Marriage of Heaven and Hell”. Harvard Theological Review, 86(4), 455-469.
Elliott, E., & Kiel, D.L. (1996). Introduction to chaos theory and the social sciences:
Foundations and applications, University of Michigan, Michigan.
Faber, J., & Koppelaar, H. (1994). Chaos theory and social science: A methodological analysis.
Quality and Quantity, 28(4), 421-433.
Friedrich, P. (1988). Eerie chaos and eerier order. Journal of Anthropological Research, 44
(Winter), 435-444.
Giannelos, N., Papakostas, N., Mourtzis, D., & Chryssolouris, G. (2007). Dispatching policy for
manufacturing jobs and time-delay plots. International Journal of Computer Integrated
Manufacturing, 20(4), 329-337.
Gleick, J. (1987). Chaos: Making a New Science. New York: Viking Penguin.
Guastello, S.J. (2008). Chaos and conflict: Recognizing patterns. Emergence: Complexity &
Organization, 10(4), 1-9.
Haynes, S., Blaine, D., & Meyer, K. (1995). Dynamical models for psychological assessment:
Phase space functions. Psychological Assessment, 7(1), 17-24.
Hudson, C. (2000). At the edge of chaos: A new paradigm for social work? Journal of Social
Work Education, 36(2), 215-230.
Kiel, D.L. (1993). Nonlinear dynamical analysis: Assessing systems concepts in a government

ISSN: 2163-9280 Spring 2013 Volume 12, Number 1
74
agency. Public Administration Review, 53(2), 143-153.
Kiel, D.L., & Elliott, E. (1996). Chaos theory in the social sciences: Foundations and
applications. Ann Arbor, MI: University of Michigan Press.
Kincanon, E., & Powel, W. (1995). Chaotic analysis in psychology and psychoanalysis. The
Journal of Psychology, 129(5), 495-505.
Lorenz, E. (1993). The Essence of Chaos. Seattle: University of Washington Press.
Morgan, G. (1986). Images of Organization. Beverly Hills, CA: Sage.
Parnell, J.A. (2008). Strategic Management: Theory and Practice (3rd
ed.). Mason, Ohio:
Cengage Learning.
Polkinghorne, J. (1993). Chaos and cosmos: A theological approach. In J. Holte (Ed.), Chaos:
The New Science (pp. 105-117). Lanham, MD: University Press.
Priesmeyer, H.R. (1992). Organizations and Chaos: Defining the Methods of Nonlinear
Management. Westport, CT: Quorum Books.
Priesmeyer, H. R., Baik, K. (1989). Discovering the patterns of chaos. Planning Review, 14-21.
Reidbord, S.P., & Redington, D.J. (1992). Psychophysiological processes during insight oriented
therapy: Further investigation into nonlinear psychodynamics. Journal of Nervous and
Mental Disease, 180, 649-657.
Sellnow, T., Seeger, M., & Ulmer, R. (2002). Chaos theory, informational needs, and natural
disasters. Journal of Applied Communication Research, 30(4), 269-292.
Smith, D. R. (1995). The inapplicability principle: What chaos means for social science.
Behavioral Science, 40(1), 22-40.
Smith, A. (2002). Three scenarios for applying chaos theory in consumer research. Journal of
Marketing Management, 18, 517-531.
Smith, W., & Higgins, M. (2003). Postmodernism and popularization: The cultural life of chaos
theory. Culture and Organization, 9(2), 93-104.
Stam, C.J. (2003). Chaos, continuous EEG, and cognitive mechanisms: A future for clinical
neurophysiology. American Journal of Electroneurodiagnostic Technology, 43, 211-227.
Stoppard, T. (1995). Extract from Acadia in John Carey (Ed.). The Faber Book of Science,
London: Faber and Faber, 502-503.
Tetenbaum, T.J. (1998). Shifting paradigms: From Newton to chaos. Organizational Dynamics,
26(4), 21-32.
van Staveren, I. (1999). Chaos theory and institutional economics: Metaphor or model? Journal
of Economic Issues, 23(1), 141-166.
Williams, G. P. (1997). Chaos Theory Tamed. Washington, DC: Joseph Henry Press.
Yambe, T., Yoshyizawa, M., Taira, R., Tanaka, A., Tabayashi, K., Sasada, H., & Nita, S. (2003).
Chaos attractors of ventricular elastance to evaluate cardiac performance. International
Society for Artificial Organs, 27(1), 104-107.

ISSN: 2163-9280 Spring 2013 Volume 12, Number 1
75
ABOUT THE AUTHORS
William “Rick” Crandall currently serves as Professor of Management at the University of
North Carolina at Pembroke. He earned his Ph.D. in Business Administration with a
concentration in organizational behavior and human resource management from the University
of Memphis. His primary research interest is in the area of crisis management, helping
organizations cope with catastrophic events. He is author of the new book, Crisis Management
in the New Strategy Landscape (co-authored with John Parnell and John Spillan, of the
University of North Carolina at Pembroke) through Sage Publications. He is also active in
researching issues related to supply chain management. With his father, Richard Crandall, he
co-authored the book New Methods of Competing in the Global Marketplace, Critical Success
Factors from Service and Manufacturing, published in 2008 by CRC Press, Taylor and Francis,
and Principles of Supply Chain Management, also published by CRC Press, Taylor and Francis,
2010. Prior to entering higher education, Dr. Crandall worked in management for ARA Services
(now ARAMARK), a service management firm based in Philadelphia.
Richard E. Crandall is a Professor in the College of Business at Appalachian State University,
in Boone, North Carolina. He is certified in production and inventory management (CFPIM),
integrated resource management (CIRM) and supply chain professional (CSCP) by APICS - The
Association for Operations Management. He has a Ph.D. in Production/Operations Management
from the University of South Carolina and is a registered professional engineer and a certified
public accountant. Prior to joining ASU, Dick worked as an industrial engineer and in
management positions for manufacturing and service companies. He was a consultant with a
major consulting firm, installing systems for both operations and financial applications. With
Rick Crandall, he co-authored the book New Methods of Competing in the Global Marketplace,
Critical Success Factors from Service and Manufacturing, published in 2008 by CRC Press,
Taylor and Francis, and Principles of Supply Chain Management, also published by CRC Press,
Taylor and Francis, 2010.
John Parnell is the William Henry Belk Distinguished Professor in Management at the
University of North Carolina at Pembroke. He is the author of numerous academic papers in
strategic management, crisis management, and related areas. He earned the Ed.D. degree from
Campbell University, and the Ph.D. degree in Strategic Management from The University of
Memphis. Dr. Parnell was the recipient of a Fulbright research award in Egypt and has also
lectured in a number of countries, including extensive recent activity in China, Peru and Mexico.
His current research focuses on business strategy, crisis management, and related topics. His
recent work on crisis management appears in the Journal of Contingencies and Crisis
Management and the Journal of International Business Research and Practice. He is co-author
of the book, Crisis Management in the New Strategy Landscape (with William “Rick” Crandall
and John Spillan, also of the University of North Carolina at Pembroke).