what is the value proposition of sales and operations planning?
TRANSCRIPT

What Is the Value Proposition of Sales and Operations Planning? Insights from Quantitative and Qualitative Research
10/27/2015
By Lora Cecere
Founder and CEO Supply Chain Insights LLC
Page 2
Contents
Research Methodology
Disclosure
Executive Overview
Current State
What Is S&OP Maturity?
Defining Process Maturity
What Is S&OP Effectiveness?
What Is the Value Proposition of Sales and Operations Planning?
Recommendations
Conclusion
Appendix
Other Reports in This Series
Terms to Know
About Supply Chain Insights LLC
About Lora Cecere
3
4
5
6
7
8
10
12
16
18
19
23
24
25
25

Page 3
Research Methodology This report answers the question “What Is the Value Proposition of Sales and Operations Planning?”
We answer this question by sharing the results of a recent quantitative survey. To gain additional
insights for the repot, the findings were vetted with small roundtables of supply chain professionals
who had taken the survey.
In Figure 1, we share the objectives, methodology, and demographics of the S&OP study. The study,
conducted online in 2015, is based on the responses of 73 respondents. To qualify for the study the
respondent had to have at least one S&OP process and $250 million or more in revenue. In
tabulation, respondents were then put into two subgroups based on self-reporting on the question of
“How Effective Are Your Sales and Operations Processes?” The question was rated on seven-point
scale. Those rating themselves 5-7 were put into an “Effective S&OP” group, while those rating
themselves 1-4 were put into a “Less Effective S&OP” group which is listed in the report as “Other.”
The average company in the study is a process-based manufacturer in North America with revenues
of $6 billion. Additional information on the study demographics can be found in the Appendix.
Figure 1. Survey Overview of the S&OP Study

Page 4
We are committed to delivering thought-leading content for the supply chain leader. It is our goal for
Supply Chain Insights to be the place where visionaries turn to gain an understanding of the future of
supply chain management.
Disclosure Your trust is important to us. In our business, we are open and transparent about our financial
relationships and our research operations. In this research process, we never share the names of
respondents and/or give attribution to the open comments collected in the research.
This report is written and shared using the principles of Open Content research. It is intended for you
to read and share freely with your colleagues and through social channels like LinkedIn, Facebook
and Twitter. When you use the report, all we ask for in return is attribution. We publish under the
Creative Commons License Attribution-Noncommercial-Share Alike 3.0 United States and our citation
policy is outlined on the Supply Chain Insights Website.
In the development of research our philosophy is, “You give to us, and we give to you.” Participants of
our research always receive the final reports; and, if interested, we will share our insights with the
respondents of our quantitative surveys and qualitative interviews in a one-hour phone call with their
team. Participants in this research also had an option to join in a networking roundtable. Where
appropriate, we share their feedback in this report.
Page 5
Executive Overview When supply chain leaders ask, "What is the value proposition for Sales and Operations Planning
(S&OP)?" our first answer is “growth.” We know from past interviews and research that mature Sales
and Operations Planning (S&OP) processes are instrumental in executing growth programs including
new product launch, price, and promotions (termed “demand shaping.”) (Cecere, Martin, & Preslan,
Handbook of Becoming Demand Driven, 2005)
While we believe that S&OP is fundamental to a growth strategy, we wanted to know more. Using
quantitative and qualitative research, we wanted to understand the behaviors and characteristics of
effective Sales and Operations Planning. This is the goal of this report. We prove in this research that
companies with a more effective S&OP process are more aligned, agile, and balanced which leads to
greater control and improved response.
In the report we start by outlining the current state and then defining S&OP maturity and
effectiveness. We end with a clear statement of the value proposition and recommendations for
companies to improve their S&OP processes.
Page 6
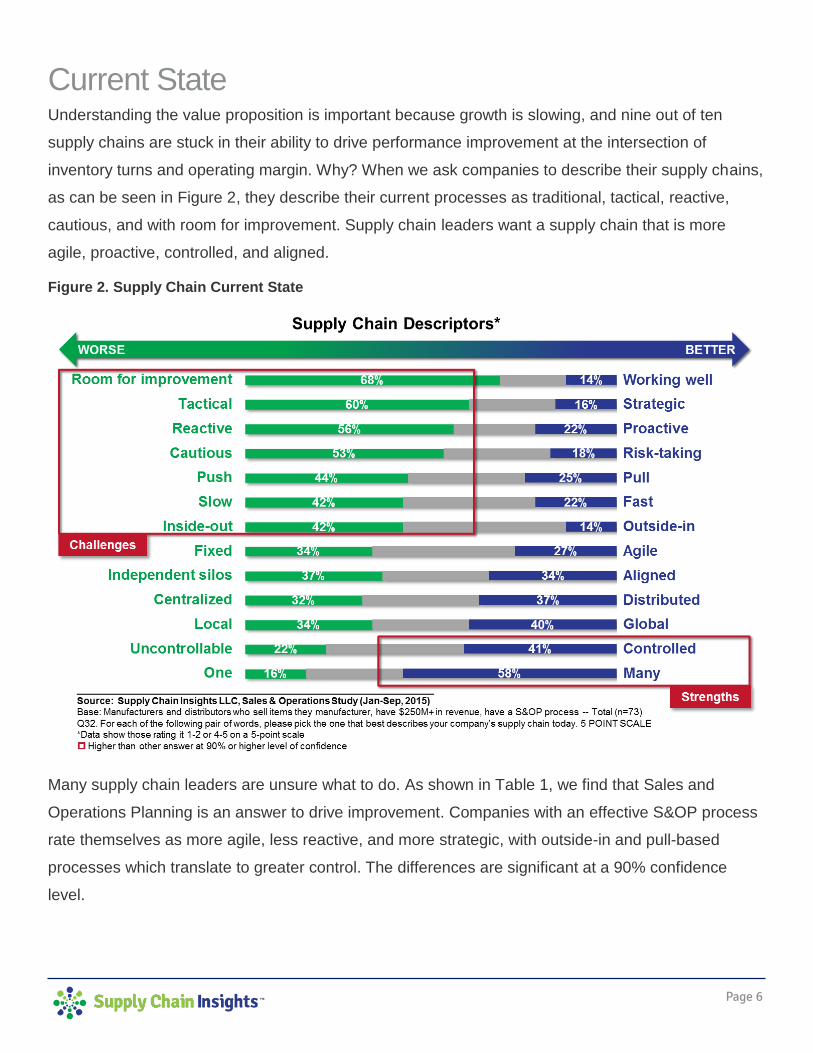
Current State Understanding the value proposition is important because growth is slowing, and nine out of ten
supply chains are stuck in their ability to drive performance improvement at the intersection of
inventory turns and operating margin. Why? When we ask companies to describe their supply chains,
as can be seen in Figure 2, they describe their current processes as traditional, tactical, reactive,
cautious, and with room for improvement. Supply chain leaders want a supply chain that is more
agile, proactive, controlled, and aligned.
Figure 2. Supply Chain Current State
Many supply chain leaders are unsure what to do. As shown in Table 1, we find that Sales and
Operations Planning is an answer to drive improvement. Companies with an effective S&OP process
rate themselves as more agile, less reactive, and more strategic, with outside-in and pull-based
processes which translate to greater control. The differences are significant at a 90% confidence
level.
Page 7
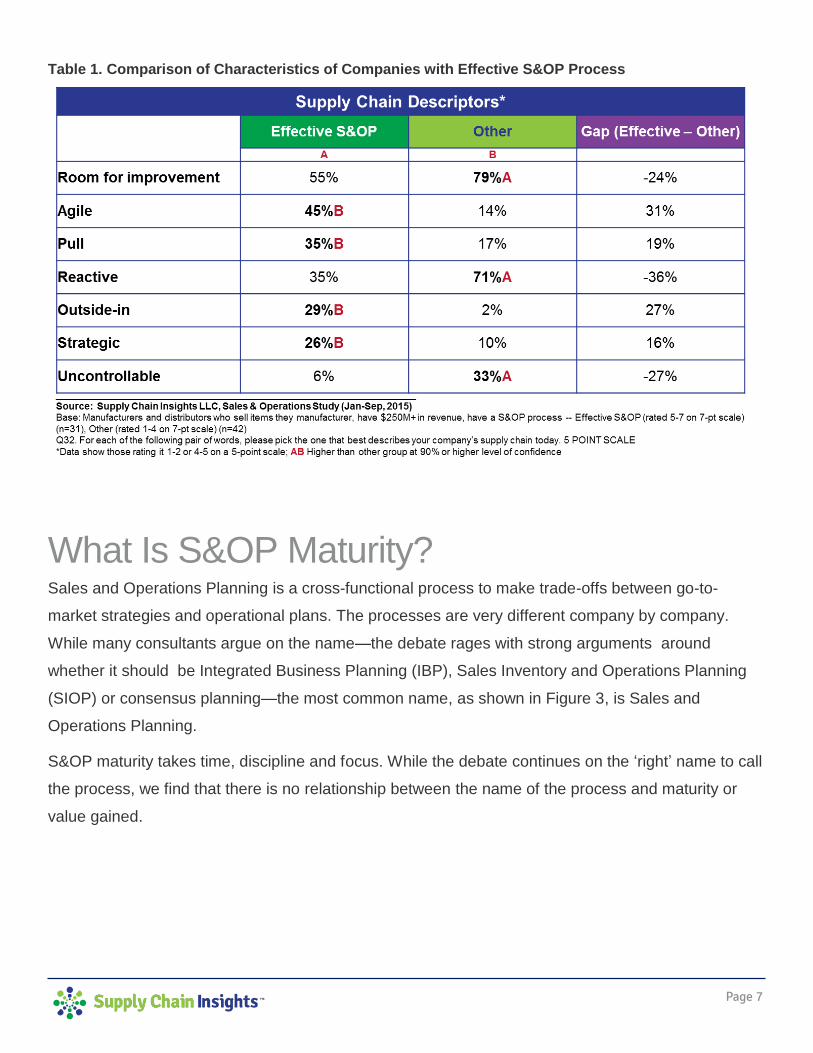
Table 1. Comparison of Characteristics of Companies with Effective S&OP Process
What Is S&OP Maturity? Sales and Operations Planning is a cross-functional process to make trade-offs between go-to-
market strategies and operational plans. The processes are very different company by company.
While many consultants argue on the name—the debate rages with strong arguments around
whether it should be Integrated Business Planning (IBP), Sales Inventory and Operations Planning
(SIOP) or consensus planning—the most common name, as shown in Figure 3, is Sales and
Operations Planning.
S&OP maturity takes time, discipline and focus. While the debate continues on the ‘right’ name to call
the process, we find that there is no relationship between the name of the process and maturity or
value gained.

Page 8
Figure 3. Names for the Cross-Functional Process to Align Demand and Supply
In this research, companies have not one, but an average of four different processes. Each has a
different level of maturity. With the growth of the global multinational, based on our advisory work with
clients, a company with multiple S&OP processes with differing levels of maturity is common. This
complicates research studies. In this study respondents were asked to comment on the process with
which they were the most familiar.
Defining Process Maturity One of the first questions that an S&OP leadership team will ask is, “How do I define S&OP
maturity?” Our answer is that the maturity of an S&OP process can easily be determined by
answering a series of questions:
What is the goal of the S&OP processes?
How is balance achieved between demand and supply?
How are decisions made? Are the decisions made with the right cadence to the market?
How does the organization measure success? What is measured? Is there improvement?
Is S&OP tied to execution?
Page 9
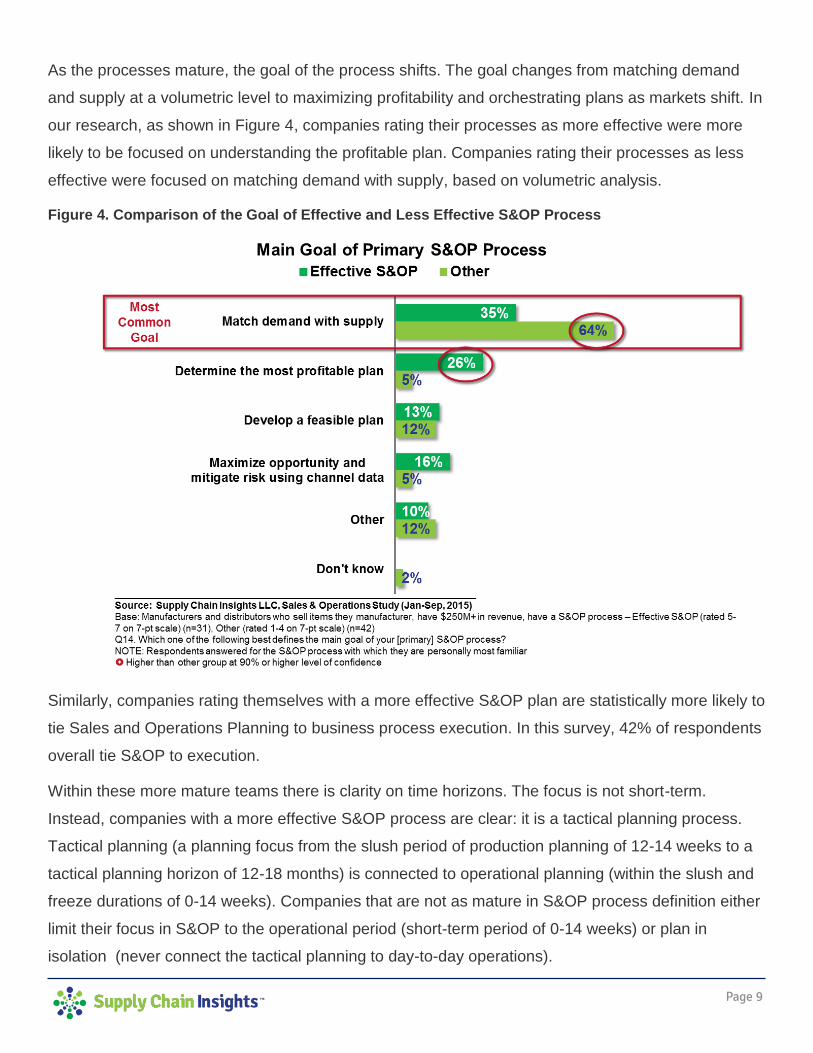
As the processes mature, the goal of the process shifts. The goal changes from matching demand
and supply at a volumetric level to maximizing profitability and orchestrating plans as markets shift. In
our research, as shown in Figure 4, companies rating their processes as more effective were more
likely to be focused on understanding the profitable plan. Companies rating their processes as less
effective were focused on matching demand with supply, based on volumetric analysis.
Figure 4. Comparison of the Goal of Effective and Less Effective S&OP Process
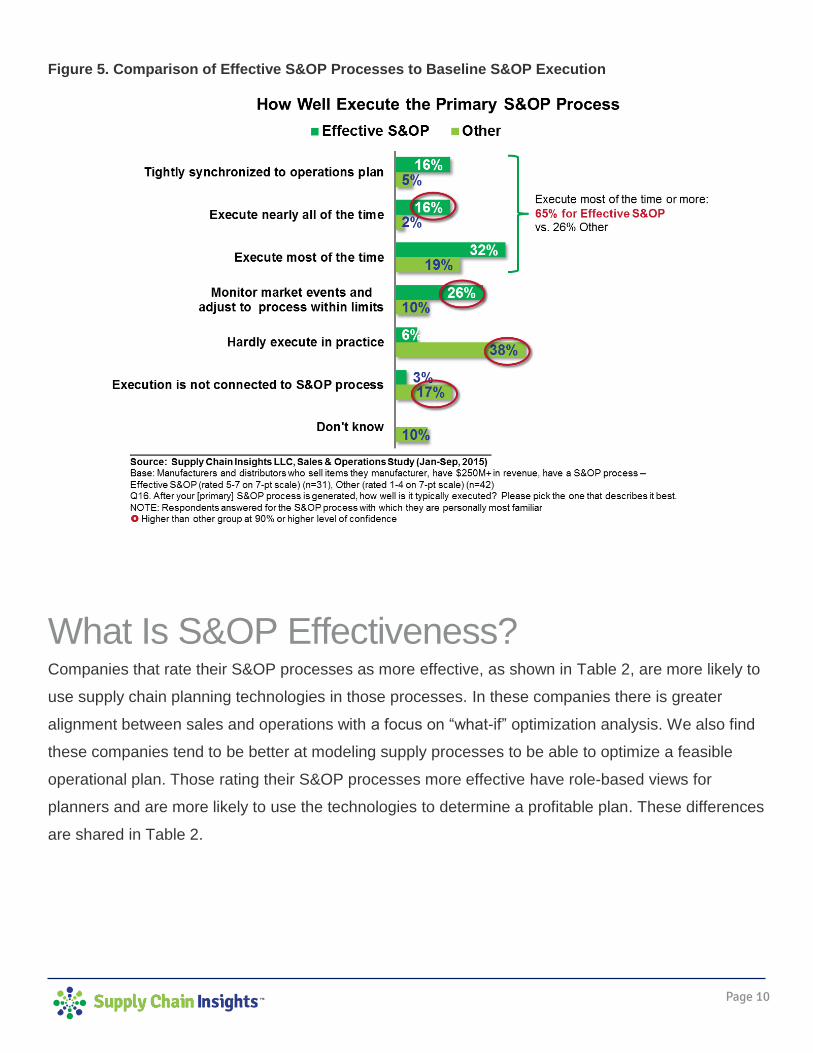
Similarly, companies rating themselves with a more effective S&OP plan are statistically more likely to
tie Sales and Operations Planning to business process execution. In this survey, 42% of respondents
overall tie S&OP to execution.
Within these more mature teams there is clarity on time horizons. The focus is not short-term.
Instead, companies with a more effective S&OP process are clear: it is a tactical planning process.
Tactical planning (a planning focus from the slush period of production planning of 12-14 weeks to a
tactical planning horizon of 12-18 months) is connected to operational planning (within the slush and
freeze durations of 0-14 weeks). Companies that are not as mature in S&OP process definition either
limit their focus in S&OP to the operational period (short-term period of 0-14 weeks) or plan in
isolation (never connect the tactical planning to day-to-day operations).
Page 10
Figure 5. Comparison of Effective S&OP Processes to Baseline S&OP Execution
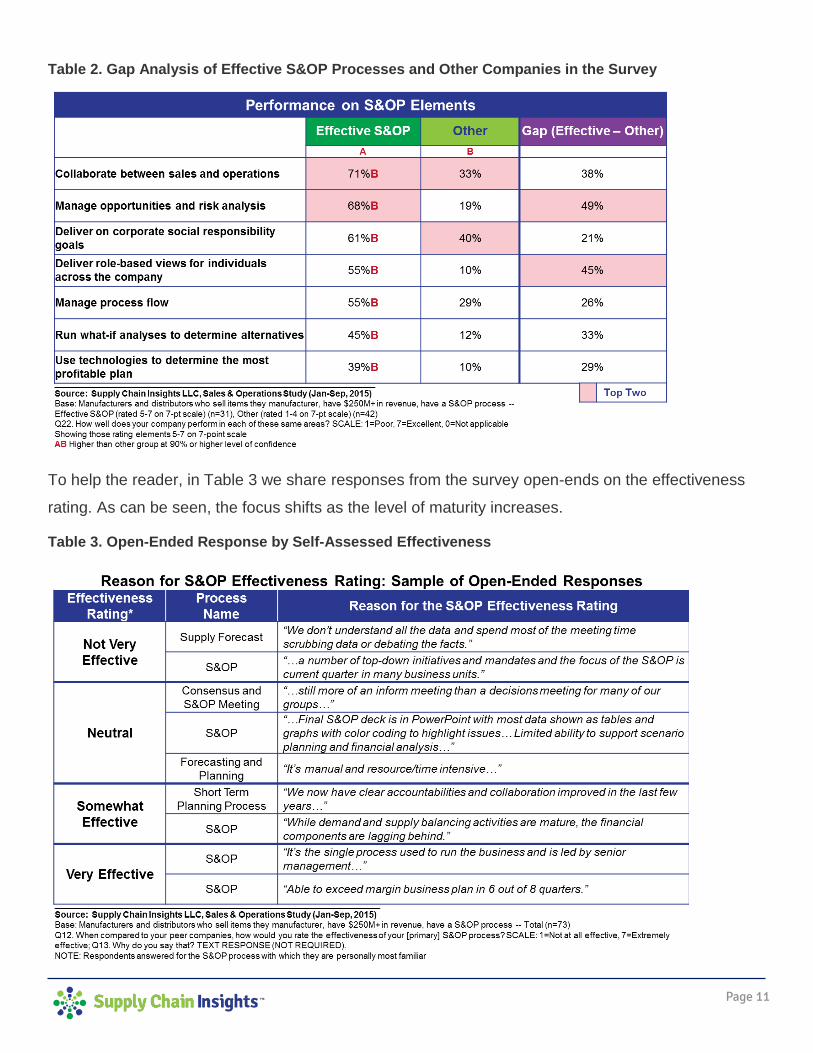
What Is S&OP Effectiveness? Companies that rate their S&OP processes as more effective, as shown in Table 2, are more likely to
use supply chain planning technologies in those processes. In these companies there is greater
alignment between sales and operations with a focus on “what-if” optimization analysis. We also find
these companies tend to be better at modeling supply processes to be able to optimize a feasible
operational plan. Those rating their S&OP processes more effective have role-based views for
planners and are more likely to use the technologies to determine a profitable plan. These differences
are shared in Table 2.
Page 11
Table 2. Gap Analysis of Effective S&OP Processes and Other Companies in the Survey
To help the reader, in Table 3 we share responses from the survey open-ends on the effectiveness
rating. As can be seen, the focus shifts as the level of maturity increases.
Table 3. Open-Ended Response by Self-Assessed Effectiveness

Page 12
What Is the Value Proposition of Sales and Operations Planning? Those with a more effective S&OP process are more aligned, agile and balanced. In this section we
define and share the benefits of having these three important characteristics.
Value Proposition #1: Greater Cross-Functional Organizational Alignment.
Companies rating themselves more effective have tighter cross-functional alignment. The differences,
as shown in Figure 6, are significant at a 90% confidence level. While we are unsure which happens
first—whether an organization focused on alignment improves S&OP, or if better alignment is the
outcome of S&OP—we can see the impact of alignment in the open-ended responses. Companies
with greater alignment find it easier to conduct an effective S&OP process, and better alignment
improves the dynamic capabilities of the firm to adapt to market shifts.
We also know from our work on the Supply Chain Metrics That Matter that companies with greater
cross-functional alignment outperform peer groups at the intersection of operation margin and
inventory turns.
Figure 6. Impact of S&OP Effectiveness on Cross-functional Alignment
Page 13
Value Proposition #2: More Agile.
While many supply chain leaders want to be agile, there is no standard industry definition of supply
chain agility. In the quantitative research, we asked companies to define agility and measured
progress against their definition. In the qualitative research interviews, we defined supply chain agility
as the ability to have the same customer service, cost, and quality given the level of demand and
supply volatility. We then asked leaders for their insights on agility.
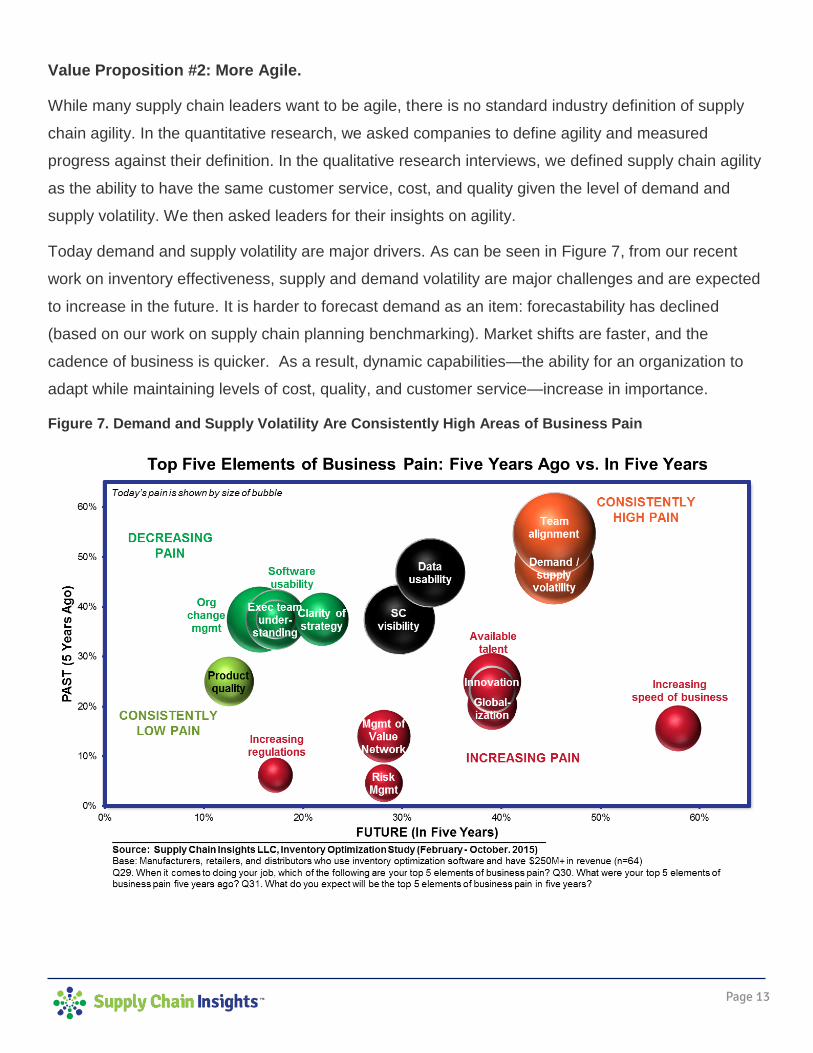
Today demand and supply volatility are major drivers. As can be seen in Figure 7, from our recent
work on inventory effectiveness, supply and demand volatility are major challenges and are expected
to increase in the future. It is harder to forecast demand as an item: forecastability has declined
(based on our work on supply chain planning benchmarking). Market shifts are faster, and the
cadence of business is quicker. As a result, dynamic capabilities—the ability for an organization to
adapt while maintaining levels of cost, quality, and customer service—increase in importance.
Figure 7. Demand and Supply Volatility Are Consistently High Areas of Business Pain

Page 14
Companies rating themselves higher on S&OP effectiveness rate themselves as being more agile. It
is a significant difference. While most companies in the survey rate themselves as more agile in 2015
versus 2014, the rate of improvement among those rating themselves as more effective in S&OP is
nearly double. We show this difference in Figure 8.
Figure 8. Comparison of Agility of Those with Effective S&OP versus Others in the Survey
Value Proposition #3: Greater Balance. In addition, companies rating themselves as more
effective in S&OP have greater balance between the "S" and the "OP." There is balance between the
focus on commercial and operational plans. This difference is significant at a 90% confidence level.
As shown in Figures 9a and 9b, only 34% of companies are balanced in their focus on the “S” and the
“OP”; however, among those rating their S&OP processes as effective, 60% are balanced.

Page 15
Figure 9a. Balance in S&OP
Figure 9b. Comparison of Balance of Those with Effective S&OP versus Others
Page 16
So, the next time someone asks you about the value of S&OP, stop and explain that it is the
foundation for growth. Spend some time with your colleagues to explain that S&OP improves agility
while making the organization less reactive and more strategic. An effective Sales and Operations
Planning process improves the dynamic capabilities of the firm. And, if they ask what you mean by
agility, state that it is the ability for the organization to have the same cost, quality, and customer
service given the level of demand and supply uncertainty. Then smile and ask if they think this is
important.
Recommendations As companies focus on improving the maturity and effectiveness of Sales and Operations Planning,
there are three recommendations embedded in the research for consideration: give planners time to
plan; train employees on how to get to data; and educate finance on how to best use the S&OP plan.:
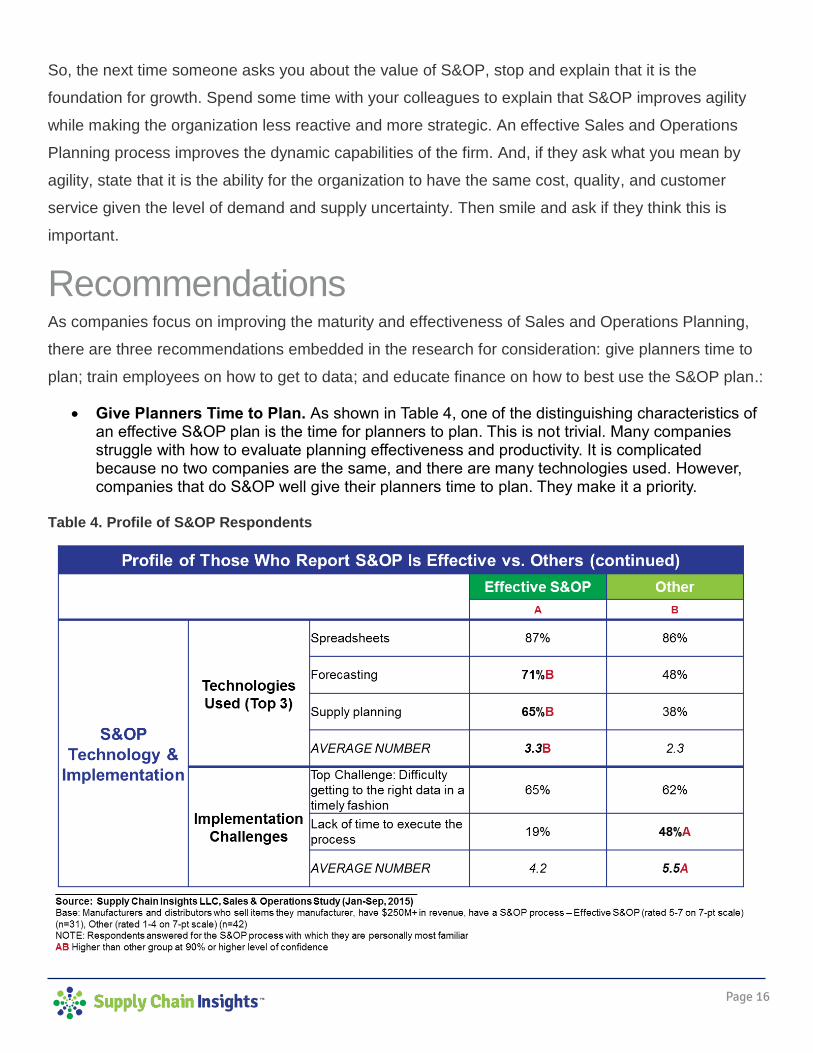
Give Planners Time to Plan. As shown in Table 4, one of the distinguishing characteristics of an effective S&OP plan is the time for planners to plan. This is not trivial. Many companies struggle with how to evaluate planning effectiveness and productivity. It is complicated because no two companies are the same, and there are many technologies used. However, companies that do S&OP well give their planners time to plan. They make it a priority.
Table 4. Profile of S&OP Respondents

Page 17
Focus on Helping the Right People Get to Data. When we shared this data with the roundtables of supply chain leaders who had completed the study, a number of attendees shared stories of how they had met the challenge of helping employees/planners to get to data. When it comes to data storage, every organization is different. One of the suggestions which resonated with the participants was teaching new employees tips and tricks for data storage and document sharing. Several commented they had developed this training as part of onboarding. As shown in Table 4 and Figure 10, S&OP processes use many technologies, but getting to data is a challenge for all companies. Make it a priority to train employees on data storage and retrieval.
Figure 10. S&OP Implementation Challenges
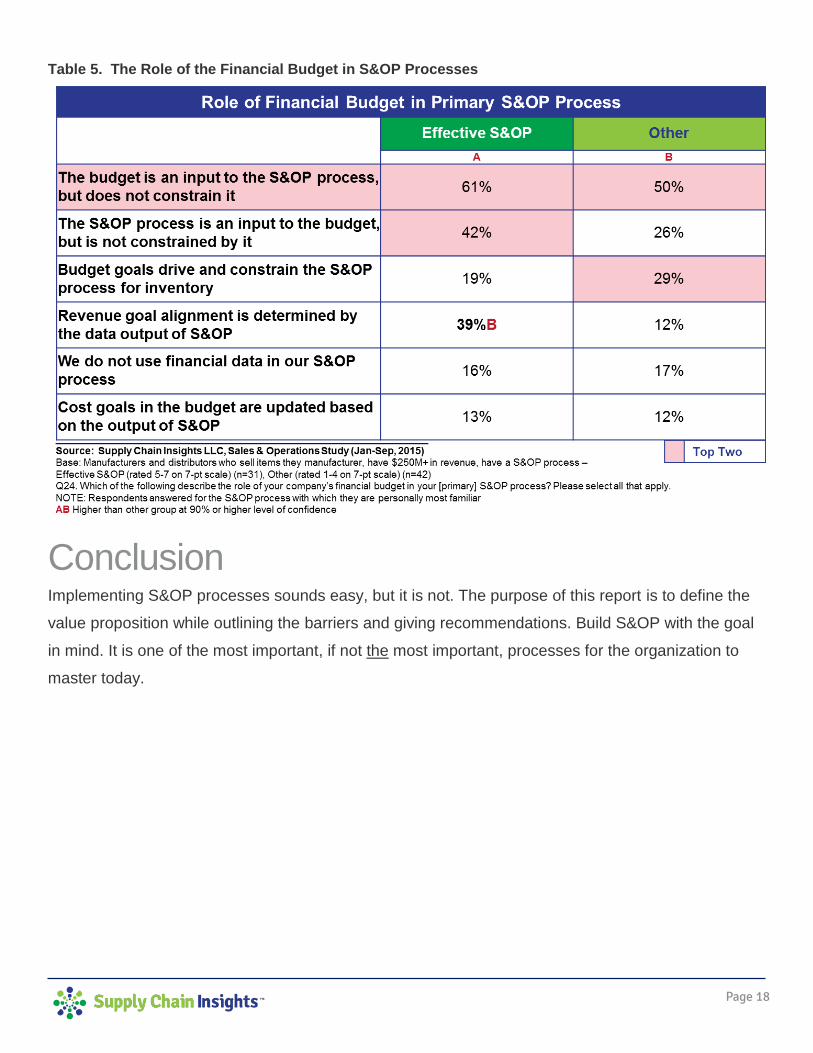
Educate the Financial Team on How to Use the S&OP Process in Budget Forecasting. One of the barriers in maturing S&OP processes is the role of the financial budget. While many companies believe the role of the S&OP process is to deliver on budget processes, as companies mature, they realize the S&OP plan should be an input into the budget process, but that the budget process should never constrain the S&OP Process. The goal is to keep the S&OP process aligned to the market. As shown in Table 5, this is a characteristic of effective S&OP processes. As a result, companies beginning their work on S&OP should train the financial team and hit this obstacle early.
Page 18
Table 5. The Role of the Financial Budget in S&OP Processes
Conclusion Implementing S&OP processes sounds easy, but it is not. The purpose of this report is to define the
value proposition while outlining the barriers and giving recommendations. Build S&OP with the goal
in mind. It is one of the most important, if not the most important, processes for the organization to
master today.

Page 19
Appendix In this section, we share the demographic information of survey respondents, along with research
findings to support the key insights listed in this report. Companies responding to this survey received
the final results, and had the option to participate in global roundtables to discuss the results and
network with other supply chain leaders.
The names, both of individual respondents and companies participating, are held in confidence. We
never share the names of the respondents. In this section, the demographics are shared to help the
readers of this report gain a better perspective on the results.
The demographics and additional charts are found in Figures A–H.
To help the reader, at the bottom of each image are the specific questions asked in the survey with
the survey demographics.
Figure A. Company Overview of Study Respondents

Page 20
Figure B. Industry Profile of Survey Respondents
Figure C. Supply Chain Leader Role, Title and Region
Page 21
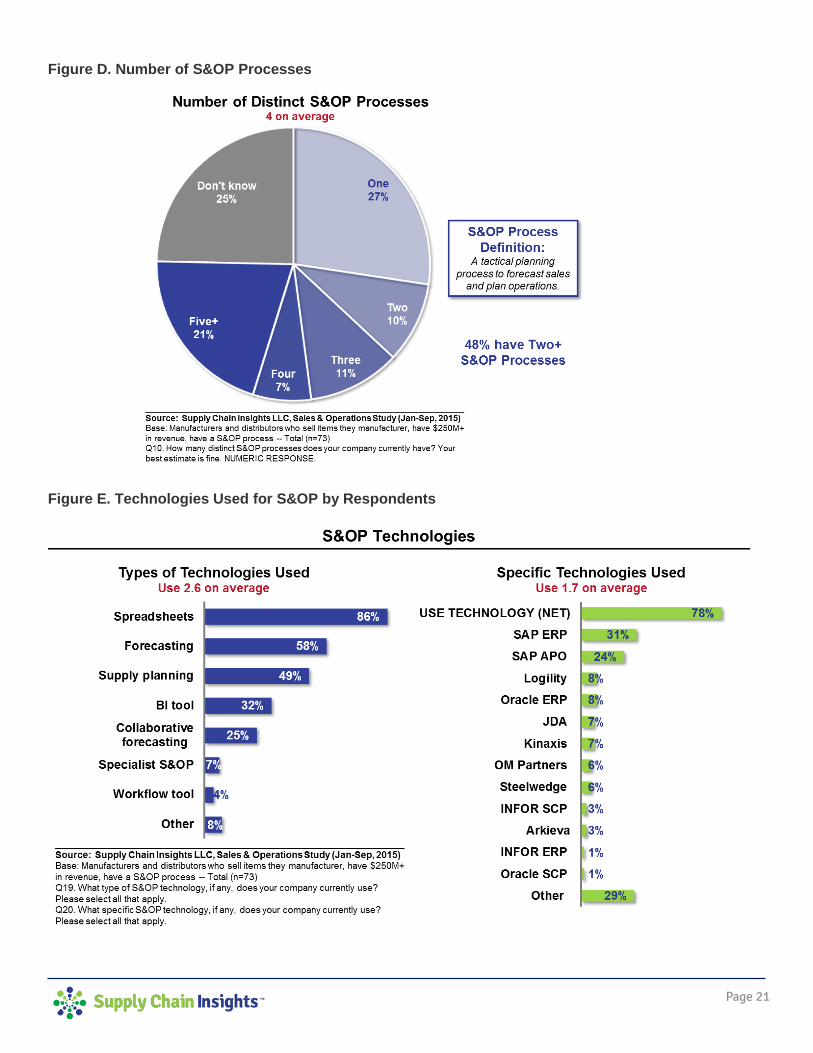
Figure D. Number of S&OP Processes
Figure E. Technologies Used for S&OP by Respondents

Page 22
Figure F. Connection of S&OP Planning to S&OP Execution
Figure G. Frequency and Process Alignment

Page 23
Figure H. Effectiveness of Primary S&OP Process
Other Reports in This Series This is part of a series of reports on Sales and Operations Planning and Inventory Management.
Readers may gain added value by accessing complimentary reports the use of supply chain
applications on our Supply Chain Insights website and in our Beet Fusion community.
Inventory Optimization in a Market-Driven World
Maximizing the ROI in Supply Chain Planning
Putting Together the Pieces: Selecting S&OP Technologies 2015
Research in Review 2014
Sales and Operations Planning: Current State of the Union
What Drives Inventory Effectiveness in a Market-Driven World?
Why Is S&OP So Hard?

Page 24
Terms to Know Getting clear on terms is often the first step to driving a supply chain transformation in Sales and
Operations Planning. To help teams, here we provide the definitions of the terms used in this report:
Concurrent Optimization. The use of technologies to solve optimization problems across source,
make, and deliver, in-memory together to rationalize cross-functional trade-offs.
Demand Latency. The time it takes for order take-away at the point of consumption to translate into an
order for a manufacturer. The slower the velocity at the point of consumption, the longer the demand
latency.
Inventory Configuration. A focus on form and function of inventory, along with techniques like
postponement and risk pooling, to improve inventory buffers.
Multi-Tier Inventory Optimization. The use of inventory optimization to determine optimization levels
at multiple nodes simultaneously.
Operational Planning. The planning process that stretches over the horizon of the slush period to the
freeze duration in manufacturing planning.
Postponement. An inventory strategy to delay steps of the conversion process until the demand for the
final product is known.
Tactical Planning. The period of planning that stretches from the freeze duration in manufacturing
planning to 12-18 months in the future. (While it varies by industry, with pharmaceutical companies
planning for three years, and high-tech companies planning for six to eight months, 12-18 months is the
average planning duration for tactical planning.)
Sales and Operations Planning. The cross-functional process of matching demand and supply plans
to balance demand and orchestrate the market response.
Page 25
About Supply Chain Insights LLC Founded in February, 2012 by Lora Cecere, Supply Chain Insights LLC is now in its fourth year of
operation. The Company’s mission is to deliver independent, actionable, and objective advice for
supply chain leaders. If you need to know which practices and technologies make the biggest
difference to corporate performance, we want you to turn to us. We are a company dedicated to this
research. Our goal is to help leaders understand supply chain trends, evolving technologies and
which metrics matter.
About Lora Cecere Lora Cecere (twitter ID @lcecere) is the Founder of Supply Chain Insights LLC and
the author of popular enterprise software blog Supply Chain Shaman currently read
by 5,000 supply chain professionals. She also writes as a Linkedin Influencer and
is a a contributor for Forbes. She has written four books. The first book, Bricks
Matter, (co-authored with Charlie Chase) published in 2012. The second book, The
Shaman’s Journal 2014, published in September 2014; the third book, Supply
Chain Metrics That Matter, published in December 2014; and the fourth book, The
Shaman’s Journal 2015, published in September 2015.
With over 12 years as a research analyst with AMR Research, Altimeter Group, and Gartner
Group and now as the Founder of Supply Chain Insights, Lora understands supply chain. She has
worked with over 600 companies on their supply chain strategy and speaks at over 50 conferences a
year on the evolution of supply chain processes and technologies. Her research is designed for the
early adopter seeking first mover advantage.