what is the activation energy of the reaction between
TRANSCRIPT
What is the activation energy of the reaction between potassium bromide and potassium bromate?
1
Determination of the activation energy between bromide and bromate
1. Aim.
The aim of this experiment is to determine the activation energy of the reaction between potassium bromideKBr and potassium bromateKBrO3 .
2. Introduction
Chemical kinetics is the topic that I enjoyed the most during my IB chemistry SL course. This is because it provided me with a deeper insight into how particles (such as atom or molecules) interact with each other as they form new species. My interest for this topic led me to go beyond what is taught in class. I started exploring the rate law, the integrated form of rate expression as well as the reaction mechanisms. I was intrigued by how the rate constant is related to the temperature through the Arrhenius equation and how that simple mathematical relation provides the possibility of determining the activation energy of a reaction. I found the idea of calculating the activation energy of a reaction experientially very appealing.
Therefore I have decided to focus this investigation on determining the activation energy of the reaction between KBr and KBrO3 .
3. Background.
3.1 Chemical kinetics
For a reaction to occur, particles must collide with the correct orientation and with a kinetic energy larger than that of the activation energy barrier. The Activation energy Ea is therefore the minimum amount of kinetic energy required for the reactants to have in order of the reaction to take place. This energy often goes into breaking the bonds or overcoming the repulsive forces between the reactants. Once this energy is supplied to particles they would achieve a transition state in which product would be formed.
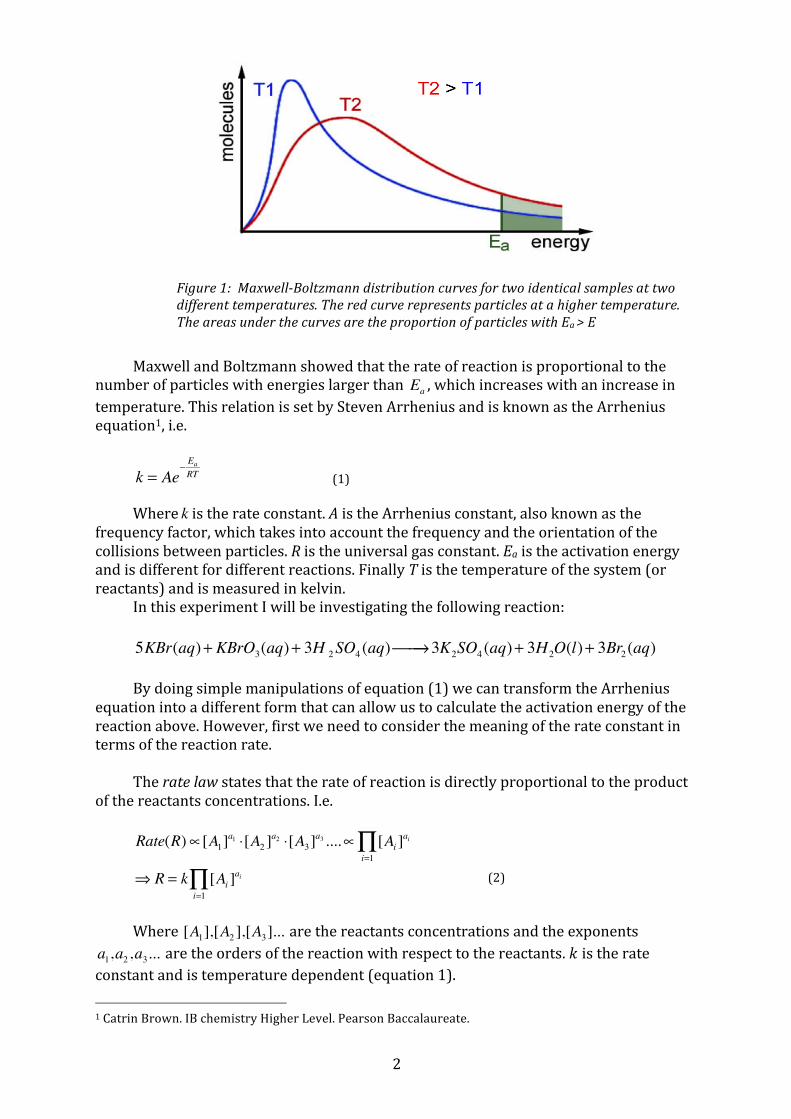
Now, if the temperature of the reactants increases, their average speeds would increase and hence the frequency of collision would also increase. By the collision theory, an increase in the frequency of collision would result in an increase in the rate of reaction. Furthermore, with an increase in temperature particles would a have higher internal energy (total kinetic and potential energy). Consequently, the proportion of particles having energy larger than that of the activation energy would also increase.
Figure 1 depicts two Maxwell-‐Boltzmann distribution curves of a sample of reactants. It is clearly shown that for higher temperature (red curve) the proportion (or the probability) of the particles with energies exceeding the activation energy is larger. This is shown by the areas under the two curves.
2
Maxwell and Boltzmann showed that the rate of reaction is proportional to the number of particles with energies larger than Ea , which increases with an increase in temperature. This relation is set by Steven Arrhenius and is known as the Arrhenius equation1, i.e.
k = Ae− EaRT
Where k is the rate constant. A is the Arrhenius constant, also known as the frequency factor, which takes into account the frequency and the orientation of the collisions between particles. R is the universal gas constant. Ea is the activation energy and is different for different reactions. Finally T is the temperature of the system (or reactants) and is measured in kelvin.
In this experiment I will be investigating the following reaction:
5KBr(aq)+ KBrO3(aq)+ 3H 2SO4 (aq)⎯→⎯ 3K2SO4 (aq)+ 3H2O(l)+ 3Br2 (aq)
By doing simple manipulations of equation (1) we can transform the Arrhenius equation into a different form that can allow us to calculate the activation energy of the reaction above. However, first we need to consider the meaning of the rate constant in terms of the reaction rate.
The rate law states that the rate of reaction is directly proportional to the product of the reactants concentrations. I.e.
Rate(R)∝[A1]a1 ⋅[A2 ]
a2 ⋅[A3]a3 ....∝ [Ai ]
ai
i=1∏
⇒ R = k [Ai ]ai
i=1∏
Where [A1],[A2 ],[A3]... are the reactants concentrations and the exponents a1,a2,a3... are the orders of the reaction with respect to the reactants. 𝑘 is the rate constant and is temperature dependent (equation 1).
1 Catrin Brown. IB chemistry Higher Level. Pearson Baccalaureate.
Figure 1: Maxwell-‐Boltzmann distribution curves for two identical samples at two different temperatures. The red curve represents particles at a higher temperature. The areas under the curves are the proportion of particles with Ea > E
(1)
(2)
3
Therefore, the rate expression of the reaction between the bromide and the bromate in an acidified solution is:
R = k[Br− ]a1 ⋅[BrO3− ]a2 ⋅[H + ]a3
It can be seen from the above expression that if the temperature of the system is
increased then the rate constant would increase and hence the rate of reaction but the concentrations of the reactants would not be affected. Therefore, if the concentrations of the reactants are kept constant for the reaction at different temperature then the following holds:
R ∝ k⇔ R ∝ e− EaRT
⇒ R = Be− EaRT
Where B is a numerical constant. Now the rate of reaction R, by definition, is the
rate of change of concentration of a reactant (or a product) over a change in time. Hence we can rewrite the above expression as:
ΔcΔt
= Be− EaRT
Taking the natural logarithm of both sides of the equation gives:
ln ΔcΔt
⎛⎝⎜
⎞⎠⎟ = ln Ae
− EART⎛
⎝⎜⎞⎠⎟⇔ ln(Δc)− ln(Δt) = ln A( )− EA
R⋅ 1T
⇒ ln(Δt) = ln(Δc)− ln A( ) + EA
R⋅ 1T
But Δc is constant since increasing (or decreasing) the temperature of the reaction
would not affect the concentrations of the reactants. It is only the time Δt for which the reaction occurs that will be effected. Therefore, this finally gives:
∴ ln(Δt) = 1T
EA
R⎛⎝⎜
⎞⎠⎟ +C
Where C is a constant.
Thus by plotting a graph of ln(Δt)as the y-‐axis against 1T as the x-‐axis we would
acquire a straight line for which we can determine the activation energy Ea from its slope.
(3)
4
3.2 The reaction between KBr and KBrO3. Let us take a closer look at the reaction between the bromide and the bromate ions
that take place in an acidified solution. The ionic equation of the reaction is:
5Br− + BrO3− + 5H + ⎯→⎯ 3Br2 + 3H2O
This is a redox reaction in which theBr− is oxidized andBrO3
− is reduced. Both the potassium and the sulfate ions are spectators in the this redox reaction as their oxidation states do not change. Hence they do not take part in the reaction.
One way of recording the time taken for this reaction to occur at different
temperatures involves adding a few drops of methyl red indicator. The bromine that is formed in this reaction would react vigorously with the methyl and hence bleaches the indicator. Thus it would be convenient use this as an “end point”.
A problem would immediately arise from this method of recording the time of the
reaction, which is that the reaction itself occurs at very fast rate under room’s temperature. Therefore it would not be achievable to record the reaction.
However, it is possible to slow down the reaction without the need of having a very
low temperature. This would involve adding an amount phenol to the reaction mixture. The function of the phenol will be to slow the reaction by providing an intermediate state before the bromine produced in the reaction bleaches the indicator. The phenol will react with bromine in the following way:
C6H5OH + 3Br2 ⎯→⎯ C6H2Br3OH + 3HBr Once all the phenol has been consumed, the remaining bromine would than react
with the methyl red indicator, dissipating the color. This would make the time taken for the reaction to reach the end point slow enough to be recorded at room’s temperature or perhaps or higher. Then we may use the relation (equation 3) that we derived previously to determine the activation energy of the reaction between bromine and bromate.
4. Variables The independent variable in this experiment is temperature of the reactants while
the dependent variable is the time taken for the reaction to reach the end point. The controlled variables in this experiment are the concentrations of the solution used. That is, Br−⎡⎣ ⎤⎦, BrO3
−⎡⎣ ⎤⎦, C6H5OH[ ]and H +⎡⎣ ⎤⎦ are all kept constants throughout the procedure.
5
5. Procedure Before starting the experiment, aqueous solutions of the following were prepared:
200ml of 0.01 moldm-‐3 phenol, 200ml of 0.5 moldm-‐3 Sulfuric acid, 200ml of 0.1 moldm-‐3 potassium bromide and 200ml of 0.02 moldm-‐3 of potassium bromate. The method then followed the same as that proposed by Graham Hill and John Holman and is known as the clock method. It involved the following steps:
1) A pipette was used to put 10ml of each of phenol, bromide and bromate
solutions into a test tube. Then 4-‐5 drops of methyl red indicator was added to the tube and a cork was used to stopper the test tube.
2) 5ml of sulfuric acid was pipetted to another test tube and a cork was used to stopper the tube.
3) Both tubes were then immersed in a water path of varying temperatures that ranges between 20°C to 60°C. The temperatures chosen in this experiment are: 20°C, 30°C, 40°C, 50°C and 60°C. Both tubes were left in the water bath for at least 5 minutes so as to reach thermal equilibrium with the water in the water bath.
4) Both tubes were than quickly mixed and the time was recorded unit the red color of the methyl disappeared.
5) The same process is repeated at 5 different temperatures and for each measurement three trials were made so that random errors can be minimized.
The reason why these temperatures were chosen was so that the reaction will
proceed at a reasonable, not too fast or too slow. Having a temperature above 60°C would also mean that the temperature of the remaining Br2 would exceed its boing point. Consequently the cork could burst off the test tube containing the solution due to the high pressure. On the other hand, a temperature below 20°C would take a considerable amount of time for the color of indicator to bleach. Therefore not sufficient data would be collected the time allowed for the performance of the experiment.
It is important to notice that for the color of the indicator to disappear it is
essential to have an excess amount of bromide/bromate solution. This is because once all the phenol is consumed there should be some bromine left to react with the methyl red indicator. This is the reason why more amount of bromide/bromate than phenol in test tubes.
6. Safety considerations.
For safety considerations it is highly instructive to wear gloves when preparing the
phenol solution to avoid any contact of the phenol with the skin. This is because phenol is a highly corrosive chemical and causes irritation to the eyes and the skin. Further, bromide/bromate as well as sulfuric acid are also corrosive chemicals so they should be handled with care. In addition, it is advised to use test tube holders for high temperature such as 50°C or 60°C.
6
7. Results.
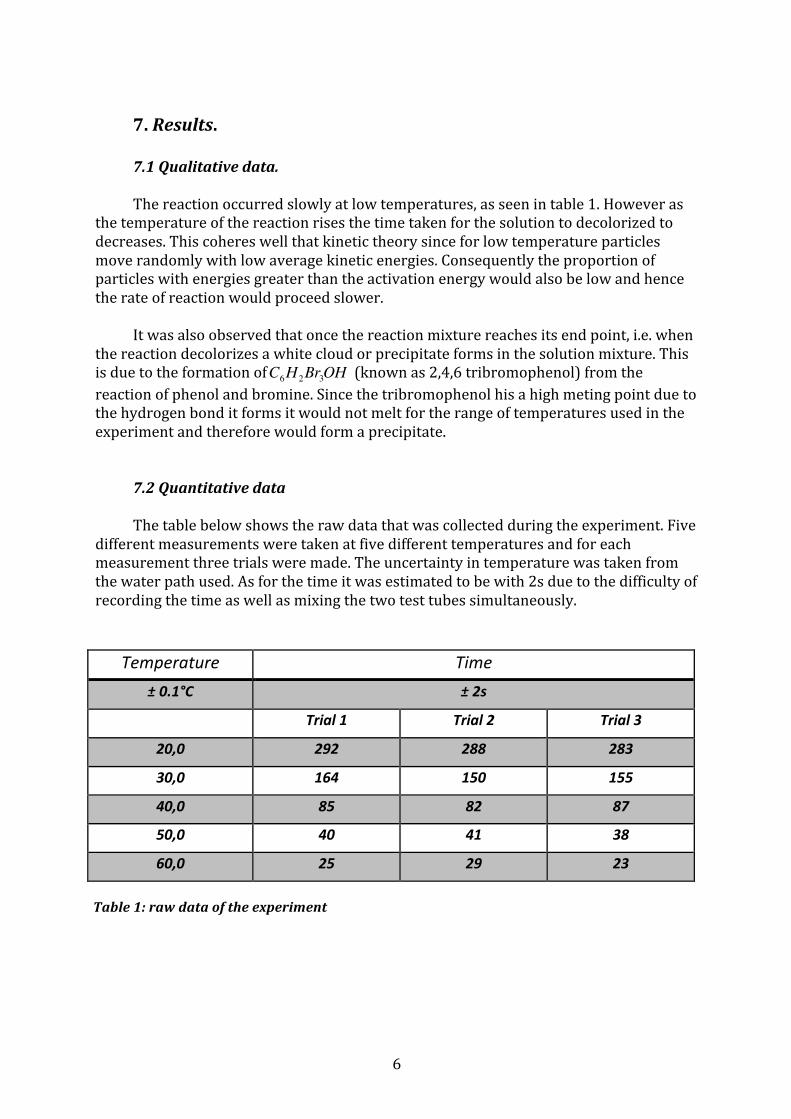
7.1 Qualitative data. The reaction occurred slowly at low temperatures, as seen in table 1. However as
the temperature of the reaction rises the time taken for the solution to decolorized to decreases. This coheres well that kinetic theory since for low temperature particles move randomly with low average kinetic energies. Consequently the proportion of particles with energies greater than the activation energy would also be low and hence the rate of reaction would proceed slower.
It was also observed that once the reaction mixture reaches its end point, i.e. when
the reaction decolorizes a white cloud or precipitate forms in the solution mixture. This is due to the formation ofC6H2Br3OH (known as 2,4,6 tribromophenol) from the reaction of phenol and bromine. Since the tribromophenol his a high meting point due to the hydrogen bond it forms it would not melt for the range of temperatures used in the experiment and therefore would form a precipitate.
7.2 Quantitative data The table below shows the raw data that was collected during the experiment. Five
different measurements were taken at five different temperatures and for each measurement three trials were made. The uncertainty in temperature was taken from the water path used. As for the time it was estimated to be with 2s due to the difficulty of recording the time as well as mixing the two test tubes simultaneously.
Temperature Time ± 0.1°C ± 2s
Trial 1 Trial 2 Trial 3
20,0 292 288 283
30,0 164 150 155
40,0 85 82 87
50,0 40 41 38
60,0 25 29 23
Table 1: raw data of the experiment
7
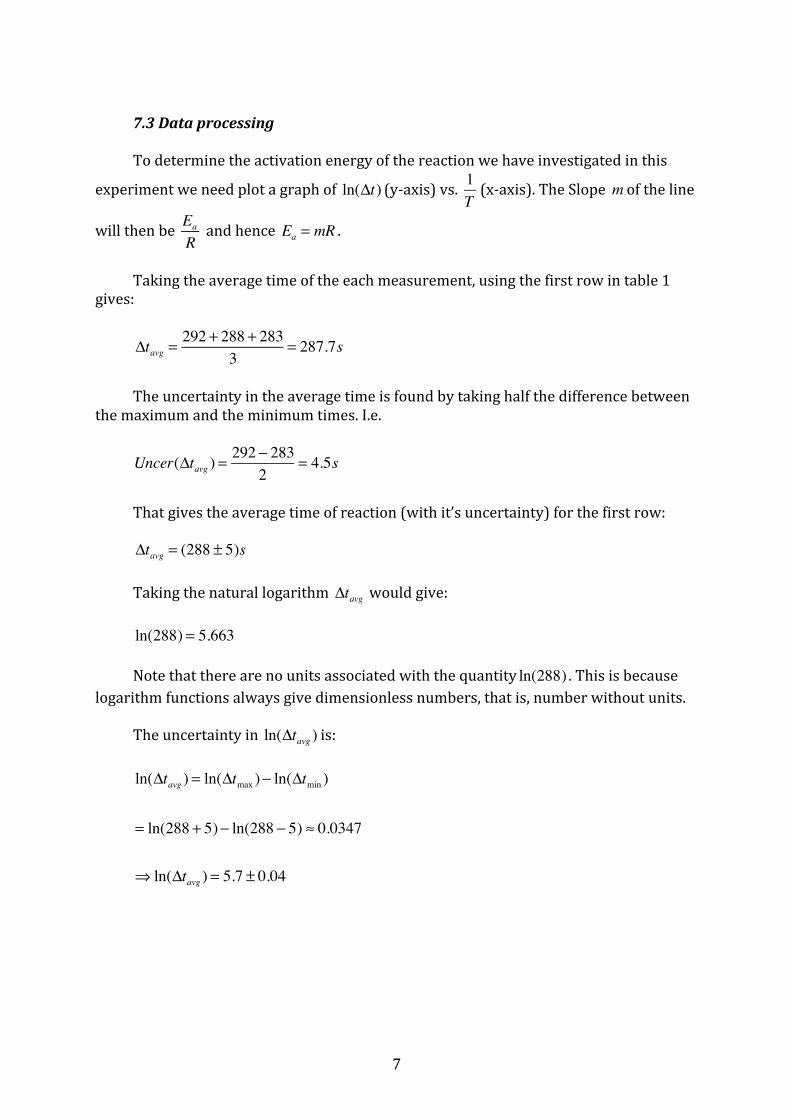
7.3 Data processing To determine the activation energy of the reaction we have investigated in this
experiment we need plot a graph of ln(Δt) (y-‐axis) vs. 1T(x-‐axis). The Slope m of the line
will then be Ea
R and hence Ea = mR .
Taking the average time of the each measurement, using the first row in table 1
gives:
Δtavg =292 + 288 + 283
3= 287.7s
The uncertainty in the average time is found by taking half the difference between
the maximum and the minimum times. I.e.
Uncer(Δtavg ) =292 − 283
2= 4.5s
That gives the average time of reaction (with it’s uncertainty) for the first row: Δtavg = (288 ± 5)s Taking the natural logarithm Δtavg would give: ln(288) = 5.663 Note that there are no units associated with the quantity ln(288) . This is because
logarithm functions always give dimensionless numbers, that is, number without units. The uncertainty in ln(Δtavg ) is: ln(Δtavg ) = ln(Δtmax )− ln(Δtmin )
= ln(288 + 5)− ln(288 − 5) ≈ 0.0347
⇒ ln(Δtavg ) = 5.7 ± 0.04
8
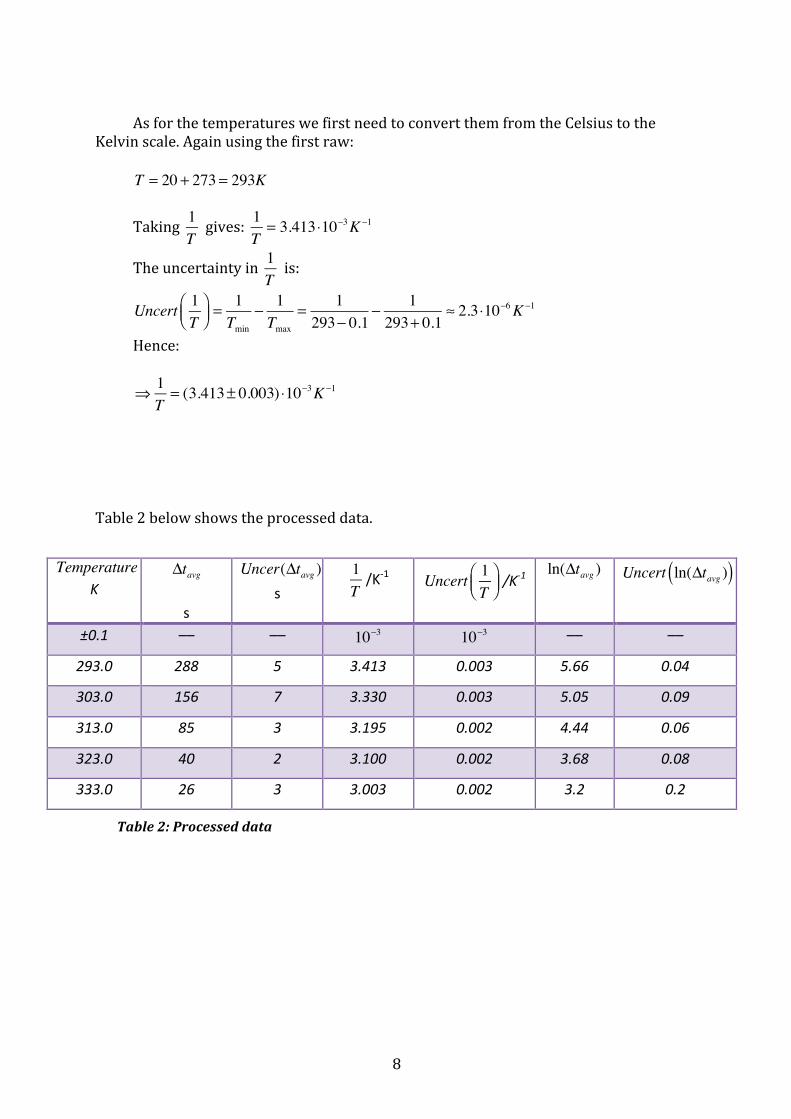
As for the temperatures we first need to convert them from the Celsius to the
Kelvin scale. Again using the first raw: T = 20 + 273= 293K
Taking 1T gives: 1
T= 3.413⋅10−3K −1
The uncertainty in 1T is:
Uncert 1T
⎛⎝⎜
⎞⎠⎟ =
1Tmin
− 1Tmax
= 1293− 0.1
− 1293+ 0.1
≈ 2.3⋅10−6K −1
Hence:
⇒ 1T= (3.413± 0.003) ⋅10−3K −1
Table 2 below shows the processed data.
Temperature K
Δtavg s
Uncer(Δtavg ) s
1T/K-‐1 /K-‐1
ln(Δtavg ) Uncert ln(Δtavg )( )
±0.1 –– –– 10−3 10−3
–– ––
293.0 288 5 3.413 0.003 5.66 0.04
303.0 156 7 3.330 0.003 5.05 0.09
313.0 85 3 3.195 0.002 4.44 0.06
323.0 40 2 3.100 0.002 3.68 0.08
333.0 26 3 3.003 0.002 3.2 0.2
Uncert 1T
⎛⎝⎜
⎞⎠⎟
Table 2: Processed data
9
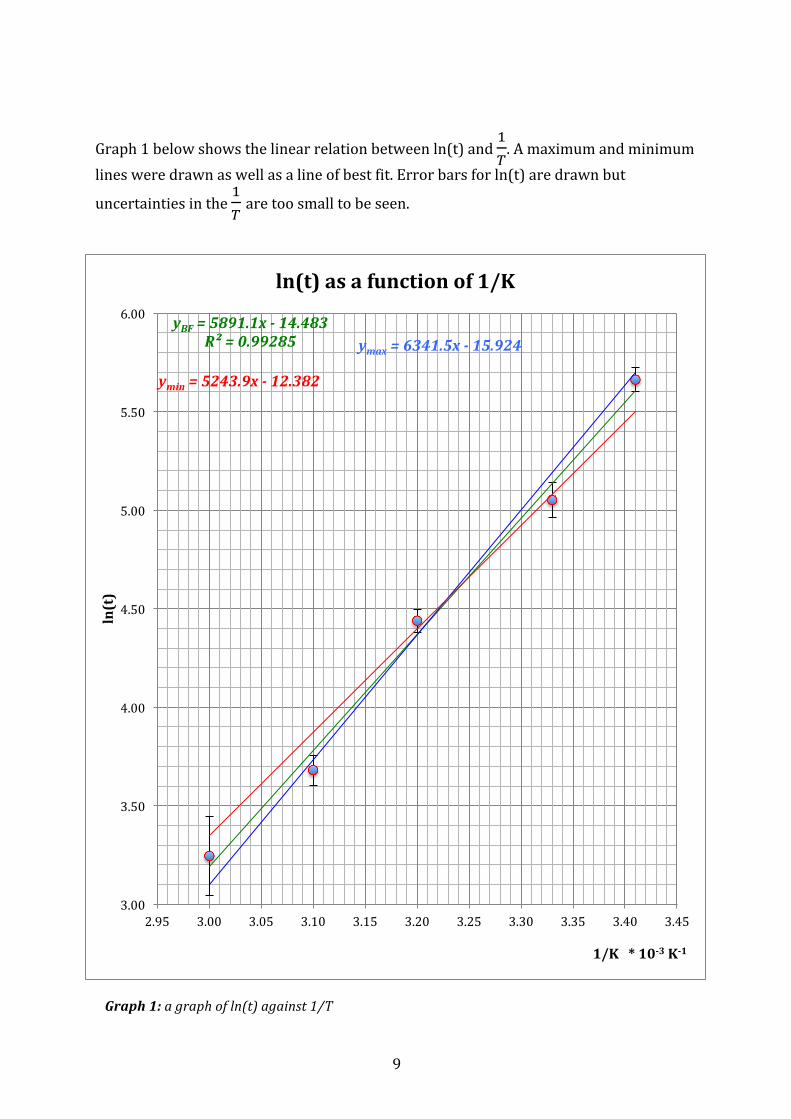
Graph 1 below shows the linear relation between ln(t) and !!. A maximum and minimum
lines were drawn as well as a line of best fit. Error bars for ln(t) are drawn but
uncertainties in the !! are too small to be seen.
yBF = 5891.1x -‐ 14.483 R² = 0.99285 ymax = 6341.5x -‐ 15.924
ymin = 5243.9x -‐ 12.382
3.00
3.50
4.00
4.50
5.00
5.50
6.00
2.95 3.00 3.05 3.10 3.15 3.20 3.25 3.30 3.35 3.40 3.45
ln(t)
1/K * 10-‐3 K-‐1
ln(t) as a function of 1/K
Graph 1: a graph of ln(t) against 1/T
10
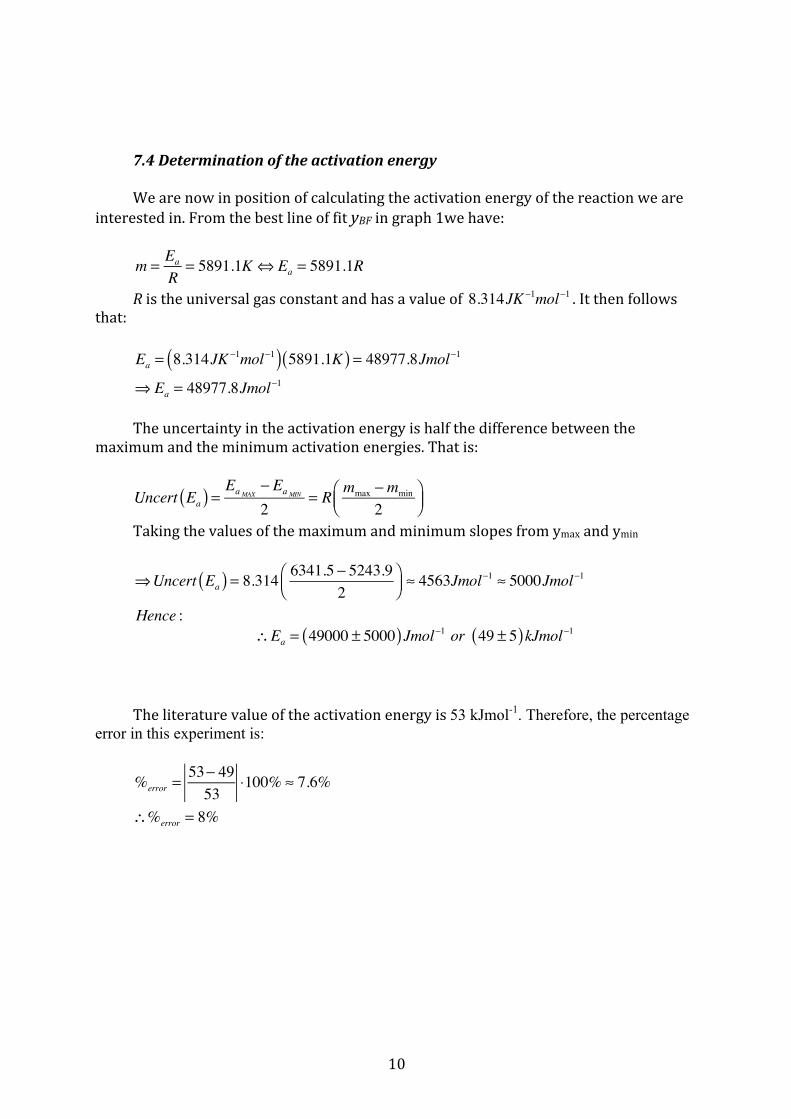
7.4 Determination of the activation energy We are now in position of calculating the activation energy of the reaction we are
interested in. From the best line of fit yBF in graph 1we have:
m = Ea
R= 5891.1K ⇔ Ea = 5891.1R
R is the universal gas constant and has a value of 8.314JK −1mol−1 . It then follows that:
Ea = 8.314JK −1mol−1( ) 5891.1K( ) = 48977.8Jmol−1
⇒ Ea = 48977.8Jmol−1
The uncertainty in the activation energy is half the difference between the
maximum and the minimum activation energies. That is:
Uncert Ea( ) = EaMAX− EaMIN
2= R mmax −mmin
2⎛⎝⎜
⎞⎠⎟
Taking the values of the maximum and minimum slopes from ymax and ymin
⇒Uncert Ea( ) = 8.314 6341.5 − 5243.92
⎛⎝⎜
⎞⎠⎟ ≈ 4563Jmol
−1 ≈ 5000Jmol−1
Hence : ∴Ea = 49000 ± 5000( )Jmol−1 or 49 ± 5( )kJmol−1
The literature value of the activation energy is 53 kJmol-1. Therefore, the percentage
error in this experiment is:
%error =53− 4953
⋅100% ≈ 7.6%
∴%error = 8%
11
8. Conclusion and evaluation 8.1 Conclusion. The aim of this experiment was to determine the activation energy of the reaction
between bromide and bromate. The methodology was carried out to measure the time taken for the color of the indicator to bleach at different temperatures. The collected data were then processed and a graph was drawn according to a linear relation derived from the Arrhenius equation.
Graph 1 shows a strong linear correlation between ln(t) and !! with R2 = 0.993. The
activation energy was then determined from the slope of the line of best fit and was shown to be 49kJmol−1with and uncertainty of 5 kJmol−1 . This result was in good agreement with the literature value (53 kJ mol-1), which gave a percentage uncertainty of 8%.
The affect of temperature on the rate of reaction is more clearly seen in table 1. As temperature increases the time taking for the reaction to be completed decreases and this coheres well with the collision theory.
8.2 Evaluation
Although the experimental result was fairly close to the literature value, the difference is not negligible. Looking at graph 1 we see that the best line of fit lies on all error bars and thus suggests that there is small random errors in the experimental procedure. Therefore this means that a systematic error must have been present in the procedure.
One major problem that I encountered while performing the experiment was that I
could not record the time and mixing both solution in the tubes concurrently. Thus the recorded time of the reaction for all measurements and trials will be lower than their actual values. Accordingly ln(t) will be smaller and hence the activation energy of the reaction. One possible improvement would be that two people performing the experiment, one mixing the tubes whiles the other recording the time.
Another error that may have affected the result of the experiment was the fact that
the temperatures of the solutions in the test tubes were assumed to be the same as that of the water path. Although the temperature of the water path was measured with a high accuracy, that does not necessarily mean that actual temperature of the tubes are the same. Therefore it may be a good idea to actually measure the temperature of the tubes before mixing the solutions using a thermometer.
It would have been favorable if more trials were conducted so as to reduce the
random errors in the experiment. However, since there was not enough time only three trials for each measurement was taken.
12
8.3 Extension.
In this experiment the clock method was used to determine the time taken for the reaction to reach the end point. However, there is a alternative method of determining the activation energy of the reaction between bromide and bromate. This method involves using the ionic property of the reactants to measure the electrical conductivity of the reaction. If we consider the ionic reaction of bromide and bromate in an acidified solution again:
Since all the reactants are electrically charged they would conduct electricity. The products formed contain no charged ions and therefore do not conduct any electric current. Therefore by measuring the time taking for the electrical conductivity of the reaction to approach zero at different temperatures would give a possibility of determining the activation energy of the reaction (using the formula (3)). This would provide a excellent way of comparing and evaluating which method is most appropriate for determining the activation energy of the reaction between bromide and bromate.
8. Reference
1. Catrin Brown; IB Chemistry HL, Pearson Baccalaureate; second edition.
2. Garham Hill &John Holman. Chemistry in Context: Laboratory Manual and StudyGuide, 5th Edition, p 54-‐55, Surrey, Nelson
3. https://www.academia.edu/9940865/bromide_bromate_hydrogen_ionsLast access: 26/11/2015
4. http://scienceaid.co.uk/chemistry/physical/reactionrate.htmlLast access: 26/11/2015
5. http://www.eoearth.org/view/article/153418/Last access: 26/11/2015
6. https://www.scribd.com/doc/270648124/IA-‐Activation-‐EnergyLast access: 26/11/2015
5Br− + BrO3− + 5H + ⎯→⎯ 3Br2 + 3H2O