what is the achievement gap? - stand for childrenstand.org/sites/default/files/oregon/a closer look...
TRANSCRIPT

1

What is the Achievement Gap?
• These gaps are Red Flags that tells us some of our youth are not on track to graduate high school prepared for college or career.
• The difference in scores between two groups of students (male and female, African American and White, Hispanic and White).
2

The achievement gap matters…
• Students who fall behind in school are more likely to dropout.
• Young people without the educational basics find it more difficult to get jobs that provide adequate pay and security.
• They are more likely to become incarcerated and utilize public assistance.
3

The achievement gap matters to our entire community…
Achievement gaps create “the economic equivalent of
a permanent national recession -- substantially
larger than the deep recession the country is currently experiencing.”
McKinsey & Company, 2009 4

Tonight’s Key Questions
• What does Oregon’ achievement gap look like? Who’s affected by it?
• What contributes to the achievement gap?
• What can we do about it?
5

Our Achievement Gap
The National Assessment for Educational Progress (NAEP) is often called “the nation’s report card”, and considered our best objective measure across states.
We can look at student scores in 4th, 8th and 12th grades and see how they compare to one another. Oregon is one of five states where the overall achievement gap WIDENED between 2003 and 2007.
6

Are Oregon students learning basic skills?
285 290 296
264 264 273 270
241
100
150
200
250
300
350
All White Asian Black Hispanic NativeAmerican
Low-Income EnglishLanguageLearner
2009 NAEP Oregon Math Achievement Grade 8
Average Student Score by Ethnicity
Proficient Skill Level
Basic Skill Level
7

Half of Oregon’s 561,000 public school students qualify for free or reduced-price lunch, compared to 30 percent in 1997
Fourth Grade Achievement & Income
170
180
190
200
210
220
230
240
Ave
rage
Stu
de
nt
Sco
re (
1-5
00
)
Oregon 4th Grade Reading Achievement - NAEP
Eligible for free or reduced-price lunch Not eligible
2003
2009
This 27-point gap
equals about 2.5
years of academic progress
8

Fourth Grade Reading & English Language Learners
170
180
190
200
210
220
230
2002 2003 2005 2007 2009
Oregon 4th Grade Reading Achievement ELL Students
English Language Learners Non-ELL students
42-point gap
65,000 Oregon students speak a primary language other than English, a 387 percent increase since 1997. 9

Fourth Grade Reading & Ethnicity
180
185
190
195
200
205
210
215
220
225
230
2005 2007 2009
Oregon NAEP 4th Grade Reading Achievement & Ethnicity
White Asian/Pacific Islander Black Hispanic Native American
31 points
Students of color comprised eighteen percent of Oregon public school enrollment in 1997. Today, students of color make up about one-third of student enrollment. 10

Who makes it to graduation day?
• State data for 2009-10 shows that African American and Native American students dropped out at nearly twice the rate of their white peers.
On Time Graduation
50 %
Non-Graduates
50 %
Class of 2010 African American & Native American
Students
On Time Graduation
50%
Non-Graduates
50%
Class of 2010 English Language Learners
11
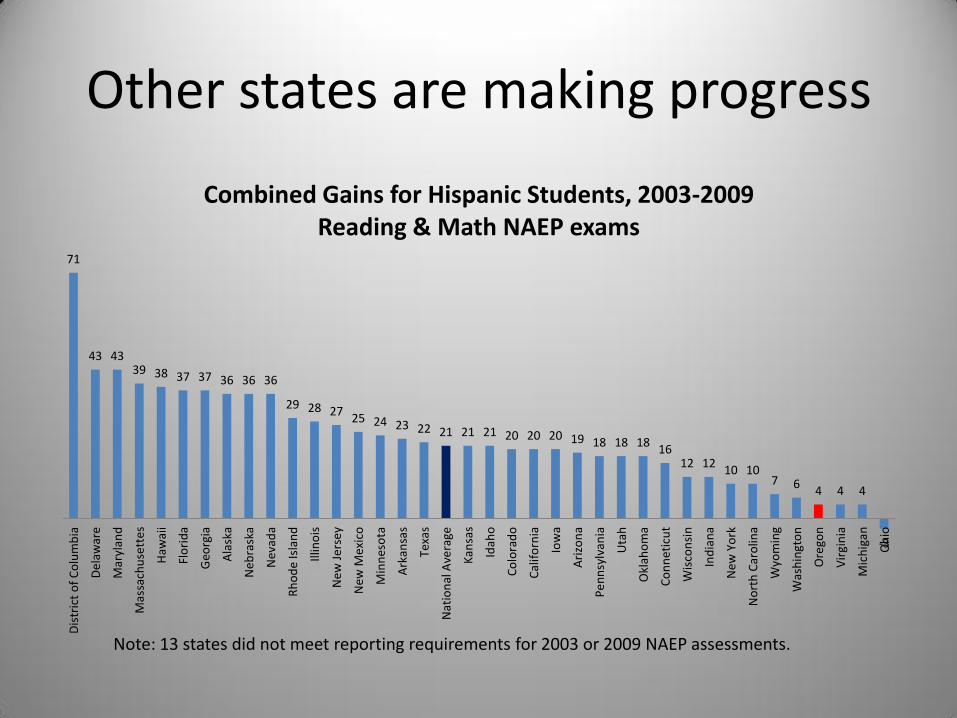
Other states are making progress
71
43 43 39 38 37 37 36 36 36
29 28 27 25 24 23 22 21 21 21 20 20 20 19 18 18 18
16 12 12
10 10 7 6
4 4 4
-3
Dis
tric
t o
f C
olu
mb
ia
De
law
are
Mar
ylan
d
Mas
sach
use
ttes
Haw
aii
Flo
rid
a
Geo
rgia
Ala
ska
Neb
rask
a
Nev
ada
Rh
od
e Is
lan
d
Illin
ois
New
Je
rse
y
New
Mex
ico
Min
nes
ota
Ark
ansa
s
Texa
s
Nat
ion
al A
vera
ge
Kan
sas
Idah
o
Co
lora
do
Cal
ifo
rnia
Iow
a
Ari
zon
a
Pe
nn
sylv
ania
Uta
h
Okl
aho
ma
Co
nn
etic
ut
Wis
con
sin
Ind
ian
a
New
Yo
rk
No
rth
Car
olin
a
Wyo
min
g
Was
hin
gto
n
Ore
gon
Vir
gin
ia
Mic
hig
an
Oh
io
Combined Gains for Hispanic Students, 2003-2009 Reading & Math NAEP exams
Note: 13 states did not meet reporting requirements for 2003 or 2009 NAEP assessments.
12

Combined Academic Gains for low-income students, NAEP Reading & Math exams, 2003-2009
47
44
40 38
37
34 32
29 28
26 26 25 25
24 24 23
22 22 21 21 21 21
20 20 20 19 19 19 19
18 18 17
16 16 16 16 14 14 14
13 12
11 10
9 8
6 5 5 5
2 2
-9
Flo
rid
a
Mar
ylan
d
Dis
tric
t o
f C
olu
mb
ia
New
Je
rse
y
Mas
sach
use
ttes
Pe
nn
sylv
ania
Geo
rgia
Ten
nes
see
Nev
ada
Ind
ian
a
Ala
bam
a
New
Ham
psh
ire
Ala
ska
New
Mex
ico
New
Yo
rk
Texa
s
Haw
aii
Nat
ion
al A
vera
ge
Ke
ntu
cky
Ve
rmo
nt
De
law
are
Wis
con
sin
Mo
nta
na
Rh
od
e Is
lan
d
Illin
ois
Kan
sas
Cal
ifo
rnia
Idah
o
No
rth
Dak
ota
Oh
io
Lou
isia
na
Okl
aho
ma
Vir
gin
ia
Ark
ansa
s
Was
hin
gto
n
Co
nn
etic
ut
Co
lora
do
Mis
sou
ri
Min
nes
ota
Mis
siss
ipp
i
Ari
zon
a
Mai
ne
Neb
rask
a
Iow
a
Mic
hig
an
Wyo
min
g
Sou
th C
aro
lina
No
rth
Car
olin
a
Sou
th D
ako
ta
Ore
gon
Uta
h
We
st V
irgi
nia
13

Keys to success
• What’s working for our students who have been underserved and experienced less success than their peers?
• That’s what we’re here to explore with our panel.
14