the achievement gap challenges and opportunities › professional...• what is the achievement gap...
TRANSCRIPT

Professional Day April 3, 2014
Institutional Research and Planning
The Achievement Gap Challenges and Opportunities
4/3/2014 1

National and Statewide Imperatives
“Chronic achievement gaps exist among students of different ethnicities and economic status:
• Across nearly all indicators of educational success-with little movement in the past five years.
• Closing the gaps is not only the right thing to do, but it is also one of the most powerful strategies to propel Massachusetts to national leadership in all educational outcomes.”
WITHIN OUR SIGHTS - The Vision Project, October 2013
4/3/2014 2
Understanding the Gap
• What is the achievement gap at MCC?
• What is the achievement gap when disaggregated by various factors or subgroups?
• Are we narrowing the achievement gap?
4/3/2014 3

Data Analyzed-FTFT Success Rates
• Standardized Cohort with the opportunity to analyze in subgroups
• Provides a standard amount of time to evaluate student success
• Includes graduation and transfer out
• Predominately traditional-age students with high likelihood of success • Cohort is 14% of total student population
• 1,396 Students
4/3/2014 4

FTFT Indicators and Subgroups
• Retention Rates • Three-Graduation Rates • Transfer-out (within three years prior to graduation) -community college versus senior institution -GPA at transfer Subgroups • Race/Ethnicity • Gender • Income level (Pell-Eligibility)
4/3/2014 5

Narrowing the Gap in FTFT Retention Rate • Retention rates are increasing for all groups.
61% 58%
54% 56% 63% 63% 63%
76%
African American Asian Hispanic Caucasian
Fall 2010 to Fall 2011Fall 2011 to Fall 2012
4/3/2014 6

Income Status of MCC Students
33% 37% 42% 45%
Fall 2010 Fall 2011 Fall 2012 Fall 2013
• FTFT Pell-Eligibility degree-seeking students Fall 2010 Cohort Fall 2013 Cohort
• Caucasian 30% 31% • Hispanic 78% 81% • Asian 71% 75% • African American 67% 80%
• FTFT Pell-Eligibility increased from 33% to 45% since Fall 2010.
4/3/2014 7

FTFT Fall 2010 Cohort: Success Rates by Income
• Within three years of enrollment, students who are Pell-Eligible are less likely to graduate or transfer to another institution than those who are not.
12.7%
23.0%
35.7%
10.1%
21.1%
31.2%
14.8%
24.4%
39.2%
Graduation Transfer Before Graduation Total
All StudentsPell-EligibleNon Pell-Eligible
4/3/2014 8
4.7% gap
8.0% gap
3.3% gap

Three-Year Graduation Rates by Pell-Eligibility
• While comparing to the previous cohort with Pell-Eligibility as the primary variable, the achievement gap is narrowing: the gap was 5% for the Fall 2010 cohort, compared to 10% for the Fall 2009 Cohort.
13.1% 12.7%
9.7% 10.1%
19.6%
14.8%
Fall 2009 Fall 2010
All StudentsPell-EligibleNon Pell-Eligible
9.9% gap
4.7% gap
4/3/2014 9

Three-Year Graduation Rate by Ethnic Groups • The three-year graduation rate for the Fall 2010 Cohort is 12.7%,
with African American students completed at 13.3%, representing a higher achievement level than the other ethnic groups with the exception of Caucasian students.
4/3/2014 10
13.3%
9.1% 10.0%
14%
African American Asian Hispanic Caucasian

Three-Year Graduation Rate by Ethnicity and Income
• In all ethnic categories, students who are Pell-Eligible have lower three-year graduation rates than students who are not.
13%
9% 10%
14% 13%
7% 8%
12%
17%
14%
17%
14%
African American Asian Hispanic Caucasian
All StudentsPell-EligibleNon Pell-Eligible
4/3/2014 11
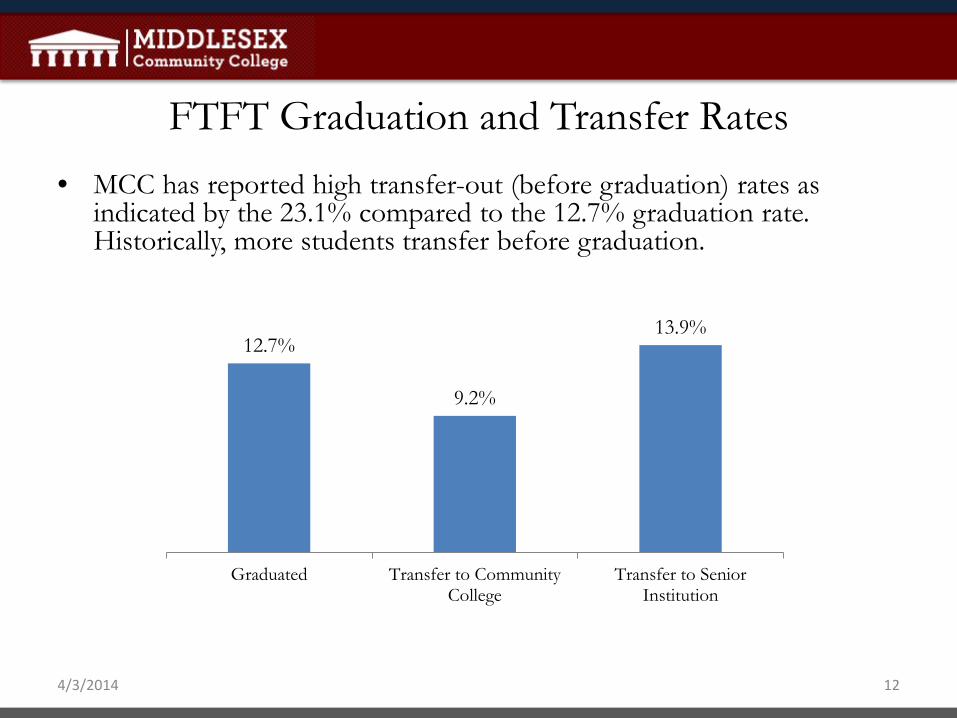
FTFT Graduation and Transfer Rates • MCC has reported high transfer-out (before graduation) rates as
indicated by the 23.1% compared to the 12.7% graduation rate. Historically, more students transfer before graduation.
12.7%
9.2%
13.9%
Graduated Transfer to CommunityCollege
Transfer to SeniorInstitution
4/3/2014 12

Fall 2010 Cohort Transfer Type • Asian and Caucasian students are more likely to transfer to
senior institutions, while Hispanic and African American students are more likely to transfer to other community colleges.
19%
17%
7%
1%
12% 11%
14% 15%
African American Hispanic Caucasian Asian
Community CollegeSenior Institution
4/3/2014 13

• The average GPA for students transferring to a community college was 1.64, compared to 2.65 for a senior institution. A difference is visible in all groups.
Fall 2010 Cohort: GPA at Transfer
1.41 1.63
1.83
0.49
2.24 2.53
2.77 3.05
Hispanic African American Caucasian Asian
Community CollegeSenior Institution
4/3/2014 14

Three-Year Graduation Rates by Gender
• Men are less likely to graduate in three years than women.
13.2% 13.1% 12.7% 13.1% 11.3% 10.8%
13.3% 15.2% 14.9%
Fall 2008 Cohort Fall 2009 Cohort Fall 2010 Cohort
All StudentsMenWomen
4/3/2014 15

Three-Year Graduation Rate by Gender and Pell-Eligibility
• Women who are not Pell-Eligible are almost twice as likely to graduate in three years than women who are not.
10.8%
14.9%
9.5%
12.0% 11.1%
18.9%
Pell-Eligible Non Pell-Eligible
All StudentsMenWomen
4/3/2014 16

Glimpse at the Service Area
4/3/2014 17

MCC and Service Area
• To serve our communities, MCC is striving to match enrollment with our population.
68%
7% 11% 14%
78%
5% 10% 7%
53%
7%
22% 18%
Caucasian African American Asian Hispanic
MCCMiddlesex CountyCity of Lowell
4/3/2014 18

Demographic Shift • The percentage of Asian, Hispanic, and African American
students will increase by 2020 in Middlesex County.
90.05% 84.96% 78.59%
72.26%
2.71% 3.63%
4.86% 5.86%
3.70% 6.64% 9.81%
13.36%
3.41% 4.62% 6.59% 8.36%
1990 2000 2010 2020
Hispanic
Asian
African American
Caucasian
4/3/2014 19
Thank You
Dr. Paula Pitcher Vice President, Enrollment Management, Research and
Planning [email protected]
Jennifer Luddy Assistant Dean, Research and Planning
4/3/2014 20