what explains immigrant-native gaps in european labor ...ftp.iza.org/dp8847.pdf · what explains...
TRANSCRIPT
DI
SC
US
SI
ON
P
AP
ER
S
ER
IE
S
Forschungsinstitut zur Zukunft der ArbeitInstitute for the Study of Labor
What Explains Immigrant-Native Gaps in European Labor Markets: The Role of Institutions
IZA DP No. 8847
February 2015
Martin GuziMartin KahanecLucia Mýtna Kureková

What Explains Immigrant-Native Gaps in European Labor Markets:
The Role of Institutions
Martin Guzi Masaryk University, CELSI and IZA
Martin Kahanec
Central European University, CELSI and IZA
Lucia Mýtna Kureková Central European University, SGI, CELSI and IZA
Discussion Paper No. 8847 February 2015
IZA
P.O. Box 7240 53072 Bonn
Germany
Phone: +49-228-3894-0 Fax: +49-228-3894-180
E-mail: [email protected]
Any opinions expressed here are those of the author(s) and not those of IZA. Research published in this series may include views on policy, but the institute itself takes no institutional policy positions. The IZA research network is committed to the IZA Guiding Principles of Research Integrity. The Institute for the Study of Labor (IZA) in Bonn is a local and virtual international research center and a place of communication between science, politics and business. IZA is an independent nonprofit organization supported by Deutsche Post Foundation. The center is associated with the University of Bonn and offers a stimulating research environment through its international network, workshops and conferences, data service, project support, research visits and doctoral program. IZA engages in (i) original and internationally competitive research in all fields of labor economics, (ii) development of policy concepts, and (iii) dissemination of research results and concepts to the interested public. IZA Discussion Papers often represent preliminary work and are circulated to encourage discussion. Citation of such a paper should account for its provisional character. A revised version may be available directly from the author.

IZA Discussion Paper No. 8847 February 2015
ABSTRACT
What Explains Immigrant-Native Gaps in European Labor Markets: The Role of Institutions*
The role of institutions in immigrant integration remains underexplored in spite of its essential significance for integration policies. This paper adopts the Varieties of Capitalism framework to study the institutional determinants of immigrant-native gaps in host labor markets. Using the EU LFS we first measure immigrant-native gaps in labor force participation, unemployment, low-skilled employment and temporary employment. We distinguish the gaps that can be explained by immigrant-native differences in characteristics from those that cannot be explained by such differences, as these require different integration policy approaches. In the second stage we measure the effects of institutional and contextual variables on explained and unexplained immigrant-native gaps. Our findings confirm that institutional contexts play a significant role in immigrant integration, and highlight the importance of tailoring policy approaches with regard to the causes of immigrant-native gaps. JEL Classification: J15, J18, J61 Keywords: immigrant integration, integration policy, discrimination, labor market,
Varieties of Capitalism Corresponding author: Martin Kahanec Department of Public Policy Central European University Nádor u. 11 H-1051 Budapest Hungary E-mail: [email protected]
* This paper expands on the project “KING - Knowledge for Integration Governance” which was funded with support from the European Commission. Martin Guzi acknowledges the support of the program “Employment of Best Young Scientists for International Cooperation Empowerment” (CZ.1.07/2.3.00/30.0037). This paper reflects the views of the authors only; the European Commission or any other funding agency or consortium partner cannot be held responsible for any use that may be made of the information contained therein. We thank Kea Tijdens, Miguel Loriz, Alessandra Venturini, Guia Gilardoni and an anonymous referee for their comments and suggestions, as well as Liliya Levandowska for research assistance. Any errors in this text are the responsibility of the authors.

3
1. Introduction
Immigrant-native labor market gaps can be viewed as an inevitable artifact of the imperfect
adjustment of immigrants and natives in globalized labor markets, but also as a challenge that
may threaten cohesion in receiving societies. With 6.7% of the population in the European Union
being foreign-born1, it is an important task for scientists as well as policy makers to better
understand the determinants of native-immigrant gaps in receiving labor markets.
This topic has received much scholarly attention, starting with the seminal works by Chiswick
(1978) and Borjas (1985), who looked at immigrant adjustment in the US. Several studies,
including Zimmermann (2005), Kahanec and Zaiceva (2009), Kahanec, Zaiceva and
Zimmermann (2011) focused on European labor markets, finding labor market gaps between
immigrants and natives that vary across outcome variables, immigrant groups, receiving
countries, and time. Although there is evidence that some of these gaps decline with time spent
in the receiving country, the studies show that they do not necessarily disappear fully, and that
some of them are transferred across generations of immigrants, while some may even increase in
subsequent generations (Kahanec and Zimmermann, 2011).2
The literature has identified a number of determinants of native-immigrant labor market gaps,
including years since migration (Chiswick, 1978; Borjas, 1985; Kahanec, Zaiceva and
Zimmermann, 2011), year of arrival, or the cohort effect, (Borjas, 1985), country of origin
1 Eurostat, January 2013. Available at: http://epp.eurostat.ec.europa.eu/statistics_explained/index.php/Migration_and_migrant_population_statistics#Foreign_and_foreign-born_population 2 In addition to the studies which take a pan-European perspective, there are numerous country studies, including Clark and Drinkwater (2014) for the UK, Amuedo-Dorantes and de la Rica (2007) for Spain, or Biavaschi and Zimmermann (2014) for Germany.
4
(Adsera and Chiswick, 2007), lower returns to human capital (Van Ours and Veenman, 1999;
Aeberhardt et al. 2007), gender (Adsera and Chiswick, 2007), or lack of citizenship rights
(Fougère and Safi, 2006, Constant and Zimmermann, 2005, Kahanec and Zaiceva, 2009).The
role of social capital is studied by Kahanec and Mendola (2009), while Constant and
Zimmermann (2008) conceptualize and demonstrate the role of ethnic identity. There is also
evidence that discriminatory attitudes towards immigrants pose barriers to their labor market
integration (Becker, 2010; Constant, Kahanec and Zimmermann, 2009; Rooth, 2014).
Although native-immigrant labor market gaps have been extensively studied in the literature
(some of which is mentioned above), there is no systematic evidence of how macro-level
institutional contexts affect these gaps.3 Moreover, the literature remains silent as to which
institutional factors explain the gaps driven by differing characteristics of native and immigrant
groups, and what factors drive the gaps that cannot be explained by such observable differences.
The only exception known to us is a related paper by Guzi, Kahanec and Mýtna Kureková
(2015), who adopt a methodology similar to the one we use in this paper to investigate the role of
immigration and integration policies for native-immigrant labor market gaps.4
Differentiating the two types of native-immigrant gaps is, however, a key aspect of immigrant
integration in host labor markets. This is the policy challenges and implications for reducing the
explained part of the native-immigrant gaps are different from those relevant to closing the gaps
between observably equal natives and immigrants. To illustrate, whereas immigration, education,
3 A study by Kahancová and Szabó (2012) reviews what little we know about the role of industrial relations for immigrants' integration outcomes. Dustmann and Frattini (2011) and D’Amuri and Peri (2010) study the role of institutions in a different framework and focus only on employment protection. 4 See also Kahanec (2014).

5
health and housing policies are the key factors affecting human capital gaps between natives and
immigrants, antidiscrimination and equal treatment policies are the primary tools for addressing
the problem of unexplained native-immigrant gaps.
This study breaks new ground by offering a systematic measurement of the role of labor market
institutions and supply and demand factors on immigrant-native labor market gaps. In stage one,
using the EU LFS as an underlying source of data, we construct a panel dataset containing
measures of native-immigrant labor market gaps as well as institutional characteristics for a set
of European countries in the period 2004-2012. Specifically, we distinguish two sources of
native-immigrant labor market gaps: differences in characteristics interpreted as the explained
component (educational attainment, gender or age composition, geographic distribution); and
unobserved characteristics, such as group differences in ethnic or social capital, behavioral
variables, unequal treatment, discrimination or other unobserved factors, as the unexplained
component. The explained gap reflects immigrant-native group differences that arise outside of
the labor market, whereas unexplained gaps imply unequal treatment or behavior of immigrants
and natives in the labor market. This is an important distinction from the policy perspective.
In stage two we use the panel constructed in stage one to evaluate the role of institutional and
supply and demand factors for immigrant-native labor market gaps, which we do separately for
the explained and unexplained components. We broadly adapt the varieties of capitalism (VoC)
framework (Hall and Soskice, 2001) and its later extensions (Hancké, Rhodes and Thatcher,
2007) to test the effect of country clusters with similar institutional characteristics. In addition to
country types, the key independent variables that underpin the VoC framework and which we
6
hypothesize to have an impact on native-immigrant labor market gaps are: employment
protection indicators related to regular and temporary contracts, union density, and coverage of
collective bargaining agreements. We control for additional supply and demand factors by
including the countries’ GDP per capita and unemployment rate in the analysis.
This study helps us to understand which institutional variables provide for a more equitable
immigrant-native relationship in terms of greater similarity between the immigrant and native
populations (explained gap) and which variables are conducive to more similar treatment and
behavior of immigrant and native populations in the labor market (unexplained gap). We proceed
as follows: the next section constructs measurements of immigrant-native labor market gaps,
explained and unexplained, and outlines the institutional measures used. We then develop an
empirical model to test the institutional determinants of explained and unexplained labor market
gaps, before reporting and interpreting the results and offering conclusions.
2. Constructing the data
2.1 Immigrant-native labor market gaps
The explained component of native-immigrant labor market gaps represents the part of the total
existing native-immigrant gaps that arises due to differentials originating outside the labor
market, due to observable differences in characteristics such as educational attainment, gender or
age composition, and geographic distribution, between immigrant and native populations. These
mainly result from various aspects of immigrant selection, or educational, housing or health
factors.

7
On the other hand, the unexplained component represents the part of native-immigrant gaps that
is due to unobservable group differentials, including differences in social or ethnic capital, or
discrimination in the labor market. This component implies the existence of unequal treatment of
observably identical individuals, which relates to (anti-) discrimination policies; or may reflect
different returns to human, social and ethnic capital in the host country’s labor market.
Specifically, in the same way as Guzi and Kahanec (2015), we use the 2004-2012 waves of the
EU Labor Force Survey (EU LFS) to construct four dependent variables to assess the position of
migrants in the labor market, including immigrant-native gaps in labor force participation,
unemployment status, the incidence of low-skill jobs and the type of contract, temporary or
permanent. The sample includes about 8.1 million individuals, of which 8.5 % are immigrants.
Participation in the labor market measures natives’ and immigrants’ access to the labor market,
unemployment rate measures their chances of getting a job, and the last two variables gauge the
quality of the jobs the immigrants are able to get. Following the ILO’s definition, participation
rate refers to the share of the working age population who are either employed or unemployed,
i.e. have no job but are actively looking for and can take one. Low-skill jobs are defined as
elementary occupations consisting of simple and routine tasks in the ISCO-9 group. Temporary
contracts are defined in the EU LFS as contracts with a limited duration. The sample includes 19
countries with sufficient observations on immigrants in the EU Labor Force Survey: Austria,
Belgium, Czech Republic, Denmark, Estonia, Finland, France, Germany, Greece, Hungary,

8
Ireland, Italy, Luxembourg, the Netherlands, Portugal, Slovakia, Spain, Sweden and the United
Kingdom.5
To measure what proportion of the mean differences in labor market outcomes between natives n
and immigrants m is accounted for by differences in the observable characteristics of migrant and
native populations, and what proportion remains unexplained, we adopt a version of the Blinder-
Oaxaca (Oaxaca, 1973; Blinder, 1973) framework. The procedure uses an econometric model to
explain individual labor market outcomes, which is estimated separately for natives (1) and for
migrants (2) for each outcome variable Y, country k and year t
𝑌𝑛 = 𝛼𝑛 + 𝑋𝑛′ 𝛽𝑛 + 𝜀𝑛 (1)
𝑌𝑚 = 𝛼𝑚 + 𝑋𝑚′ 𝛽𝑚 + 𝜀𝑚 , (2)
where X is the vector of observable individual characteristics, α is the intercept, β is the vector of
coefficients, and 𝜀 is the error term.
In order to examine the sources of outcome variable differentials between natives and migrants, a
counterfactual model is constructed in which migrants are treated as natives. The counterfactual
outcome 𝑌�𝑚∗ for migrants is defined as
𝑌�𝑚∗ = 𝛼�𝑛 + 𝑋�𝑚′ �̂�𝑛 , (3)
where we take the intercept and coefficients �̂�𝑛 from the model estimated for natives, and 𝑋�𝑚 is
a vector of the means of the explanatory variables for migrants. The average gap between natives
and migrants can then be decomposed into a gap explained by characteristics, that is, differences
between the natives’ outcome and the counterfactual outcome, and a gap due to coefficients, i.e. 5 The sample includes all countries for which there is sufficient information on the immigrant population in the EU-LFS. Migrant status is based on country of birth except for Germany, where we use information on nationality for this purpose.

9
differences between the counterfactual outcome and the migrants’ outcome. The Blinder-Oaxaca
decomposition of native-immigrant gap ∆ for each outcome variable, country k and year t is then
∆≡ 𝑌�𝑛 − 𝑌�𝑚 = (𝑋�𝑛 − 𝑋�𝑚)′�̂�𝑛 + 𝑋�𝑚′ ��̂�𝑛 − �̂�𝑚� ≡ ∆𝑒 + ∆𝑢 , (4)
where 𝑋�𝑛 and 𝑋�𝑚 are vectors of the means of the explanatory variables for natives and migrants,
respectively, and �̂�𝑛 and �̂�𝑚 are the estimated coefficients from regressions (1) and (2). The
first term of equation (4) on the right-hand side, ∆𝑒, is the gap due to the different (average)
characteristics of natives and immigrants, hence the explained gap. The second term, ∆𝑢, is the
gap due to differences in coefficients, and in this sense remains an unexplained gap. We adopt a
non-linear decomposition technique described by Yun (2004) to perform the decomposition
outlined above on the binary dependent variables. This procedure, performed for each country k
and year t separately, yields longitudinal data (with dimensions k and t) spanning 21 European
countries over the period 2004-2012 for explained and unexplained immigrant-native gaps (∆𝑒
and ∆𝑢) in each of the outcome variables: labor force participation, unemployment status,
incidence of low-skill jobs, and type of contract (temporary or permanent). Table 1 shows the
characteristics separately for native and immigrant populations. A number of differences are
identified as significant, given the large sample size. The immigrant population is somewhat
younger and less educated than the native population, and is concentrated in urban areas.

10
Table 1. Descriptive statistics
Migrant Native Female 0.51 0.50 Age 38.6 39.9 ISCED1 primary 0.15 0.09 ISCED2 lower secondary 0.25 0.24 ISCED3 upper secondary 0.35 0.42 ISCED4 post-secondary 0.02 0.02 ISCED5 university 0.22 0.22 ISCED6 postdoc 0.01 0.01 Urbanization: Densely-populated area 0.66 0.47 Urbanization: Intermediate area 0.22 0.31 Urbanization: Thinly-populated area 0.12 0.22 Source: Authors’ calculation based on EU-LFS, 2004-2012
Note: The sample is limited to individuals aged 15-64 years old. Statistics are weighted by
population weights.
2.2 Labor Market Institutions
Labor market institutions are an integral part of a broader institutional framework in which
immigration and immigrant integration take place. The organization of industrial relations,
education and vocational training, corporate governance and organization of the production
process, and supply and demand factors all affect what types of immigrants are likely to come to
a given country and how difficult it is for them to integrate in that country's labor market. To
illustrate, immigrants may find it easier to adjust in countries whose educational system
promotes general rather than specific skills, as specific skills may be more difficult to transfer
from their countries of origin. From another perspective, stronger trade unions may be able to
ensure equal employment conditions for immigrants; however, those with less favorable
characteristics may find it more difficult to find a job under such conditions (for a detailed
discussion of these issues see Guzi, Kahanec, and Mýtna Kureková, 2014).
11
To measure the effect of these institutional contexts and complementarities on native-immigrant
labor market gaps, we adopt concepts from the Varieties of Capitalism (VoC) literature.
Specifically, following Hall and Soskice (2001) and Hancké, Rhodes and Thatcher (2007), we
distinguish between coordinated market economies (CMEs), liberal market economics (LMEs),
mixed market economies (MMEs), and emerging market economies (EMEs).6
In addition to these broad VoC categories, we also consider a number of more specific
explanatory institutional variables. First, labor market regulation, measured by the employment
protection index (EPL), gauges labor market rigidities. We test whether the level of labor market
flexibility can partly explain immigrant-native gaps. The EPL indicators are published annually
by OECD, and observe 21 different aspects of employment protection regulation. We consider
two indices, for protection of regular employment and for regulation of temporary forms of
employment, in order to capture both regular employment and the more flexible forms of
employment via which migrants are often more likely to enter the labor market. The former is
based on a broad set of indicators, such as the period of notice before dismissal, severance pay,
and the difficulties associated with worker dismissal. The latter considers restrictions on fixed-
term contracts in the labor market, such as the maximum number or duration of successive
contracts, and the type of work eligible for temporary employment contracts. Both indicators are
measured on a scale between 1 and 6, with higher values corresponding to higher labor market
6 In particular, the 19 EU countries we include in this study are grouped as follows: CME includes Austria, Belgium, Germany, Denmark, Finland, Luxembourg, the Netherlands, and Sweden; LME includes Ireland and the United Kingdom; MME includes France, Greece, Italy, Portugal and Spain; and EME includes the Czech Republic, Estonia, Hungary and Slovakia.

12
rigidities (i.e. less flexibility and more protection). Figure 1 shows that the employment
protection variables vary across countries and to some extent also over time.
Figure 1. Employment protection indicators
Source: OECD
Note: The data points in missing years are imputed using linear interpolation
Second, we use indicators of social dialogue related to trade union membership and the coverage
of collective agreements. The former measures the extent of unionization, as the share of workers
who are members of a trade union, and also an indicator of trade union strength (referred to as
union density). The latter tells us about the unions' influence and bargaining power, measuring
the proportion of all wage and salary earners in employment whose pay and/or conditions of
1.5
2
2.5
1.8
2
2.2
2.4
0
2
4
1
2
3
1.5
2
2.5
2
2.5
3
2
2.5
3
3.5
1.6
1.8
2
2.2
2.5
3
3.5
2.2
2.4
2.6
2.8
1
1.5
2
.5
1
1.5
2
2.5
3
2
3
4
1
2
3
2
3
4
1
2
3
.5
1
1.5
2
.5
1
1.5
2004 2008 2012 2004 2008 2012 2004 2008 2012 2004 2008 2012 2004 2008 2012
2004 2008 2012 2004 2008 2012 2004 2008 2012 2004 2008 2012 2004 2008 2012
2004 2008 2012 2004 2008 2012 2004 2008 2012 2004 2008 2012 2004 2008 2012
2004 2008 2012 2004 2008 2012 2004 2008 2012 2004 2008 2012
AT BE CZ DE DK
EE ES FI FR GR
HU IE IT LU NL
PT SE SK UK
EPL - regular contract EPL - temporary contract
Graphs by code
13
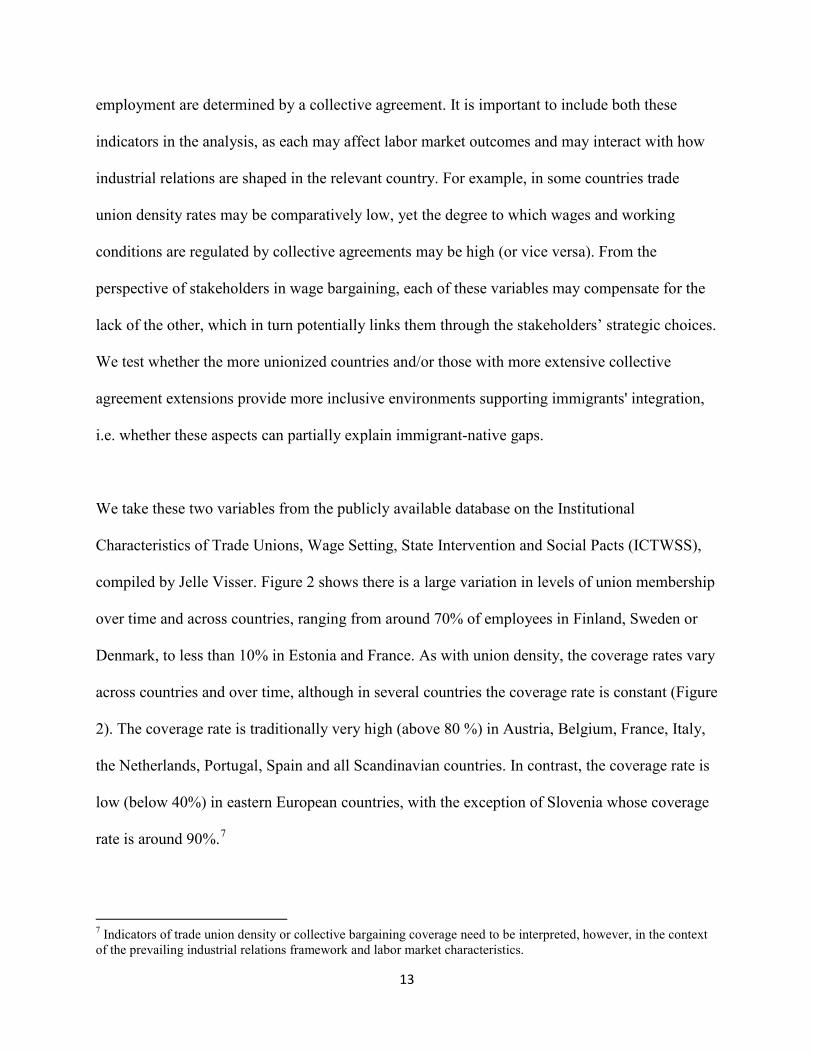
employment are determined by a collective agreement. It is important to include both these
indicators in the analysis, as each may affect labor market outcomes and may interact with how
industrial relations are shaped in the relevant country. For example, in some countries trade
union density rates may be comparatively low, yet the degree to which wages and working
conditions are regulated by collective agreements may be high (or vice versa). From the
perspective of stakeholders in wage bargaining, each of these variables may compensate for the
lack of the other, which in turn potentially links them through the stakeholders’ strategic choices.
We test whether the more unionized countries and/or those with more extensive collective
agreement extensions provide more inclusive environments supporting immigrants' integration,
i.e. whether these aspects can partially explain immigrant-native gaps.
We take these two variables from the publicly available database on the Institutional
Characteristics of Trade Unions, Wage Setting, State Intervention and Social Pacts (ICTWSS),
compiled by Jelle Visser. Figure 2 shows there is a large variation in levels of union membership
over time and across countries, ranging from around 70% of employees in Finland, Sweden or
Denmark, to less than 10% in Estonia and France. As with union density, the coverage rates vary
across countries and over time, although in several countries the coverage rate is constant (Figure
2). The coverage rate is traditionally very high (above 80 %) in Austria, Belgium, France, Italy,
the Netherlands, Portugal, Spain and all Scandinavian countries. In contrast, the coverage rate is
low (below 40%) in eastern European countries, with the exception of Slovenia whose coverage
rate is around 90%.7
7 Indicators of trade union density or collective bargaining coverage need to be interpreted, however, in the context of the prevailing industrial relations framework and labor market characteristics.

14
Figure 2. Indicators of social dialogue in Europe
Source: ICTWSS database (2013)
Note: The data points in missing years are imputed using linear interpolation. The right axis shows labels for
collective bargaining.
Several structural variables characterizing the various VoC types may affect supply and demand
conditions, and hence immigrant workers' integration prospects in European labor markets. The
country’s openness to international trade is one such factor. Whereas the standard Heckscher-
Ohlin model posits that migration and international trade are substitutes, its extensions and more
recent trade theories suggest that they are complements (Venables, 1999; Krugman, 1995;
Markusen et al. 1995). Whichever is the case, a country’s openness may influence the demand
for immigrant labor, and hence immigrants’ integration prospects. Given the skill composition of
the supply of immigrant workers, the receiving country's industrial structure determines the skill
98
100
95
97
35
40
45
60
65
70
84
86
25
26
27
28
50
60
70
80
88
89
90
91
91
93
64
66
30
35
40
42
42.2
42.4
84
86
57
59
83
84
85
90
90.5
91
91
92
93
94
30
35
40
30
35
28
30
32
34
53.5
54
54.5
55
15
20
25
18
20
22
66
68
70
6
8
10
14
16
18
68
70
72
7.5
7.6
7.7
7.8
20
25
10
15
20
32
34
36
33
34
35
36
30
35
40
45
18
19
20
21
19
20
21
22
65
70
75
80
15
20
25
26
27
28
29
2004 2008 2012 2004 2008 2012 2004 2008 2012 2004 2008 2012 2004 2008 2012
2004 2008 2012 2004 2008 2012 2004 2008 2012 2004 2008 2012 2004 2008 2012
2004 2008 2012 2004 2008 2012 2004 2008 2012 2004 2008 2012 2004 2008 2012
2004 2008 2012 2004 2008 2012 2004 2008 2012 2004 2008 2012
AT BE CZ DE DK
EE ES FI FR GR
HU IE IT LU NL
PT SE SK UK
Union density Collective bargaining
Graphs by code

15
composition of labor demand in the economy. A related variable underpinning the VoC typology
is the share of people with vocational education and training in the economy, which affects the
nature of labor supply and competition in the labor market. Immigrants’ integration in the labor
market may be easier in general skill regimes, which put less emphasis on formal education and
skill certification, as opposed to dual education regimes, where qualification requirements and
licensing are more formalized. The interaction of the supply and demand sides then shape the
immigrants' prospects of finding a suitable job offer. We therefore include the shares of
agriculture, services, and the industrial sector in GDP, as well as the share of people with
vocational education and training, in our analysis.
Several studies have documented that country of origin is significant for immigrant integration,
and that its effects are persistent (see e.g. Kahanec and Zimmermann, 2011). To account for this,
we calculate the shares of immigrants from six major regions of origin in the immigrant stock,
using the EU LFS. Table 2 shows that the composition of the immigrant population varies across
VoC types. CMEs mainly host immigrants of European origin, whereas in LMEs and MMEs the
dominant immigrant groups are of non-European origin. Immigration only has a short history in
EMEs, as a result of which these countries host only relatively small numbers of immigrants.
As the EU LFS does not enable us to control for years since migration, a variable that has been
shown to significantly affect immigrant integration (e.g. Borjas, 1985; Kahanec and
Zimmermann, 2011), we also include a measure of the current inflows of immigrants relative to
host country populations. Finally, per capita GDP and the unemployment rate are included in the
16
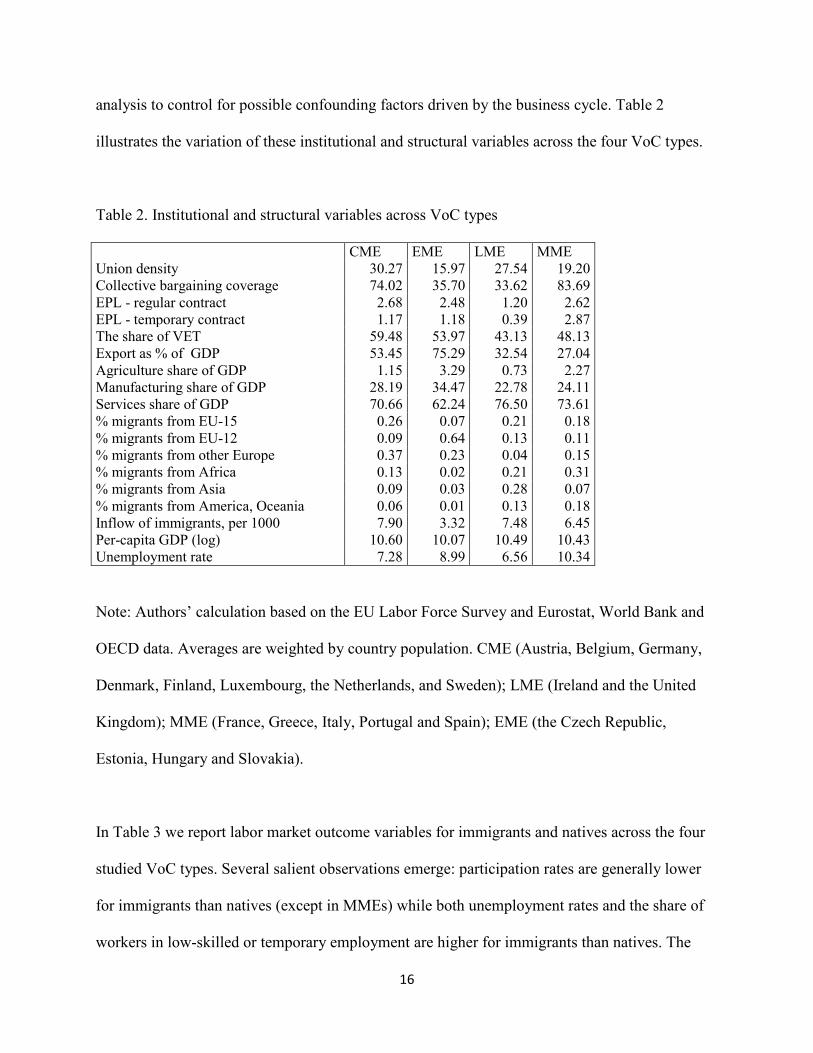
analysis to control for possible confounding factors driven by the business cycle. Table 2
illustrates the variation of these institutional and structural variables across the four VoC types.
Table 2. Institutional and structural variables across VoC types
CME EME LME MME Union density 30.27 15.97 27.54 19.20 Collective bargaining coverage 74.02 35.70 33.62 83.69 EPL - regular contract 2.68 2.48 1.20 2.62 EPL - temporary contract 1.17 1.18 0.39 2.87 The share of VET 59.48 53.97 43.13 48.13 Export as % of GDP 53.45 75.29 32.54 27.04 Agriculture share of GDP 1.15 3.29 0.73 2.27 Manufacturing share of GDP 28.19 34.47 22.78 24.11 Services share of GDP 70.66 62.24 76.50 73.61 % migrants from EU-15 0.26 0.07 0.21 0.18 % migrants from EU-12 0.09 0.64 0.13 0.11 % migrants from other Europe 0.37 0.23 0.04 0.15 % migrants from Africa 0.13 0.02 0.21 0.31 % migrants from Asia 0.09 0.03 0.28 0.07 % migrants from America, Oceania 0.06 0.01 0.13 0.18 Inflow of immigrants, per 1000 7.90 3.32 7.48 6.45 Per-capita GDP (log) 10.60 10.07 10.49 10.43 Unemployment rate 7.28 8.99 6.56 10.34
Note: Authors’ calculation based on the EU Labor Force Survey and Eurostat, World Bank and
OECD data. Averages are weighted by country population. CME (Austria, Belgium, Germany,
Denmark, Finland, Luxembourg, the Netherlands, and Sweden); LME (Ireland and the United
Kingdom); MME (France, Greece, Italy, Portugal and Spain); EME (the Czech Republic,
Estonia, Hungary and Slovakia).
In Table 3 we report labor market outcome variables for immigrants and natives across the four
studied VoC types. Several salient observations emerge: participation rates are generally lower
for immigrants than natives (except in MMEs) while both unemployment rates and the share of
workers in low-skilled or temporary employment are higher for immigrants than natives. The

17
gaps are narrowest in LMEs, except for the labor force participation gap, which favors
immigrants in MMEs. The largest participation and unemployment gaps are documented in
CMEs, whereas the largest low-skilled and temporary employment gaps are observed in MMEs.
Our results show that large fractions of these gaps are not explained by observable
characteristics.
Table 3. Natives' and immigrants' labor market outcomes by VoC type
CME EME LME MME Natives
Participation rate 0.75 0.65 0.74 0.67 Unemployment rate 0.06 0.10 0.07 0.10 Low-skill job 0.08 0.08 0.09 0.10 Temporary contract 0.12 0.08 0.06 0.17
Migrants Participation rate 0.71 0.68 0.72 0.73 Unemployment rate 0.12 0.13 0.10 0.14 Low-skill job 0.16 0.13 0.13 0.25 Temporary contract 0.15 0.13 0.09 0.26
Differences Participation rate -0.04 0.03 -0.01 0.06 Unemployment rate 0.06 0.03 0.02 0.05 Low-skill job 0.09 0.04 0.04 0.15 Temporary contract 0.04 0.04 0.03 0.09
Unexplained gap Participation rate -0.06 -0.01 -0.06 0.02 Unemployment rate 0.05 0.04 0.03 0.03 Low-skill job 0.07 0.04 0.06 0.14 Temporary contract 0.04 0.05 0.03 0.08
Explained gap Participation rate 0.02 0.04 0.05 0.04 Unemployment rate 0.01 -0.01 0.00 0.01 Low-skill job 0.02 0.01 -0.02 0.01 Temporary contract 0.00 -0.01 0.00 0.01
Source: Authors’ calculation based on EU-LFS, 2004-2012

18
3. Empirical strategy
We examine factors explaining immigrant labor market integration in terms of immigrants’ labor
market potential and their treatment in the labor market. Immigrant-native labor market gaps
estimated using the Oaxaca-Blinder decomposition, ∆𝑒 and ∆𝑢, enter as dependent variables. The
analysis proceeds separately, first for the part of the labor market gap that is explained by
differences in the characteristics of the immigrant and non-immigrant populations, and second
for the part that remains unexplained by such differences. Specifically, we estimate the following
models using the OLS estimator:
∆𝑘𝑡𝑒 = 𝛼 + 𝑍′𝛽 + 𝑉′𝛾 + 𝑉𝑜𝐶 + 𝜂𝑡 + 𝜀𝑘𝑡 (5)
∆𝑘𝑡𝑢 = 𝛼 + 𝑍′𝛽 + 𝑉′𝛾 + 𝑉𝑜𝐶 + 𝜂𝑡 + 𝜀𝑘𝑡 , (6)
where matrix Z represents key explanatory variables identified in the VoC literature: union
density, collective bargaining coverage, EPL indicators, export’s share in GDP, the share of
vocational education and training in the population, and indicators of the industrial structure of
the economy (share of agriculture and share of manufacturing). VoC is a set of dummies
representing the four VoC types introduced above: CME, LME, MME, and EME. The matrix of
contextual variables V includes the logarithm of per capita GDP (expressed in 2011 prices in PPP
dollars) and unemployment rates. In addition, it includes shares of immigrants by origin and
relative inflows of immigrants. Year-specific effects are captured by 𝜂𝑡 and 𝜀𝑘𝑡 is the error term.
As cross-sectional estimates may be affected by variation in unobserved factors across countries,
we next estimate a panel model, which identifies the studied relationships based on longitudinal
rather than cross-sectional variation. In models 7 and 8, 𝜇𝑘 represents country fixed effects, and

19
hence coefficients 𝛽 in these models measure the relationship between within-country changes of
variables Z and immigrant-native gaps over time.
∆𝑘𝑡𝑒 = 𝛼 + 𝑍′𝛽 + 𝑉′𝛾 + 𝜇𝑘 + 𝜂𝑡 + 𝜀𝑘𝑡 (7)
∆𝑘𝑡𝑢 = 𝛼 + 𝑍′𝛽 + 𝑉′𝛾 + 𝜇𝑘 + 𝜂𝑡 + 𝜀𝑘𝑡 , (8)
4. Results
The baseline results are presented in Tables 4 (for explained immigrant-native gaps) and 5 (for
unexplained immigrant-native gaps). The roles of the VoC indicators are assessed with regard to
four different labor market outcomes: labor force participation, selection into low-skilled
occupations, temporary work contracts, and unemployment. We recall that the gap is defined
here as the difference between immigrant and native populations; measuring the relationship
between institutional variables on the explained gap helps us to identify how the difference
between immigrants’ and natives’ characteristics might be affected by institutional contexts. On
the other hand, the unexplained gap reveals differences in the treatment or behavior of
immigrants relative to natives, which we study as a function of institutional context variables.
The estimated coefficients should be interpreted with reference to the immigrant-native gaps
reported in Table 3. A positive coefficient in the model explaining gaps in labor force
participation indicates that an increase in the respective explanatory variable favors immigrants
over natives. On the other hand, positive coefficients in the models for unemployment, low-
skilled employment, and temporary employment indicate that an increase in the respective
explanatory variable is associated with an increase in the gap in the respective variable, and
hence disadvantages immigrants vis-à-vis natives.
20
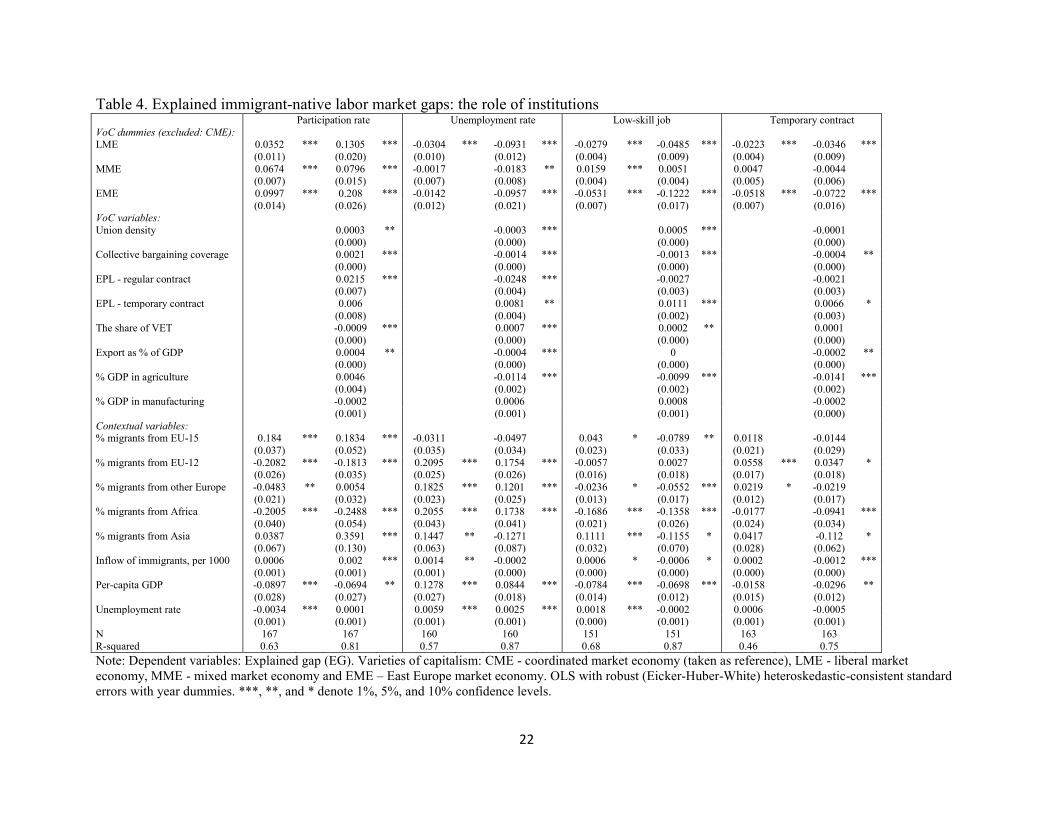
In general, the VoC variables are shown to have significant effects on both explained (Table 4)
and unexplained (Table 5) gaps. The coefficients reported in Table 4 show that compared to
CMEs, immigrants in LMEs and EMEs have characteristics that place them at an advantage over
the natives for all the studied labor market outcomes. This is also true in MMEs for participation
and unemployment gaps; however, immigrants’ characteristics in MME’s seem to place them at
a slight disadvantage vis-à-vis the natives in terms of the risk of low-skilled employment, and the
effects for temporary employment are statistically insignificant.
The results in Table 5 looking at unexplained gaps indicate that in LMEs the unexplained gap in
access to quality employment is somewhat smaller than it is in CMEs, although the effects are
only marginally significant. The residual effect of LMEs (after controlling for the other VoC
variables) on equal treatment in access to employment is shown to disadvantage immigrants. In
MMEs immigrants are relatively better treated than in CMEs in terms of labor force participation
as well as access to quality employment (with a lower risk of low-skilled or temporary
employment); however, this seems to come at the price of a higher unexplained gap in the risk of
unemployment. In EMEs immigrants are shown to enjoy a particular advantage (compared to
immigrants in CMEs) in terms of equal treatment in access to employment. The residual effect
on the unexplained gap in low-skilled employment in EMEs, after controlling for the other VoC
variables, also favors immigrants.
While VoC dummies capture salient effects, the individual VoC variables can provide a richer
picture of the underlying relationships driving these effects. Table 4 shows that a higher union
density provides for immigrant characteristics that favor them vis-à-vis the natives in terms of

21
access to labor market (participation rate) and their chances of getting a job (unemployment
rate), but provides a less favorable context in terms of the explained low-skilled employment
gap. Collective bargaining coverage seems to have a similar effect to union density on the
participation and unemployment gaps; in addition, higher collective bargaining coverage is
associated with a smaller immigrant-native gap in access to high quality employment (i.e. a
lower propensity towards low-skill or temporary employment).
The positive effects of union density on immigrants’ characteristics seem to come at a price,
however. Table 5 shows that higher union density is associated with larger unexplained
immigrant-native gaps in terms of unemployment, low-skilled employment, and temporary
employment. Collective bargaining coverage, on the other hand, appears to reduce the
unexplained gap in terms of the risk of low-skilled work, and less significantly also temporary
employment.
Higher protection of regular employment contracts provides for a relatively higher participation
rate among immigrants, in terms of both explained and unexplained gaps, although the latter
effect is less significant. On the other hand, such protection increases unexplained immigrant-
native gaps in risk of unemployment and low-skilled employment. Higher protection of
temporary contracts has the opposite effect. Less temporary contract flexibility increases
immigrants' chances of ending up in unemployment, low-skilled employment or a temporary
contract. These effects work through immigrant-native differences in both characteristics and
unexplained factors.
22
Table 4. Explained immigrant-native labor market gaps: the role of institutions
Participation rate Unemployment rate Low-skill job Temporary contract
VoC dummies (excluded: CME): LME 0.0352 *** 0.1305 *** -0.0304 *** -0.0931 *** -0.0279 *** -0.0485 *** -0.0223 *** -0.0346 *** (0.011) (0.020) (0.010) (0.012) (0.004) (0.009) (0.004) (0.009) MME 0.0674 *** 0.0796 *** -0.0017 -0.0183 ** 0.0159 *** 0.0051 0.0047 -0.0044 (0.007) (0.015) (0.007) (0.008) (0.004) (0.004) (0.005) (0.006) EME 0.0997 *** 0.208 *** -0.0142 -0.0957 *** -0.0531 *** -0.1222 *** -0.0518 *** -0.0722 *** (0.014) (0.026) (0.012) (0.021) (0.007) (0.017) (0.007) (0.016) VoC variables: Union density
0.0003 **
-0.0003 ***
0.0005 ***
-0.0001
(0.000)
(0.000)
(0.000)
(0.000) Collective bargaining coverage
0.0021 ***
-0.0014 ***
-0.0013 ***
-0.0004 **
(0.000)
(0.000)
(0.000)
(0.000) EPL - regular contract
0.0215 ***
-0.0248 ***
-0.0027
-0.0021
(0.007)
(0.004)
(0.003)
(0.003) EPL - temporary contract
0.006
0.0081 **
0.0111 ***
0.0066 *
(0.008)
(0.004)
(0.002)
(0.003) The share of VET
-0.0009 ***
0.0007 ***
0.0002 **
0.0001
(0.000)
(0.000)
(0.000)
(0.000) Export as % of GDP
0.0004 **
-0.0004 ***
0
-0.0002 **
(0.000)
(0.000)
(0.000)
(0.000) % GDP in agriculture
0.0046
-0.0114 ***
-0.0099 ***
-0.0141 ***
(0.004)
(0.002)
(0.002)
(0.002) % GDP in manufacturing
-0.0002
0.0006
0.0008
-0.0002
(0.001)
(0.001)
(0.001)
(0.000) Contextual variables: % migrants from EU-15 0.184 *** 0.1834 *** -0.0311
-0.0497 0.043 * -0.0789 ** 0.0118
-0.0144
(0.037)
(0.052) (0.035)
(0.034) (0.023)
(0.033) (0.021)
(0.029) % migrants from EU-12 -0.2082 *** -0.1813 *** 0.2095 *** 0.1754 *** -0.0057
0.0027 0.0558 *** 0.0347 *
(0.026)
(0.035) (0.025)
(0.026) (0.016)
(0.018) (0.017)
(0.018) % migrants from other Europe -0.0483 ** 0.0054 0.1825 *** 0.1201 *** -0.0236 * -0.0552 *** 0.0219 * -0.0219 (0.021)
(0.032) (0.023)
(0.025) (0.013)
(0.017) (0.012)
(0.017)
% migrants from Africa -0.2005 *** -0.2488 *** 0.2055 *** 0.1738 *** -0.1686 *** -0.1358 *** -0.0177
-0.0941 *** (0.040)
(0.054) (0.043)
(0.041) (0.021)
(0.026) (0.024)
(0.034)
% migrants from Asia 0.0387
0.3591 *** 0.1447 ** -0.1271 0.1111 *** -0.1155 * 0.0417
-0.112 * (0.067)
(0.130) (0.063)
(0.087) (0.032)
(0.070) (0.028)
(0.062)
Inflow of immigrants, per 1000 0.0006
0.002 *** 0.0014 ** -0.0002 0.0006 * -0.0006 * 0.0002
-0.0012 *** (0.001)
(0.001) (0.001)
(0.000) (0.000)
(0.000) (0.000)
(0.000)
Per-capita GDP -0.0897 *** -0.0694 ** 0.1278 *** 0.0844 *** -0.0784 *** -0.0698 *** -0.0158
-0.0296 ** (0.028)
(0.027) (0.027)
(0.018) (0.014)
(0.012) (0.015)
(0.012)
Unemployment rate -0.0034 *** 0.0001 0.0059 *** 0.0025 *** 0.0018 *** -0.0002 0.0006
-0.0005 (0.001)
(0.001) (0.001)
(0.001) (0.000)
(0.001) (0.001)
(0.001)
N 167
167 160
160 151
151 163
163 R-squared 0.63 0.81 0.57 0.87 0.68 0.87 0.46 0.75 Note: Dependent variables: Explained gap (EG). Varieties of capitalism: CME - coordinated market economy (taken as reference), LME - liberal market economy, MME - mixed market economy and EME – East Europe market economy. OLS with robust (Eicker-Huber-White) heteroskedastic-consistent standard errors with year dummies. ***, **, and * denote 1%, 5%, and 10% confidence levels.

23
Table 5. Unexplained immigrant-native labor market gaps: the role of institutions
Participation rate Unemployment rate Low-skill job Temporary contract
VoC dummies (excluded: CME): LME -0.0081
0.0117 -0.0012
0.0818 *** -0.0178 * 0.0218 -0.016 * -0.0107
(0.010)
(0.014) (0.010)
(0.017) (0.010)
(0.023) (0.009)
(0.013) MME 0.1112 *** 0.0965 *** 0.0819 *** 0.0415 *** -0.017
-0.0933 *** -0.0623 *** -0.0429 ***
(0.006)
(0.011) (0.010)
(0.016) (0.011)
(0.015) (0.005)
(0.010) EME 0.0118
0.0081 -0.0695 *** -0.1242 *** 0.0019
-0.1132 *** 0.0105
0.0106
(0.008)
(0.021) (0.013)
(0.027) (0.013)
(0.039) (0.010)
(0.023) VoC variables: Union density
0
0.0006 ***
0.0006 ***
0.0005 ***
(0.000)
(0.000)
(0.000)
(0.000) Collective bargaining coverage
0.0003
0.0003
-0.0011 ***
-0.0005 *
(0.000)
(0.000)
(0.000)
(0.000) EPL - regular contract
0.0097 *
0.0143 ***
0.0266 ***
-0.008 *
(0.005)
(0.005)
(0.006)
(0.004) EPL - temporary contract
0.0095
0.0282 ***
0.0395 ***
-0.0015
(0.006)
(0.006)
(0.008)
(0.006) The share of VET
-0.0003 *
0.0001
0.0005 **
0.0007 ***
(0.000)
(0.000)
(0.000)
(0.000) Export as % of GDP
0.0001
0.0008 ***
0.0003
0
(0.000)
(0.000)
(0.000)
(0.000) % GDP in agriculture
-0.0051 *
-0.0062 *
0.0209 ***
0.011 ***
(0.003)
(0.003)
(0.004)
(0.003) % GDP in manufacturing
-0.0002
-0.0033 ***
0.0021
0.0014 **
(0.001)
(0.001)
(0.002)
(0.001) Contextual variables: % migrants from EU-15 0.116 *** 0.0834 ** -0.1127 *** -0.4161 *** -0.1862 *** -0.3204 *** -0.1001 *** -0.1059 ** (0.027)
(0.040) (0.041)
(0.047) (0.053)
(0.068) (0.031)
(0.046)
% migrants from EU-12 0.0056
0.0268 0.0118
0.0203 -0.2466 *** -0.1284 ** -0.0179
-0.0382 (0.021)
(0.030) (0.028)
(0.030) (0.039)
(0.056) (0.021)
(0.025)
% migrants from other Europe -0.0045
-0.0047 0.0666 ** 0.005 -0.2157 *** -0.1545 *** -0.0102
0.0102 (0.019)
(0.029) (0.029)
(0.030) (0.036)
(0.055) (0.016)
(0.021)
% migrants from Africa -0.2241 *** -0.2633 *** -0.1308 *** -0.2317 *** -0.1204 ** 0.0874 0.1485 *** 0.249 *** (0.035)
(0.048) (0.040)
(0.053) (0.049)
(0.073) (0.032)
(0.045)
% migrants from Asia -0.0143
0.0303 0.0496
-0.1595 -0.2491 *** -0.1077 -0.0903 * -0.1129 (0.063)
(0.121) (0.075)
(0.106) (0.088)
(0.193) (0.053)
(0.081)
Inflow of immigrants, per 1000 0.0022 *** 0.0018 ** 0.0025 *** 0.001 0.0019 ** 0.003 *** -0.0003
0.0007 (0.001)
(0.001) (0.001)
(0.001) (0.001)
(0.001) (0.001)
(0.000)
Per-capita GDP -0.0788 *** -0.0844 *** 0.0083
-0.0188 -0.1097 *** -0.0967 ** 0.0769 *** 0.0863 *** (0.017)
(0.024) (0.027)
(0.024) (0.028)
(0.040) (0.023)
(0.019)
Unemployment rate -0.0002
0.0004 0.0007
0 -0.0006
0.0008 0.0056 *** 0.005 *** (0.001)
(0.001) (0.001)
(0.001) (0.001)
(0.002) (0.001)
(0.001)
N 167
167 160
160 151
151 163
163 r2 0.89 0.9 0.8 0.9 0.67 0.8 0.59 0.76 Notes: Dependent variables: Unexplained gap (UG). Varieties of capitalism: CME - coordinated market economy (taken as reference), LME - liberal market economy, MME - mixed market economy and EME – East Europe market economy. OLS with robust (Eicker-Huber-White) heteroskedastic-consistent standard errors with year dummies. ***, **, and * denote 1%, 5%, and 10% confidence levels.
24
Skill specificity, as proxied by the share of the population with vocational education and training,
seems to disadvantage immigrants in terms of differences in characteristics (for participation,
unemployment and low-skilled employment) as well as differences in unexplained factors (for
participation, low-skilled employment and temporary employment). Meanwhile, the host
country’s openness is associated with more favorable immigrant characteristics vis-à-vis the
natives in terms of labor force participation, unemployment and temporary employment; it
seems, however, to reduce immigrants' access to employment (in comparison to the natives) via
unequal treatment in the labor market. Finally, more agrarian countries provide conditions for
lower explained gaps between immigrants and native in terms of unemployment, low-skilled and
temporary employment. However, these countries disadvantage immigrants in terms of
unexplained gaps, with the exception of the risk of unemployment. Countries with a larger
manufacturing sector provide more favorable conditions in terms of unexplained gaps in access
to employment; however, they seem to be less favorable to immigrants in terms of the risk of
temporary employment.
As for the contextual variables, the benefits of economic growth (higher GDP per capita) accrue
to the natives rather than immigrants in terms of participation (explained as well as unexplained
gaps), unemployment (explained gaps) and temporary employment (unexplained) gaps; however,
immigrants seem to upgrade into higher skilled (explained as well as unexplained gaps) and
perhaps also permanent jobs (explained) relative to the natives during economic upturns. Higher
unemployment rates mainly affect immigrants in terms of their participation, unemployment,
and low skilled employment (explained gaps), and temporary employment (unexplained gap).

25
The composition of immigrants in the host economies is shown to affect both explained and
unexplained immigrant-native labor market gaps.
The results given in Tables 4 and 5, which explore variation across VoC types may not be
particularly useful for national policy makers, who are interested in what will happen if a given
variable or policy instrument in their country changes over time. Moreover, some of the results
in the pooled OLS model may be driven by unobserved heterogeneity across countries. We
therefore estimated models (7) and (8) with country (and year) fixed effects, with all coefficients
now measuring relationships identified by within- but not across- country variation. Table 6
reports the results of these panel regressions.
The inclusion of country fixed effects controls for country-specific time-invariant variables and
hence removes a nontrivial part of the variation in the data. It is therefore not surprising that we
find fewer significant relationships. Among those we do identify, higher union density
disadvantages immigrants vis-à-vis the natives in terms of how their characteristics translate into
their labor market participation, risk of unemployment and temporary employment. In other
words, due to compositional effects, an increase in union density is associated with immigrants
being more likely than natives to end up inactive, unemployed, or with a temporary contract.
Broader collective bargaining coverage, on the other hand, provides for a lower explained gap in
the risk of temporary employment between immigrants and natives in their host countries.
Employment protection varies much less over time than the previous two variables, and so its
effects tend to be poorly identified in panel models. Nevertheless, we find that increased
26
protection of regular employment contracts is associated with more favorable immigrant
characteristics.
Our estimates indicate that vocational education and training (VET) has a significant effect on
the improvement of treatment of immigrants in terms of their access to employment and skilled
jobs, although the effect is only marginally significant in the first of these two areas. A higher
degree of openness to international trade favors immigrants relative to natives in terms of their
underlying ability to find a job (explained gap) and get a permanent contract (explained gap),
although the latter effect is only marginally significant. Finally, an increase in the share of
agriculture in the economy places immigrants at a disadvantage in terms of explained gaps in
participation rates, and an increase in the share of manufacturing increases the explained gaps in
unemployment rates.

27
Table 6. Within-country determination of immigrant-native labor market gaps
Participation rate Unemployment rate Low-skill job Temporary contract
EG
UG EG
UG EG
UG EG
UG VoC variables: Union density -0.0047 *** 0.0014 0.0027 ** -0.0003 0.0008
0.0008 0.0015 *** 0.0005
(0.001)
(0.001) (0.001)
(0.001) (0.001)
(0.001) (0.000)
(0.001) Collective bargaining coverage 0.0001
0.0006 -0.0003
-0.001 * -0.0004 * 0 -0.0006 *** -0.0009
(0.001)
(0.001) (0.000)
(0.001) (0.000)
(0.001) (0.000)
(0.001) EPL - regular contract 0.0045
0.006 -0.0098
-0.0159 -0.0166 ** -0.0018 0.0104
-0.0173
(0.015)
(0.014) (0.010)
(0.013) (0.008)
(0.025) (0.007)
(0.013) EPL - temporary contract 0.0312
-0.0148 -0.0077
0.0155 0.0007
0.0097 0.0029
-0.0031
(0.022)
(0.014) (0.007)
(0.011) (0.006)
(0.014) (0.005)
(0.010) The share of VET 0.0002
-0.0002 0.0002
-0.0004 * -0.0002
-0.0008 ** -0.0001
-0.0001
(0.000)
(0.000) (0.000)
(0.000) (0.000)
(0.000) (0.000)
(0.000) Export as % of GDP -0.0007
0.0005 -0.0007 ** -0.0001 -0.0002
0.0005 -0.0003 * 0.0004
(0.000)
(0.000) (0.000)
(0.000) (0.000)
(0.000) (0.000)
(0.000) % GDP in agriculture -0.0235 *** -0.0023 -0.0032
-0.0031 -0.0015
0.0158 * 0.0018
-0.0005
(0.007)
(0.005) (0.005)
(0.006) (0.004)
(0.008) (0.003)
(0.006) % GDP in manufacturing 0.0006
0.0015 0.0028 ** 0.0027 0.0003
0.0023 -0.0003
-0.0025 *
(0.001)
(0.002) (0.001)
(0.002) (0.001)
(0.003) (0.001)
(0.001) Contextual variables: % migrants from EU-15 0.1563
0.1429 -0.274
-0.4505 -0.0952
-0.4957 -0.1089
-0.0191
(0.267)
(0.220) (0.172)
(0.288) (0.112)
(0.352) (0.083)
(0.224) % migrants from EU-12 0.1264
0.3234 * -0.1152
-0.0598 -0.0208
-0.5756 * -0.0907
-0.1119
(0.244)
(0.176) (0.139)
(0.265) (0.099)
(0.302) (0.079)
(0.198) % migrants from other Europe 0.0748
0.4152 ** -0.2959 * -0.1702 -0.1043
-0.7058 ** -0.1564 * 0.0069
(0.289)
(0.205) (0.163)
(0.288) (0.107)
(0.328) (0.084)
(0.228) % migrants from Africa -0.0664
0.2313 -0.0772
-0.2648 0.0142
-0.2736 -0.0093
0.0277
(0.210)
(0.194) (0.149)
(0.285) (0.097)
(0.293) (0.072)
(0.198) % migrants from Asia 0.0169
0.5012 ** -0.1756
0.1388 -0.0754
-0.3284 -0.1106
-0.1295
(0.293)
(0.226) (0.203)
(0.280) (0.122)
(0.310) (0.093)
(0.222) Inflow of immigrants, per 1000 0.0007
0.0014 -0.0002
-0.0015 * -0.0002
0.0029 *** 0.0002
0.0009
(0.001)
(0.001) (0.001)
(0.001) (0.000)
(0.001) (0.000)
(0.001) Per-capita GDP -0.0969
0.0921 0.026
-0.105 * -0.0799 ** -0.2887 *** -0.035
0.1397 **
(0.065)
(0.066) (0.046)
(0.061) (0.037)
(0.089) (0.035)
(0.068) Unemployment rate 0.0005
0.0015 0.002 ** -0.0019 -0.0002
-0.0021 0.0011 * 0.0037 ***
(0.001)
(0.001) (0.001)
(0.001) (0.001)
(0.002) (0.001)
(0.001) N 167
167 160
160 151
151 163
163
r2 0.9 0.94 0.92 0.95 0.92 0.89 0.91 0.84 Notes: Dependent variables: Explained gap (EG), Unexplained gap (UG). Varieties of capitalism: CME - coordinated market economy (taken as reference), LME - liberal market economy, MME - mixed market economy and EME – East Europe market economy. OLS with robust (Eicker-Huber-White) heteroskedastic-consistent standard errors with year dummies. ***, **, and * denote 1%, 5%, and 10% confidence levels.

28
5. Conclusions
Although immigrant integration opportunities and challenges are in many respects similar across
countries, there may be a number of important differences linked to international variation in the
areas of industrial relations, labor laws, education and training, employment and supply and
demand conditions. Comparative capitalism literature on Varieties of Capitalism (VoC) inspired
by Hall and Soskice (2001) offers a systematic typology of socio-economic regimes for
advanced economies, which proxies the institutional and supply and demand conditions that may
be relevant for immigrant integration. In this paper we have looked at the significance of these
institutional and economic contexts for immigrant-native labor market gaps.
We distinguished two types of immigrant-native labor market gaps, based on whether they can
be explained by immigrant-native differences in observed characteristics, or whether they are
due to different returns to characteristics or other unobserved factors. This distinction is crucial
from the policy perspective, since whereas the former type of gap is determined outside the labor
market, the latter arises directly from labor market interaction between employees, employers
and other actors. From a different perspective, explained gaps imply that workers attain different
labor market outcomes because they have different characteristics relevant to the labor market.
The role of integration policy is than to reduce or eliminate such gaps in characteristics, for
example by providing equal access to education. Unexplained gaps, on the other hand, imply
that workers with identical labor market characteristics are being unequally treated. The main
policy challenge in relation to such gaps is hence equal treatment in the labor market.

29
Our results show that VoC types and the individual variables underpinning the VoC typology do
matter for immigrant integration in host labor markets. We find that these effects are independent
of contextual variables, including the business cycle and the composition of immigrant
populations by country of origin and tenure in the country.
Compared to coordinated market economies, liberal and emerging market economies seem to
attract and keep immigrants better equipped to succeed in the labor market. Whereas mixed
market economies provide favorable conditions in terms of immigrants' labor force participation
and permanent employment, their results are mixed when it comes to unemployment and low-
skilled employment.
No simple conclusions can be drawn about the effects of union density and collective bargaining
coverage on immigrant-native labor market gaps. It seems that stronger unions can provide for
more favorable immigrant labor market characteristics, although these benefits may be reduced
or overturned due to increased unexplained immigrant-native labor market gaps. Similarly,
whereas stronger protection of regular employment contracts may be associated with favorably
composed immigrant populations, it also results in immigrants having more difficult access to
employment, skilled jobs, and permanent contracts. The situation is even worse with protection
of temporary employment contracts, which generally has an adverse effect on both explained and
unexplained immigrant-native labor market gaps.
Our results show that countries with a large share of vocational education and training
disadvantage immigrants, which is consistent with the hypothesis that under those conditions

30
immigrants cannot easily transfer the skills they acquired abroad. Even worse, immigrants seem
to suffer from less equal treatment in the labor market under these regimes. The situation is the
opposite in countries with high exposure to international trade, where explained immigrant-
native gaps seem to be lower. Industrial structure is shown to matter, too: more agricultural
countries exhibit lower explained gaps but higher unexplained gaps; the effects of the share of
manufacturing are less conclusive.
Our most restrictive model, with country fixed effects, may be the most relevant from the
perspective of policy makers wishing to promote immigrant integration by manipulating their
national contexts. We show that increased union density disadvantages immigrants through
increased explained labor market gaps, although increased collective bargaining coverage seems
to mitigate those adverse effects. Protection of regular employment contracts reduces explained
gaps in low-skilled employment. The share of vocational education and training and the
openness of economies to international trade seem to reduce some unexplained and explained
immigrant-native labor market gaps, respectively. It may be more difficult for immigrants to
participate in more agricultural countries, and to find jobs in more industrialized ones.
Immigration from European countries outside the EU seems to be associated with smaller
immigrant-native labor market gaps, while Asians are strongly attached to the labor market.
More dynamic immigration seems to cost some immigrants a more skilled job. Stronger
economic growth is shown to have a strong positive effect on immigrants’ relative positions in
terms of skilled employment, although it also results in a larger unexplained gap in temporary
employment.
31
Higher union density increases the unemployment gap between immigrants and natives, but
collective bargaining coverage seems to have no significant effect. Protection of regular
employment contracts reduces the gap in the prevalence of low-skilled employment between
immigrants and natives; however, it pushes immigrants into temporary employment. Protection
of temporary employment contracts has similar effects on immigrant-native gaps in low-skilled
as well as temporary employment; in addition, it disadvantages immigrants vis-à-vis the natives
in terms of participation and employment gaps. We also find that more open economies, i.e.
those with a higher export-to-GDP ratio, provide favorable conditions for labor force
participation and perhaps also immigrants' employment.
These results point towards several conclusions. First, institutional contexts significantly
influence immigrant integration prospects. Second, policy makers need to be aware of the
potentially adverse side effects for immigrant integration that industrial policies might have.
Those side effects may need to be mitigated by complementary policies, or reinforced and
targeted if they are positive. Third, although this article provides a consistent picture about how
various institutional contexts matter for immigrant integration, we also show that implications
from cross-country comparisons do not always translate into identical results when looking at
national changes over time and policy interventions. Immigrant integration policies therefore
need to be tailored to specific national contexts.

32
6. References
Adsera, A., & Chiswick, B. R. (2007). Are there gender and country of origin differences in immigrant labor market outcomes across European destinations? Journal of Population Economics, 20(3), 495–526.
Aeberhardt, R., Fougère, D., Pouget, J., & Rathelot, R. (2007). Wages and Employment of Second-Generation Immigrants in France. IZA Discussion Paper, (2898).
Amuedo Dorantes, C., & De la Rica, S. (2007). Labour market assimilation of recent immigrants in Spain. British Journal of Industrial Relations, 45(2), 257–284.
Becker, G. S. (2010). The Economics of Discrimination. University of Chicago Press.
Biavaschi, C., & Zimmermann, K. (2014). Eastern partnership migrants in Germany: outcomes, potentials and challenges. IZA Journal of European Labor Studies, 3(1), 7.
Blinder, A. S. (1973). Wage discrimination: reduced form and structural estimates. Journal of Human Resources, 8(4), 436–455.
Borjas, G. J. (1985). Assimilation, changes in cohort quality, and the earnings of immigrants. Journal of Labor Economics, 3(4), 463–489.
Clark, K., & Drinkwater, S. (2014). Labour migration to the UK from Eastern partnership countries. IZA Journal of European Labor Studies, 3(1), 15.
Constant, A. F., Kahanec, M., & Zimmermann, K. F. (2009). Attitudes towards immigrants, other integration barriers, and their veracity. International Journal of Manpower, 30(1/2), 5–14.
Constant, A. F., & Zimmermann, K. F. (2005). Legal Status at Entry, Economic Performance, and Self-employment Proclivity: A Bi-national Study of Immigrants. IZA Discussion Papers, (1910).
Constant, A. F., & Zimmermann, K. F. (2008). Measuring Ethnic Identity and Its Impact on Economic Behavior. Journal of the European Economic Association, 6(213), 424–433.
D’Amuri, F., & Peri, G. (2010). Immigration and occupations in Europe. Cream WP (10/26), University College London.
Dustmann, C., & Frattini, T. (2011). Immigration: the European experience. Centro Studi Luca d’Agliano Development Studies Working Paper, (326).
Fougere, D., & Safi. (2009). Naturalization and employment of immigrants in France (1968-1999). International Journal of Manpower, 30(1/2), 83–96.

33
Guzi, M., & Kahanec, M. (2015). Socioeconomic Cleavages between Workers from New Member States and Host-country Labor Forces in the EU during the Great Recession. Forthcoming in M. Bernaciak (Ed.), Market Expansion and Social Dumping in Europe. London: Routledge.
Guzi, M., Kahanec , M., & Mýtna Kureková, L. (2014). The impact of demand and supply structural factors on native-migrant labour market gaps, KING Desk Research & In-Depth Study n.17, Milano: Fondazione ISMU
Guzi, M., Kahanec, M., & Mýtna Kureková, L. (2015). The effect of migration policy on
immigrant-native labor market gaps. CELSI Discussion Paper 28. Bratislava: CELSI.
Hall, P. A., & Soskice, D. (2001). Varieties of capitalism: the institutional foundations of comparative advantage. Oxford: Oxford University Press.
Hancké, B., Rhodes, M., & Thatcher, M. (2007). Introduction: Beyond Varieties of Capitalism. In B. Hancké, M. Rhodes, & M. Thatcher (Eds.), Beyond Varieties of Capitalism: Conflict, Contradictions, and Complementarities in the European Economy (pp. 1–32). Oxford and New York: Oxford University Press.
Chiswick, B. R. (1978). The effect of Americanization on the earnings of foreign-born men. The Journal of Political Economy, 86(5), 897-921.
Kahancová, M., & Szabó, I. (2012). Bargaining systems, trade union strategies and the costs and benefits of migration. CEU (mimeo).
Kahanec, M. (2014). Economics of migration in EU labor markets, KING Overview Paper n.8 (October), Milano: Fondazione ISMU.
Kahanec, M., & Mendola, M. (2009). Social Determinants of Labor Market Status of Ethnic Minorities in Britain. Research in Labor Economics, 29, 167-195.
Kahanec, M., & Zaiceva, A. (2009). Labor market outcomes of immigrants and non-citizens in the EU: An East-West comparison. International Journal of Manpower, 30(1/2), 97–115.
Kahanec, M., Zaiceva, A., & Zimmermann, K. F. (2011). Ethnic minorities in the European Union: An overview. In Ethnic Diversity in European Labor Markets: Challenges and Solutions. Cheltenham: Edward Elgar Publishing.
Kahanec, M., & Zimmermann, K. F. (2011). Ethnic diversity in European labor markets: Challenges and solutions. Cheltenham: Edward Elgar.
Krugman, P. (1995). Chapter 24 Increasing returns, imperfect competition and the positive theory of international trade. Handbook of International Economics. Amsterdam: Elsevier.
34
Markusen, J. R. (1995). International trade: theory and evidence. New York: McGraw-Hill.
Oaxaca, R. (2008). Male-Female Wage Differentials in Urban Labour Markets. International Economic Review, 14(3), 693–709.
Rooth, D.-O. (2014). Correspondence testing studies: What can we learn about discrimination in hiring? IZA World of Labor, (58).
Van Ours, J., & Veenman, J. (1999). The Netherlands: old immigrants, young immigration country. IZA Discussion Paper, (80).
Venables, A. J. (1999). Trade liberalization and factor mobility: an overview. In R. Faini, J. de Melo, & K. F. Zimmermann (Eds.), Migration: The Controversies and the Evidence. Cambridge: Cambridge University Press.
Zimmermann, K. F. (2005). European Migration: What Do We Know? (p. 676). Oxford: Oxford University Press.