native-immigrant gaps in educational and school-to …ftp.iza.org/dp8752.pdf · native-immigrant...
TRANSCRIPT

DI
SC
US
SI
ON
P
AP
ER
S
ER
IE
S
Forschungsinstitut zur Zukunft der ArbeitInstitute for the Study of Labor
Native-Immigrant Gaps in Educational and School-to-Work Transitions in the Second Generation:The Role of Gender and Ethnicity
IZA DP No. 8752
December 2014
Stijn BaertFrank HeilandSanders Korenman

Native-Immigrant Gaps in Educational and School-to-Work Transitions in the Second
Generation: The Role of Gender and Ethnicity
Stijn Baert Ghent University, University of Antwerp
and IZA
Frank Heiland Baruch College School of Public Affairs
and CUNY Institute for Demographic Research
Sanders Korenman Baruch College School of Public Affairs,
CUNY Institute for Demographic Research and NBER
Discussion Paper No. 8752 December 2014
IZA
P.O. Box 7240 53072 Bonn
Germany
Phone: +49-228-3894-0 Fax: +49-228-3894-180
E-mail: [email protected]
Any opinions expressed here are those of the author(s) and not those of IZA. Research published in this series may include views on policy, but the institute itself takes no institutional policy positions. The IZA research network is committed to the IZA Guiding Principles of Research Integrity. The Institute for the Study of Labor (IZA) in Bonn is a local and virtual international research center and a place of communication between science, politics and business. IZA is an independent nonprofit organization supported by Deutsche Post Foundation. The center is associated with the University of Bonn and offers a stimulating research environment through its international network, workshops and conferences, data service, project support, research visits and doctoral program. IZA engages in (i) original and internationally competitive research in all fields of labor economics, (ii) development of policy concepts, and (iii) dissemination of research results and concepts to the interested public. IZA Discussion Papers often represent preliminary work and are circulated to encourage discussion. Citation of such a paper should account for its provisional character. A revised version may be available directly from the author.

IZA Discussion Paper No. 8752 December 2014
ABSTRACT
Native-Immigrant Gaps in Educational and School-to-Work Transitions in the Second Generation:
The Role of Gender and Ethnicity
We study how native-immigrant (second generation) differences in educational trajectories and school-to-work transitions vary by gender. Using longitudinal Belgian data and adjusting for family background and educational sorting, we find that both male and female second-generation immigrants, especially Turks and Moroccans, lag natives in finishing secondary education and beginning tertiary education when schooling delay is taken into account, though the female gap is larger. The same is true for residual gaps in the transition to work: native males are 30% more likely than comparable Turkish males to be employed three months after leaving school, while the corresponding female gap is 60%. In addition, we study demographic behaviors (fertility, marriage and cohabitation) related to hypotheses that attribute educational and economic gaps to cultural differences between immigrants and natives. JEL Classification: I24, J15, J16, J70, Z10, C35 Keywords: educational attainment, school-to-work transitions, dynamic selection bias,
ethnic minorities, gender differentials, economic sociology Corresponding author: Stijn Baert Ghent University Sint-Pietersplein 6 B-9000 Gent Belgium E-mail: [email protected]

3
I. Introduction
The debate over immigration policy in Europe has shifted to economic and sociocultural assimilation of
the second generation (Dustmann, Frattini and Lanzara 2012). Education systems are viewed as the
primary engines of assimilation and economic progress of immigrants and especially their children. This
study considers gaps between immigrants and natives in education and school-work transitions in
Flanders, the Dutch-speaking region of Belgium, particularly gender differences in native-immigrant
gaps. We also explore demographic behaviors (early marriage, first-births and cohabitation) related to
cultural explanations of ethnic and gender gaps in schooling and the labor market.
Although there are many analyses of immigrant gaps in education and school-work transitions, few
maintain a gender focus. Scholars have recently begun to use international data to examine gender
differences in educational attainment or test scores of immigrant children, compared to natives; we are
aware of three studies of this type (Dronkers and Kornder 2014a and 2014b, and Fleischmann and
Kristin 2014). These studies have linked gender differences in native-immigrant gaps in international test
scores or educational attainment within a variety of European countries (including Belgium) to
characteristics of the origin country, the destination country, immigration policy, educational
institutions and policies of the destination country, as well as “social distance” between the origin and
destination countries. However, none of these empirically links educational gaps to gaps in labor market
outcomes, nor do they study demographic behaviors for evidence on hypotheses related to the role of
cultural differences in the educational and economic outcomes. Lastly, none of them adjusted for
educational sorting, as we do. We summarize these new gender-focused studies in more detail below.
<Table 1 about here>
Table 1 provides initial descriptive evidence to motivate our study of gender differences in immigrant-
native gaps in Flanders, as well as the focus within the literature on the second-generation in Belgium,
on Moroccan and Turkish youth. Moroccan and Turkish youth1 make up the majority of the second
generation in Flanders, for example 210 out of 361 in our analysis sample (Table 1, bottom row). They
have grown up in markedly more disadvantaged circumstances than other immigrant youth and their
native counterparts. Eighty percent of second-generation Turkish and Moroccan youths have parents
with no secondary education or higher education (i.e., no schooling completed beyond age 12),
compared to only 12 to 13 percent among natives and 27 to 41 percent among other second-generation 1 A youth’s ethnicity is based on that of his/her maternal grandmother.

4
youth (first two rows of Table 1). Turks and Moroccans come from larger families (4.5 siblings, on
average, compared to 1.5 among natives and 2.0 among other second-generation youth; third row). Not
surprisingly, given their disadvantaged backgrounds, the Turkish and Moroccan second-generation
youth are far less likely than natives to enroll in tertiary education (fourth row). At age 23 (fifth row): 16
to 19 percent of natives are enrolled in school, compared to six to eight percent of second-generation
Turkish and Moroccans. They also have slower rates of job-finding after leaving school (sixth row);
among Turkish and Moroccan youth who have left school by age 23, two-thirds of women and half of
men were not working three months after leaving school, more than double the corresponding
proportions for natives. Clearly, the Turkish and Moroccan second generation is substantially
disadvantaged in socioeconomic background and educational and labor market outcomes. Table 1 also
indicates that there may be gender differences in the native-immigrant gaps that vary across outcomes.
For example, the unadjusted education gaps appear larger for men than women, while the unadjusted
employment gaps appear larger for women than men. In order to determine whether these educational
and labor market gaps can be explained by family socioeconomic background differences or remain
large for similarly disadvantaged immigrants and natives, we estimate models with multivariate
controls.
Beyond socioeconomic background disadvantages, scholars have offered cultural explanations –
“traditional” norms and values that emphasize family social and economic systems and nurturing roles
for women – for ethnic/gender differences in schooling and labor market outcomes. These explanations
suggest that cultural influences should operate at least partly through demographic behaviors such as
earlier marriage, especially for second-generation women, compared to native women.
Demographic behaviors indeed differ greatly between immigrants and natives, among immigrant groups
and between men and women within these groups. For example, half of Turkish and Moroccan women
and 37 percent of men have married by their 23rd birthday (seventh row of Table 1). The proportion
married among natives is nine percent for females and three percent for males.2 However, whether
demographic behavioral differences are rooted in cultural differences rather than socioeconomic
disadvantage requires estimation of models with multivariate controls for family background influences,
which we estimate below.
2 The marriage gap is not simply a matter of natives replacing marriage with non-marital cohabitation since native-immigrant gaps in rates of ever-marrying or cohabiting by age 23 are also large (36 versus 56 percent for women and 19 versus 44 percent for men). Other immigrant groups are less (or no more) likely than natives likely to marry or cohabit by age 23.

5
Additional explanations for the residual immigrant-native gaps in schooling or labor market outcomes
involve ethnicity-based discrimination in education or hiring. Labor market discrimination is thought to
have greater effects on immigrant males than females (Timmerman, Vanderwaeren and Crul 2003),
whereas traditional gender norms are expected to affect educational and economic outcomes of
immigrant females more than males (Glorieux and Laurijssen 2009; Dronkers and Kornder 2014a,
2014b). Therefore, studying gender differences in ethnic gaps in education, school-work transitions and
demographic behaviors could yield insights into the relative influence of socio-cultural factors and
discrimination.
In this paper we provide new estimates of these gender-ethnic gaps, using the econometric approach
taken by Baert and Cockx (2013), allowing adjusted ethnic differences in several educational transitions
to differ between men and women and a unified framework to study educational and school-work
transitions. We also examine demographic behavioral outcomes (e.g., marriage, fertility and
cohabitation) related to cultural explanations for gender differences in economic gaps between
immigrants and natives.
We find that second-generation Turkish and Moroccan youths lag natives in timely completion of
secondary schooling, beginning tertiary education, and in school-to-work transition, after adjusting for
differences in family socio-economic background. Residual ethnic gaps are larger for women than men.
For example, among less-educated persons, native males are approximately 30% more likely than
Turkish and Moroccan males to be employed three months after leaving school, while the
corresponding female gap is greater than 60%. These employment gaps change little when we adjust for
family socioeconomic background, suggesting a role for hiring discrimination.
Yet the evidence is also somewhat consistent with cultural explanations since we find substantial
residual ethnic gaps in the transition to first marriage, though not in other demographic behaviors such
as transition to a first birth or cohabitation (marital or non-marital). Still, given evidence of large
unadjusted ethnic differences in early fertility and marriage, Turkish and Moroccan women may face
statistical discrimination in the transition to employment related to employers’ expectations of their
early marriage and family formation. We conclude that it may be difficult to disentangle definitively the
culture and discrimination explanations for residual ethnic gaps.
In the next section, we review the nascent international literature on gender differences in ethnic
schooling (and testing) gaps in the European second generation and then focus more specifically on the

6
Flanders setting and the literature on education and employment of second-generation Turks and
Moroccans in Flanders. The third section describes our data and methods and the fourth describes our
research results, including residual ethnic gaps in schooling and school-work transitions, and in
demographic behaviors, and gender differences in these gaps. The fifth section concludes.
II. Literature and study setting
European evidence on gender differences in immigrant gaps in the 2nd generation
We begin with a review of the limited international comparative literature that has estimated gender
differences in immigrant gaps (alternatively and equivalently, differences between natives and
immigrants in gender gaps) in educational outcomes. As mentioned, we know of no studies of this type
that link educational gaps to gaps in labor market outcomes and demographic behaviors.
Fleishmann and Kristen (2014) investigated whether the “second generation has assimilated to the
female advantage in educational achievement in Western destinations, despite widespread and
persistent female disadvantage in many countries of origin” (p. 162, emphasis added). They concluded
that, in general, it has. Using multiple data sets cross-nationally, they compared gender gaps in test
scores and various schooling outcomes among natives and second-generation within country, net of the
effects of parents’ education, occupational status, and family composition (p. 149).
Generally speaking, within European destination countries, Fleishmann and Kristen (2014) found ethnic
penalties (immigrant disadvantages) but female advantages for most immigrant groups that mirror the
native gender gap (e.g., p. 150). In Table 2 we reproduce their results for Belgium across four
educational outcomes.
<Table 2 about here>
Except for “academic track” (versus vocational), gender gaps among second-generation Turks and
Moroccans are roughly comparable in magnitude to those for natives, which, incidentally, are very large.
Although it is not entirely clear from the authors’ descriptions, educational attainment outcomes appear
to be conditioned on completion of previous levels. For Belgium, there are substantial negative “ethnic”
main effects (not shown) in outcomes other than academic tracking, and female advantages, conditional

7
on family background. Therefore, conditioning on entering the next educational stage potentially biases
estimates of both ethnic gaps and gender by ethnicity in completion of that stage; i.e., gap estimates
may be biased by dynamic selection. Our analyses are intended to correct for this potential source of
bias.
In discussion of possible explanations for their findings overall, the authors considered whether the
results are (p. 167):
“…in line with the argument about returns to women’s education. Increasing returns to education for women in industrialized societies are an important explanation for the reversal of the gender gap of the past decades. Extending this argument to ethnic minorities, the stark contrast in returns to education for women from countries with low female labor force participation should serve as a powerful motivator for educational attainment among second generation girls.”
Their evidence does not support this hypothesis, since educational attainment in destination countries is
not higher when female labor force participation is low in sending countries. Also, we later show that, in
Belgium (or Flanders, at least), female advantages in education do not appear to produce high rates of
employment among second generation Turkish and Moroccan women, either in an absolute sense or
relative to their ethnic male counterparts, as Glorieux and Laurijssen (2009) note.
Dronkers and Kornder (2014a) estimated gender gaps in international test (PISA) scores, comparing
natives and immigrants. They found, in contrast to Fleishmann and Kristen (2014), larger gender
differences in reading scores for immigrants, controlling for region of origin and destination, and a
variety of origin, destination and family characteristics. In addition, the immigrant gender gap in test
scores was not related in any systematic way to poverty or “traditional” gender roles in the origin
country (p. 61).
In a related paper, Dronkers and Kornder (2014b) included measures of gender equity in both origin and
destination countries, as well as controls for other macro and individual characteristics, to provide more
direct tests of hypotheses about variation in gender gaps between immigrants and natives. Additional
macro-level controls included characteristics of educational systems, level of economic development
and religions in the country of origin. They found that gender equity in the origin country increases the
female advantage of migrant daughters compared to sons (p. 19) in reading but not math. Destination
country gender equity, on the other hand, was associated with lower reading and math scores for
immigrant children, males and females, with no significant difference between the effect for males and
females. Thus, there was no evidence that greater destination country gender equity disproportionately

8
helps female immigrants.
Dronkers and Kornder (2014b) also reported interesting findings on the interplay between origin country
gender equity and religion. They found “no differential effects of dominant [origin] religion on either
migrant daughters or sons as long as [they] control[led] for gender equity” (p. 20-21). But they reported
that when they dropped the origin country gender equity control, “Islam has a significant negative effect
on male pupils’ educational performance and an even stronger effect on the reading scores of female
migrant pupils…” (p. 21). They wrote:
“These results show that the unequal gender norm in the Islamic countries offers a valid explanation for the low educational performance of both male and female migrant pupils from countries with Islam as the dominant religion….Religion need not be a ‘black box’ of cultural phenomena, its various aspects can be analysed (gender equality, economic values, authority) and their importance in adherents’ behavior estimated.”
Dronkers and Kornder (2014b) speculated that the association of origin gender inequity with low test
scores of both male and female youth in destination countries may result because migrant youths “…
still pursue traditional gender roles and norms … that contradict the destination countries’ modern
gender norms and roles … [and] may be detrimental to their educational performance” (p. 22). Of
course, the possibility remains that different treatment of students from these countries also
contributes to their test performances.
Flanders setting
Flanders is an interesting study setting because policy has increasingly shifted to promote integration
and assimilation, i.e., “inburgering” (Pelfrene, Doyen and Hellemans 2009), yet challenges remain.3
Belgium had a disadvantaged initial (1960s) immigrant stream from Turkey and Morocco, concentrated
in particular regions within the sending countries, before “closing its borders” to labor market
immigration in the early 1970s. Subsequent shifts of immigration policy, initially toward family
reunification and later toward marriage, produced “marriage migration” streams fed by these same
geographically narrow and disadvantaged areas (Reniers 1999; Timmerman, Vanderwaeren and Crul
2003; Timmerman, Lodewyckx and Wets 2009). As a result, in Flanders, 60% of men and women from
3 Lesthaeghe (undated) attributes government interest in non-European ethnic groups to “…[t]he rise of extreme right voting in Belgium, mainly in the late 1980s…” and, specifically, “the electoral success of the Front National in several Brussels municipalities [and]…the rise of the Vlaams Blok in Flanders in 1989.” An outgrowth of this interest was support for studies of immigrant populations.

9
the Turkish second generation marry a partner from Turkey (i.e., a first-generation migrant;
Timmerman, Lodewyckx and Wets 2009). Thus, policy shifts may have reinforced the disadvantaged
nature of the immigrant flow and, combined with socio-cultural practices including marriage migration,
strengthened the role of ethnic networks and the value of ethnic capital, shaping the course and speed
of integration of immigrants and their children into Belgian society (Reniers 1999; Timmerman,
Lodewyckx and Wets 2009). In fact, the 2009-14 Flanders’ government’s “Pact 2020” attempted to
discourage marriage migration among second- and third-generation immigrants “…with the intention to
cut off a recognized vicious cycle of social deprivation” (Pelfrene, Doyen and Hellemans 2009).
Flanders also has many characteristics favorable to economic success and absorption of immigrants,
including a strong and diversified economy and an excellent education system. Education, including
higher education, is inexpensive or free and open to qualified students. Pupils rank highly on
international tests of student performance (Prokic-Breuer and Dronkers 2012). But excellent education
systems can reproduce as well as dampen inequality, depending on how well students are prepared to
enter school, how they choose or are allocated to schools, programs (“tracks”), and classrooms, among
other educational institutions (Dustmann, Frattini and Lanzara 2012).
Despite Flanders’ strong economy and labor market, immigrant school-leavers and graduates may have
more difficulty than natives in finding work, depending on labor market institutions (e.g., Dustmann,
Christian and Frattini 2013) or discrimination (e.g., Baert, Cockx, Gheyle and Vandamme, forthcoming).
Timmerman, Vanderwaeren and Crul (2003) posit that “… labor motivation, the strength of social
networks and discrimination are probably important explanatory factors …” for unemployment
differences between natives and second-generation immigrants. Economic assimilation of the second
generation may also depend on the extent to which immigrant children identify with the destination
country and its values; yet such identification is the result of complex social processes involving ties to
home country and community and treatment by natives, all of which may be influenced by external
political shifts, among other forces (Akerlof and Kranton 2007; Timmerman, Vanderwaeren and Crul
2003).
Native-Immigrant Gaps in Flanders in the 2nd Generation
Our study builds most directly on two papers that rely on the SONAR data analyzed here but that do not
focus on gender differences – Baert and Cockx (2013) and Glorieux and Laurijssen (2009). Glorieux and
Laurijssen (2009) used the SONAR data to study immigrant-native gaps and present some gender

10
differences. They found that second-generation youth are more likely to leave secondary school without
a diploma. Non-native youth are also far less likely than natives to be employed within a year of leaving
school. These unadjusted school-to-(non)work transition rates, reported in Table 3, suggest larger
native-immigrant gaps for women than men, in both absolute and relative terms (i.e., compared to
same-sex natives).4
<Table 3 about here>
Glorieux and Laurijssen (2009) also reported that, compared to the jobs held by non-native second-
generation youth, especially Turks and North Africans, jobs of natives were less likely to be blue collar
and more likely to be “high prestige”, more likely to be under permanent contract, more likely public
sector, better matched to their educational level and subject field. In addition, native youth worked in
healthier environments, in occupations that were mentally and socially more demanding, involved
greater autonomy and were less monotonous.
These unadjusted gaps are expected given the disadvantaged background and lower educational
attainment of the non-natives. The authors also estimated explanatory models with controls (cox hazard
models of unemployment duration after school-leaving and MANOVA models for other outcomes) to
estimate adjusted gaps, in some models for some outcomes interacting gender with both and education
level and ethnicity. The gender by ethnicity interactions are of particular interest for our purposes.
Although the authors found little “main effect” of family background or education level on the duration
of unemployment after school exit, they report (p. 8, emphasis added):
“…the effect of educational level on the odds of finding work is gendered. Lowly educated men find work rather easily after leaving school, even if they have low qualifications. It takes lowly educated women much longer to find a job than it takes higher educated women. Ethnic background is also much more important for women than men; particularly, women of Turkish and North-African descent have low chances of starting to work and risk long-term unemployment.”
Specifically, Glorieux and Laurijssen (2009) found in models with gender interactions that the nativity
effect on employment for males was modestly adverse but insignificant for all groups except North
Africans (odds ratio (OR) = 0.77, p<.05); but for women, very large and statistically significant gaps in
4 These figures, and particularly the ethnic gaps, are similar to those presented in our Table 1 above for the outcome “not working within 3-months of leaving school.” So the magnitude of the ethnic gap within gender does not appear to depend importantly on the choice of a 3-month or 12-month follow-up.

11
school-work transition remained for those of Turkish (OR = 0.55, p< .001) and North African (OR = 0.61,
p<.01) ethnicity.5
In interpreting the residual employment gaps among North African and Turkish youths, especially
whether they are related to discrimination or “cultural differences or orientations,” Glorieux and
Laurijssen write (p. 9, emphasis added):
“The fact that it is particularly women of North-African and Turkish descent and not the men that have difficulty in accessing the labor market, rather points in the direction of the cultural explanation. It is not unlikely that traditional roles and orientations prevent a smooth entry into the labor market even more among non-natives than among natives. In our analyses of the educational careers of non-natives, we had strong indications that the problematic educational careers of girls of migrant descent—and in particular their channeling into “lower” subject fields—go hand in hand with traditional attitudes about the role of women. It seems that these cultural differences also manifest themselves at the entry (or non-entry) into the labor market after leaving school.”
Baert and Cockx (2013) compared educational attainment and school-to-work transitions of second-
generation immigrants (predominantly ethnic Moroccans and Turks) to natives of Flanders, also using
SONAR data. They modeled school results, school decisions and the transition from school to work as a
dynamic discrete choice model that explicitly takes into account unobserved determinants of school and
labor market outcomes and thereby educational selectivity.6 They found that although unadjusted
ethnic gaps in education are large,7 residual ethnic educational gaps are small unless the outcome is on-
time completion of education, in which case the residual gaps are quite large. Ethnic gaps in school-to-
work transitions were similar whether or not they adjusted for differences in schooling and family
background, indicating a role for labor market discrimination in hiring (as corroborated by audit studies
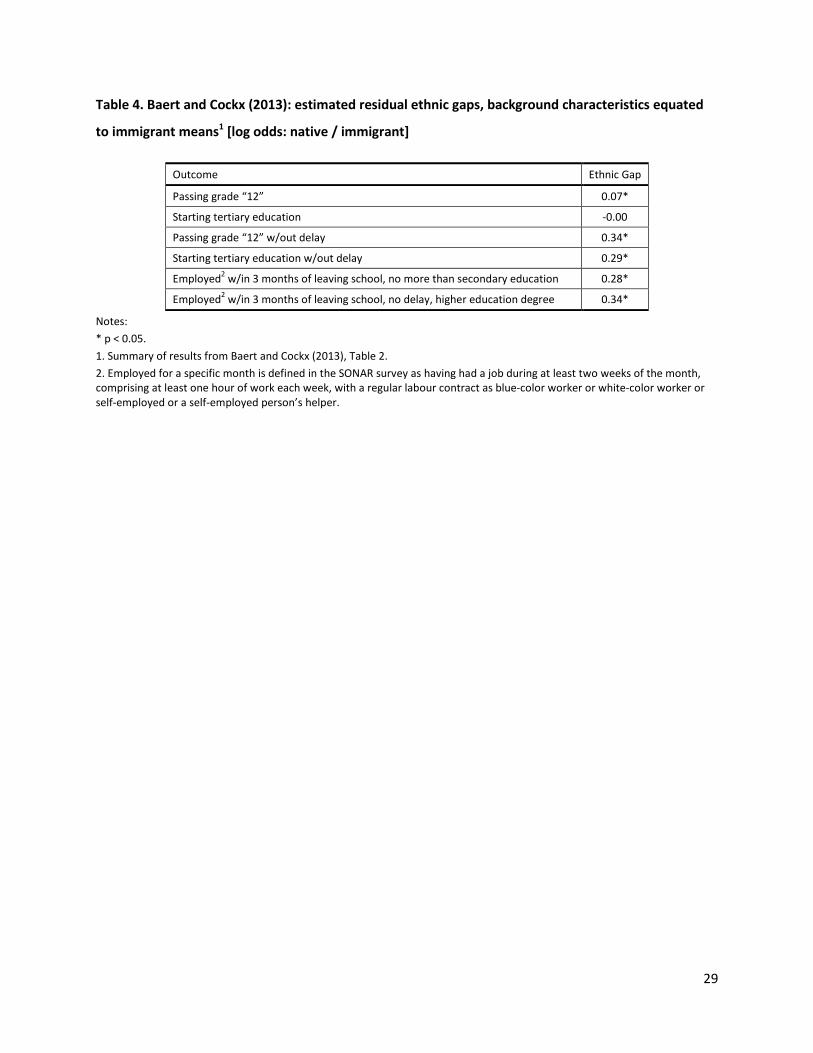
among school leavers in this population; Baert et al., forthcoming). Table 4 summarizes key residual
5 It is not clear that these significance levels adjust for non-independence across multiple observations for the same respondent; the reported N = 127,669 even though the sample includes only about 9,000 unique individuals. 6 Baert and Cockx (2013) argue, in the spirit of Cameron and Heckman (2001), that estimates of residual gaps between natives and immigrants that fail to account for dynamic sorting on unobservable endowments are biased. Performance-based educational progression produces increasingly negative correlations between observed endowments and unobserved endowments as student progress through school beyond the compulsory grades. The effects of observed endowments such as parents’ education are progressively biased downward (understated) as education levels increase. Since minority groups tend to have lower parental education (i.e., “observed endowments”), the residual ethnic gap will also be biased downward (overstated). 7 Unadjusted gaps include, for both less-educated and more-educated youths, that natives were 20 to 23 percentage points more likely than second-generation immigrants to be employed within three months of completing school, 20 to 30 percentage points more likely to complete 12th grade (US-equivalent) and enrolling in tertiary education. The gaps are even larger for on-time graduation and enrollment (i.e. no more than one year of delay).

12
gaps.
<Table 4 about here>
Baert and Cockx also found that a substantial portion of the residual ethnic educational gap arose in the
(US equivalent to) 10th grade or at around age 16 for “on-time” students. Their finding of small residual
ethnic educational gaps but large ethnic gaps in on-time educational attainment arising around age 16 is
reminiscent of findings from the US literature on the consequences of teenage childbearing: initially
large gaps (relative to older mothers) in socioeconomic outcomes associated with early fertility narrow
as teenage mothers enter their late 20s and early 30s and some may reverse (e.g., Hotz, McElroy and
Sanders 2005). This literature suggests that it may be useful to investigate whether the residual ethnic
gaps in Flanders differ by gender and are also found in demographic behaviors such as marriage that
could influence educational and labor market choices and outcomes, or be jointly determined with
them.
Summary and implications for the present study
First, there are few studies of immigrant-native gaps in schooling and labor market outcomes that
sustain a gender focus. Second, studies that include a gender focus have not adjusted for sorting on
unobservables in schooling transitions, nor do they directly link the processes of educational attainment
and school-to-work transitions in a unified framework. Third, though some studies suggest that cultural
differences may contribute to ethnic gaps and gender differences in those gaps, few have studied, in
conjunction with schooling and labor market processes, demographic behaviors such as fertility and
marriage that appear central to cultural explanations for gender differences in economic gaps between
immigrants and natives.
The importance of considering multiple outcome domains in the study of assimilation was stressed by
Lesthaeghe and Surkyn (1995) for Turkish and Moroccan immigrants to Flanders and Brussels. Their
evidence indicated distinctions across outcomes in social change for women. For example, they noted
that women’s schooling and fertility behaviors appeared to be transitioning more rapidly than their
labor market behaviors. This observation led Lesthaeghe and Surkyn to reject simplistic models of social
and economic assimilation (e.g., those that predict similar transitions in all domains from traditional
norms or behaviors to a Western or progressive model).
As we noted, only one study (Glorieux and Laurijssen 2009) presented gender differences in ethnic gaps

13
in schooling and school-work transitions in Flanders. Unlike Baert and Cockx (2013), however, they did
not employ an econometric approach to account for dynamic sorting on unobservables. And, although
Baert and Cockx (2013) controlled for gender in their statistical models, they did not explore gender
differences in the ethnic gaps in schooling and school-work transitions, or consider the role of co-
occurring ethnic gaps in demographic behaviors that differ by gender.
The various authors offered several alternative interpretations of the residual ethnic and gender gaps.
Glorieux and Laurijssen (2009) interpreted larger female than male ethnic employment gaps as evidence
of a cultural explanation linked to traditional roles of women. Baert and Cockx (2013) suggested that the
gaps could reflect “differences in preferences and attitudes between natives and second generation
migrants” (citing Constant, Kraus, Rinne and Zimmermann, 2010, on Germany) or “the role of ethnic
networks” or “class[room] or school segregation of migrants as a consequence of concentration of
immigrants in certain neighborhoods” (citing Dustmann, Machin and Schönberg 2010 and other
studies).
In this study, we provide new estimates of these gender-ethnic gaps, using the econometric approach
taken by Baert and Cockx (2013), allowing ethnic gaps in several educational transitions to differ
between men and women, and a unified framework to study educational and school-work transitions.
We also examine demographic behavioral outcomes (e.g., marriage, fertility and cohabitation) related to
cultural explanations for gender differences in economic gaps between immigrants and natives.
III. Data and Methods8
Data
We use longitudinal data from the SONAR project (roughly translated as the Study of the Transition from
School to Work in Flanders). SONAR data represent cohorts born in three years: 1976, 1978 and 1980.
Interviews were conducted at age 23, 26 and 29, but our data are mainly taken from the first wave to
avoid bias from selective attrition. Ethnic nationality is based on the birth country of the maternal
grandmother, i.e., the maternal grandmother was not born in Belgium or any other Western country for
the youth we label as "immigrant”. The sample is restricted to those who went to school in Flanders
8 This section is based on Baert and Cockx (2013); see that paper for more detail on the sample and methods.

14
from start of nursery school onward, so “immigrants” are mostly second generation. After dropping
those with missing or inconsistent educational or labor market data, the analysis sample includes 7,256
natives (3,698 males and 3,558 females) and 359 immigrants (165 males and 194 females). Among
immigrants, the majority is Turkish (122 individuals) or Moroccan (87 individuals). Nearly all have
obtained Belgian nationality at age 23. For all these individuals we observe multiple schooling and labor
market outcomes, as explained below.
Methods
In order to study the magnitude of gender differences in residual ethnic gaps in educational attainment
and early labor market outcomes we perform simulations similar to those conducted by Baert and Cockx
(2013), though separately for men and women. To this end, we first estimate the model for four
subpopulations: male natives, female natives, male immigrants and female immigrants.9 We then use
the parameter estimates to decompose total ethnic gaps into a part explained by observed endowments
and a residual part related to what they call “pure ethnic” differences. In what follows, we briefly review
their methods.
We follow Baert and Cockx (2013) in modeling school progression and the transition from school to
work as a sequence of discrete outcomes and choices. This sequence starts at the beginning of primary
school, typically at age six. However, pupils can start primary school one year earlier or one year later.
The starting point is, therefore, a model of the number of years of delay at the start of primary
schooling. Since grade-to-grade educational progression is observed only from the start of secondary
school, we collapse primary school grades into a single stage from which the number of years of delay at
the start of secondary education is modeled, conditional on the number of years of delay at the start of
primary school. From secondary education forward, we model for each (secondary and tertiary)
schooling year, conditional on starting it, the probability of passing (versus not passing), and, conditional
on this event, the probability of continuing schooling (at a higher grade if passing or at the same grade if
not passing). Finally, we model the probability of being employed three months after leaving school (or,
in an alternative version of the model, of being employed with a permanent contract two years after
leaving school).
9 For the analyses focused on Turks and Moroccans, we do not separate males and females for reasons of limited sample sizes but only include a dummy variable for female sex.

15
Econometrically, the model is specified as a sequence of (ordered and binary) logistic probabilities. Each
outcome is explained by (i) grade dummies, (ii) a vector of strictly exogenous social background
characteristics, (iii) the accumulated years of schooling delay and (iv) an unobservable component.
Exogenous covariates include mother’s education level, father’s education level, number of siblings, day
of birth within the calendar year, speaking Dutch at the parental home and the (time-varying)
unemployment rate. The unobservable component is comprised of a random individual-specific effect,
an interaction between the individual-specific effect and the accumulated years of schooling delay and
an i.i.d. error term. Concerning the distribution of this random individual-specific effect, we adopt a non-
parametric distribution in the spirit of Heckman and Singer (1984). We assume that this distribution is
characterized by an a priori unknown number, “K”, of points of support to which probabilities are
assigned. The model is estimated by maximum-likelihood techniques. The subsequent logit models are
jointly introduced in the likelihood and jointly estimated since, as a result of the introduction of the
unobservable component in the modeling of all choices and outcomes, these logits are linked with each
other.
The decomposition strategy, outlined in Baert and Cockx (2013), simulates the model on random
samples each of size R (R = 5,000 in the application) of the native and immigrant samples used for
estimation. Let NΖ and IΖ be MR× matrices storing the R random draws from, respectively, the
native (male or female) and immigrant (male or female) youth observed exogenous endowment
distributions and the time-varying strictly exogenous variables. Let Nθ̂ and Iθ̂ denote, respectively, the
native and immigrant parameter estimates including those that refer to the endogenous variables
(grade, g, and schooling delay, Vt) and the unobserved heterogeneity distribution. In this simulation, the
endogenous variables take on all possible values, weighted by their predicted probability of occurrence
according to the parameter estimates. The observed gap as represented by the (gender-specific) log
expected odds ratio of natives to immigrants of a particular outcome O can then be predicted by
simulation as follows:
[ ][ ]
IIIZ
NNNZ
θZ
θZˆ;OPrE
ˆ;OPrElog , Equation (1)
where [ ].;.OPr is the probability that a particular outcome O is realized according to the model
simulation and NE Z and IEZ the expectations over the distributions of NZ respectively IZ .

16
Based on this framework, Baert and Cockx (2013; Equation 8) propose the following decomposition of
the predicted ethnic gap, as expressed by the log odds ratio in Equation (1) into the sum of an
“explained” and a “residual pure ethnic gap”:
[ ][ ][ ][ ]
[ ][ ]
+
=
IIIZ
NIIZ
NIIZ
NNNZ
IIIZ
NNNZ
θZ
θZ
θZ
θZ
θZ
θZ
ˆ;OPrE
ˆ;OPrElogˆ;OPrE
ˆ;OPrElog
ˆ;OPrE
ˆ;OPrElog
. Equation (2)
The first term on the right-hand side of Equation (2) is the gap that can be explained by differences in
the observed endowments NZ and IZ , evaluated by using the parameters as estimated on the native
sample, Nθ̂ . The last term in Equation (2) defines the “pure ethnic gap,” which we call the residual gap.
It reflects the gap between native and immigrant youth induced by differences in the parameter
estimates, including those related to the unobservables, as explained above.
Last, Baert and Cockx (2013) propose a procedure that decomposes the “pure ethnic gap” into parts that
depend on the moments at which it is generated. The procedure uses the fact that a particular
educational attainment can only be realized if successful outcomes were attained at earlier stages:
educational attainments realize sequentially. We can write the probability of a successful educational
outcome as the product of conditional probabilities, where conditioning at each stage is based on a
successful educational outcome at an earlier stage. Thus, by writing the ethnic gaps as a log odds ratio, a
successful educational outcome at a particular stage can be decomposed into a sum of log odds ratios of
the conditional probabilities of educational success at earlier stages.
IV. Results
Residual ethnic gaps by gender in the 2nd generation
We follow Baert and Cockx (2013) in highlighting six educational and school-work transitions: (i) passing
12th grade (US equivalent); (ii) starting tertiary education; (iii) passing 12th grade without delay; (iv)
starting tertiary education without delay; (v) employed within 3 months of leaving school among those
with no more than 12 years of schooling (either on time or delayed); and (vi) employed within 3 months
of leaving tertiary education with a level 1 to 4 degree and less than one year of delay.

17
Figure 1 shows unadjusted proportions for the six outcomes for natives, Turkish and Moroccan second-
generation youth, and the second-generation youth of other immigrant groups, separately for men and
women. Although expected given the disadvantaged backgrounds of immigrants documented in Table 1,
the size of these gaps is noteworthy. For example, the native-immigrant gap in graduating from (US
equivalent to) 12th grade without delay are around 30 percentage points for Turkish and Moroccan men,
14 percentage points for other immigrant men, 40 percentage points for Turkish and Moroccan women
and 13 percentage points for other immigrant women. The gaps in enrolling in tertiary education
without delay are also very large: 24 to 33 percentage points for men and 20 to 45 percentage points for
women, with the largest gaps found for Turks and Moroccans. The figure also shows the results of the
extensive practice of retention (“holding back”) of students in grade in secondary education in Flanders;
a far lower proportion of both natives and immigrants passes the 12th grade without delay than
eventually passes (by age 23).
<Figure 1 and Table 5 about here>
Tables 5 summarize the raw observed ethnic gaps and simulated residual ethnic gaps by gender, based
on the procedures described in the Methods section, for the Turkish and Moroccan second generation
(Panel A) and, for completeness, for the entire immigrant second generation (Panel B). We do not
discuss the results in Panel B since they are, with the exception of residual gaps in on-time schooling for
immigrant males, muted versions of the results in Panel A. The residual gaps are simulated by setting
background factors (“endowments”) for natives to the levels of the immigrant group.10
Due to sample size limitations, the method used differs between the two panels. For Panel B, we
estimate four models for four sub-samples (natives and immigrants, males and females). However, for
Panel A, we estimate two models for two subsamples (natives and Turks/Moroccans) and include a
gender dummy variable in each model, a more restrictive specification. To test the sensitivity of the
results to using this more restrictive specification, we also estimated the more restricted version for the
larger sample (all immigrants). Appendix Table 1 compares the results. The estimated residual gaps are
quite similar using the two modeling approaches.
We find little evidence of a residual ethnic gap for second-generation Moroccan and Turkish men in
passing the (US equivalent to) 12th grade, though we find a modest female gap that is statistically
significant (first row of Panel A). Since native females far outperform native males in educational 10 Results based on setting immigrant endowments to native levels are similar and available from the authors.

18
attainment, the modest ethnic gap among females does not constitute a “double penalty” for immigrant
females; in other words, immigrant women outperform their male counterparts but by less than native
women outperform native males. Ethnic gaps in starting tertiary education (second row of Panel A) are
also modest and not significant. (There is a suggestion that immigrant men are more likely to start
tertiary education than natives of similar background, though the residual gap is not significant.)
The story changes if on-time status is considered. Residual gaps between natives and Turkish and
Moroccan men and women in completing secondary education without delay are 0.30 and 0.55
respectively, and are statistically significant. On the other hand, the residual ethnic gap in starting
tertiary education without delay is large (0.52) and significant only for females.
Finally, the residual ethnic gaps (natives versus Turk/Moroccans) for finding employment three months
after leaving school are large for both men and women, though much larger for women. For finding
work after leaving secondary education, the gaps are 0.30 for men versus 0.64 for women. For finding
work after higher education without delay, the residual ethnic gap is 0.56 for men and 0.85 for women.
For the less-educated group, this larger gap for minority women does represent a “double penalty” since
less-educated native women lag less-educated native men in securing employment. This is not the case
for the more-educated, where native females transition from school to work more quickly than native
males.11
Unlike schooling gaps, there is little difference between the “observed” and “residual” gaps in school-
work transitions. This suggests that, conditional on educational attainment, family socioeconomic
background differences between natives and immigrants do not drive differences in their employment
as would be expected, for example, if higher-status family connections were the key to securing a job.
Our finding of larger residual employment gaps for men also differs from that of Glorieux and Laurijssen
(2009) who reported large effects for women only and, as noted, concluded: “The fact that it is
particularly women of North-African and Turkish descent and not the men that have difficulty in
accessing the labor market, rather points in the direction of the cultural explanation.” While cultural
differences may contribute to the ethnic gap, given this logic, our results would also appear to leave
open a role for discrimination in hiring (see also Baert et al., forthcoming). In the next section, we turn
11 We also estimated models to examine an alternative outcome: employed with a permanent contract two years after leaving school. The point estimates of immigrant (all)-native gaps, presented in Appendix Table 1, are broadly consistent with those reported in Table 5, Panel B, although significance levels change, with some estimates reaching significance at the .05 level and others losing it.
19
to descriptive analyses of demographic behaviors that provide suggestive evidence regarding the
importance of cultural mechanisms underlying residual native-immigrant gaps and gender differences in
the gaps.
Finally, we investigate the impact of modeling unobserved heterogeneity for our results. We present
coefficient estimates from specifications with and without modeling unobserved heterogeneity in
Appendix Table 3. The table reports the estimated coefficients of the gender dummy variable in the
educational and labor market transition model, separately for Turkish and Moroccan immigrants and for
natives. These results suggest little heterogeneity bias in the compulsory schooling years (primary and
secondary education), since the coefficients are similar at the early transitions whether or not
unobserved heterogeneity is modeled. In contrast, there is evidence of heterogeneity bias in transitions
in tertiary education, as evidenced by differences in gender coefficients across the models, especially for
Turks and Moroccans. This is expected since the scope for choice (selection) is greater after compulsory
schooling. In fact, in the model with heterogeneity, the estimated gender differences are larger (in
absolute value), and more so for immigrants than natives. This pattern is consistent with immigrant
female exits from education being more positively selected for unobserved academic ability than male
exits, possibly as the result of marriage or childbearing (i.e., correcting for heterogeneity increases the
female advantage in passing a grade of tertiary education, and greatly reduces the probability of female
exit relative to male). In the following section, we find evidence of gender and nativity differences in
marriage behavior consistent with this interpretation.
Demographic behaviors as cultural mechanisms
As noted, hypotheses about socio-cultural factors underlying gender differences in educational and
labor market outcomes suggest an important role for demographic behaviors such as fertility or
marriage timing. Specifically, immigrants’ traditional gender-role norms are thought to increase second-
generation female responsibilities in the home, reduce investments in their education and their labor
market participation, relative to second-generation males, and relative to the native gender gaps in
these outcomes. We know of no attempts to test these mechanisms empirically.
In principle, demographic behaviors could be included as intervening variables in models similar to those
we estimated above. However, demographic behaviors are clearly endogenously determined with
education, and there are no obvious candidates for valid instrumental variables to identify their causal
effects on educational attainment and employment. And, although SONAR collected attitudinal data

20
that might be informative about gender-role differences between natives and immigrants, this
information was collected only in the later waves of the survey, greatly increasing the scope for reverse
effects (i.e., measured attitudes that are adaptive to or rationalize behaviors ex post facto). Therefore,
rather than attempt a (problematic) incorporation of potentially endogenous attitudinal and
demographic behavioral variables in models of education and employment, we take a more modest
approach and simply estimate models to describe demographic behaviors as outcome variables using
the same set of exogenous explanatory variables as in our earlier models.
<Table 6 about here>
Table 6 provides descriptive information on the demographic outcomes as of age 23, as well as
exogenous covariates. The demographic behavior by age 23 of the Turkish and Moroccan second
generation, especially women, is clearly distinct from natives and other immigrants. Turkish and
Moroccan second-generation women are far more likely to have left the parental home (55% compared
to 38% of natives and 42% of other immigrants). Turkish and Moroccan men are slightly less likely than
other males to have left home by age 23 (19.5 % versus 23.5% among natives and 16.4% among other
immigrants). Yet, Turkish and Moroccan men are somewhat more likely than other men to report that
they are financially independent (second row).
The most dramatic ethnic differences relate to marriage behavior. Among the Turkish and Moroccan
second generation, 51% of women and 40% of men have married by age 23, compared to 11% of native
women, 16% of other immigrant females, and 4% to 6% of other males. This gap narrows but remains
substantial if the outcome is cohabitation (marital or non-marital) rather than marriage.
Fertility behavior also differs by ethnicity. Fully 40% of Turkish and Moroccan women and 22% percent
of Turkish and Moroccan men have had a first child by age 23, compared to less than 3% of other
women and less than 1% of other men (fifth row). Nearly all these births occur between age 20 and 23.
There is virtually no fertility before age 18, and even by age 20 only 9% of Moroccan and Turkish women
and 2% of Moroccan and Turkish men have had first births. Thus, the gaps in secondary education
documented earlier do not appear to result from direct disruptions from early births, though births in
the early 20s may account for gaps in tertiary education. However, expectations of marriage or fertility
could certainly affect educational investments at younger ages.
Background factors clearly differ greatly between second-generation Turks/Moroccans and natives;
other immigrant groups are of intermediate socioeconomic status. The immigrant groups are younger

21
(disproportionately from the 1980 birth cohort), so it is important to control for birth cohort in
regression models, as we do. The parents of the Moroccan and Turkish second generation have much
lower education levels than others (third and fourth row of the lower panel of Table 6). Their mothers,
on average, have almost no successful completed education after age 12 and their fathers have only a
little more (see the table footnote for educational category definitions). In contrast, mothers and fathers
of natives average nearly a complete secondary education. The parents of other second generation
immigrant groups are intermediate, averaging at least some secondary education. Furthermore, the
Turkish and Moroccan second generation grew up in much larger families (sixth row of the lower panel)
and was less likely to speak Dutch in the parental home. We test the sensitivity of our results to
controlling for this language difference. Lastly, they were also more likely to delay the start of their
schooling (the initial conditions of the econometric model we used to calculate residual ethnic gaps by
gender) with about 7% to 8% beginning after age 6.
<Tables 7 about here>
Table 7 shows results (marginal effects) from logistic regression with multivariate controls. For each
outcome we estimate three models using increasingly rich sets of control variables: (i) controls for
cohort dummy only; (ii) cohort dummies plus controls for parent’s education (seven dummies each for
mother’s and father’s educational category), number of siblings and a dummy for delayed start of
school; and (iii) an additional control for Dutch spoken in the parental home.
For the most part, although there are large differences between Turkish and Moroccan second-
generation youths and natives in demographic outcomes when we adjust only for cohort (model i), very
few differences remain large and statistically significant after controls for background SES (model ii).
Exceptions include leaving the parental home (for men) and marriage (for men and women). Specifically,
after controls, native males are more likely to leave the parental home by age 23 than Turkish and
Moroccan immigrants (20 percentage points) or other immigrant groups (14 percentage points). Turkish
and Moroccan women are 13 percentage points more likely and Turkish and Moroccan men are 10
percentage points more likely, to marry by age 23 than their native same-gender counterparts,
controlling for background SES. Interestingly, after SES controls there are no sizable or significant
differences in cohabitation (marital or non-marital).
If we interpret the role of marriage in education and employment as indicating a gender-role cultural
difference linked to responsibilities for children, the evidence for this hypothesis is decidedly mixed. This

22
is shown in the next three panel of Table 7 where we present results for models of fertility. Although
unadjusted (other than cohort) ethnic gaps in having a birth by age 23 are large (0.17 for women and
0.08 for men), after adjusting for SES, the ethnic gap becomes quite modest (0.03 for Turkish and
Moroccan women and men versus their native counterparts, and is not significant for women).
Disadvantaged background SES can account for the vast majority of the ethnic fertility difference
without invoking cultural factors. This also means that, since immigrants have progressed educationally,
the (raw) fertility gaps should narrow.12
V. Conclusion
In this study we investigate the large differences in education, employment and demographic behaviors
between natives and second-generation immigrants, males and females, particularly for Turks and
Moroccans in Flanders, Belgium.
Using a unified statistical framework of educational and school-to-work transitions that accounts for
educational sorting on unobservables, we present new estimates of native-immigrant gaps in education
and employment by gender, adjusted for family background. We find that second-generation Turkish
and Moroccan youths lag natives in timely completion of secondary schooling, beginning tertiary
education and in school-to-work transition, even after adjusting for differences in family socio-economic
background. These residual ethnic gaps are larger for women than men. For example, among less-
educated persons, native males are approximately 30% more likely than Turkish and Moroccan males to
be employed three months after leaving school, while the corresponding female employment gap is
greater than 60%. These employment gaps change little when we adjust for family socioeconomic
background.
Explanations for residual ethnic and gender gaps in employment have centered on the role of
employment discrimination and cultural differences. A recent audit study found evidence for
discrimination in hiring in Flanders, though only tested for discrimination against Turkish males (Baert et
al. forthcoming). The cultural explanation posits that immigrants adhere more to traditional gender
roles resulting in early marriage and reduced labor force participation among women (e.g., Lesthaeghe 12 In order to explore whether the fertility and marriage results are sensitive to our modeling choice (logistic regression) or the specific age cut-offs for the outcomes (age 18, age 20, age 23), we estimated Cox proportional hazard models for first marriage and first birth (see Appendix Table 4 for results). Qualitatively, results are very similar to the corresponding results reported in Table 7.
23
and Surkyn 1995). Consistent with this explanation, our results show substantial residual ethnic gaps in
the transition to first marriage by age 23. Yet there is little evidence of residual ethnic gaps in other
demographic behaviors such as transition to a first birth and cohabitation (marital or non-marital).
Therefore, we offer no simple explanation for residual ethnic gaps. Some have suggested that
discrimination alone would predict a greater ethnic employment gap among men than women
(Timmerman, Vanderwaeren and Crul 2003, p. 1080; Glorieux and Laurijssen 2009, p. 9), which is
inconsistent with our findings. Still, given evidence of large (unadjusted) ethnic differences in early
fertility and marriage, the possibility remains that Turkish and Moroccan women face statistical
discrimination in the transition to employment related to employers’ expectations of their early
marriage and family formation. As a result, it may be difficult to disentangle the culture and
discrimination explanations for residual ethnic gaps.13
This observation and our other results have implications for future research on ethnic employment gaps.
First, it would be useful to repeat the employment audit study of Baert et al. (forthcoming) for a pool of
female applicants with an emphasis on family processes (e.g., Correll, Benard and Paik 2007). Second,
because for education outcomes we found large residual ethnic education gaps in “on time” education
only, studies are needed to establish the importance of timely progression in education for labor market
and other economic outcomes. This would seem particularly important for Flanders since a substantial
proportion of natives also complete education with delays (see Figure 1; also Baert and Cockx 2013).
We close with some speculative remarks on the economic progress of Turks and Moroccans in Flanders.
First, we note the enormous increases in education between the immigrant (parental) and second
generation (youths). Whereas 70 to 80 percent of their parents lacked education beyond age 12, over
70% of the second generation completed secondary education and more than half entered tertiary
education. Trends in educational attainment alone would predict substantial economic progress in the
2nd and 3rd+ generations.
Nonetheless, there are long-standing concerns that cultural ties may undermine or slow economic
progress predicted by educational improvements, especially for women. A specific central issue that has
attracted the attention of policymakers is the practice of migrant marriage, especially among the Turkish
population. As we noted, as recently as the early 2000s when the data used here were collected, 60% of
13 In a new study, Hartmann (2014), using longitudinal data for Germany, reached similar conclusions regarding gender differences in attainment of middle-class status among the Turkish second-generation.

24
second-generation Turkish males and females in Belgium married a first-generation migrant
(Timmerman, Lodewyckx and Wets 2009). Policymakers in Flanders have targeted marriage migration in
their “Pact 2020” (Pelfrene, Doyen and Hellemans 2009). Since the early 2000s, however, marriage
migration may have declined by as much as fifteen percentage points among second-generation Turks in
Belgium (Van Kerckem et al. 2013). This decline was offset mostly by increases in native intra-ethnic
marriage (with a slight rise in out-group marriage, mostly among males). Although these changing
marriage patterns could boost economic progress, that is a topic for further study.

25
Figure 1. Unadjusted Schooling and School-to-Work Transition Outcomes by Immigrant Status and Gender

26
Table 1. Selected Background and Outcome Variables, SONAR1 Data [means (SEs) and proportions]
Males Females
Native “Second Generation”
Native “Second Generation”
Turkish and Moroccan Other Turkish and
Moroccan Other
Family SES Background
No parental education after age 12
Mother 13 83 37 13 81 41
Father 12 80 27 13 71 36
Number of Siblings 1.5
(0.0) 4.3
(0.2) 2.0
(0.2) 1.6
(0.0) 4.8
(0.2) 2.4
(0.2)
Outcomes
Entered tertiary education 75 45 61 86 50 73
In school at age 23 19 8 18 16 6 9
Not working within 3 months of leaving school2 (among those who finish school by age 23) 25 53 33 29 68 39
By exact age 23: Ever marry
3
37
4
9
50
15
Ever cohabit or marry 19 44 11 36 56 36
Sample size (maximum) 3,718 92 73 3,569 118 78
Notes: 1. SONAR: Study of the Transition from School to Work in Flanders. 2. Employed for a specific month is defined in the SONAR survey as having had a job during at least two weeks of the month, comprising at least one hour of work each week, with a regular labour contract as blue-color worker or white-color worker or self-employed or a self-employed persons’ helper.

27
Table 2. Fleishmann and Kristen (2014): adjusted female – male gaps in four educational outcomes,
Belgium1
Native “Second generation”
Turkish Moroccan
Language test scores (SD) 0.36* 0.18 0.33
Academic track (probit, marginal effects) 0.22* -0.25* 0.05
Completion upper secondary (probit, marginal effects) 0.33* 0.30 0.27
Completion tertiary (probit, marginal effects) 0.39* 0.18 0.23
Notes: * p < 0.05. 1. Summary of results from Fleishmann and Kristen (2014), Tables 3, 5, 6 and 7.

28
Table 3. Glorieux and Laurijssen (2009): not working within 1 year of school leaving [proportions]
Males Females
Native 12.7 16.2
Non-native 22.2 43.4
Turkish 25.5 67.0
North African 38.6 56.5
Notes: 1. Summary of results from Glorieux and Laurijssen (2009), Table 5.
29
Table 4. Baert and Cockx (2013): estimated residual ethnic gaps, background characteristics equated
to immigrant means1 [log odds: native / immigrant]
Outcome Ethnic Gap
Passing grade “12” 0.07*
Starting tertiary education -0.00
Passing grade “12” w/out delay 0.34*
Starting tertiary education w/out delay 0.29*
Employed2 w/in 3 months of leaving school, no more than secondary education 0.28*
Employed2 w/in 3 months of leaving school, no delay, higher education degree 0.34*
Notes: * p < 0.05. 1. Summary of results from Baert and Cockx (2013), Table 2. 2. Employed for a specific month is defined in the SONAR survey as having had a job during at least two weeks of the month, comprising at least one hour of work each week, with a regular labour contract as blue-color worker or white-color worker or self-employed or a self-employed person’s helper.

30
Table 5. Estimated Residual Ethnic Gaps with Background Characteristics Set to Immigrant Levels1 [log
odds: native / immigrant]
A. Natives versus Turkish and Moroccan Second Generation
Ethnic Gaps, Males Ethnic Gaps, Females
Observed Residual Observed Residual
(1) (2) (3) (4)
Passing grade “12” (US equivalent) 0.27 -0.02 0.29 0.12*
Starting tertiary education 0.52 -0.23 0.54 0.11
Passing grade “12” w/out delay 0.77 0.30* 0.85 0.55*
Starting tertiary education w/out delay 1.05 0.09 1.11 0.52*
Employed w/in 3 months of leaving school, no more than secondary education 0.39 0.30* 0.68 0.64*
Employed w/in 3 months of leaving school, no delay, higher education degree 0.66 0.56* 0.62 0.85*
B. Natives versus Immigrant Second Generation (all)
Ethnic Gaps, Males Ethnic Gaps, Females
Observed Residual Observed Residual
(1) (2) (3) (4)
Passing grade “12” (US equivalent) 0.23 0.11* 0.19 0.05*
Starting tertiary education 0.36 -0.01 0.39 0.05*
Passing grade “12” w/out delay 0.73 0.49* 0.55 0.28*
Starting tertiary education w/out delay 0.89 0.40* 0.74 0.24*
Employed2 w/in 3 months of leaving school, no more than secondary education 0.25 0.16 0.42 0.43*
Employed2 w/in 3 months of leaving school, no delay, higher education degree 0.46 0.36* 0.30 0.31*
Notes: * p < 0.05; + 0.05 ≤ p < 0.10. 1. Covariates include mother’s education level, father’s education level, number of siblings, day of birth within the calendar year, speaking Dutch at the parental home and the (time-varying) unemployment rate. See the Methods section for discussion of unobserved heterogeneity modeling. 2. Employed for a specific month is defined in the SONAR survey as having had a job during at least two weeks of the month, comprising at least one hour of work each week, with a regular labour contract as blue-color worker or white-color worker or self-employed or a self-employed person’s helper.

31
Table 6. Demographic Behaviors as Cultural Mechanisms: Descriptive Statistics [means (SEs) and
proportions]
Variable
Males Females
Native
Second Generation Native
Second Generation
Turkish and Moroccan Other Turkish and Moroccan Other
By age 23, % ever…?
Left parent home 23.5 19.5 16.4 38.3 54.7 41.6
Financially independent 53.4 67.4 47.9 58.0 66.6 61.0
Married 3.8 40.2 5.5 11.3 51.3 15.6
Cohabited (married or not) 24.4 44.6 13.7 42.9 57.3 42.9
Had a child 3.8 21.7 2.7 9.2 40.1 11.7
Had a 2nd child 0.5 3.3 0.0 2.4 9.4 2.6
Birth @ age<18 0.2 1.1 0.0 0.5 0.9 0.0
Birth @ age<20 1.0 2.2 1.4 1.5 9.4 1.3
SES / Background
Birth Cohort 1976
31.8
22.8
20.6
31.6
23.1
13.0
1978 34.1 25.0 32.9 34.4 29.9 28.6
1980 34.1 52.2 46.6 34.0 47.0 58.4
Education after age 121
Mother 5.6
(0.1) 0.8
(0.2) 3.4
(0.4) 5.5
(0.1) 0.8
(0.2) 3.2
(0.4)
Father 6.0
(0.1) 0.9
(0.2) 4.6
(0.4) 5.9
(0.1) 1.2
(0.2) 3.6
(0.4)
Number of Siblings 1.5
(0.0) 4.3
(0.2) 2.0
(0.2) 1.6
(0.0) 4.9
(0.2) 2.4
(0.2)
Dutch @ home 98.4 71.7 86.3 98.6 78.6 83.1
Delay school start? 1.2 7.6 2.7 1.1 6.8 0.0
Sample size (maximum) 3,718 92 73 3,558 118 78
Notes: 1. Maternal and paternal education age is a categorical variable ranging from 0 to 13 with higher-numbered categories generally indicating more education after age 12; regressions include dummy variables for each category; 0: Primary education (or no diploma at all); 3: Lower secondary education; 6: Higher secondary education or apprenticeship; 7: Non-higher level post-secondary education (vocational or technical); 9: Non-university higher education - "short type"; 10: Non-university higher education - "long type"; 11: Academic education; 13: Post-academic / doctoral education.

32
Table 7. Demographic Behaviors as Cultural Mechanisms: Logistic Regression Models [marginal effects
(SEs)]
Outcomes / controls1 Males Females
Turkish and Moroccan
Other second generation
Turkish and Moroccan
Other second generation
Leave Parental Home
1. cohort only -0.05 (0.05) -0.09+ (0.06) 0.14* (0.04) -0.00 (0.05)
2 = 1 + background -0.20* (0.05) -0.14* (0.06) -0.02 (0.05) -0.07 (0.05)
3 = 2 + NDL home lang. -0.20* (0.05) -0.14* (0.06) -0.03 (0.05) -0.08 (0.05)
Financial Independence
1. cohort only 0.15* (0.05) -0.05 (0.06) 0.09+ (0.05) 0.03(0.06)
2 = 1 + background -0.02 (0.06) -0.11+ (0.06) -0.04 (0.05) -0.04 (0.06)
3 = 2 + NDL home lang. -0.01 (0.06) -0.10+ (0.06) -0.03 (0.05) -0.03 (0.06)
Marry
1. cohort only 0.12* (0.01) 0.02 (0.02) 0.23* (0.02) 0.04 (0.03)
2 = 1 + background 0.10* (0.01) 0.01 (0.02) 0.13* (0.02) -0.00 (0.03)
3 = 2 + NDL home lang. 0.09* (0.01) 0.01 (0.02) 0.13*(0.02) -0.01 (0.03)
Cohabit (including marriage)
1. cohort only 0.16* (0.04) -0.14* (0.06) 0.14* (0.05) -0.01 (0.06)
2 = 1 + background 0.05 (0.04) -0.18* (0.06) -0.01 (0.05) -0.08 (0.06)
3 = 2 + NDL home lang. 0.05 (0.05) -0.17* (0.06) -0.02 (0.05) -0.09 (0.06)
Birth by age 23
1. cohort only 0.08* (0.01) -0.01 (0.03) 0.17*(0.02) 0.02 (0.03)
2 = 1 + background 0.03* (0.01) -0.03 (0.03) 0.03 (0.02) -0.05 (0.03)
3 = 2 + NDL home lang. 0.02+ (0.01) -0.03 (0.03) 0.01 (0.02) -0.06+ (0.03)
Birth before age 18
1. cohort only 0.00 (0.01) --2 0.00 (0.01) --2
2 = 1 + background -0.00 (0.01) --2 -0.01 (0.01) --2
3 = 2 + NDL home lang. -0.01 (0.01) --2 -0.01 (0.01) --2
Birth before age 20
1. cohort only 0.01 (0.01) 0.00 (0.01) 0.03* (0.01) -0.00 (0.02)
2 = 1 + background -0.01 (0.01) -0.00 (0.01) 0.00 (0.01) -0.02 (0.02)
3 = 2 + NDL home lang. -0.01 (0.01) -0.01 (0.01) 0.00 (0.01) -0.02 (0.02)
Notes: * p < 0.05; + 0.05 ≤ p < 0.10. 1. Controls are: “Cohort”: 2 dummies to indicate 3 birth cohorts. “Background”: number of siblings, and dummy variables for delayed start of school, mother’s (7) and father’s (7) educational category beyond age 12. “NDL home lang.”: dummy variable for speaking Dutch in the parental home. 2. Coefficients could not be estimated due to lack of variation in the outcome for this population.

33
References
Akerlof, George and Rachel Kranton. 2007. Identity economics. Princeton, NJ: Princeton University Press.
Baert, Stijn and Bart Cockx. 2013. Pure Ethnic Gaps in Educational Attainment and School to Work
Transitions: When Do They Arise? Economics of Education Review 36: 276-294.
Baert, Stijn, Bart Cockx, Niels Gheyle and Cora Vandamme. Forthcoming. Is there Less Discrimination in
Occupations where Recruitment is Difficult? Industrial and Labor Relations Review.
Cameron, Steven V. and James J. Heckman. 2001. The dynamics of educational attainment for black,
Hispanic and white males. Journal of Political Economy 109: 455-499.
Constant, Amelie F., Annabelle Krause, Ulf Rinne and Klaus F. Zimmermann. 2010. Economic preferences
and attitudes of the unemployed: Are natives and second generation migrants alike? International
Journal of Manpower 32: 825-851.
Correll, Shelley J., Stephen Benard and In Paik. 2007. Getting a Job: Is there a Motherhood Penalty?
American Journal of Sociology 112: 1297-1338.
Dronkers, Jaap and Nils Kornder. 2014a. Do migrant girls perform better than migrant boys? Deviant
gender differences between the reading scores of 15-year-old children of migrants compared to native
pupils. Educational Research and Evaluation 20: 44-66.
Dronkers, Jaap and Nils Kornder. 2014b. Can gender differences in educational performance of 15-year-
old migrant pupils be explained by society gender equality in origin and destination countries? Compare:
A Journal of Comparative and International Education. DOI: 10.1080/03057925.2014.911658.
Dustmann, Christian and Tommaso Frattini. 2013. Immigration: The European Experience. In D. Card, E.
Moretti and S. Raphael, eds. 2013. Immigration, Poverty, and Socioeconomic Inequality. New York:
Russell Sage Foundation. (Page numbers in the text refer to CReAM DP 22/11. Department of
Economics, University College London. November 2012).
Dustmann, Christian, Tommaso Frattini and Gianandrea Lanzara. 2012. Educational achievement of
second-generation immigrants: an international comparison. Economic Policy Journal (January): 143-
185.
Dustmann, Christian, Stephen Machin and Uta Schönberg. 2010. Ethnicity and Educational Achievement

34
in Compulsory Schooling. Economic Journal 120: 272-297.
Fleischmann, Fanella and Cornelia Kristen. 2014. Gender inequalities in the education of the second
generation in Western countries. Sociology of Education 87: 143-170.
Glorieux, Ignace and Ilse Laurijssen. 2009. The labor market integration of ethnic minorities in Flanders.
TOR 2009/17. Brussels: Department of Sociology, Research Group TOR, Vrije Universiteit Brussel.
Hartmann, Jörg. 2014. Do second-generation Turkish migrants in Germany assimilate into the middle
class? Ethnicities, pre-publication web version, accessed December 18, 2014.
Heckman, James J and Burton Singer. 1984. A Method for Minimizing the Impact of Distributional
Assumptions in Econometric Models for Duration Data. Econometrica 52: 271-320.
Hotz, V. Joseph, Susan W. McElroy and Seth G. Sanders. 2005. Teenage childbearing and its life cycle
consequences: Exploiting a natural experiment. Journal of Human Resources 40: 683-715.
Lesthaeghe, Ron. Undated. The FFVP and MHSM-surveys among Turkish and Moroccan populations in
Belgium: A concise field report.
Lesthaeghe, Ron and Johan Surkyn. 1995. Heterogeneity in Social Change: Turkish and Moroccan
Women in Belgium. European Journal of Population 11: 1-29.
Pelfrene, Edwin, Geraldine Doyen and Inge Hellemans. 2009. Immigration and migrant integration
policies in Flanders (Belgium). Research Center for the Flemish Government (SVR), October 27.
Prokic-Breuer, Tijana and Jaap Dronkers. 2012. The high performance of Dutch and Flemish 15-year-old
native pupils: Explaining country differences in math scores between highly stratified educational
systems. RM/12/038. Maastricht: Maastricht University.
Rouse, Cecelia and Lisa Barrow. 2006. U.S. Elementary and Secondary Schools: Equalizing Opportunity or
Replicating the Status Quo? The Future of Children 16: 99-123.
Timmerman, Christiane, Els Vanderwaeren and Maurice Crul. 2003. The second generation in Belgium.
International Migration Review 27: 1065-1090.
Timmerman, Christiane, Ina Lodewyckx and Johan Wets. 2009. Marriage at the intersection between
tradition and globalization: Turkish marriage migration between Emirdag and Belgium from 1989 to

35
present. History of the Family 14: 232-44.
Van Kerckem, Klaartje, Koen Van der Bracht, Peter A. J. Stevens and Bart Van de Putte. 2013.
Transnational Marriages on the Decline: Explaining Changing Trends in Partner Choice among Turkish
Belgians. International Migration Review 47: 1006–1038.

36
Appendix Table 1: Estimated Residual Ethnic Gaps with Background Characteristics Set to Immigrant Levels: Comparison of Results Across
Two Methods for Estimating Residual Gaps [log odds: native / immigrant]
A. Gender dummy variable included in models run separately for immigrants and natives men and women (two models/samples)
Natives versus Immigrant Second Generation (all)
Ethnic Gaps, Males Ethnic Gaps, Females
Observed Residual Observed Residual
(1) (2) (3) (4)
Passing grade “12” (US equivalent) 0.23 0.02 0.19 0.10*
Starting tertiary education 0.36 -0.12 0.39 0.08
Passing grade “12” w/out delay 0.73 0.30* 0.55 0.36*
Starting tertiary education w/out delay 0.89 0.18+ 0.74 0.36*
Employed w/in 3 months of leaving school, no more than secondary education 0.25 0.19* 0.42 0.36*
Employed w/in 3 months of leaving school, no delay, higher education degree 0.46 0.27* 0.30 0.41*
B. Models run separately for natives and immigrants, men and women (four models/samples)
Natives versus Immigrant Second Generation (all)
Ethnic Gaps, Males Ethnic Gaps, Females
Observed Residual Observed Residual
(1) (2) (3) (4)
Passing grade “12” (US equivalent) 0.23 0.11* 0.19 0.05*
Starting tertiary education 0.36 -0.01 0.39 0.05*
Passing grade “12” w/out delay 0.73 0.49* 0.55 0.28*
Starting tertiary education w/out delay 0.89 0.40* 0.74 0.24*
Employed w/in 3 months of leaving school, no more than secondary education 0.25 0.16 0.42 0.43*
Employed w/in 3 months of leaving school, no delay, higher education degree 0.46 0.36* 0.30 0.31*
Notes. Covariates include mother’s education level, father’s education level, number of siblings, day of birth within the calendar year, speaking Dutch at the parental home and the (time-varying) unemployment rate. See the Methods section for discussion of unobserved heterogeneity modeling. * p < 0.05; + 0.05 ≤ p < 0.10.

37
Appendix Table 2: Estimated Residual Ethnic Gaps with Background Characteristics Set to Immigrant Levels: Comparison of Results Across
Two School-to-Work Outcomes [log odds: native / immigrant]
A. School-work outcome: permanent contract 2 years after leaving school
Natives versus Immigrant Second Generation (all)
Ethnic Gaps, Males Ethnic Gaps, Females
Observed Residual Observed Residual
(1) (2) (3) (4)
Passing grade “12” (US equivalent) 0.23 0.10* 0.19 0.06*
Starting tertiary education 0.36 -0.02 0.39 0.05*
Passing grade “12” w/out delay 0.73 0.49* 0.55 0.28*
Starting tertiary education w/out delay 0.89 0.41* 0.74 0.24*
Permanent contract 2 years after leaving school, no more than secondary education 0.59 0.61* 0.84 0.60
Permanent contract 2 years after leaving school, higher education degree, less than 1 year of delay 0.39 0.25 0.18 0.32
B. School-to-work outcome: employed 3 months after leaving school
Natives versus Immigrant Second Generation (all)
Ethnic Gaps, Males Ethnic Gaps, Females
Observed Residual Observed Residual
(1) (2) (3) (4)
Passing grade “12” (US equivalent) 0.23 0.11* 0.19 0.05*
Starting tertiary education 0.36 -0.01 0.39 0.05*
Passing grade “12” w/out delay 0.73 0.49* 0.55 0.28*
Starting tertiary education w/out delay 0.89 0.40* 0.74 0.24*
Employed w/in 3 months of leaving school, no more than secondary education 0.25 0.16 0.42 0.43*
Employed w/in 3 months of leaving school, no delay, higher education degree 0.46 0.36* 0.30 0.31*
Notes. Covariates include mother’s education level, father’s education level, number of siblings, day of birth within the calendar year, speaking Dutch at the parental home and the (time-varying) unemployment rate. See the Methods section for discussion of unobserved heterogeneity modeling. * p < 0.05; + 0.05 ≤ p < 0.10.

38
Appendix Table 3: Effects of modeling unobserved heterogeneity on female dummy variables in models of educational attainment and
school-work transitions, Turkish and Moroccan Immigrants and Natives [coefficients (SEs)]
Transition (outcome) Turkish and Moroccan Natives
Not modeling unobserved heterogeneity
Modeling unobserved heterogeneity
Not modeling unobserved heterogeneity
Modeling unobserved heterogeneity
Delay start of primary education -0.15 (0.56) -0.16 (0.56) 0.17 (0.16) 0.16 (0.16)
Delay start of secondary education 0.62 (0.17) 0.69 (0.20) 0.61 (0.04) 0.61 (0.04)
Passing a year in secondary education 0.05 (0.32) 0.44 (0.43) 0.37 (0.04) 0.38 (0.04)
Continue school at end of year in secondary education -0.73 (0.33) -0.71 (0.35) -0.37 (0.06) -0.37 (0.06)
Passing year in tertiary education 0.49 (0.30) 0.46 (0.31) -0.30 (0.09) -0.28 (0.09)
Continue school at end of year in tertiary education -0.27 (0.25) -0.30 (0.26) 0.45 (0.07) 0.66 (0.09)
Employed 3 months after leaving school -0.23 (0.32) -1.66 (0.64) -0.04 (0.04) -0.45 (0.08)

39
Appendix Table 4. Demographic Behaviors as Cultural Mechanisms: Cox Proportional Hazard Models [Hazard Ratios [95% CI]]
Outcomes / controls1 Females Males
Turkish and Moroccan
Other second generation Turkish and Moroccan Other second
generation
First Marriage
1. cohort only 7.0* [5.4, 9.3] 1.5 [0.8, 2.7] 16.8* [11.6, 24.3] 1.4 [0.6, 4.1]
2= 1 + background 3.3*[2.3, 4.7] 1.0 [0.6, 1.8] 9.8* [5.6, 16.9] 1.3 [0.5, 3.4]
3=2 + NDL home lang. 3.1* [2.1, 4.5] 1.0 [0.5, 1.7] 8.3* [4.7, 14.8] 1.1 [0.4, 3.2]
First Birth
1. cohort only 5.5* [4.0, 7.4] 1.3 [0.7, 2.6] 6.3 [4.0, 10.2] 0.7 [0.2, 3.0]
2= 1 + background 1.2 [0.8, 1.9] 0.6 [0.3, 1.2] 1.8+ [1.0, 3.2] 0.5 [0.1, 1.8]
3=2 + NDL home lang. 1.1 [0.7, 1.7] 0.6+ [0.3, 1.1] 1.6 [0.8, 3.0] 0.4 [0.1, 1.8]
Notes. Controls are: “Cohort”: 2 dummies to indicate 3 birth cohorts. “Background”: number of siblings, and dummy variables for delayed start of school, mother’s (7) and father’s (7) educational category beyond age 12. “NDL home lang.”: dummy variable for speaking Dutch in the parental home. * p < 0.05; + 0.05 ≤ p < 0.10.