what drives interest rates volatility? · pdf filewhat drives interest rates volatility? ......
TRANSCRIPT

What Drives Interest Rates Volatility?
Piotr Karasinski
European Bank for Reconstruction and Development
CASS Seminar in Financial Engineering
26 May, 2011

2
Disclaimer
• The contents of this presentation reflect the opinions of the author
and do not necessarily reflect the views of the EBRD
3
Data Sources
• Barclays Capital – I would like to thank Barclays Capital for generously allowing me to use their
interest rate and implied swaption volatility data (EUR, GBP, USD).
• US Federal Reserve Statistical Release: H.15 Publication
• www.rateinflation.com
• Drivatives Trading Systems Ltd.

4
Outline
• Introduction
• Historical moving window basis point volatility
• Implied ATM swaption volatilities since the late 90’s
• Conclusions
5
Introduction• The purpose of this presentation is to review the old question
“What drives interest rate volatility?” especially in light of the recent “credit-crunch” and market behaviour in its wake.
• The choice of the dependence of rates volatility on the term- structure of interest rates plays a fundamental role in interest rate models building. In forward-libor model we write:
• Traditional models: lognormal, shifted-lognormal (Q-model, norm-log), normal, CEV: square-root, 3/2.
dWLfdtdL })({(...)
6
Introduction: continued
Empirical Questions:
• What is the rate-level dependence of:– the moving window historical volatilities?– the at-the-money implied swaption volatilities?
• Does rate volatility depend on curve slope?
• Does rate volatility depend on whether we are in rate rising/falling environment?

Historical Moving Window Volatilities

8
Calculating Moving Window Volatility
• We estimate volatility for a given day in the past by taking the weighted average of absolute daily changes of the preceding and the following 30 daily observations (in total 60 observations)
• Weights decay exponentially with the time distance from the given day
• Volatility formula:
• We use a = 0.98
),30min(
)1,30max(
||
),30min(
)1,30max(
||
2 Nni
ni
in
Nni
nii
in
n
a
ra
A Bit of History• DECEMBER 1969 – NOVEMBER 1970
• Oil Crisis November 1973 – March 1975
• 1970s stagflation: “Persistent high inflation combined with high unemployment and stagnant demand in a country's economy”
• September 1979 – December 1982 Volcker’s Monetary Experiment
• JULY 1990 – MARCH 1991
• Tightening of 1994
• MARCH 2001 – NOVEMBER 2001– The bursting of the dot-com bubble, corporate scandals: Enron and Worldcom, deflationary
pressures, 9/11
• DECEMBER 2007 – JUNE 2009
9

10
1970 1980 1990 2000 2010
05
1015
Date
Infla
tion
/ 1Y
CM
T R
ate
US Inflation and 1Y CMT
US InflationUS 1Y CMT
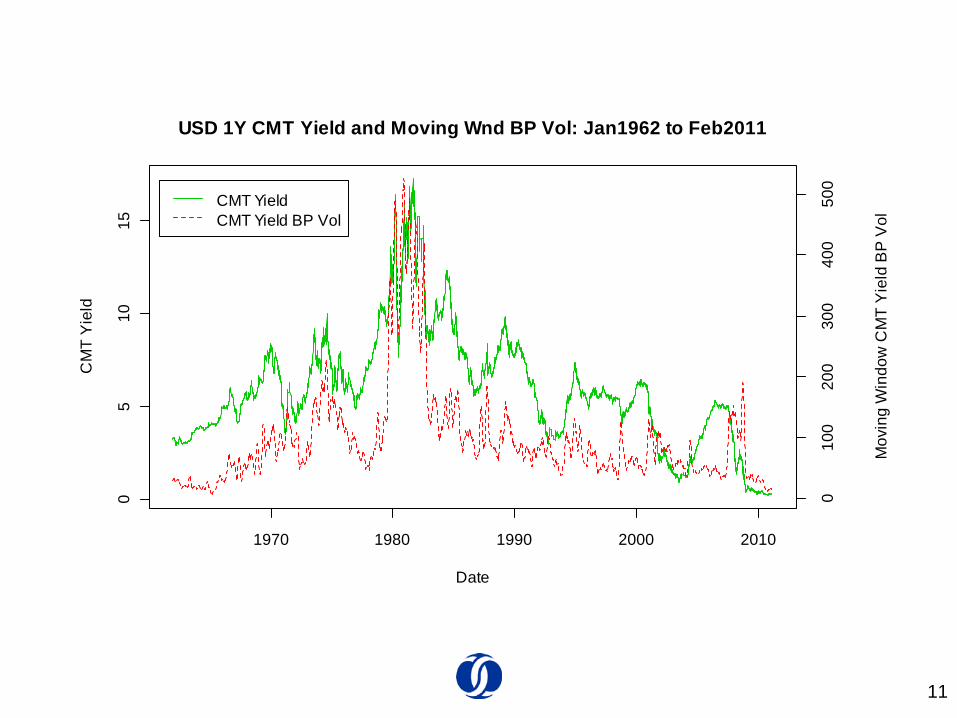
11
1970 1980 1990 2000 2010
05
1015
Date
CM
T Y
ield
010
020
030
040
050
0
Mov
ing
Win
dow
CM
T Y
ield
BP
Vol
USD 1Y CMT Yield and Moving Wnd BP Vol: Jan1962 to Feb2011
CMT YieldCMT Yield BP Vol

12
1970 1980 1990 2000 2010
24
68
1012
1416
Date
CM
T Y
ield
050
100
150
200
250
300
350
Mov
ing
Win
dow
CM
T Y
ield
BP
Vol
USD 10Y CMT Yield and Moving Wnd BP Vol: Jan1962 to Feb2011
CMT YieldCMT Yield BP Vol

13
1979 1980 1981 1982 1983
810
1214
16
Date
CM
T Y
ield
100
200
300
400
500
Mov
ing
Win
dow
CM
T Y
ield
BP
Vol
USD 1Y CMT Yield and Moving Wnd BP Vol: Jan1979 to Feb1983
CMT YieldCMT Yield BP Vol

14
0 5 10 15
010
020
030
040
050
0
CMT Yield
CM
T W
indo
w V
olat
ility
USD 1Y CMT Historical Window Vol vs Yield: Jan 1962 to Feb 2011
Before Sep1979Sep1979 to Dec1982Jan1983 to May2007Jun2007 to Mar2009After Mar2009

15
0 5 10 15
010
020
030
0
C M T Yie ld
CM
T M
ovin
g W
indo
w B
P V
olat
ility
US D 5 Y C M T M o v in g W in d o w B P V o l v s Y ie ld : J a n 1 9 6 2 to F e b 2 0 1 1
B efo re S ep1979S ep1979 to D ec1982Jan1983 to M ay2007Jun2007 to M ar2009A fte r M ar2009

16
0 5 10 15
-200
-100
010
020
0
1Y CMT Yield
5Y -
1Y Y
ield
Spr
ead
5Y - 1Y CMT Spread vs 1Y CMT Yield: Jan1962 to Feb2011
Before Sep1979Sep1979 to Dec1982Jan1983 to May2007Jun2007 to Mar2009After Mar2009
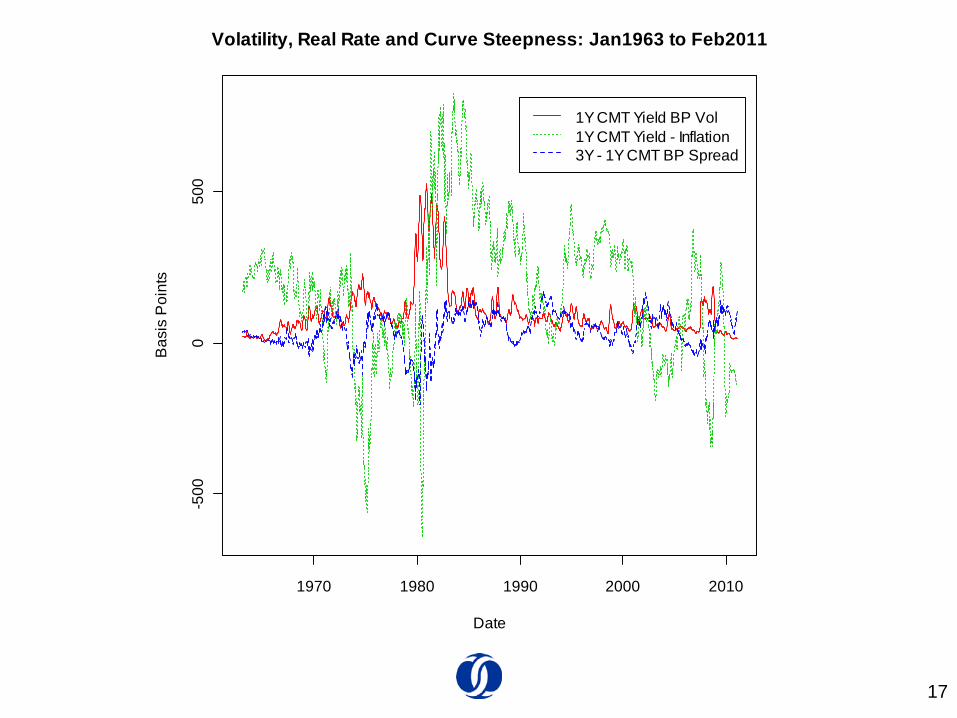
17
1970 1980 1990 2000 2010
-500
050
0
Date
Bas
is P
oint
s
Volatility, Real Rate and Curve Steepness: Jan1963 to Feb2011
1Y CMT Yield BP Vol1Y CMT Yield - Inflation3Y - 1Y CMT BP Spread
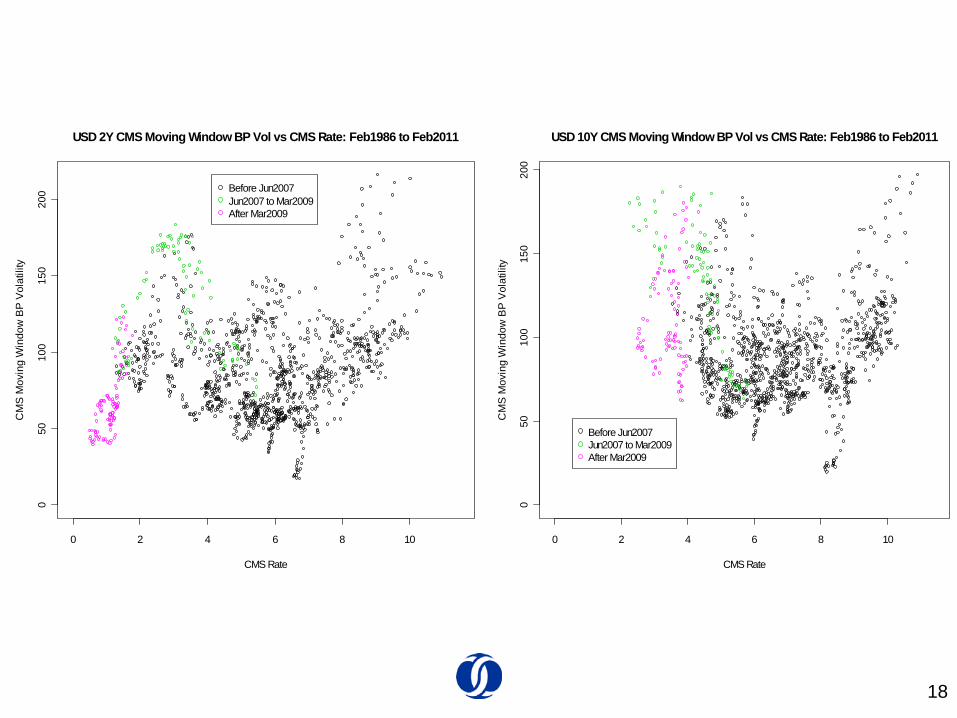
18
0 2 4 6 8 10
050
100
150
200
CMS Rate
CM
S M
ovin
g W
indo
w B
P V
olat
ility
USD 2Y CMS Moving Window BP Vol vs CMS Rate: Feb1986 to Feb2011
Before Jun2007Jun2007 to Mar2009After Mar2009
0 2 4 6 8 100
5010
015
020
0
CMS Rate
CM
S M
ovin
g W
indo
w B
P V
olat
ility
USD 10Y CMS Moving Window BP Vol vs CMS Rate: Feb1986 to Feb2011
Before Jun2007Jun2007 to Mar2009After Mar2009
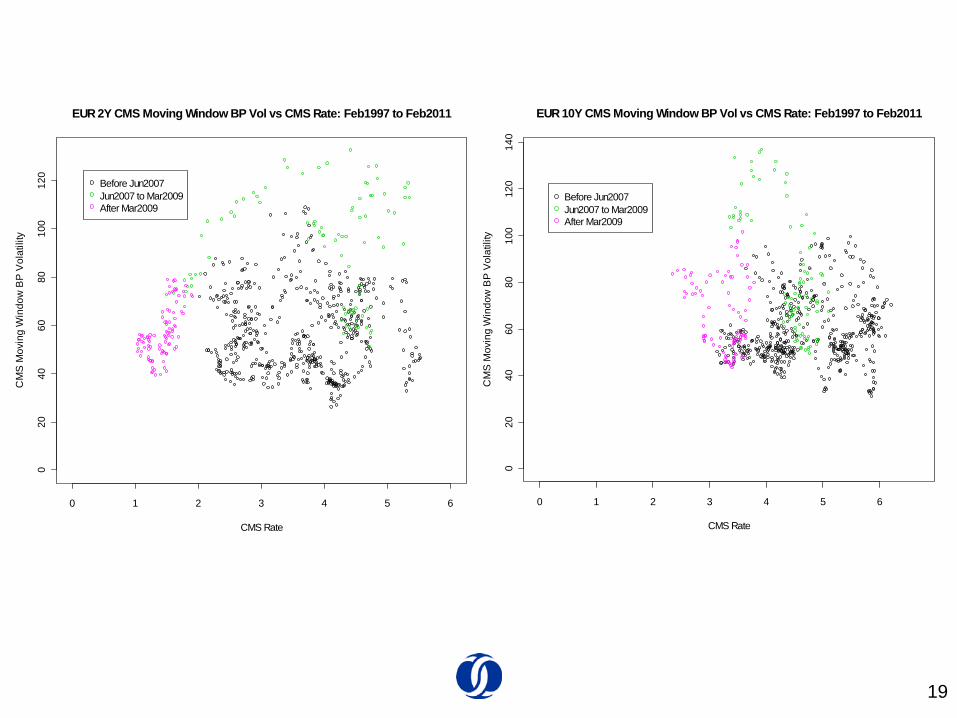
19
0 1 2 3 4 5 6
020
4060
8010
012
0
CMS Rate
CM
S M
ovin
g W
indo
w B
P V
olat
ility
EUR 2Y CMS Moving Window BP Vol vs CMS Rate: Feb1997 to Feb2011
Before Jun2007Jun2007 to Mar2009After Mar2009
0 1 2 3 4 5 60
2040
6080
100
120
140
CMS Rate
CM
S M
ovin
g W
indo
w B
P V
olat
ility
EUR 10Y CMS Moving Window BP Vol vs CMS Rate: Feb1997 to Feb2011
Before Jun2007Jun2007 to Mar2009After Mar2009

20
0 5 10 15
050
100
150
200
250
300
CMS Rate
CM
S M
ovin
g W
indo
w B
P V
olat
ility
GBP 2Y CMS Moving Window BP Vol vs CMS Rate: Feb1986 to Feb2011
Before Jun2007Jun2007 to Mar2009After Mar2009
0 2 4 6 8 10 12 140
5010
015
020
0
CMS Rate
CM
S M
ovin
g W
indo
w B
P V
olat
ility
GBP 10Y CMS Moving Window BP Vol vs CMS Rate: Feb1986 to Feb2011
Before Jun2007Jun2007 to Mar2009After Mar2009

Implied ATM Swaption Volatilities
Since the Late 90’s
22
1998 2000 2002 2004 2006 2008 2010
02
46
8
Year
Sw
ap R
ate
USDEURGBP
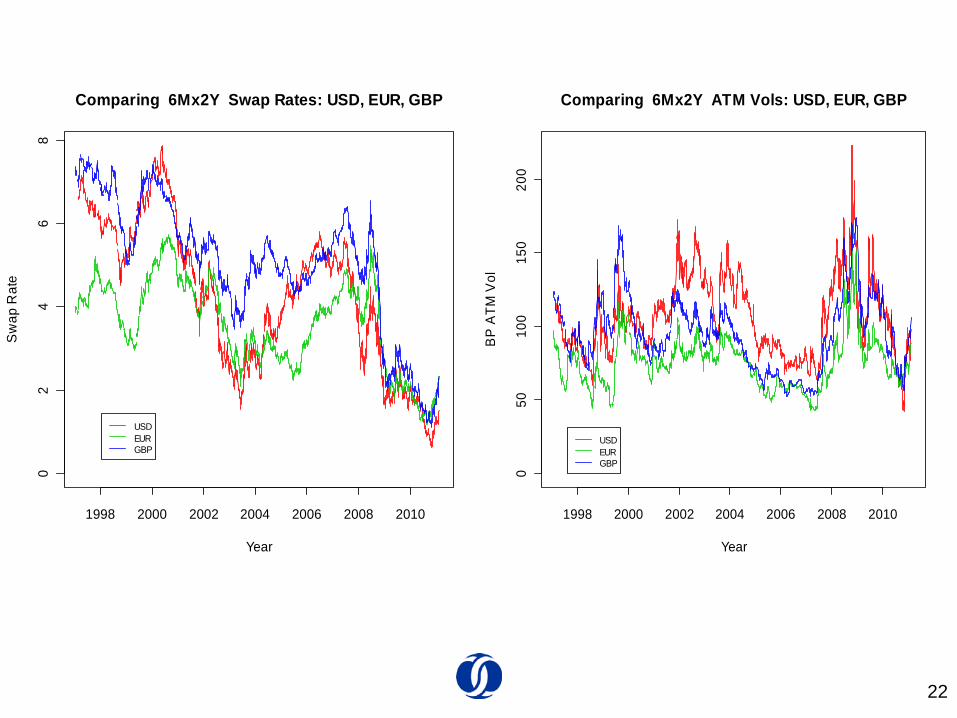
Comparing 6Mx2Y Swap Rates: USD, EUR, GBP
1998 2000 2002 2004 2006 2008 20100
5010
015
020
0
Year
BP
ATM
Vol
USDEURGBP
Comparing 6Mx2Y ATM Vols: USD, EUR, GBP

23
1998 2000 2002 2004 2006 2008 20100
5010
015
020
0
Year
BP
ATM
Vol
USDEURGBP
Comparing 3M x 10Y AT M Vols: USD, EUR, GBP
1998 2000 2002 2004 2006 2008 2010
02
46
8
Year
BP
ATM
Vol
USDEURGBP
Comparing 3M x 10Y FWD Swap Rates: USD, EUR, GBP

240 1 2 3 4 5
-50
050
100
150
200
1 Y S w a p R a te
Sw
ap S
prea
d in
BP
: 5Y
- 1Y
E U R 5 Y - 1 Y S p r e a d v s 1 Y S w a p R a te
M a r1 9 9 7 to M a y2 0 0 7J un2 0 0 7 to M a r2 0 0 9A fte r M a r2 0 0 9
0 2 4 6 8
-100
010
020
0
1 Y S w a p R a te
Sw
ap S
prea
d in
BP
: 5Y
- 1Y
G B P 5 Y - 1 Y S p r e a d v s 1 Y S w a p R a te
M a r1 9 9 7 to M a y2 0 0 7J un2 0 0 7 to M a r2 0 0 9A fte r M a r2 0 0 9
0 2 4 6
-50
050
100
150
200
250
300
1 Y S w a p R a te
Sw
ap S
prea
d in
BP
: 5Y
- 1Y
U S D 5 Y - 1 Y S p r e a d v s 1 Y S w a p R a te
M a r1 9 9 7 to M a y2 0 0 7J un2 0 0 7 to M a r2 0 0 9A fte r M a r2 0 0 9

USD 6Mx2Y Swaption 1997 - 2011
25

26
1997.5 1998.0 1998.5 1999.0 1999.5 2000.0
01
23
45
67
Date
6M.2
Y S
wap
Rat
e
-20
020
4060
80
2Y -
6M S
wap
Spr
ead
in B
P
USD 6M.2Y Rate vs Spread: Mar1997 to Dec1999
6M.2Y Swap Rate2Y - 6M Spread
-20 0 20 40 60 80 100
6080
100
120
140
2y - 6m Swap Spread
6Mx2
Y S
wap
ion
ATM
BP V
ol
USD 6Mx2Y ATM Vol vs 2y - 6m Spread: Mar1997 to Dec1999
0 1 2 3 4 5 6 7
050
100
150
6Mx2Y Fwd Swap Rate
6Mx2
Y S
wap
ion
ATM
BP V
olUSD 6Mx2Y ATM Vol vs FwdSwapRate: Mar1997 to Dec1999
0 1 2 3 4 5 6 7
-20
020
4060
80
6Mx2Y Swap Rate
Sw
ap S
prea
d in
BP:
2y -
6m
USD 2y - 6m Spread vs 6Mx2Y Swap Rate: Mar1997 to Dec1999

27-5 0 0 5 0 1 0 0 1 5 0 2 0 0
8010
012
014
016
018
0
2 y - 6 m S w a p S p re a d
6Mx2
Y S
wap
ion
ATM
BP
Vol
U S D 6 M x 2 Y A T M V o l v s 2 y - 6 m S p r e a d : J a n 2 0 0 0 to D e c 2 0 0 3
0 2 4 6 8
-50
050
100
150
6 M x2 Y F w d S w a p R a te
Sw
ap S
prea
d in
BP
: 2y
- 6m
U S D r 2 y - r 6 m S p r e a d v s 6 M x 2 Y S w a p R a te : J a n 2 0 0 0 to D e c 2 0 0 3
0 2 4 6 8
050
100
150
6 M x2 Y F w d S w a p R a te
6Mx2
Y S
wap
ion
ATM
BP
Vol
U S D 6 M x 2 Y A T M V o l v s F w d S w a p R a te : J a n 2 0 0 0 to D e c 2 0 0 3
2 0 0 0 2 0 0 1 2 0 0 2 2 0 0 3 2 0 0 4
02
46
8
D a te
6Mx2
Y S
wap
Rat
e
050
100
150
2Y -
6M S
wap
Spr
ead
in B
P
U S D 6 M x 2 Y R a te v s 2 Y - 6 M S p r e a d : J a n 2 0 0 0 to D e c 2 0 0 3
6 M x2 Y S w a p R a te2 Y S w a p - 6 M L ib o r S p re a d

28
0 1 2 3 4 5 6
050
100
150
6 M x2 Y F w d S w a p R a te
6Mx2
Y S
wap
ion
ATM
BP
Vol
U S D 6 M x 2 Y A T M V o l v s F w d S w a p R a te : J a n 2 0 0 4 to D e c 2 0 0 6
-5 0 0 5 0 1 0 0 1 5 0
6080
100
120
140
2 y - 6 m S w a p S p re a d
6Mx2
Y S
wap
ion
ATM
BP
Vol
U S D 6 M x 2 Y A T M V o l v s 2 y - 6 m S p r e a d : J a n 2 0 0 4 to D e c 2 0 0 6
0 1 2 3 4 5 6
-50
050
100
150
6 M x2 Y F w d S w a p R a te
Sw
ap S
prea
d in
BP
: 2y
- 6m
U S D r 2 y - r 6 m S p r e a d v s 6 M x 2 Y S w a p R a te : J a n 2 0 0 4 to D e c 2 0 0 6
2 0 0 4 .0 2 0 0 4 .5 2 0 0 5 .0 2 0 0 5 .5 2 0 0 6 .0 2 0 0 6 .5 2 0 0 7 .0
01
23
45
6
D a te
6Mx2
Y S
wap
Rat
e
-50
050
100
150
2Y -
6M S
wap
Spr
ead
in B
P
U S D 6 M x 2 Y R a te v s 2 Y - 6 M S p r e a d : J a n 2 0 0 4 to D e c 2 0 0 6
6 M x2 Y S w a p R a te2 Y S w a p - 6 M L ib o r S p re a d

29
0 1 2 3 4 5
050
100
150
200
6 M x2 Y F w d S w a p R a te
6Mx2
Y S
wap
ion
ATM
BP
Vol
U S D 6 M x 2 Y A T M V o l v s F w d S w a p R a te : J a n 2 0 0 7 to A p r 2 0 0 9
-5 0 0 5 0 1 0 0
5010
015
020
0
2 y - 6 m S w a p S p re a d
6Mx2
Y S
wap
ion
ATM
BP
Vol
U S D 6 M x 2 Y A T M V o l v s 2 y - 6 m S p r e a d : J a n 2 0 0 7 to A p r 2 0 0 9
0 1 2 3 4 5
-50
050
6 M x2 Y F w d S w a p R a te
Sw
ap S
prea
d in
BP
: 2y
- 6m
U S D r 2 y - r 6 m S p r e a d v s 6 M x 2 Y S w a p R a te : J a n 2 0 0 7 to A p r 2 0 0 9
2 0 0 7 .0 2 0 0 7 .5 2 0 0 8 .0 2 0 0 8 .5 2 0 0 9 .0
01
23
45
D a te
6Mx2
Y S
wap
Rat
e
-50
050
100
150
2Y -
6M S
wap
Spr
ead
in B
P
U S D 6 M x 2 Y R a te v s 2 Y - 6 M S p r e a d : J a n 2 0 0 7 to A p r 2 0 0 9
6 M x2 Y S w a p R a te2 Y S w a p - 6 M L ib o r S p re a d

30
2 0 0 9 .5 2 0 1 0 .0 2 0 1 0 .5 2 0 1 1 .0
0.0
0.5
1.0
1.5
2.0
2.5
D a te
6Mx2
Y S
wap
Rat
e
050
100
150
2Y -
6M S
wap
Spr
ead
in B
P
U S D 6 M x 2 Y R a te v s 2 Y - 6 M S p r e a d : A p r 2 0 0 9 to F e b 2 0 1 1
6 M x2 Y S w a p R a te2 Y S w a p - 6 M L ib o r S p re a d
0 .0 0 .5 1 .0 1 .5 2 .0 2 .5
050
100
150
6 M x2 Y F w d S w a p R a te
6Mx2
Y S
wap
ion
ATM
BP
Vol
U S D 6 M x 2 Y A T M V o l v s F w d S w a p R a te : A p r 2 0 0 9 to F e b 2 0 1 1
0 2 0 4 0 6 0 8 0 1 0 0 1 2 0 1 4 0
4060
8010
012
014
016
0
2 y - 6 m S w a p S p re a d
6Mx2
Y S
wap
ion
ATM
BP
Vol
U S D 6 M x 2 Y A T M V o l v s 2 y - 6 m S p r e a d : A p r 2 0 0 9 to F e b 2 0 1 1
0 .0 0 .5 1 .0 1 .5 2 .0 2 .5
020
4060
8010
012
0
6 M x2 Y F w d S w a p R a te
Sw
ap S
prea
d in
BP
: 2y
- 6m
U S D r 2 y - r 6 m S p r e a d v s 6 M x 2 Y S w a p R a te : A p r 2 0 0 9 to F e b 2 0 1 1

31
0 2 4 6 8
050
100
150
200
6Mx2Y Fwd Swap Rate
6Mx2
Y S
wap
ion
ATM
BP
Vol
USD 6Mx2Y Swaption ATM BP Vol vs Fwd Swap Rate
Mar1997 to May2007Jun2007 to Mar2009After Mar2009

32
-50 0 50 100 150
5010
015
020
0
2y - 6m Swap Spread
6Mx2
Y S
wap
ion
ATM
BP
Vol
USD 6Mx2Y Swaption ATM BP Vol vs 2y - 6m Swap Spread
Mar1997 to May2007Jun2007 to Mar2009After Mar2009

EUR 6Mx2Y Swaption 1999 - 2011
33

34
0 1 2 3 4 5
020
4060
8010
012
0
6Mx2Y Fwd Swap Rate
6Mx2
Y S
wap
ion
ATM
BP
Vol
EUR 6Mx2Y ATM Vol vs FwdSwapRate: Jan1999 to Dec1999
1999.0 1999.2 1999.4 1999.6 1999.8 2000.0
01
23
45
Date
6M.2
Y S
wap
Rat
e
020
4060
8010
0
2Y -
6M S
wap
Spr
ead
in B
P
EUR 6M.2Y Rate vs Spread: Jan1999 to Dec1999
6M.2Y Swap Rate2Y - 6M Spread
0 20 40 60 80 100
4060
8010
012
0
2y - 6m Swap Spread
6Mx2
Y S
wap
ion
ATM
BP
Vol
EUR 6Mx2Y ATM Vol vs 2y - 6m Spread: Jan1999 to Dec1999
0 1 2 3 4 5
020
4060
8010
0
6Mx2Y Swap Rate
Sw
ap S
prea
d in
BP
: 2y
- 6m
EUR 2y - 6m Spread vs 6Mx2Y Swap Rate: Jan1999 to Dec1999

350 20 40 60 80 100
5060
7080
9010
011
012
0
2y - 6m Swap Spread
6Mx2
Y S
wap
ion
ATM
BP
Vol
EUR 6Mx2Y ATM Vol vs 2y - 6m Spread: Jan2000 to Dec2000
2000.0 2000.2 2000.4 2000.6 2000.8 2001.0
01
23
45
Date
6M.2
Y S
wap
Rat
e
020
4060
8010
0
2Y -
6M S
wap
Spr
ead
in B
P
EUR 6M.2Y Rate vs Spread: Jan2000 to Dec2000
6M.2Y Swap Rate2Y - 6M Spread
0 1 2 3 4 5
020
4060
8010
0
6Mx2Y Swap Rate
Sw
ap S
prea
d in
BP
: 2y
- 6m
EUR 2y - 6m Spread vs 6Mx2Y Swap Rate: Jan2000 to Dec2000
0 1 2 3 4 5
020
4060
8010
012
0
6Mx2Y Fwd Swap Rate
6Mx2
Y S
wap
ion
ATM
BP
Vol
EUR 6Mx2Y ATM Vol vs FwdSwapRate: Jan2000 to Dec2000

36
0 1 2 3 4 5
020
4060
8010
012
0
6Mx2Y Fwd Swap Rate
6Mx2
Y S
wap
ion
ATM
BP
Vol
EUR 6Mx2Y ATM Vol vs FwdSwapRate: Jan2001 to May2003
2001.0 2001.5 2002.0 2002.5 2003.0
01
23
45
Date
6M.2
Y S
wap
Rat
e
-20
020
4060
80
2Y -
6M S
wap
Spr
ead
in B
P
EUR 6M.2Y Rate vs Spread: Jan2001 to May2003
6M.2Y Swap Rate2Y - 6M Spread
0 1 2 3 4 5
-20
020
4060
80
6Mx2Y Swap Rate
Sw
ap S
prea
d in
BP
: 2y
- 6m
EUR 2y - 6m Spread vs 6Mx2Y Swap Rate: Jan2001 to May2003
-20 0 20 40 60 80 100
6070
8090
100
110
2y - 6m Swap Spread
6Mx2
Y S
wap
ion
ATM
BP
Vol
EUR 6Mx2Y ATM Vol vs 2y - 6m Spread: Jan2001 to May2003

37
0 1 2 3 4 5
020
4060
8010
0
6Mx2Y Fwd Swap Rate
6Mx2
Y S
wap
ion
ATM
BP
Vol
EUR 6Mx2Y ATM Vol vs FwdSwapRate: Jul2003 to Jul2007
2004 2005 2006 2007
01
23
45
Date
6M.2
Y S
wap
Rat
e
020
4060
80
2Y -
6M S
wap
Spr
ead
in B
P
EUR 6M.2Y Rate vs Spread: May2003 to Jul2007
6M.2Y Swap Rate2Y - 6M Spread
0 20 40 60 80
4060
8010
0
2y - 6m Swap Spread
6Mx2
Y S
wap
ion
ATM
BP
Vol
EUR 6Mx2Y ATM Vol vs 2y - 6m Spread: May2003 to Jul2007
0 1 2 3 4 5
020
4060
80
6Mx2Y Swap Rate
Sw
ap S
prea
d in
BP
: 2y
- 6m
EUR 2y - 6m Spread vs 6Mx2Y Swap Rate: May2003 to Jul2007

38
0 1 2 3 4 5
050
100
150
6Mx2Y Fwd Swap Rate
6Mx2
Y S
wap
ion
ATM
BP
Vol
EUR 6Mx2Y ATM Vol vs FwdSwapRate: Jul2007 to Apr2009
2007.5 2008.0 2008.5 2009.0
01
23
45
Date
6M.2
Y S
wap
Rat
e
-80
-60
-40
-20
020
40
2Y -
6M S
wap
Spr
ead
in B
P
EUR 6M.2Y Rate vs Spread: Jul2007 to Apr2009
6M.2Y Swap Rate2Y - 6M Spread
-80 -60 -40 -20 0 20 40
4060
8010
012
014
016
018
0
2y - 6m Swap Spread
6Mx2
Y S
wap
ion
ATM
BP
Vol
EUR 6Mx2Y ATM Vol vs 2y - 6m Spread: Jul2007 to Apr2009
0 1 2 3 4 5
-80
-60
-40
-20
020
40
6Mx2Y Swap Rate
Sw
ap S
prea
d in
BP
: 2y
- 6m
EUR 2y - 6m Spread vs 6Mx2Y Swap Rate: Jul2007 to Apr2009
39
0.0 0.5 1.0 1.5 2.0 2.5
020
4060
8010
0
6Mx2Y Fwd Swap Rate
6Mx2
Y S
wap
ion
ATM
BP
Vol
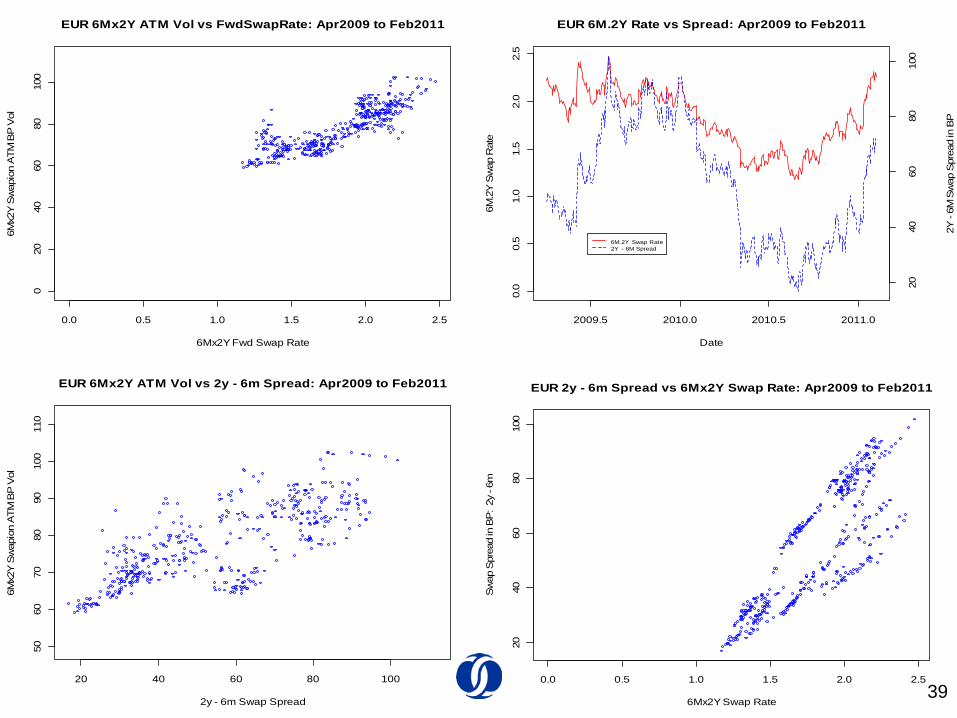
EUR 6Mx2Y ATM Vol vs FwdSwapRate: Apr2009 to Feb2011
2009.5 2010.0 2010.5 2011.0
0.0
0.5
1.0
1.5
2.0
2.5
Date
6M.2
Y S
wap
Rat
e
2040
6080
100
2Y -
6M S
wap
Spr
ead
in B
P
EUR 6M.2Y Rate vs Spread: Apr2009 to Feb2011
6M.2Y Swap Rate2Y - 6M Spread
0.0 0.5 1.0 1.5 2.0 2.5
2040
6080
100
6Mx2Y Swap Rate
Sw
ap S
prea
d in
BP
: 2y
- 6m
EUR 2y - 6m Spread vs 6Mx2Y Swap Rate: Apr2009 to Feb2011
20 40 60 80 100
5060
7080
9010
011
0
2y - 6m Swap Spread
6Mx2
Y S
wap
ion
ATM
BP
Vol
EUR 6Mx2Y ATM Vol vs 2y - 6m Spread: Apr2009 to Feb2011

40
0 1 2 3 4 5
050
100
150
6Mx2Y Fwd Swap Rate
6Mx2
Y S
wap
ion
ATM
BP
Vol
EUR 6Mx2Y Swaption ATM BP Vol vs Fwd Swap Rate
Mar1997 to May2007Jun2007 to Mar2009After Mar2009

41
-50 0 50 100
5010
015
0
2y - 6m Swap Spread
6Mx2
Y S
wap
ion
ATM
BP
Vol
EUR 6Mx2Y Swaption ATM BP Vol vs 2y - 6m Swap Spread
Mar1997 to May2007Jun2007 to Mar2009After Mar2009

GBP 6Mx2Y Swaption 1997 - 2011
42

43
0 2 4 6
050
100
150
6Mx2Y Fwd Swap Rate
6Mx2
Y S
wap
ion
ATM
BP
Vol
GBP 6Mx2Y ATM Vol vs FwdSwapRate: Jan1997 to Mar2000
-50 0 50 100
6080
100
120
140
160
180
2y - 6m Swap Spread
6Mx2
Y S
wap
ion
ATM
BP
Vol
GBP 6Mx2Y ATM Vol vs 2y - 6m Spread: Jan1997 to Mar2000
1997.0 1997.5 1998.0 1998.5 1999.0 1999.5 2000.0
02
46
Date
6M.2
Y S
wap
Rat
e
-50
050
100
2Y -
6M S
wap
Spr
ead
in B
P
GBP 6M.2Y Rate vs Spread: Jan1997 to Mar2000
6M.2Y Swap Rate2Y - 6M Spread
0 2 4 6
-50
050
100
6Mx2Y Swap Rate
Sw
ap S
prea
d in
BP
: 2y
- 6m
GBP 2y - 6m Spread vs 6Mx2Y Swap Rate: Jan1997 to Mar2000
44
0 1 2 3 4 5 6 7
020
4060
8010
012
014
0
6Mx2Y Fwd Swap Rate
6Mx2
Y S
wap
ion
ATM
BP
Vol
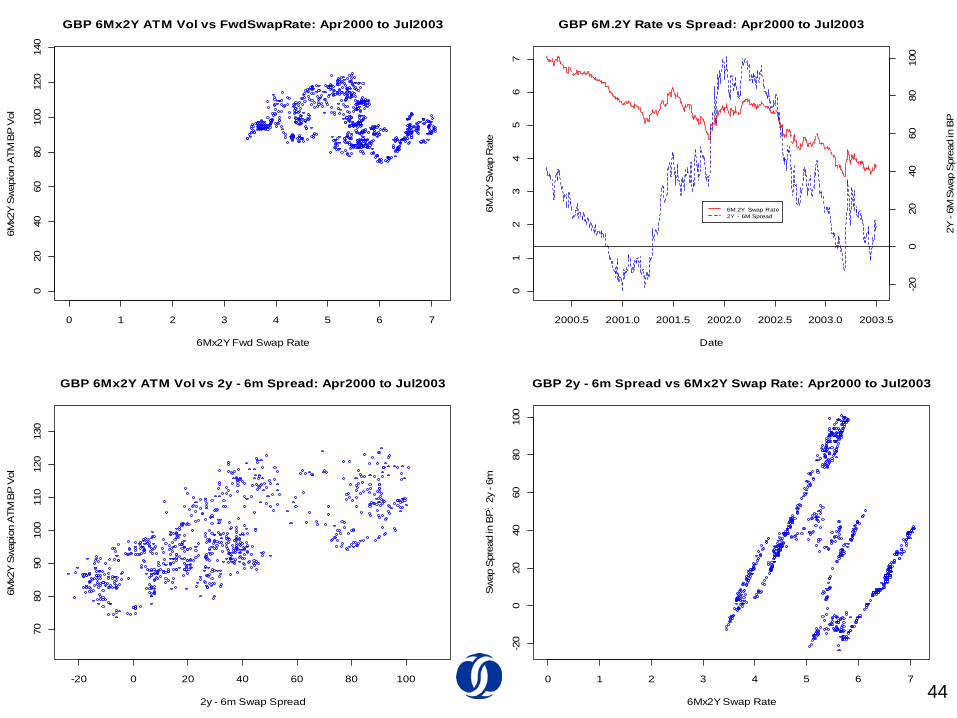
GBP 6Mx2Y ATM Vol vs FwdSwapRate: Apr2000 to Jul2003
2000.5 2001.0 2001.5 2002.0 2002.5 2003.0 2003.5
01
23
45
67
Date
6M.2
Y S
wap
Rat
e
-20
020
4060
8010
0
2Y -
6M S
wap
Spr
ead
in B
P
GBP 6M.2Y Rate vs Spread: Apr2000 to Jul2003
6M.2Y Swap Rate2Y - 6M Spread
-20 0 20 40 60 80 100
7080
9010
011
012
013
0
2y - 6m Swap Spread
6Mx2
Y S
wap
ion
ATM
BP
Vol
GBP 6Mx2Y ATM Vol vs 2y - 6m Spread: Apr2000 to Jul2003
0 1 2 3 4 5 6 7
-20
020
4060
8010
0
6Mx2Y Swap Rate
Sw
ap S
prea
d in
BP
: 2y
- 6m
GBP 2y - 6m Spread vs 6Mx2Y Swap Rate: Apr2000 to Jul2003

45-20 0 20 40 60 80
4060
8010
012
0
2y - 6m Swap Spread
6Mx2
Y S
wap
ion
ATM
BP
Vol
GBP 6Mx2Y ATM Vol vs 2y - 6m Spread: Jul2003 to Jul2007
0 1 2 3 4 5 6
020
4060
8010
012
0
6Mx2Y Fwd Swap Rate
6Mx2
Y S
wap
ion
ATM
BP
Vol
GBP 6Mx2Y ATM Vol vs FwdSwapRate: Jul2003 to Jul2007
2004 2005 2006 2007
01
23
45
6
Date
6M.2
Y S
wap
Rat
e
-20
020
4060
80
2Y -
6M S
wap
Spr
ead
in B
P
GBP 6M.2Y Rate vs Spread: Jul2003 to Jul2007
6M.2Y Swap Rate2Y - 6M Spread
0 1 2 3 4 5 6
-20
020
4060
80
6Mx2Y Swap Rate
Sw
ap S
prea
d in
BP
: 2y
- 6m
GBP 2y - 6m Spread vs 6Mx2Y Swap Rate: Jul2003 to Jul2007

46-100 -50 0 50
6080
100
120
140
160
180
2y - 6m Swap Spread
6Mx2
Y S
wap
ion
ATM
BP
Vol
GBP 6Mx2Y ATM Vol vs 2y - 6m Spread: Jul2007 to Apr2009
0 1 2 3 4 5 6
050
100
150
6Mx2Y Fwd Swap Rate
6Mx2
Y S
wap
ion
ATM
BP
Vol
GBP 6Mx2Y ATM Vol vs FwdSwapRate: Jul2007 to Apr2009
0 1 2 3 4 5 6
-100
-50
0
6Mx2Y Swap Rate
Sw
ap S
prea
d in
BP
: 2y
- 6m
GBP 2y - 6m Spread vs 6Mx2Y Swap Rate: Jul2007 to Apr2009
2007.5 2008.0 2008.5 2009.0
01
23
45
6
Date
6M.2
Y S
wap
Rat
e
-100
-50
0
2Y -
6M S
wap
Spr
ead
in B
P
GBP 6M.2Y Rate vs Spread: Jul2007 to Apr2009
6M.2Y Swap Rate2Y - 6M Spread

47
0.0 0.5 1.0 1.5 2.0 2.5 3.0
050
100
150
6Mx2Y Fwd Swap Rate
6Mx2
Y S
wap
ion
ATM
BP V
olGBP 6Mx2Y ATM Vol vs FwdSwapRate: Apr2009 to Feb2011
2009.5 2010.0 2010.5 2011.0
0.0
0.5
1.0
1.5
2.0
2.5
3.0
Date
6M.2
Y S
wap
Rat
e
2040
6080
100
120
140
2Y -
6M S
wap
Spr
ead
in B
P
GBP 6M.2Y Rate vs Spread: Apr2009 to Feb2011
6M.2Y Swap Rate2Y - 6M Spread
20 40 60 80 100 120 140
6080
100
120
140
2y - 6m Swap Spread
6Mx2
Y S
wap
ion
ATM
BP V
ol
GBP 6Mx2Y ATM Vol vs 2y - 6m Spread: Apr2009 to Feb2011
20 40 60 80 100 120 140
6080
100
120
140
2y - 6m Swap Spread
6Mx2
Y S
wap
ion
ATM
BP V
ol
GBP 6Mx2Y ATM Vol vs 2y - 6m Spread: Apr2009 to Feb2011
48
0 2 4 6
050
100
150
6Mx2Y Fwd Swap Rate
6Mx2
Y S
wap
ion
ATM
BP
Vol
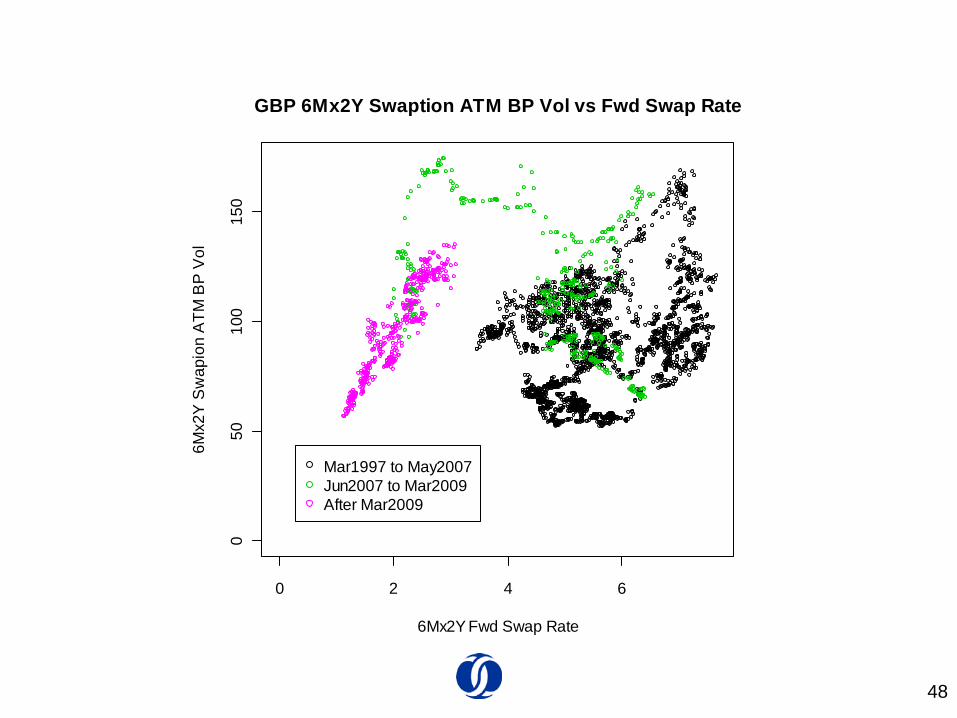
GBP 6Mx2Y Swaption ATM BP Vol vs Fwd Swap Rate
Mar1997 to May2007Jun2007 to Mar2009After Mar2009

49
-100 -50 0 50 100
4060
8010
012
014
016
018
0
2y - 6m Swap Spread
6Mx2
Y S
wap
ion
ATM
BP
Vol
GBP 6Mx2Y Swaption ATM BP Vol vs 2y - 6m Swap Spread
Mar1997 to May2007Jun2007 to Mar2009After Mar2009

USD Swaptions
50
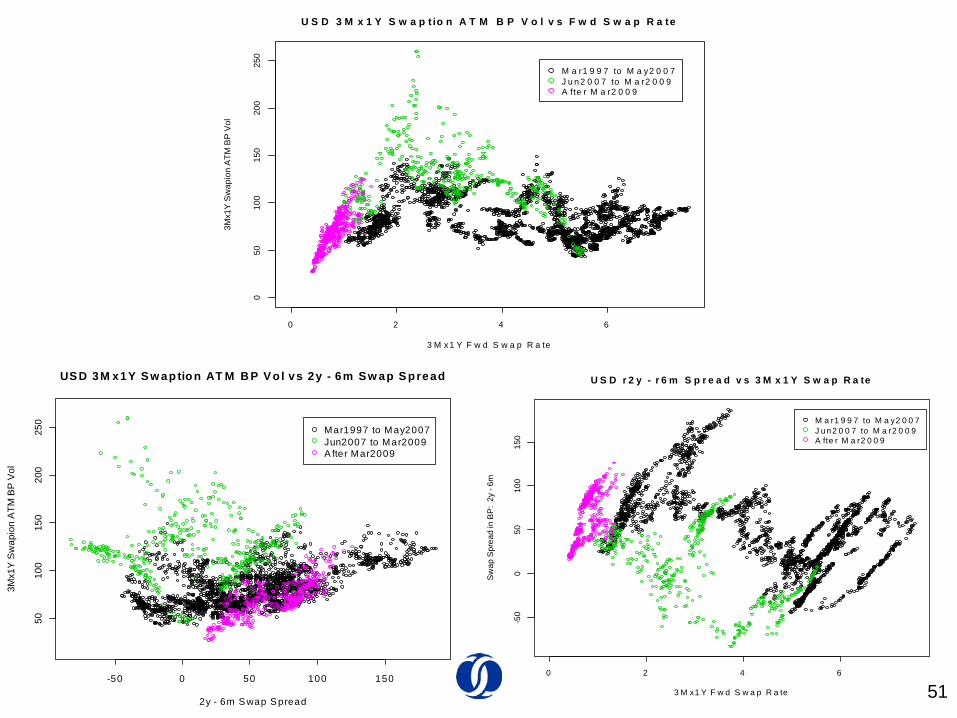
51
0 2 4 6
050
100
150
200
250
3 M x1 Y F w d S w a p R a te
3Mx1
Y S
wap
ion
ATM
BP
Vol
U S D 3 M x 1 Y S w a p t io n A T M B P V o l v s F w d S w a p R a te
M a r1 9 9 7 to M a y2 0 0 7J u n 2 0 0 7 to M a r2 0 0 9A fte r M a r2 0 0 9
0 2 4 6
-50
050
100
150
3 M x1 Y F w d S w a p R a te
Sw
ap S
prea
d in
BP
: 2y
- 6m
U S D r 2 y - r 6 m S p r e a d v s 3 M x 1 Y S w a p R a te
M a r1 9 9 7 to M a y2 0 0 7J un2 0 0 7 to M a r2 0 0 9A fte r M a r2 0 0 9
-50 0 50 100 150
5010
015
020
025
0
2y - 6m S wap S pread
3Mx1
Y S
wap
ion
ATM
BP
Vol
US D 3M x1Y S w ap tio n AT M B P V o l vs 2y - 6m Sw ap S pread
Mar1997 to May2007Jun2007 to Mar2009A fter Mar2009

52
0 2 4 6 8
050
100
150
200
250
3 M x2 Y F w d S w a p R a te
3Mx2
Y S
wap
ion
ATM
BP
Vol
U S D 3 M x 2 Y S w a p tio n A T M B P V o l v s F w d S w a p R a te
M a r1 9 9 7 to M a y2 0 0 7J un2 0 0 7 to M a r2 0 0 9A fte r M a r2 0 0 9
0 2 4 6 8
-50
050
100
150
3Mx2Y Fwd Swap Rate
Sw
ap S
prea
d in
BP
: 2y
- 6m
USD r2y - r6m Spread vs 3M x2Y Sw ap Rate
Mar1997 to May2007Jun2007 to Mar2009After Mar2009
-50 0 50 100 150
5010
015
020
025
0
2y - 6m S wap S pread
3Mx2
Y S
wap
ion
ATM
BP
Vol
USD 3M x2Y Sw aption AT M B P Vo l vs 2y - 6m S w ap S pread
Mar1997 to May2007Jun2007 to Mar2009A fter Mar2009
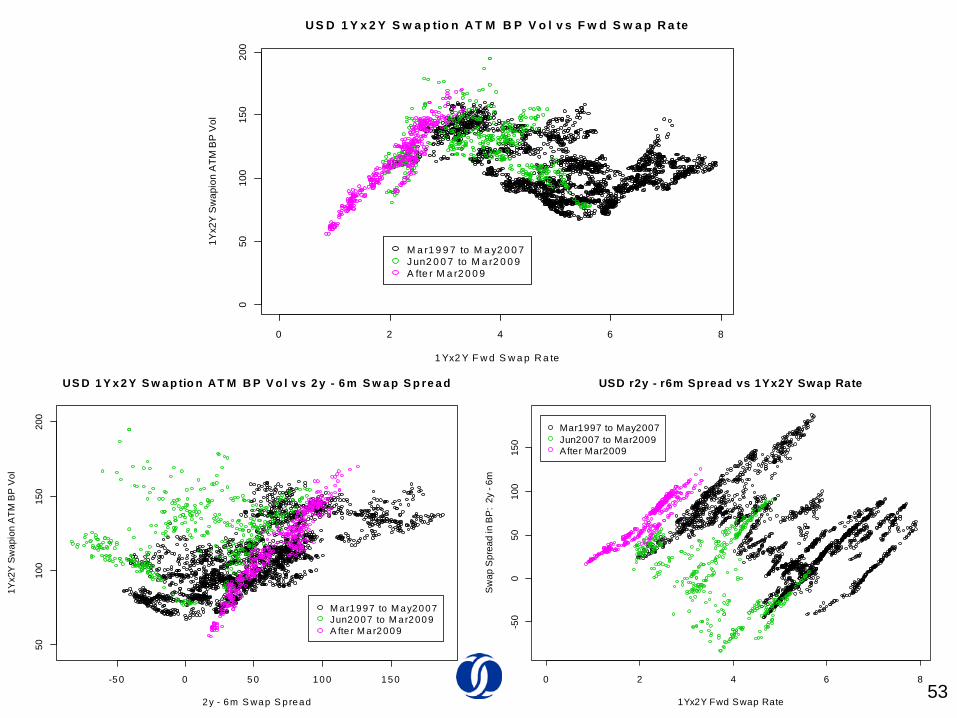
53-50 0 50 100 150
5010
015
020
0
2 y - 6m S wap S p read
1Yx2
Y S
wap
ion
ATM
BP
Vol
US D 1 Y x 2 Y S w a p tio n AT M B P V o l v s 2 y - 6 m S w a p S p re a d
M ar1997 to M ay2007Jun2007 to M ar2009A fte r M ar2009
0 2 4 6 8
-50
050
100
150
1Yx2Y Fwd Swap Rate
Sw
ap S
prea
d in
BP
: 2y
- 6m
USD r2y - r6m Spread vs 1Yx2Y Swap Rate
Mar1997 to May2007Jun2007 to Mar2009After Mar2009
0 2 4 6 8
050
100
150
200
1 Yx2 Y F w d S w a p R a te
1Yx2
Y S
wap
ion
ATM
BP
Vol
U S D 1 Y x 2 Y S w a p tio n A T M B P V o l v s F w d S w a p R a te
M a r1 9 9 7 to M a y2 0 0 7J un2 0 0 7 to M a r2 0 0 9A fte r M a r2 0 0 9

54
0 2 4 6 8
050
100
150
5 Yx2 Y F w d S w a p R a te
5Yx2
Y S
wap
ion
ATM
BP
Vol
U S D 5 Y x 2 Y S w a p tio n A T M B P V o l v s F w d S w a p R a te
M a r1 9 9 7 to M a y2 0 0 7J un2 0 0 7 to M a r2 0 0 9A fte r M a r2 0 0 9
0 2 4 6 8
-50
050
100
150
5 Yx2 Y F w d S w a p R a te
Sw
ap S
prea
d in
BP
: 2y
- 6m
U S D r 2 y - r 6 m S p r e a d v s 5 Y x 2 Y S w a p R a te
M a r1 9 9 7 to M a y2 0 0 7J un2 0 0 7 to M a r2 0 0 9A fte r M a r2 0 0 9
-5 0 0 5 0 1 0 0 1 5 0
8010
012
014
016
0
2 y - 6 m S w a p S p re a d
5Yx2
Y S
wap
ion
ATM
BP
Vol
U S D 5 Y x 2 Y S w a p tio n A T M B P V o l v s 2 y - 6 m S w a p S p r e a d
M a r1 9 9 7 to M a y2 0 0 7J un2 0 0 7 to M a r2 0 0 9A fte r M a r2 0 0 9

EUR Swaptions
55

56
0 1 2 3 4 5
050
100
150
3Mx1Y Fwd Swap Rate
3Mx1
Y S
wap
ion
ATM
BP
Vol
EUR 3Mx1Y Swaption ATM BP Vol vs Fwd Swap Rate
Mar1997 to May2007Jun2007 to Mar2009After Mar2009
-50 0 50 100
5010
015
0
2y - 6m Swap Spread
3Mx1
Y S
wap
ion
ATM
BP
Vol
EUR 3Mx1Y Swaption ATM BP Vol vs 2y - 6m Swap Spread
Mar1997 to May2007Jun2007 to Mar2009After Mar2009
0 1 2 3 4 5
-50
050
100
3Mx1Y Fwd Swap Rate
Sw
ap S
prea
d in
BP
: 2y
- 6m
EUR r2y - r6m Spread vs 3Mx1Y Swap Rate
Mar1997 to May2007Jun2007 to Mar2009After Mar2009

57
0 1 2 3 4 5 6
050
100
150
6 M x5 Y F w d S w a p R a te
6Mx5
Y S
wap
ion
ATM
BP
Vol
E U R 6 M x 5 Y S w a p tio n A T M B P V o l v s F w d S w a p R a te
M a r1 9 9 7 to M a y2 0 0 7
J un2 0 0 7 to M a r2 0 0 9
A fte r M a r2 0 0 9
0 1 2 3 4 5 6
-50
050
100
6 M x5 Y F w d S w a p R a te
Sw
ap S
prea
d in
BP
: 2y
- 6m
E U R r 2 y - r 6 m S p r e a d v s 6 M x 5 Y S w a p R a te
M a r1 9 9 7 to M a y2 0 0 7J un2 0 0 7 to M a r2 0 0 9A fte r M a r2 0 0 9
-5 0 0 5 0 1 0 0
4060
8010
012
014
016
0
2 y - 6 m S w a p S p re a d
6Mx5
Y S
wap
ion
ATM
BP
Vol
E U R 6 M x 5 Y S w a p tio n A T M B P V o l v s 2 y - 6 m S w a p S p r e a d
M a r1 9 9 7 to M a y2 0 0 7J un2 0 0 7 to M a r2 0 0 9A fte r M a r2 0 0 9

580 1 2 3 4 5 6
-50
050
100
1Yx2Y Fwd Swap Rate
Sw
ap S
prea
d in
BP
: 2y
- 6m
EUR r2y - r6m Spread vs 1Yx2Y Swap Rate
Mar1997 to May2007Jun2007 to Mar2009After Mar2009
0 1 2 3 4 5 6
020
4060
8010
012
014
0
1 Yx2 Y F w d S w a p R a te
1Yx2
Y S
wap
ion
ATM
BP
Vol
E U R 1 Y x 2 Y S w a p tio n A T M B P V o l v s F w d S w a p R a te
M a r1 9 9 7 to M a y2 0 0 7Jun2 0 0 7 to M a r2 0 0 9A fte r M a r2 0 0 9
-50 0 50 100
4060
8010
012
014
0
2y - 6m Swap Spread
1Yx2
Y S
wap
ion
ATM
BP
Vol
EUR 1Yx2Y Swaption AT M BP Vol vs 2y - 6m Swap Spread
Mar1997 to May2007Jun2007 to Mar2009After Mar2009

59-5 0 0 5 0 1 0 0
4060
8010
012
0
2 y - 6 m S w a p S p re a d
2Yx5
Y S
wap
ion
ATM
BP
Vol
E U R 2 Y x 5 Y S w a p tio n A T M B P V o l v s 2 y - 6 m S w a p S p r e a d
M a r1 9 9 7 to M a y2 0 0 7J un2 0 0 7 to M a r2 0 0 9A fte r M a r2 0 0 9
0 1 2 3 4 5 6
-50
050
100
2 Yx5 Y F w d S w a p R a te
Sw
ap S
prea
d in
BP
: 2y
- 6m
E U R r 2 y - r 6 m S p r e a d v s 2 Y x 5 Y S w a p R a te
M a r1 9 9 7 to M a y2 0 0 7J un2 0 0 7 to M a r2 0 0 9A fte r M a r2 0 0 9
0 1 2 3 4 5 6
020
4060
8010
0
2 Yx5 Y F w d S w a p R a te
2Yx5
Y S
wap
ion
ATM
BP
Vol
E U R 2 Y x 5 Y S w a p tio n A T M B P V o l v s F w d S w a p R a te
M a r1 9 9 7 to M a y2 0 0 7J un2 0 0 7 to M a r2 0 0 9A fte r M a r2 0 0 9

GBP Swaptions
60

61
0 2 4 6 8
050
100
150
3Mx1Y Fwd Swap Rate
3Mx1
Y S
wap
ion
ATM
BP
Vol
GBP 3M x1Y Swaption AT M BP Vol vs Fwd Swap Rate
Mar1997 to May2007Jun2007 to Mar2009After Mar2009
-1 0 0 -5 0 0 5 0 1 0 0
5010
015
020
0
2 y - 6 m S w a p S p re a d
3Mx1
Y S
wap
ion
ATM
BP
Vol
G B P 3 M x 1 Y S w a p tio n A T M B P V o l v s 2 y - 6 m S w a p S p r e a d
M a r1 9 9 7 to M a y2 0 0 7J un2 0 0 7 to M a r2 0 0 9A fte r M a r2 0 0 9
0 2 4 6 8
-100
-50
050
100
3 M x1 Y F w d S w a p R a te
Sw
ap S
prea
d in
BP
: 2y
- 6m
G B P r 2 y - r 6 m S p r e a d v s 3 M x 1 Y S w a p R a te
M a r1 9 9 7 to M a y2 0 0 7J un2 0 0 7 to M a r2 0 0 9A fte r M a r2 0 0 9

62-1 0 0 -5 0 0 5 0 10 0
6080
100
120
140
160
180
2 y - 6 m S wap S p re ad
1Yx1
Y S
wap
ion
ATM
BP
Vol
G B P 1 Y x 1 Y S w a p tio n AT M B P V o l v s 2 y - 6 m S w a p S p re a d
M ar1 99 7 to M a y2 0 0 7Jun2 0 0 7 to M a r2 0 09A fte r M a r2 0 09
0 2 4 6 8
-100
-50
050
100
1 Yx1 Y F wd S wa p Ra te
Sw
ap S
prea
d in
BP
: 2y
- 6m
G B P r2 y - r6 m S p re a d v s 1 Y x 1 Y S w a p Ra te
M a r19 9 7 to M a y2 0 0 7Jun2 0 0 7 to M a r2 00 9A fte r M a r2 0 09
0 2 4 6 8
050
100
150
1 Yx1 Y F w d S w a p R a te
1Yx1
Y S
wap
ion
ATM
BP
Vol
G B P 1 Y x 1 Y S w a p tio n A T M B P V o l v s F w d S w a p R a te
M a r1 9 9 7 to M a y2 0 0 7J un2 0 0 7 to M a r2 0 0 9A fte r M a r2 0 0 9

63
0 2 4 6 8
050
100
150
1 Yx5 Y F w d S w a p R a te
1Yx5
Y S
wap
ion
ATM
BP
Vol
G B P 1 Y x 5 Y S w a p tio n A T M B P V o l v s F w d S w a p R a te
M a r1 9 9 7 to M a y2 0 0 7J un 2 0 0 7 to M a r2 0 0 9A fte r M a r2 0 0 9
0 2 4 6 8
-100
-50
050
100
1 Yx5 Y F w d S w a p R a te
Sw
ap S
prea
d in
BP
: 2y
- 6m
G B P r 2 y - r 6 m S p r e a d v s 1 Y x 5 Y S w a p R a te
M a r1 9 9 7 to M a y2 0 0 7J un2 0 0 7 to M a r2 0 0 9A fte r M a r2 0 0 9
-1 0 0 -5 0 0 5 0 1 0 0
4060
8010
012
014
016
0
2 y - 6 m S w a p S p re a d
1Yx5
Y S
wap
ion
ATM
BP
Vol
G B P 1 Y x 5 Y S w a p tio n A T M B P V o l v s 2 y - 6 m S w a p S p r e a d
M a r1 9 9 7 to M a y2 0 0 7J un2 0 0 7 to M a r2 0 0 9A fte r M a r2 0 0 9
JPY Data: May 1996 to March 2008
Source: Derivative Trading Systems

65
0 .0 0 .5 1 .0 1 .5
020
4060
8010
0
3 M x 1 Y S w a p R a te
Impl
ied
ATM
BP
Vol
: 3M
x 1
YJ P Y 3 M x 1 Y S w a p tio n A T M B P V o l v s F w d S w a p R a te
0 .0 0 .5 1 .0 1 .5 2 .0 2 .5 3 .0 3 .5
020
4060
8010
012
0
3 M x 5 Y S w a p R a te
Impl
ied
ATM
BP
Vol
: 3M
x 5
Y
J P Y 3 M x 5 Y S w a p tio n A T M B P V o l v s F w d S w a p R a te
0 1 2 3
050
100
150
2 Y x 1 Y S w a p R a te
Impl
ied
ATM
BP
Vol
: 2Y
x 1
Y
J P Y 2 Y x 1 Y S w a p tio n A T M B P V o l v s F w d S w a p R a te
0 1 2 3 4
020
4060
8010
0
2 Y x 5 Y S w a p R a te
Impl
ied
ATM
BP
Vol
: 2Y
x 5
Y
J P Y 2 Y x 5 Y S w a p tio n A T M B P V o l v s F w d S w a p R a te

66
Conclusions
• Slope of the curve at short-end plays an important role in determining implied ATM BP volatility of rates. Volatility appears to be bounded by V-shaped curve with respect to short-end slope with the minimum reached when the curve is flat.
• From the model building perspective we have the following “educated” guess for AVERAGE rate-level dependence of volatility F(R):
– F(R) ~ R for R < R-breakeven (around 2%)
– F(R) ~ a + b*R, levels off for R > R-breakeven and gróws with R for 2% < R < 8%-10%
• Volatility of rates can reach extreme values for high rate levels when the yield curve is downward sloping and real rate reach negative values and its levels are undergoing wild swings (Monetary Experiment in the USA: Sept1979 – Dec 1982).