what are the effects of teacher education and … are the effects of teacher education and...
TRANSCRIPT

CONSORTIUM FOR POLICY RESEARCH IN EDUCATION
What Are the Effects of Teacher Education and Preparation on Beginning Teacher Attrition?
Richard IngersollLisa MerrillHenry May
RESEARCH REPORT
July 2014RR-82

What Are the Effects of Teacher Education and Preparation on Beginning Teacher Attrition?
consortium for policy research in education | cpre.org
About Consortium for Policy Research in Education (CPRE)
The Consortium for Policy Research in Education (CPRE) brings together education experts from renowned research institutions to contribute new knowledge that informs PK-16 education policy and practice. Our work is available for free to education policymakers, practitioners, and researchers at cpre.org.
CPRE’s member institutions are the University of Pennsylvania; Teachers College, Columbia University; Harvard University; Stanford University; University of Michigan; University of Wisconsin-Madison; and Northwestern University.

This research was supported by a grant (# 0814295) from the Research and Evaluation on Education in Science and Engineering (REESE) program of the National Science Foundation. Lisa Merrill’s research was also supported, in part, by the Institute of Education Sciences, U.S. Department of Education, through Grant #R305B090015 to the University of Pennsylvania. Opinions in this paper reflect those of the authors and do not necessarily reflect those of the granting agencies. An earlier draft of this paper was presented at the 2013 Annual Meeting of the American Educational Research Association in San Francisco. Tom Smith and Michael Strong provided valuable feedback and comments on this report.
Suggested citation:
Ingersoll, R., Merrill, L., & May, H. (2014). What are the effects of teacher education and preparation on beginning teacher attrition?. Research Report (#RR-82). Philadelphia: Consortium for Policy Research in Education, University of Pennsylvania.
RICHARD M. INGERSOLL is a senior researcher at the Consortium for Policy Research in Education (CPRE) and a professor of education and sociology at the University of Pennsylvania, Graduate School of Education. Dr. Ingersoll’s research on teaching and teachers has been nationally recognized. He can be reached at [email protected].
LISA MERRILL is a Research Associate at the Research Alliance for New York City Schools and a post-doctoral researcher at CPRE. Dr. Merrill is a recent graduate of the University of Pennsylvania, Graduate School of Education, where she studied education policy. She can be reached at [email protected].
HENRY MAY is a senior researcher at CPRE, Associate Professor of Education and Human Development at the University of Delaware, and director of the Center for Research in Social Policy (CRESP). Dr. May’s primary areas of expertise include methods for program evaluation, experimental and quasi-experimental design, multilevel modeling, longitudinal analysis, item response theory (IRT), and missing data theory. He can be reached at [email protected].


1
AbstractThis study addresses the question: Do the kinds and amounts of pre-service education and preparation that beginning teachers receive before they start teaching have any impact on whether they leave teaching? We examine a wide range of measures of teachers’ subject-matter education and pedagogical preparation. We also compare different fields of teaching, with a particular focus on mathematics and science. Our data source is the National Center for Education Statistics’ nationally representative 2003-04 Schools and Staffing Survey and its supplement, the 2004-05 Teacher Follow-up Survey. Our analyses show that beginning teachers widely varied in the pre-service education and preparation they received. In general, mathematics teachers and, especially, science teachers tended to have more subject-matter content education and more graduate-level education, and to have less pedagogical and methodological preparation than other teachers. Our analyses also show that, after controlling for the background characteristics of teachers and their schools, some aspects of the education and preparation that beginning teachers received were significantly associated with their attrition, while others were not. Specifically, the type of college, degree, entry route or certificate mattered little. What did matter was the substance and content of new teachers’ pedagogical preparation. Those with more training in teaching methods and pedagogy—especially practice teaching, observation of other classroom teaching and feedback on their own teaching—were far less likely to leave teaching after their first year on the job.

2
What Are the Effects of Teacher Education and Preparation on Beginning Teacher Attrition?
consortium for policy research in education | cpre.org
IntroductionThe objective of this study is to examine whether the kinds and amounts of pre-service education and preparation that beginning teachers receive before they start teaching have any impact on whether they leave teaching. How do the attrition rates of new teachers coming from traditional teacher education programs compare to those entering teaching through alternative routes and programs? Are there differences in the attrition of new teachers with education degrees, compared to those with non-education degrees? Do the amounts of practice teaching, preparation in pedagogy, and courses in teaching methods that beginners receive prior to teaching have any bearing on their attrition?
The Debate Over Teacher Education and Preparation
The quality of the pre-employment education and preparation of elementary and secondary teachers is one of the more contentious issues in contemporary educational research, reform, and policy. There is nearly universal agreement that teachers do matter to student growth and learning, and there is equally widespread recognition that the nation’s elementary and secondary students should be taught by qualified teachers. But there is a great deal of disagreement over the character, content, and caliber of the education, preparation, and credentials prospective candidates ought to obtain to be considered qualified to teach.
On one side of this debate are those who argue that pre-service education and preparation requirements for entry into teaching should be as rigorous and restrictive as they are in the traditional professions and as they already are for teachers in a number of other developed nations. From this viewpoint, the way to upgrade the quality of the teaching force is to upgrade the education and preparation standards required of new teachers (see, e.g., National Commission on Teaching and America’s Future, 1996, 1997).
Taking the opposite perspective are those who argue that entry into the teaching occupation is already plagued by unusually restrictive and unnecessarily rigid entry barriers (e.g., Ballou, 1996; Finn, Kanstoroom, & Petrilli, 1999; Hanushek & Rivkin, 2004; Walsh, 2001). These critics argue that there is no solid empirical research documenting the value of existing entry requirements, especially state licensing and certification. Traditional teacher training and qualifications requirements, from this viewpoint, are akin to monopolistic practices that discourage large numbers of high-quality candidates from entering teaching. Hence, the way to upgrade the quality of the teaching force is to de-emphasize and deregulate the education, preparation, and certification requirements for new teachers.
One of the key areas of difference in this larger debate concerns the relative value of teachers’ subject-matter knowledge and pedagogical skills. On one end of this continuum are those who

3
Introduction
argue that content or subject knowledge—knowing what to teach—is of primary importance for a qualified teacher. One of the more popular variants of this deregulation perspective favors a training model analogous to that used for post-secondary academic careers. The pre-employment preparation of professors usually includes little formal training in instructional methods. Similarly, from this viewpoint, having an academic degree in a subject is sufficient to be a qualified school teacher in that subject. Formal training in teaching and pedagogical methods—knowing how to teach—is considered less necessary and is perhaps better learned on the job.
On the other end of this continuum are those who argue that pedagogical or methodological knowledge—knowing how to teach—is of primary importance to be qualified. In this view, in-depth knowledge of a subject is less important than in-depth teaching skills. At its extreme, this viewpoint holds that “a good teacher can teach anything.”
Given this lack of consensus, there have long been large variations in the character and quality of pre-service teacher education and preparation programs, in the types and rigor of state teacher certification requirements, and in the entry routes into the occupation (for reviews, see Cochran-Smith & Zeichner, 2005; Levine, 2006). Not surprisingly, there has also been a long-standing demand for empirical research to assess the value of different types of teacher education, preparation, qualifications, and credentials. From a cross-occupational perspective, this is unusual. For almost all occupations and professions there is little, if any, empirical research assessing the added value of practitioners having a particular credential, license, or certification (American Educational Research Association, American Psychological Association, National Council on Measurement in Education, 1999; Kane, 1994; for a more detailed discussion of these cross-occupational comparisons, see Ingersoll, 2004).
The Importance of Teacher Education and Preparation
In contrast, empirical assessment of teachers’ qualifications is a well-worn path. There are large numbers of empirical studies, going back decades, devoted to evaluating the effects of pre-service elementary and secondary teacher education and preparation on teacher performance (see, e.g., Greenwald, Hedges, & Laine, 1996; Rivkin, 2007). Typically, such studies try to assess the relationship between various measures of teachers’ qualifications and various measures of the performance of those teachers’ students. The findings are mixed, and a number of studies have shown teacher qualifications to have little to no effects on student achievement. But contrary to skeptics of teacher education, a number of studies have indeed found teacher education, preparation, and qualifications, of one sort or another, to be significantly and positively related to student achievement.
For example, Clotfelter, Ladd, and Vigdor (2009) used data on statewide end-of-course tests in North Carolina to examine the relationship between teacher credentials and student

4
What Are the Effects of Teacher Education and Preparation on Beginning Teacher Attrition?
consortium for policy research in education | cpre.org
achievement at the high school level. They found that teacher credentials, particularly licensure and certification, affected student achievement in systematic ways, with magnitudes large enough to be policy relevant. Their findings imply that the uneven distribution of teacher credentials by race and socioeconomic status of high school students contributes to achievement gaps in high school.
Riordan (2009), analyzing data from National Center for Education Statistics’ (NCES) Early Childhood Longitudinal Study (ECLS-K), examined the cumulative effects of having certified teachers through the elementary years on students’ mathematics and reading achievement. Her results showed that students who were taught by certified teachers scored significantly better than those taught by uncertified teachers, and that this had a cumulative effect; in other words, for every year from kindergarten through 3rd grade that a student’s teacher was certified in elementary education, there was a significant increase in the student’s mathematics and reading scores. The effects were greater in reading than in mathematics, but of a strong magnitude in both.
For a middle school example, in a multilevel analysis of 1992 National Assessment of Educational Progress (NAEP) data, Raudenbush, Fotiu, and Cheong (1999) found that teacher education in mathematics (as measured by a major in mathematics or in mathematics education) is “consistently positively and highly significantly related to mathematics proficiency” in 8th-grade students. Likewise, in our own multilevel analyses of NAEP data, using school fixed effects, we found that teacher preparation in both subject matter and teaching methods are positively and significantly related to proficiency of 8th-grade students in several fields. For instance, in analyzing 2003 NAEP data, we found that 8th-grade students whose mathematics teachers had a regular teaching certificate in mathematics or had a major or minor in mathematics or in mathematics education scored significantly higher on an 8th-grade mathematics test. We found similar results in our analyses of NAEP data for 8th grade reading, science, geography, and history (Ingersoll, Perda, & May, forthcoming).
Teacher Education, Preparation and Teacher Turnover
In contrast, there has been less research on the effects of teacher education and preparation on other outcomes, such as teacher retention. In the field of education, there has been a growing understanding of the importance, magnitude, and implications of teacher turnover and retention. In earlier research, we empirically documented the strong connection between turnover and the perennial teacher shortages, especially in mathematics and science, that plague many schools. It is widely believed that one of the pivotal causes of inadequate student performance, especially in mathematics and science, is the inability of schools to adequately staff classrooms with qualified teachers as a result of teacher shortages. However, in analyses of national data we found that school staffing problems are not solely, or even primarily, due to
5
The Study
teacher shortages, in the sense of too few new teachers being produced, especially in fields such as mathematics and science. In contrast, the data indicate that school staffing problems are to a large extent a result of a “revolving door”—where large numbers of existing teachers depart their teaching jobs long before retirement (e.g., Ingersoll, 2001; Ingersoll & Perda, 2010; Ingersoll & May, 2012).
Numerous studies also show that teacher turnover greatly varies according to the type of teacher, and that turnover is highest among beginners (Borman et al., 2008; Guarino, Santibanez, & Daley, 2006). Using national longitudinal data, Perda (2013) recently documented that more than 42% of new teachers leave teaching within 5 years of entry and, moreover, we have also discovered a steady increase in beginning teacher attrition over the past 2 decades (Ingersoll & Merrill, 2013).
Along with this expanding body of empirical literature, there has also been a growing recognition that if schools are to be successful in ensuring that all classrooms are staffed with qualified teachers, especially in mathematics and science, they will have to better address the problem of teacher turnover, especially among beginning teachers (e.g., Liu, Rosenstein, Swann, & Khalil, 2008; National Commission on Teaching and America’s Future, 2003). As such, our focus in this study is to examine the role of pre-service preparation and education in the retention of beginning teachers.
To be sure, a number of studies have examined the relationship between retention and the amount of postsecondary education teachers have, and the type of teaching certificate held by teachers (see, e.g., Adams, 1996; Catena, 2009; Clewell & Villegas, 2001; Kirby, Berends, & Naftel, 1999). But there are important limits to the extant research (for comprehensive reviews, see Guarino et al., 2006; Zumwalt & Craig, 2005a; Zumwalt & Craig, 2005b). Most of this research has focused on limited aspects of the pre-service education and preparation of teaching candidates; most analyzed district or state data, limiting generalizability; and few have distinguished among different fields such as mathematics and science. As a result of these limits, it is difficult to draw firm conclusions about the effects of teachers’ education and preparation on their retention.
The StudyThe objective of this study is to address the need for empirical evaluation of the effects of teachers’ pre-service education and preparation on their retention. We examine the relationship between new teachers’ prior education and preparation and whether those teachers were more or less likely to leave teaching after their first year. We focus on new teachers because attrition rates are at their highest just after the first year of teaching and new teachers are at a point in their careers when the effects of their pre-service education and preparation are perhaps most influential.

6
What Are the Effects of Teacher Education and Preparation on Beginning Teacher Attrition?
consortium for policy research in education | cpre.org
Unlike most previous research on this topic, we examine a number of different measures of the amounts and kinds of education and preparation new candidates have completed. Also unlike most previous empirical research, we use nationally representative data to examine a cohort of all beginning teachers, and we control for the effects of a wide range of other teacher and school factors on the likelihood that teachers will leave the occupation. Further distinguishing our study from most others on this topic, we distinguish and compare across different teaching fields, with an emphasis on mathematics and science—fields that are the source of much policy concern.
We seek to address two sets of research questions:
1. Levels of Teacher Education and Preparation: What kinds and amounts of pre-service education and preparation have new teachers typically completed? For instance, what proportions of new teachers have education or have non-education degrees, are certified, come from the most and least selective colleges, and enter through alternative or traditional routes? In addition, how much pedagogical preparation, practice teaching, and coursework in teaching methods have new candidates typically completed before entering the classroom? How does this differ among teachers of mathematics, science, and other subjects?
2. The Association Between Teacher Education, Preparation, and Attrition: What is the relationship between the different kinds and amounts of pre-service education and preparation that new teachers have had and the likelihood that they depart teaching after their first year on the job? For instance, are the types of colleges teachers attended, the kind of degree they obtained, or the route through which they entered teaching related to whether they leave teaching? Are the amounts and kinds of pedagogical preparation that teachers acquired associated with their likelihood of leaving teaching? How does this differ among teachers of mathematics, science, and other subjects?
Data and Methods
Data
The data for this study come from the NCES’s nationally representative Schools and Staffing Survey (SASS), along with its supplement, the Teacher Follow-up Survey (TFS). SASS/TFS is the largest and most comprehensive data source available on elementary and secondary school teachers. The U.S. Census Bureau collects the SASS data for NCES from a random sample of schools stratified by state, public/private sector, and school level. Each cycle of SASS includes separate, but linked, questionnaires for a random sample of teachers in each school and for school-level and district-level administrators. In addition, after 12 months, the same schools are again contacted, and all those in the original teacher sample who had moved from or left their teaching jobs are given a second questionnaire to obtain information on their departures.

7
Data and Methods
This latter group, along with a representative sample of those who stayed in their teaching jobs, comprise the TFS. Unlike most previous data sources on teacher turnover, the TFS is large, comprehensive, nationally representative, and can be linked to a wide range of information on both teachers and schools through SASS. To date, seven SASS/TFS cycles have been conducted: 1987-89, 1990-92, 1993-99, 1999-01, 2003-05, 2007-09, and 2011-13 (for more information on the SASS, see National Center for Education Statistics, 2005; Strizek, Pittsonberger, Riordan, Lyter, & Orlofsky, 2006; for more information on the TFS, see Chandler, Luekens, Lyter, & Fox, 2004).
Our analysis uses data primarily from the 2003-04 SASS and the 2004-05 TFS. The 2003-04 SASS has the advantage of collecting more information on teachers’ education and preparation than other cycles of SASS. The 2004-05 TFS has the advantage of having a larger sample size than the more recent 2008-09 cycle of TFS. (The 2012-13 TFS had not been released when we performed our analyses.) Our sample includes teachers from all types of schools—including public, charter, and private. We focus on those in their first year of teaching in 2003-04—a sample of 2,651. This sample represents a population of about 183,300 first year teachers in 2003-04. Some had completed their teacher education and preparation prior to beginning teaching. Others were undertaking coursework in teacher preparation concurrently while teaching their first year. The SASS survey questionnaire was administered in the spring and includes whatever education and preparation the teachers had completed up to that point. Our analyses use the final NCES-supplied weights in order to obtain unbiased estimates of the national population of schools and teachers in the year of the survey.
Methods and Measures
Our analysis is divided into three stages. The first stage presents descriptive data on the kinds and amounts of beginning teachers’ education and preparation—in answer to our first set of research questions. We drew from the unusually extensive information collected by SASS on the background of teachers to develop the following measures:
• A proxy measure of each teacher’s academic achievement and ability: Barron’s rankings of the selectivity and competitiveness of the college or university where each teacher obtained his or her bachelor’s degree
• Whether the teacher held a non-education degree (e.g., mathematics, economics), an education degree (e.g., curriculum studies, mathematics education), or both
• Whether the teacher held a graduate-level degree (i.e., a master’s or doctorate degree)
• Each teacher’s highest type of teaching certificate
• The route through which the teacher entered teaching (e.g., traditional program or alternative route)

8
What Are the Effects of Teacher Education and Preparation on Beginning Teacher Attrition?
consortium for policy research in education | cpre.org
• The number of courses the teacher completed in teaching methods or teaching strategies
• The amount of practice teaching the teacher underwent prior to teaching
• Whether the teacher received the following four other types of pedagogical preparation:
� Preparation in selecting and adapting instructional materials
� Coursework in learning theory or child/youth psychology
� Opportunities to observe others’ classroom teaching
� Formal feedback on their own teaching
The advantage of using a large-scale data source such as SASS is that it allows us to make generalizable assessments of whether pre-service education and preparation are associated with teacher attrition. However, it is necessary to note that there are also some important limitations to the SASS measures on education and preparation. First, these items are crude measures of the quality of teacher education preparation programs themselves. Second, while SASS did ask teachers to indicate the kinds of pre-service components they received, there is limited detail available on the intensity, duration, cost, or structure of these programs. For instance, while SASS asks teachers how many weeks of practice teaching they have had, it does not obtain information on the quality of teachers’ practice, field, and clinical experiences. Moreover, SASS collected no information on whether new teachers entered teaching through particular programs, such as Teach for America.
Our analyses compare qualified mathematics teachers with qualified science teachers, and qualified math and science teachers with all other teachers (those not qualified in either mathematics or science). There is a great deal of debate concerning how to define teachers as “qualified” in any given field. Here we adopt a definition based on postsecondary major. We define a teacher as qualified in a field if he or she holds an undergraduate degree, or a graduate degree, in that or a related field. We count as qualified both non-education and subject-area education degrees. For mathematics, we define as qualified those who indicated they had completed an undergraduate or graduate major in mathematics or mathematics education. We define qualified science teachers as those who indicated they had completed an undergraduate or graduate major in science education, biology, physics, chemistry, earth science, another natural science, or engineering. Eighty-five percent of these qualified mathematics and science teachers were employed in departmentalized settings at the middle or secondary school levels. The remainder were employed in primary schools, usually as mathematics instructors in mathematics enrichment courses, rarely as regular multiple-subject elementary school teachers.
Our definition is roughly equivalent to that used in the No Child Left Behind Act (NCLB). Like NCLB, we do not count as qualified those with only a teaching certificate in a field, absent a degree or major in that field. But unlike NCLB, we do not use teachers’ test scores (such as Praxis)

9
Data and Methods
as a means of assessing qualifications in a field because our data do not have such information. Moreover, we do not base our definition of qualified teachers on a respondent’s teaching assignments—where, for example, a teacher assigned to teach mathematics is assumed to be qualified in mathematics. Identifying teachers according to their fields of assignment can be inaccurate because of the widespread practice of out-of-field teaching, in which teachers are assigned to teach subjects for which they have few formal qualifications (Ingersoll, 1999). We chose a major-based method of identification because it represents those teachers with a credential signifying human capital in the field, a topic that is a major policy concern. Hence, in our discussion to follow, the terms “mathematics teacher” and “science teacher” refer to those with degrees in their respective fields. Note that while we do not include measures of the performance or effectiveness of teachers, as mentioned, we do use a proxy measure of teachers’ academic ability—the selectivity ranking of their undergraduate college or university.
In the second stage of our analysis we present a logistic regression analysis of the relationship between the measures of each teacher’s education and preparation and the likelihood that he or she left the teaching occupation. In the regression models, the dependent variable—teacher attrition—is based on whether each teacher remained with his or her school (“stayers”), or left teaching (“leavers”), within 1 year after the 2003-04 SASS administration. We focus on only those leaving teaching and do not include those moving between schools. A limitation of our dependent variable is that it only captures attrition over a 1-year period. There are no data available on later attrition.
The 2004-05 TFS includes only about 12% of teachers from the original SASS sample. To increase the sample size of the first-year teachers, specifically for our regression analyses, we combined the TFS measure of turnover with a preliminary measure of turnover collected from school principals for the entire SASS teacher sample (from the 2004-05 TFS Teacher Status Survey).1 This increased our regression sample size to 2,263 first-year teachers, including 113 mathematics teachers and 158 science teachers.
We progressively examine three groups of predictors of attrition: teacher characteristics, school characteristics, and teacher education/preparation. Table 1 provides definitions for these variables. Table 2 provides descriptive statistics for them. Following previous research on teacher turnover, in the regression models we include control variables for several key individual teacher characteristics: race/ethnicity, gender, and age. Following previous research on schools, in the regression models we include, as independent variables, school characteristics typically found to be important in this literature: school level, school size, the type of school locale (i.e., urban, rural, suburban), and the proportion of the student population in poverty (i.e., eligible for free or reduced lunch).2 This second stage of the analysis examines whether the likelihood of individual teachers leaving their teaching jobs is related to our previously described teacher-level measures of pre-service teacher education and preparation, while controlling for individual-level characteristics of teachers and school demographic characteristics.

10
What Are the Effects of Teacher Education and Preparation on Beginning Teacher Attrition?
consortium for policy research in education | cpre.org
Table 1: Definitions of Variables Utilized in the Analysis
Teacher Attrition: a dichotomous variable where 1 = leaver/not teaching in fall 2005, and 0 = stayer/teaching in same school in fall 2005 as in 2003/2004.
Teacher Characteristics
Midcareer: a dichotomous variable where 1 = age of teacher is equal or greater than 30 years, and 0 = age of first- year-teacher is less than 30.
Male: a dichotomous variable where 1 = male teacher, and 0 = female teacher.
Minority: a dichotomous variable where 1 = minority teacher; and, 0 = white, non-hispanic teacher.
Teacher Field
Math: a dichotomous variable where 1 = degree in mathematics or mathematics education, and 0 = all other teachers.
Science: a dichotomous variable where 1 = degree in one of the sciences or science education, and 0 = all other teachers.
School Characteristics
Private: a dichotomous variable where 0 = public or charter school, and 1 = private school.
Rural: a dichotomous variable where 1 = rural, and 0 = suburban or urban.
Suburban: a dichotomous variable where 1 = suburban, and 0 = rural or urban.
Urban: a dichotomous variable where 1 = urban, and 0 = rural or suburban.
Secondary: a dichotomous variable where 1 = junior or senior secondary, and 0 = elementary or middle or combined (K-12).
Size: a continuous variable of student enrollment of school.
Poverty: percentage of students eligible for the federal free-or reduced-price lunch program for students from families below poverty level. Private schools that did not participate in the National School Lunch Program were coded as 0. Public schools where the principal stated that no students were eligible, or that he/she didn’t know if any were eligible, were coded as 0.

11
Data and Methods
Teacher Education and Preparation
College Selectivity: a continuous variable ranking each teacher’s undergraduate institution using Barron’s 5-category scale of college and university selectivity, from 0 to 4, where 4 = the top two Barron’s categories—most competitive and highly competitive; 3 = very competitive; 2 = competitive; 1 = non-competitive and less competitive; and, 0 = foreign college, special college (arts, business), selectivity not available.
Note, a teacher’s undergraduate institution may not be the same as the institution at which they completed teacher education.
Education Degree Only: a dichotomous variable where 1 = teacher only has degree(s) awarded by a department, college, or school of education; and, 0 = teacher has non-education degree(s).
Non-Education Degree Only: a dichotomous variable where 1 = teacher only has degree(s) awarded by non-education department, college, or school; and, 0 = teacher has education degree(s).
Mixed Degrees: a dichotomous variable where 1 = teacher has both an education and a non-education degree, and 0 = teacher has only education or non-education degree.
Graduate Degree: a dichotomous variable where 0 = bachelor’s degree or less and 1 = master’s degree or more.
Traditional Route: way by which teacher obtained teaching methods or teaching strategies coursework; a dichotomous variable where 1 = through a bachelor’s degree program, fifth-year program, or master’s degree program; and, 0 = through an alternative program, through individual courses, or no teaching methods or teaching strategies coursework completed.
No Certificate = teacher has no certificate of any type.
Less-than-Full Certificate = teacher’s highest certificate is temporary, emergency, or provisional.
Full Certificate = teacher has a regular, standard, advanced, or probationary certificate (probationary refers to a certificate given to those who have fulfilled all requirements except having completed a short probationary period of employment).
Table 1: Definitions of Variables Utilized in the Analysis (con’t)

12
What Are the Effects of Teacher Education and Preparation on Beginning Teacher Attrition?
consortium for policy research in education | cpre.org
Methods Courses: number of undergraduate or graduate courses teacher completed that focused on teaching strategies or teaching methods, on a 5-point scale: 0 = no courses; 1 = 1-2 courses; 2 = 3-4 courses; 3 = 5-9 courses; and 4 = 10 or more courses.
No Practice Teaching: a dichotomous variable where 1 = teacher had no practice teaching, and 0 = teacher had some.
Some Practice Teaching: a dichotomous variable where 1 = teacher had 1-11 weeks of practice teaching, and 0 = teacher had none or at least 12 weeks.
Semester or More Practice Teaching: a dichotomous variable where 1 = teacher had at least 12 weeks of practice teaching, and 0 = teacher had less than 12 weeks.
Four Other Pedagogy Components:
Prep in Selecting Materials: a dichotomous variable where 1 = teacher’s preparation included coursework in how to select and adapt instructional materials, and 0 = teacher’s preparation did not include this.
Learning Theory: a dichotomous variable where 1 = teacher’s preparation included coursework in learning theory or psychology appropriate to age of students taught, and 0 = teacher’s preparation did not include this.
Observation of Other Teaching: a dichotomous variable where 1 = teacher’s preparation included observation of other classroom teaching, and 0 = teacher’s preparation did not include this.
Feedback on Teaching: a dichotomous variable where 1 = teacher’s preparation included feedback on their teaching, and 0 = teacher’s preparation did not include this.
Table 1: Definitions of Variables Utilized in the Analysis (con’t)

13
Table 2: Descriptive Statistics for Variables Utilized in Analysis
MEANS OR PERCENTAGES
VARIABLESNon-Math/Science
(n=2267)Mathematics
(n=157)Sciencen=227)
School Characteristics 12.3 14.5 18.2
Teacher CharacteristicsMidcareer .38 .42 .46
Male .25 .41 .27
Minority .23 .18 .13
School Characteristics
Private .17 .08 .20
Poverty .39 .33 .35
Rural .16 .16 .16
Suburban .51 .56 .51
Urban .34 .28 .33
Secondary .26 .62 .56
Size 719 1007 968
Note: School means are at the teacher level and associated with teachers in the sample.
Education and Preparation
From Most Competitive Colleges/Universities .10 .14 .21
From Non-Competitive Colleges/Universities .24 .29 .18
Education Degree Only .60 .51 .27
Non-Education Degree Only .29 .42 .68
Mixed Degrees .07 .07 .07
Graduate Degree .14 .23 .26
Traditional Route .62 .51 .38
No Certificate .18 .16 .23
Less-than-Full Certificate .27 .36 .47
Full Certificate .55 .48 .30
Methods Courses 1.95 1.53 1.54
No Methods Courses .18 .35 .30
No Practice Teaching .21 .23 .42
Some Practice Teaching .21 .17 .18
Semester or More Practice Teaching .58 .60 .40
Prep in Selecting Materials .83 .80 .69
Learning Theory .85 .82 .74
Observation of Teaching .88 .89 .82
Feedback on Teaching .83 .86 .74

14
What Are the Effects of Teacher Education and Preparation on Beginning Teacher Attrition?
consortium for policy research in education | cpre.org
The third stage of our analysis focuses more closely on the effects of our several measures of pedagogical preparation:
• Coursework in teaching methods or teaching strategies
• Practice teaching
• Four other types of pedagogy:
� Preparation in how to select and adapt instructional materials
� Coursework in learning theory or child/youth psychology
� Opportunities to observe others’ classroom teaching
� Formal feedback on their own teaching
Our analysis revealed that these components of pedagogical preparation do not exist in isolation and are not independent, separate experiences; teachers with higher or lower levels of some were also likely to have higher or lower levels of others, partly depending on the type of program or route through which they entered teaching. To uncover how these preparation components tended to coincide we used a statistical clustering technique—SAS’s PROC CLUSTER—with a Wald’s minimum variance method. This technique empirically subdivided our teacher sample into five mutually exclusive groups receiving different “packages” of pedagogical preparation. We then replaced the preparation measures in our regression model with these preparation package measures to estimate the extent to which receiving differing packages of pedagogical preparation is related to teacher attrition.
To evaluate whether relationships between the coefficients for the education and preparation predictors differed by field—between mathematics teachers and science teachers, and non-mathematics/science teachers—we also estimated our models with interaction terms between each of the teacher education and preparation predictors and the mathematics and science teacher field variables.3
For all of the models we used a generalized estimating equations (GEE) approach to multi-level logistic regression (Liang & Zeiger, 1986). This approach makes fewer distributional assumptions than hierarchical generalized linear models (HGLM) (see Raudenbush & Bryk, 2002), and is more appropriate when within-cluster sample sizes are small, as in the case of the SASS data. Our analysis used PROC GENMOD in SAS (version 9.2)—to estimate the GEE models. GENMOD adjusts for the non-random clustering of teachers within schools resulting from the multilevel structure of the sample and uses within- and between-school predictor variables to estimate separate effects across multiple levels. This procedure also supports logistic regression and allows for the inclusion of sampling design weights. Use of weights is necessary because the SASS and TFS samples over- or under-sample certain segments of the teaching population.

15
Results
While the TFS data are longitudinal in the sense that the attrition outcomes transpired 1 year after the teacher began teaching and at least 2 years after most teachers completed their pre-service education and preparation, it is important to note that any relationships found between these variables and attrition represent statistical associations between measures and do not imply causality.
Results
Levels of Teacher Education and Preparation
The data show that new teachers varied widely in their education and preparation experiences. Most of those in our sample of first-year teachers were recently graduated from undergraduate institutions; however, a quarter had completed graduate-level degrees. Most had completed their teacher education and preparation prior to beginning teaching, while 19% of the first-year teachers were undertaking teacher preparation and pedagogical coursework concurrently while teaching their first year, often in alternative route programs. About 40% were mid-career entrants, defined here as age 30 or older, and had usually completed their undergraduate or graduate degrees at least a few years before entering teaching.
Mathematics and science teachers had different educational and preparation experiences and backgrounds than other teachers and also differed from each other. In general, mathematics and science teachers tended to have more subject-matter content education, more graduate-level education, and to have less pedagogical preparation than other teachers; this was especially true for science teachers.
In 2003-04 about one-tenth of incoming teachers had obtained their bachelor’s degrees from the most selective colleges and universities; on the other hand, about a quarter of incoming teachers had obtained their bachelor’s degrees from the least selective colleges and universities. In other analyses we have shown that these percentages have changed little over the period from the late 1980s to 2011-12 (Ingersoll & Merrill, 2013). If we use college or university selectivity as a proxy measure of academic ability, the data then seem to indicate that there have not been large changes in the ability of incoming teachers over the past two-and-a-half decades. The data also suggest that first-year science and mathematics teachers on average tended to be of higher academic ability than other teachers, at a statistically significant level. Fourteen percent of new mathematics teachers and 21% of new science teachers obtained their bachelor’s degrees from the most selective institutions (see Figure 1).
In our analysis we disaggregated the data to discern what portions of new teachers held only non-education degrees, what portions held only degrees from colleges or schools of education, what portions held both, and how this differed by teacher field. The data show the majority of

16
What Are the Effects of Teacher Education and Preparation on Beginning Teacher Attrition?
consortium for policy research in education | cpre.org
beginning teachers entered teaching with education degrees. However, interestingly, compared with other new teachers, first-year mathematics teachers, and especially first-year science teachers, were far less likely to hold education degrees and far more likely to have obtained non-education degrees, at a statistically significant level. First-year mathematics and science teachers were also more likely to have already completed a graduate-level degree than other new teachers.
Figure 1. Percent Beginning Teachers’ Who Graduated from the Most Selective Colleges, with Education and Non-Education Degrees, with Graduate-level Degrees, with Full Teaching Certificates, and Who Entered Through a Traditional Program, by Field: 2003-04
0 20 40 10060 80
OtherMathScience
From Most Selective Colleges
Education Degree Only
Non-Education Degree Only
Graduate-Level Degree
Full Certificate
Traditional Route
Percent
1014
21
6051
27
2942
68
1423
26
5548
30
6251
38
The majority of beginning teachers held full, regular state teaching certificates and entered through traditional routes. Just under 40 percent did not enter through an alternative route or did not come into teaching through a formal program at all. Again, first-year science and mathematics teachers also differed, at a statistically significant level, in their level of certification and the type of program or route by which they entered teaching. Type of certification and type of route are sometimes assumed to be the same. For instance, some assume that teachers who entered through an alternative route hold an alternative certificate. This is a misunderstanding. Those entering through an alternative route may, or may not, have held an alternative certificate
17
Results
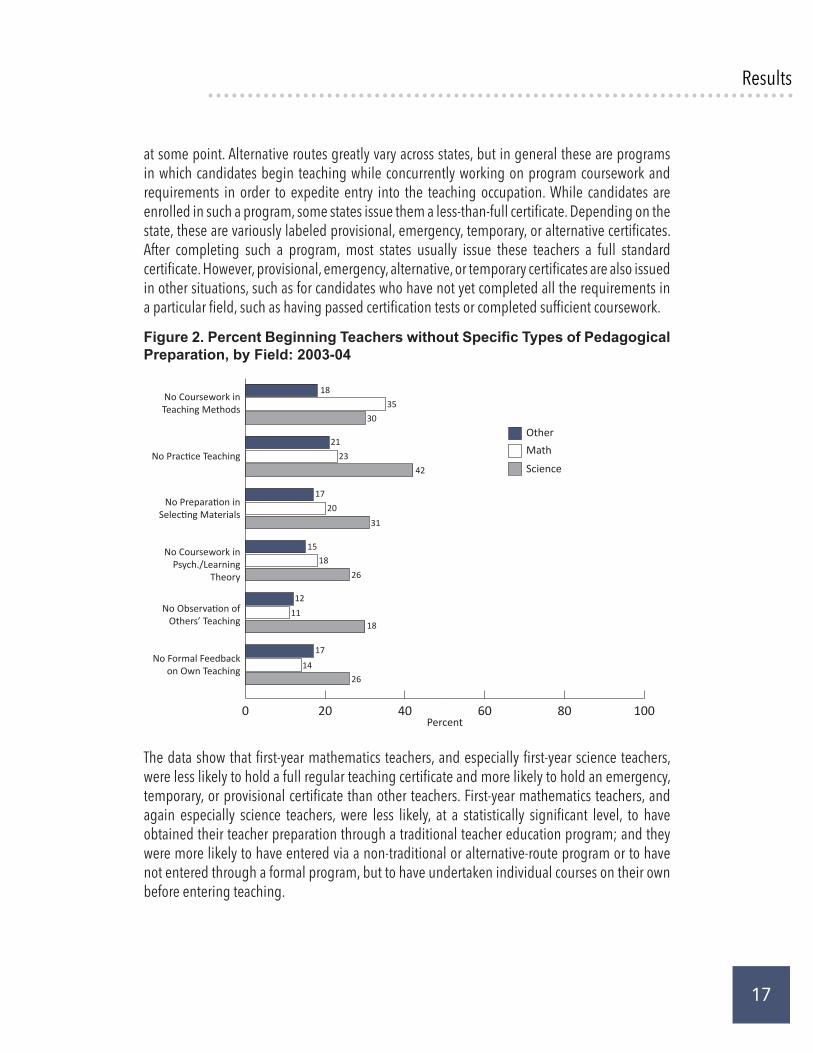
at some point. Alternative routes greatly vary across states, but in general these are programs in which candidates begin teaching while concurrently working on program coursework and requirements in order to expedite entry into the teaching occupation. While candidates are enrolled in such a program, some states issue them a less-than-full certificate. Depending on the state, these are variously labeled provisional, emergency, temporary, or alternative certificates. After completing such a program, most states usually issue these teachers a full standard certificate. However, provisional, emergency, alternative, or temporary certificates are also issued in other situations, such as for candidates who have not yet completed all the requirements in a particular field, such as having passed certification tests or completed sufficient coursework.
Figure 2. Percent Beginning Teachers without Specific Types of Pedagogical Preparation, by Field: 2003-04
0 20
OtherMath
Science
100806040
No Coursework in Teaching Methods
No Practice Teaching
No Preparation in Selecting Materials
No Formal Feedback on Own Teaching
No Coursework in Psych./Learning
Theory
No Observation of Others’ Teaching
Percent
1835
30
2123
42
1720
31
1518
26
1211
18
17
1426
The data show that first-year mathematics teachers, and especially first-year science teachers, were less likely to hold a full regular teaching certificate and more likely to hold an emergency, temporary, or provisional certificate than other teachers. First-year mathematics teachers, and again especially science teachers, were less likely, at a statistically significant level, to have obtained their teacher preparation through a traditional teacher education program; and they were more likely to have entered via a non-traditional or alternative-route program or to have not entered through a formal program, but to have undertaken individual courses on their own before entering teaching.

18
What Are the Effects of Teacher Education and Preparation on Beginning Teacher Attrition?
consortium for policy research in education | cpre.org
Figure 3. Percent Beginning Teacher Attrition After First Year, by Field: 2004-05
0 10 403020 50Percent
Other
Math
Science
12.3
14.5
18.2
Table 3: Percent Beginning Teachers, by Selected Types of Education and Preparation, by Year
2003-04 2007-08 2011-12From Most Selective Colleges/Universities 11 8 10
Education Degree Only 57 59 58Non-Education Degree
Only 32 32 24
Graduate Degree 16 20 23Full Certificate 53 60 67
Alternative Route 13 24 22No Methods Courses 20 20 20No Practice Teaching 23 25 15
19
Results
Besides their types of college, degree, certificate, and program, not surprisingly, first-year teachers also differed in the actual pedagogical preparation they acquired before entering teaching. Overall, a majority of beginners had completed all of the six components of pedagogical preparation shown in Figure 2. But, again this varied by field. Qualified first-year science teachers tended to have undertaken less of these types of pedagogical preparation; this was also true, but less so, for mathematics teachers (see Figure 2). For instance, both new mathematics and science teachers were more likely to have taken no formal coursework in teaching methods and teaching strategies. First-year science teachers, in particular, had less practice teaching than others prior to taking their first teaching job, at a statistically significant level. Over 40% had none, as compared to 21% of other teachers. In addition, new science teachers, in particular, were less likely, at a statistically significant level, to have had all of the four other types of pedagogical preparation: coursework in how to select and adapt instructional materials, coursework in learning theory and child psychology, opportunities to observe others’ classroom teaching, and formal feedback on their own teaching. In contrast, mathematics teachers tended to be more similar to other teachers in their likelihood of receiving these latter four types of pedagogy.
As indicated earlier, we primarily analyzed data from the 2003-04 cycle of SASS because that cycle collected more information on teacher education and preparation than other cycles of SASS. However, in subsequent years, SASS did continue to collect information on some of the same measures – allowing us to examine if the types of education and preparation beginning teachers received changed between 2003 and 2012. As shown in Table 3, the data document some changes by 2012: slightly higher proportions of beginning teachers entered with masters’ degrees, full certificates, and via alternative routes and a smaller proportion entered without having had any practice teaching. But, overall, for these measures, there were not large differences.
Finally, there were also large differences in the attrition rates of beginning teachers by field. Beginning mathematics and science teachers left teaching at higher rates, at a significant level, than other new teachers: after their first year, over 18% of science teachers left, 14.5% of mathematics teachers left, while 12.3% of others did so (see Figure 3). This brings us to our primary question: Is there a connection between the differences in teachers’ education and preparation that we identified in this study and the likelihood of those teachers leaving after their first year on the job?
The Association Between Teacher Education, Preparation, and Attrition
We estimated a series of regression models using the combined SASS/TFS data (see endnote 1) to examine whether our collection of measures of teacher education and preparation were associated with teacher attrition. The predictor variables and associated regression estimates

20
What Are the Effects of Teacher Education and Preparation on Beginning Teacher Attrition?
Tabl
e 4a
: Odd
s R
atio
s fr
om L
ogis
tic R
egre
ssio
n A
naly
sis
of th
e Li
kelih
ood
of B
egin
ning
Tea
cher
Attr
ition
MO
DEL 1
MO
DEL 2
MO
DEL 3
MO
DEL 4
MO
DEL 5
MO
DEL 6
Teac
her N
2252
1091
2252
2252
2252
2252
Scho
ol N
2003
923
2003
2003
2003
2003
Interc
ept
0.15*
**0.1
1***
0.14*
**0.1
5***
0.20*
**0.1
3***
Teac
her
Char
acte
ristic
sM
idcare
er1.1
31.1
31.3
1.31
1.26
1.31
Male
1.16
1.15
1.34
1.35
1.31
1.33
Mino
rity
0.75
0.76
1.41.4
11.3
71.2
6
Math
1.05
1.03
1.14
1.14
1.12
1.09
Scien
ce1.5
61.4
91.4
11.4
61.4
1.44
Scho
ol
Char
acte
ristic
sPr
ivate
Scho
ol2.7
5**
2.61*
2.55*
*2.5
4**
2.32*
*1.3
7
Pove
rty En
rollm
ent (i
n 10
s)0.9
60.9
71.1
81.1
61.0
71.1
9
Rural
0.75
0.82
0.67
0.66
0.67
0.65
Subu
rban
0.45*
0.46*
0.51*
*0.5
1*0.5
2*0.5
2*
Seco
ndary
Leve
l2.1
3*2.1
5*1.4
6~1.4
4~1.4
3~1.3
6
Scho
ol Siz
e (in
100s
)0.9
80.9
80.9
80.9
80.9
80.9
8
Teac
her E
duca
tion
Colle
ge Se
lectiv
ity
0.94
Non-E
duc D
egree
Only
1.48
Mixe
d Deg
rees
1.
19
Grad
uate
Degr
ee
1.15
Tradit
ional
Rout
e
0.6
7~
No Ce
rtific
ate
2.75*
*
Less-
than
-Full C
ertific
ate
1.27
~ P
<.1
0; *
P<
.05;
**
P<.0
1; *
** p
<.0
01

21
Tabl
e 4b
: Odd
s R
atio
s fr
om L
ogis
tic R
egre
ssio
n A
naly
sis
of th
e Li
kelih
ood
of B
egin
ning
Tea
cher
Attr
ition
(con
tinue
d)
MO
DEL 7
MO
DEL 8
MO
DEL 9
MO
DEL 1
0
Teac
her N
2252
2252
2252
2252
Scho
ol N
2003
2003
2003
2003
Interc
ept
0.27*
0.29*
0.38~
0.32*
Teac
her C
hara
cter
istic
sM
idcare
er1.3
1.28
1.23
1.28
Male
1.29
1.28
1.27
1.34
Mino
rity
1.31
1.33
1.35
1.24
Math
1.13
1.12
1.21.1
9
Scien
ce1.3
61.4
1.42
1.38
Scho
ol C
hara
cter
istic
sPr
ivate
Scho
ol2.1
0*2.0
6*2.1
5**
2.10*
Pove
rty En
rollm
ent (i
n 10s
)1.1
71.1
71.1
81.1
3
Rural
0.66
0.66
0.66
0.67
Subu
rban
0.51*
0.52*
0.52*
0.50*
*
Seco
ndary
Leve
l1.3
91.3
61.3
51.4
3~
Scho
ol Siz
e (in
100s
)0.9
80.9
80.9
80.9
8
Teac
her P
repa
ratio
nM
ethod
s Cou
rses
0.82
*
No Pr
actic
e Tea
ching
2.9
1***
Som
e Prac
tice T
each
ing
1.72*
Prep i
n Sele
cting
Mate
rials
0.5
0**
Learn
ing Th
eory
0.49*
*
Obse
rvatio
n of O
ther
Teac
hing
Feed
back
on Te
achin
g
~ P
<.1
0; *
P<
.05;
**
P<.0
1; *
** p
<.0
01

22
What Are the Effects of Teacher Education and Preparation on Beginning Teacher Attrition?Ta
ble
4c: O
dds
Rat
ios
from
Log
istic
Reg
ress
ion
Ana
lysi
s of
the
Like
lihoo
d of
Beg
inni
ng T
each
er A
ttriti
on (c
ontin
ued)
MO
DEL 1
1M
ODE
L 12
MO
DEL 1
3M
ODE
L 14
Teac
her N
2252
2252
2252
2252
Scho
ol N
2003
2003
2003
2003
Interc
ept
0.22*
*0.1
1***
0.26*
0.12*
**
Teac
her C
hara
cter
istic
sM
idcare
er1.3
31.2
1.18
1.21
Male
1.31
1.21
1.21
1.21
Mino
rity
1.38
1.28
1.26
1.27
Math
1.09
1.17
1.19
1.15
Scien
ce1.4
11.2
81.3
11.2
5
Scho
ol C
hara
cter
istic
sPr
ivate
Scho
ol2.2
9**
1.93*
1.84*
1.82*
Pove
rty En
rollm
ent (i
n 10s
)1.1
91.0
21.0
81.0
5
Rural
0.64
0.70.6
90.6
9
Subu
rban
0.51*
0.55*
0.55*
0.54*
Seco
ndary
Leve
l1.3
91.4
3~1.3
61.4
2~
Scho
ol Siz
e (in
100s
)0.9
80.9
80.9
80.9
8
Teac
her P
repa
ratio
nM
ethod
s Cou
rses
0.9
6
No Pr
actic
e Tea
ching
1.8
5
Som
e Prac
tice T
each
ing
1.65~
Prep i
n Sele
cting
Mate
rials
1.03
Learn
ing Th
eory
0.91
Obse
rvatio
n of O
ther
Tching
0.34
***
0.5
4~
Feed
back
on Te
achin
g
0.42
***
0.88
Peda
gogi
cal P
repa
ratio
nLit
tle or
No P
edag
ogy
3.0
0***
Pack
ages
Basic
Peda
gogy
1.3
Basic
+ Pe
dago
gy
1.01
Othe
rs
2.08*
~ P
<.1
0; *
P<
.05;
**
P<.0
1; *
** p
<.0
01

23
Results
from each model are shown in Table 4. Model 1 includes only controls for basic teacher and school characteristics. Models 2 through 12 separately add to the basic model (Model 1) each of the teacher education and preparation variables. Model 13 adds in all of the preparation measures together. Model 14 estimates the associations of several different packages of combinations of the preparation variables—a portion of our analysis we discuss further, below.
To evaluate whether relationships between the predictors and attrition differed by field—between mathematics teachers and science teachers, and non-mathematics/science teachers—we also estimated each model with the addition of interaction terms between each of the teacher education/preparation predictors and the variables for mathematics teachers and for science teachers. We found very few of the possible interactions to be statistically significant even at a .10 level.4 We also discuss these results below.
Our analyses show that, after controlling for school and other factors, few of the measured individual characteristics of first-year teachers were related to their likelihood of leaving, at a statistically significant level. Male teachers were more likely to depart than were female teachers, and science teachers were more likely to depart than were non-science teachers, but neither of these held true, at a significant level, after controlling for their education and preparation.
Some of the school characteristics were related to beginners’ attrition. School sector stood out as a key variable. In general, beginning teachers in private schools were about twice as likely to depart as those in public schools. However, notably, this coefficient became smaller and statistically insignificant after controlling for teachers’ education and preparation (models 13 and 14 in Table 4c). In addition, after controlling for other factors, teachers in suburban schools were about 50% less likely to depart than were those in urban schools. Finally, in a number of the models, the likelihood of attrition from secondary schools was higher (at a 90% level of confidence) than attrition from elementary and K-12 combined schools.
The question of particular interest to us here is: After controlling for these characteristics of teachers and schools, were the measures of teachers’ education and preparation associated with attrition? We found that a number of aspects of beginning teachers’ educational and preparation experiences were significantly associated with their attrition. Others were not.
Although new teachers’ types of colleges, degrees, certificates, and preparation routes were often associated with their likelihood of leaving in our background bivariate analyses, after we controlled for teacher and school background characteristics, most of these relationships became small and/or statistically insignificant.
For instance, in our background analyses we found that teachers who attended more selective undergraduate institutions tend to leave at higher rates—a long-standing finding (e.g., Guarino et al., 2006). However, we found that not to be the case for such teachers in their first-year. After controlling for background factors, beginning teachers who attended more selective undergraduate institutions were not significantly more or less likely to return for a second year of teaching (Model 2) (see Catena 2009 for similar findings).
24
What Are the Effects of Teacher Education and Preparation on Beginning Teacher Attrition?
consortium for policy research in education | cpre.org
In addition, after we controlled for background characteristics, beginning teachers who held an education degree, such as in mathematics education or social studies education, did not differ in their likelihood of attrition from those with a non-education degree, such as in mathematics or history (Model 3). Our interaction variables showed that this was particularly the case for mathematics and science teachers.
Moreover, those who entered through a traditional program were also slightly less likely to leave teaching after their first year (at a 90% level of confidence) than those who entered via a non-traditional or alternative route program (Model 5). Those with less-than-full teaching certificates were no more or less likely to depart after their first year. However, the 19% who had no certificate at all were more likely to leave (Model 6).
Although types of college, degree, certificate, and preparation route often had little bearing on the likelihood of new teachers leaving teaching after 1 year, this was not true for the amount and type of pedagogical preparation they undertook. Pedagogy was strongly related to attrition.
First-year teachers who took more courses in teaching methods and strategies were significantly less likely to depart. For instance, those who took three or four methods courses were 36% less likely to leave than those who took no such courses (Model 7 in Table 4b).
In addition, the amount of prior practice teaching that new teachers had undertaken was strongly related to their attrition. First-year teachers who had a semester (12 weeks or more) of practice teaching prior to their employment were over three times less likely to depart than those who had no practice teaching at all, and those with at least a semester of practice teaching under their belts were also less likely to leave than those who had less than a semester of practice (Model 8). The interaction terms show the latter was especially true for mathematics teachers.
Moreover, having any of the four other types of pedagogical preparation—preparation in how to select and adapt instructional materials, coursework in learning theory or child psychology, observation of others’ classroom teaching, and formal feedback on their own teaching—was significantly and strongly related to whether new teachers left teaching or not (models 9-12). For instance, those whose preparation included observation of others’ classroom teaching were 65% less likely to leave than those who had not had such preparation (Model 11 in Table 4c). Notably, after controlling for their pedagogical preparation, the positive regression estimate for first-year science teachers—indicating higher attrition—decreased by almost half (.4 to .27), suggesting that part of their higher attrition is accounted for by their lower levels of pedagogical preparation. Following up on these significant and strong relationships, below, we further the impact of pedagogy.

25
Results
Pedagogical Preparation Packages and Attrition
As we indicated earlier, the data also revealed that our measures of pedagogical preparation (practice teaching, courses in teaching methods, the four other types of pedagogy) do not exist in isolation as if independent variables. Some new teachers enter having had numerous courses in teaching methods, a full semester of practice teaching, opportunities to observe others’ classroom teaching, and received formal feedback on their own teaching. On the other hand, some new teachers enter having had no courses in teaching methods, no practice teaching, little or no chance to observe other’s classroom teaching, and no formal feedback on their own teaching. How much pedagogical preparation new teachers have acquired is partly a factor of the program or route by which they entered teaching— e.g., either a traditional or alternative route. But we also found large variations in pedagogical preparation both within and between these two types of routes. There were large differences among those coming in through alternative routes in what pedagogy preparation they received, and there was also overlap in the amount of preparation between traditional and alternative routes. For example, 22 percent of those entering through alternative routes had over a semester of practice teaching, over 80 percent had coursework in learning theory, and over 76 percent had coursework in how to select instructional materials. On the other hand, over 10 percent of those entering through traditional routes had less than a month of practice teaching.
This concurrence of pedagogy components is borne out in Model 13 of Table 4c, which estimates the relationships of all of the preparation measures simultaneously in a full model. The attenuation of the size of the pedagogy measure coefficients when all of the variables are modeled simultaneously, making most statistically insignificant, confirms this confounding between related variables. However, the fact that the associations of some of the pedagogy variables were not strong enough to be individually statistically significant in the full models in Table 4c does not mean they have no effect as components, collectively, in packages of preparation activities and experiences.
Table 5: Descriptive Statistics for Preparation Packages
Percentages
Package Non-Math/Science Mathematics Science
Little or No Pedagogy (n = 464) 13 20 28Basic Pedagogy (n = 228) 7 16 10Basic Pedagogy Plus (n = 782) 29 32 17Comprehensive Pedagogy (n = 747) 32 23 18Others (n = 420) 19 9 27
100 100 100

26
What Are the Effects of Teacher Education and Preparation on Beginning Teacher Attrition?
consortium for policy research in education | cpre.org
To more accurately empirically distinguish teachers according to their degree and variety of pedagogical preparation activities, we used a statistical clustering technique to empirically divide the teachers into five groups that received different “packages” of pedagogical preparation:
Package 1: Little or No Pedagogy: This group entered having had at most one course in teaching strategies and methods, little or no practice teaching, and little or none of the four other types of pedagogical preparation (preparation in how to select and adapt instructional materials, coursework in learning theory and child psychology, observation of others’ classroom teaching, and formal feedback on their own teaching). About 15% of first-year teachers received this package.
Package 2: Basic Pedagogy: This group entered having had no courses in teaching strategies and methods, but usually had a full semester of practice teaching, and also had most of the four other types of pedagogical preparation. Less than 10% of first-year teachers received this package.
Package 3: Basic Pedagogy Plus: This group entered having the same pedagogical preparation as Package 2, but with the addition of one to four courses in teaching methods or teaching strategies. Just over 25% of first-year teachers received this package.
Package 4: Comprehensive Pedagogy: This group entered having the same pedagogical preparation as Package 2, but with the addition of five or more courses in teaching methods or teaching strategies. This was the largest group; nearly 33% of first-year teachers received this package.
Package 5: Others: This was a residual and mixed group of teachers who did not fit into the other groups. It does not represent a coherent preparation package. Less than 20% of first-year teachers fell into this cluster.
Consistent with the earlier data (see Figure 2), compared to other teachers, beginning mathematics and science teachers were less likely to have received comprehensive pedagogical preparation. For instance, new mathematics and science teachers were more likely to have received Package 1 (Little or No Pedagogy) and less likely to have received Package 4 (Comprehensive) than other new teachers (see Table 5).
Model 14 in Table 4c shows regression estimates for each of the packages compared with the comprehensive package (omitted category). To illustrate the collective impact of having received these multiple types of pedagogical preparation, we used the Model 14 estimates to calculate the predicted probability for each of these packages, after controlling for other factors. The results showed a very large cumulative relationship between pedagogy and attrition. For instance, those receiving Little or No Pedagogy were 3 times more likely to leave after 1 year as those who received a Comprehensive Pedagogy package (see Figure 4). The predicted probabilities also suggest that some kinds of pedagogy have greater association with retention than others. The

27
Results
largest reductions in attrition in comparison to the Little or No Pedagogy package were associated with the Basic Pedagogy package—this group usually had a full semester of practice teaching and most of the four other types of pedagogy, but had no courses in teaching strategies and methods. Adding more of the latter methods courses, as in the Basic Plus and Comprehensive packages, was associated with much less relative reduction in attrition.
Figure 4. Predicted Probability of Attrition of Beginning Teachers, by Various Pedagogy Packages: 2004-05
0 10 20 30 40 50
Little or No Pedagogy
Basic Pedagogy
Basic Pedagogy Plus
Comprehensive Pedagogy
Percent
24.6
12.3
9.9
9.8
Selection Bias, Education, Preparation, and Teacher Attrition
Statistical analyses such as ours are, of course, subject to selection bias. Relationships found between attrition and our variables of interest could be partly a result of unobserved factors not included in the analyses. Even after controlling for teacher and school background characteristics, the lower attrition of teachers with substantial pedagogical preparation might not be due to the effect of that preparation but rather to teacher-selection effects that influenced the type of preparation received. For instance, it could be the case that those who enroll in a traditional type of preparation program and obtain more pedagogical preparation are also more likely to view teaching as a career, or as an investment, to which they are committed, than those who do not obtain such training and preparation before entering teaching. Moreover, it could also be

28
What Are the Effects of Teacher Education and Preparation on Beginning Teacher Attrition?
consortium for policy research in education | cpre.org
the case that those who acquire an education degree are more committed to teaching simply because they have fewer other career options than those who acquire a non-education degree, such as in mathematics or in one of the science disciplines. Or, in contrast, those entering through alternative routes, or through programs such as Teach for America, may be less likely to view teaching as a career, to which they are committed, regardless of their preparation. Hence, there could be bias in those “selected” into different levels of our variables of preparation. As a result, low attrition of such teachers could be a result not of their levels of preparation, but of their pre-existing degree of commitment to teaching.
It is not possible for us to fully control for such factors, but to further explore these issues we undertook two additional analyses (not displayed here). First, we estimated our same models, with the inclusion of a measure of teachers’ commitment to their jobs. We based job commitment on an item in the SASS questionnaire that asked teachers, at midpoint in the year, how long they plan to remain in teaching. Answer options included: as long as able; until eligible for retirement; will probably continue until something better comes along; definitely plan to leave as soon as possible; and, undecided at this time. Our purpose was to investigate whether pedagogical preparation is still related to attrition, after holding constant how long first-year teachers planned to stay in teaching. As expected, teachers who reported little or no commitment (i.e., they reported they definitely plan to leave as soon as possible) were significantly more likely to leave after 1 year. However, in those models the coefficients for pedagogical preparation measures did not significantly change; they remained strongly related to attrition. In other words, after controlling for whether or not first-year teachers planned to remain in teaching, those with more pedagogical preparation were significantly more likely to continue in teaching.
A second additional analysis we undertook was to estimate our models on a subset of those first-year teachers who had only education degrees; in other words, we dropped those with non-education degrees. Our purpose was to investigate whether pedagogical preparation is related to attrition, even among those ostensibly most committed to staying in teaching—those with only degrees in education. Again, our results did not greatly change. We found that among those with only education degrees, those with more pedagogical preparation continued to be significantly more likely to continue in teaching. For instance, 10% within this group had had no practice teaching before their first year on the job—and our estimates showed teachers among this 10% were almost 3 times as likely to leave after 1 year on the job. These two additional analyses, of course, cannot fully address the issue of selection bias, but they do indicate that our finding that pedagogy is related to attrition is robust.
29
Conclusion and Implications
Conclusion and ImplicationsSome attrition of teachers is, of course, normal, inevitable, and beneficial. For individuals, departures leading to better jobs can be a source of upward mobility. For schools, departures of low-performing employees can enhance organizational outcomes. For the educational system, teacher outflows, such as temporary attrition, or those leaving classroom teaching for other education-related jobs, do not represent a permanent or net loss of human capital to the education system as a whole and can be beneficial to the system. However, none of these types of departures, whether from teaching altogether or to other education jobs, are free of costs. All have the same effect; they typically result in a decrease in classroom instructional staff in that particular organization—staff that usually must be replaced.
In this study, we examined the associations between beginning teachers’ pre-service education and preparation and their attrition —especially in mathematics and science. Our analyses of data show that there are large differences in the types and amounts of education and preparation that teaching candidates receive. Mathematics and science teachers, in particular, were more likely than other teachers to have graduated from highly selective colleges and universities, more likely to hold non-education degrees, and less likely to have entered teaching through a traditional teacher education program or route. On the other hand, while they tended to have more subject-matter education, mathematics teachers and, especially, science teachers tended to have less pedagogical preparation than other teachers. They had completed fewer courses in teaching methods and, particularly for science teachers, had far less practice teaching before entering the teaching job.
Our analysis also showed that these differences in education and preparation were significantly related to the degree to which teachers leave teaching. However, these relationships varied by the type of education and preparation. Interestingly, the type of college, degree, or certificate mattered little. The selectivity of one’s college, the name of one’s degree or certificate, or the label associated with one’s route or program all had small or insignificant relationships with attrition. What did matter was the content and substance of new teachers’ preparation—especially the pedagogical preparation teachers acquired. Those with more pedagogy were far less likely to leave teaching after their first year on the job.
On explanation for our findings on the weak relationships between college selectivity, entry route and attrition could be partly due to the presence of alternative route entrants, such as Teach for America. The latter are often from highly selective institutions, are strong in subject matter, come through alternative routes, but have lower first year attrition because they often meet the program requirement to stay in teaching for at least two years.

30
What Are the Effects of Teacher Education and Preparation on Beginning Teacher Attrition?
consortium for policy research in education | cpre.org
Our general findings are especially pertinent for mathematics and science teachers. The same types of preparation associated with better retention are the same types of preparation that mathematics teachers and, especially, science teachers are less likely to have. This has large implications for policy.
It is widely believed that a key strategy to improve student performance in mathematics and science is to ensure that students are taught by qualified mathematics and science teachers. Our earlier research shows that ensuring that students are taught by qualified math and science teachers is enhanced by improving the retention of mathematics and science teachers (Ingersoll & Perda 2010; Ingersoll & May 2012). In turn, this new study shows that one method to enhance retention is to ensure that new teachers have received basic pedagogical preparation. It is widely held that it is important for mathematics and science teachers to have adequate subject-matter content knowledge. And our research shows that, in fact, mathematics and science teachers are more likely to hold degrees in their academic discipline. But our data suggests it is also important to have adequate preparation in pedagogical methods and skills—the how of teaching—and in these areas of preparation, mathematics and science teachers are disadvantaged.
31
References
ReferencesAdams, G. (1996). Using Cox regression to examine voluntary teacher turnover. Journal of
Experimental Education, 64(3), 267-285.
American Educational Research Association, American Psychological Association, National Council on Measurement in Education. (1999). Standards for educational and psychological testing. Washington, DC: Author.
Ballou, D. (1996). Do public schools hire the best applicants? Quarterly Journal of Economics, 111(1), 97-133.
Borman, G. D., & Dowling, N. M. (2008). Teacher attrition and retention: A meta-analytic and narrative review of the research. Review of Educational Research, 78, 367-409.
Catena, A. (2009). An analysis of career choices among teachers of high academic ability (Unpublished doctoral dissertation). University of Pennsylvania, Philadelphia.
Chandler, K., Luekens, M., Lyter, D., & Fox, E. (2004). Teacher attrition and mobility: Results from the teacher follow-up survey, 2000-01. Washington, DC: National Center for Education Statistics.
Clewell, B., & Villegas, A. M. (2001). Evaluation of the DeWitt-Wallace Reader’s Digest Fund’s Pathways to Teaching Careers Program. Washington, DC: Urban Institute.
Clotfelter, C. T., Ladd, H. F., & Vigdor, J. L. (2010). Teacher credentials and student achievement in high school: A cross-subject analysis with student fixed effects. Human Resources Summer, 45(3), 655-681.
Cochran-Smith, M., & Zeichner, K. M. (2005). Studying teacher education: The report of the AERA Panel on Research and Teacher Education. Mahwah, NJ: Taylor & Francis.
Finn, C., Kanstoroom, M., & Petrilli, M. (1999). The quest for better teachers: Grading the states. Washington, D.C.: Thomas B. Fordham Foundation.
Greenwald, R., Hedges, L., & Laine, R. (1996). The effect of school resources on student achievement. Review of Educational Research, 66, 361-396.
Guarino, C., Santibanez, L., & Daley, G. (2006). Teacher recruitment and retention: A review of the recent empirical literature. Review of Educational Research, 76(1), 173-208.
Hanushek, E., & Rivkin, S. (2004). How to improve the supply of high quality teachers. In D. Ravitch (Ed.), Brookings Papers on Education Policy (pp. 7-44). Washington, DC: Brookings Institution.
Ingersoll, R. (1999). The problem of underqualified teachers in American secondary schools. Educational Researcher, 28(2), 26-37.

32
What Are the Effects of Teacher Education and Preparation on Beginning Teacher Attrition?
consortium for policy research in education | cpre.org
Ingersoll, R. (2001). Teacher turnover and teacher shortages: An organizational analysis. American Educational Research Journal, 38(3), 499-534. http://www.gse.upenn.edu/faculty_research/TeacherTurnoverTeacherShortages-RMI-Fall-2001.pdf
Ingersoll, R. (2004). Four myths about America’s teacher quality problem. In M. Smylie and D. Miretzky (Eds.), Developing the teacher workforce. The 103rd Yearbook of the National Society for the Study of Education (pp. 1-33). Chicago: National Society for the Study of Education. http://www.gse.upenn.edu/faculty_research/docs/FourMyths.pdf
Ingersoll, R., & May, H. (2011). Recruitment, retention and the minority teacher shortage.Philadelphia: Consortium for Policy Research in Education, University of Pennsylvania.
Ingersoll, R., & May, H. (2012). The magnitude, destinations and determinants of mathematics and science teacher turnover. Educational Evaluation and Policy Analysis, 34(4), 435-464.
Ingersoll, R., & Merrill, E. (2013). Seven trends: The transformation of the teaching force. CPRE Report. Philadelphia: Consortium for Policy Research in Education, University of Pennsylvania.
Ingersoll, R. & Perda, D. (2010). Is the supply of mathematics and science teachers sufficient? American Educational Research Journal, 47(3), 563-594.
Ingersoll, R., Perda, D., & May, H. (2014). An analysis of the effects of teacher qualifications on student achievement in the core subjects in Grade 8 using the 2003 NAEP. Manuscript in preparation.
Kane, M. (1994). Validating interpretive arguments for licensure and certification examinations. Evaluation & The Health Professions, 17(2), 133-159.
Kirby, S., Berends, M., & Naftel, S. (1999). The supply and demand of minority teachers in Texas. Educational Evaluation and Policy Analysis, 21(1), 47-66.
Levine, A. (2006). Educating school teachers. New York: The Education Schools Project. Liang, K., & Zeiger, S. (1986). Longitudinal analysis using generalized linear models.
Biometrika, 73, 13–22.
Liu, E., Rosenstein, J., Swann, A., & Khalil, D. (2008). When districts encounter teacher shortages? The challenges of recruiting and retaining math teachers in urban districts. Leadership and Policy in Schools, 7(3), 296-323.
National Center for Education Statistics. (2005). Schools and staffing survey (SASS) and teacher follow-up survey (TFS). Data File. Washington, DC: U.S. Department of Education. http://nces.ed.gov/surveys/SASS
33
References
National Commission on Teaching and America’s Future. (1996). What matters most: Teaching for America’s future. New York: Author.
National Commission on Teaching and America’s Future. (1997). Doing what matters most: Investing in quality teaching. New York: Author.
National Commission on Teaching and America’s Future. (2003). No Dream Denied. New York: Author.
Perda, D. (2013). Transitions into and out of teaching: A longitudinal analysis of early career teacher turnover (Unpublished doctoral dissertation). University of Pennsylvania, Philadelphia.
Raudenbush, S., Fotiu, R., & Cheong, Y. (1999). Synthesizing results from the trial state assessment. Journal of Educational and Behavioral Statistics, 24(4), 413-438.
Raudenbush, S. W., & Bryk, A. S. (2002). Hierarchical linear models: Applications and data analysis methods (2nd ed.). Newbury Park, CA: Sage.
Riordan, J. (2009). Do teacher qualifications matter? A longitudinal study investigating the cumulative effect of NCLB teacher qualifications on the achievement of elementary school children (Unpublished doctoral dissertation). University of Pennsylvania, Philadelphia.
Rivkin, S. (2007). Teacher characteristics, market forces, and distribution of teacher quality among schools and districts [Commissioned paper]. Washington, DC: National Center for Education Statistics.
Strizek, G. A., Pittsonberger, J. L., Riordan, K. E., Lyter, D. M., & Orlofsky, G. F. (2006). Characteristics of schools, districts, teachers, principals, and school libraries in the United States: 2003-04 Schools and Staffing Survey (NCES 2006-13 Revised). Washington, DC: U.S. Department of Education, National Center for Education Statistics.
Walsh, K. (2001). Teacher certification reconsidered. Baltimore: Maryland. The Abell Foundation.
Zumwalt, K., & Craig, E. (2005a). Teachers’ characteristics: Research on the demographic profile. In M. Cochran-Smith and K. M. Zeichner (Eds.), Studying teacher education: The report of the AERA Panel on Research and Teacher Education (pp. 111–156). Mahwah, NJ: Lawrence Erlbaum.
Zumwalt, K., & Craig, E. (2005b). Teachers’ characteristics: Research on the indicators of quality. In M. Cochran-Smith and K. M. Zeichner (Eds.), Studying teacher education: The report of the AERA Panel on Research and Teacher Education (pp. 157–260). Mahwah, NJ: Lawrence Erlbaum.

34
What Are the Effects of Teacher Education and Preparation on Beginning Teacher Attrition?
consortium for policy research in education | cpre.org
Endnotes1 This TFS Teacher Status Questionnaire is administered to school principals a year after the original SASS Teacher Survey questionnaires to collect data on one measure—the current occupational status of all those teachers in the original SASS sample. It asks principals to indicate whether the previously sampled teachers are still teaching in that same school, in another school, have left teaching altogether, and so on. Subsequently, a subsample of stayers and almost all of those teachers reported to have moved or left are administered the TFS questionnaire.
We were able to discern some error by principals in the Teacher Status questionnaire measure in distinguishing between migration (movers) and attrition (leavers). Essentially, school principals tend to over-report the number of leavers because teachers who quit their jobs often do not inform their previous schools that they have moved to another school. However, this measure is quite accurate in identifying who is and isn’t still working at the original school. By comparing individual teacher’s values for the Teacher Status measure from SASS (i.e., the principal’s report) with confirmed final turnover from the TFS (i.e., the teacher’s report), we found the Teacher Status measure was about 93% accurate in distinguishing teachers who had departed from those who had not.
More specifically, the Teacher Status measure from SASS accurately identified 90% of confirmed leavers (i.e., 2,385 out of 2,650) as having left the teaching occupation. However, the Teacher Status measure classified 29% of confirmed movers (i.e., 559 out of 1,911) as having left the teaching occupation, and an additional 1% of confirmed movers (i.e., 18 out of 1,911) as stayers. When no distinction is made between movers and leavers, the Teacher Status measure was 92% sensitive (i.e., 4,471 out of 4,886 teachers identified as departing did, in fact, move from or leave their teaching jobs), and the Teacher Status measure was 96% specific (i.e., 2,442 out of 2,532 teachers identified as not turning over did, in fact, stay in their teaching jobs). This translates to an overall accuracy rate of 93% (i.e., 6,913 out of 7,418).
In our merger of the SASS and TFS measures, we corrected the Teacher Status measure using TFS data by replacing the Teacher Status indicator with the confirmed TFS status indicator for those teachers included in the TFS sample. This results in a final teacher status measure that is approximately 96% accurate (i.e., assuming that the rate of inaccuracies in the Teacher Status data identified by the TFS cross-validation represents the expected rate of inaccuracies for the rest of the SASS sample not included in the TFS). This is calculated by applying the sensitivity and specificity rates above to the uncorrected Teacher Status data (i.e., 40,563 stayers and 3,064 movers/leavers) and assuming 100% accuracy for those teachers included in the TFS data (i.e., 2,864 stayers and 4,565 movers/leavers), we end up with an overall accuracy rate of 96% (i.e., [(40,563 x .96) + (3,064 x .92) + (2,864 x 1.00) + (4,565 x 1.00)] / 51,056 = 0.96).

35
Endnotes
2 The proportion of a school’s student population that is minority is also related to teacher turnover. However, minority enrollment is highly intercorrelated and confounded with poverty enrollment, and since the latter had a stronger relationship to turnover, we did not include the former in our regression analyses. For an analysis of teacher turnover that differentiates these effects, see Ingersoll and May (2011). 3 We exponentiated the coefficients from logistic regression models to produce odds ratios reflecting the relative change in odds associated with a one-unit increase in the predictor variable. For interactions, we calculated odds-ratios by adding coefficients from the main effect and the interaction term for a variable and then exponentiating.4 We exponentiated the coefficients from logistic regression models to produce odds ratios reflecting the relative change in odds associated with a one-unit increase in the predictor variable. For interactions, we calculated odds-ratios by adding coefficients from the main effect and the interaction term for a variable and then exponentiating.

CONSORTIUMforPOLICYRESEARCHinEDUCATIONUniversity of Pennsylvania | Teachers College, Columbia University | Harvard University | Stanford University
University of Michigan | University of Wisconsin-Madison | Northwestern University
cpre.org