class size and teacher effects on student achievement...
TRANSCRIPT

Class size and teacher effects 1
Running head: CLASS SIZE AND TEACHER EFFECTS
Class Size and Teacher Effects on Student Achievement andDropout Rates in University-Level Calculus
Tyler J. Jarvis
Brigham Young University
Class size and teacher effects 2
Abstract
This paper describes two studies of class size effects on achievement and dropout rates in (traditional)calculus at the university level. The first involved one teacher in both a large and a small section ofcalculus. The second included four teachers, each in both large and small sections of calculus. Afteraccounting for other significant factors, we found that class size itself was not a statistically significantfactor. However, individual teachers did vary in their effectiveness in different class sizes. Moreimportantly, the most effective teachers in large sections were more effective than almost all of theremaining teachers in small sections. Some implications for university administration are discussed.

Class size and teacher effects 3
Class Size and Teacher Effects on Student Achievement andDropout Rates in University-Level Calculus
Introduction
It is widely believed by faculty, administrators, and students that university students are betterserved in small classes than in large ones. Indeed, most college ranking and evaluation systems rewardschools with smaller classes by ranking them higher than their counterparts offering large classes (e.g.,U.S. News and World Report Ranking of Colleges and Universities). Yet, schools are generally undersubstantial financial pressure to increase class size. And mathematics service courses (e.g. collegealgebra and calculus) are commonly quite large due to high student demand. It is, therefore, important tohave reliable information about just how much, if any, students are helped by smaller classes in theirstudy of elementary mathematics at the university.
Class size and its effect on students have been researched repeatedly in recent years, but most ofthese studies have focused on elementary and secondary schools rather than on university-level teaching.And very few studies have dealt with mathematics. Yet, Smith and Glass’s meta-analysis (1980) givesevidence that class size effects vary with students' age. And others studies indicate that class size effectsvary with subject matter—even within a discipline (McConnell & Sosin, 1984; Raimondo et al., 1990).This indicates a need for a specific study on the effects of class size in university-level mathematicscourses. This paper begins to treat this need by studying class size effects on achievement and dropoutrates in calculus classes at two large universities.
In a meta-analysis of class-size studies, Glass and Smith (1979; Smith & Glass, 1980) argue thatfor elementary school children the benefit of small classes is a logarithmic function of size, with themarginal benefit of reducing class size being most significant for classes of size 20 and fewer. Moreover,the marginal benefit is very small when classes are larger than 25 or 30 students; that is, there is little, ifany, benefit to reducing class size if the small class has more than 25 or 30 students. Since mostuniversities cannot afford to reduce class size in introductory mathematics courses to much below 30students, Glass and Smith's results, if applicable to university-level instruction, would suggest that little orno benefit would be derived from reducing class sizes from relatively large to “small” classes ofapproximately 30.
Studies of university-level economics and accounting instruction have repeatedly shown little orno significant effect on student achievement from reduced class size (Bellante, 1972; Hill, 1998; Kennedy& Siegfried, 1997). But again, since class size effects vary with subject and discipline, it is important tostudy the effect of class size on student achievement in introductory-level mathematics.
One concern with many available class-size studies is the fact that, although one would expect theeffect of class size to vary substantially with the teacher, few studies account for the teacher effect. Somestudies include just one teacher (e.g., Thompson, 1991). These have the problem that they only show thesignificance of a size effect for the one teacher involved. But for many reasons, one teacher might bemuch less effective in a large class than another is. Other studies (e.g., Williams et al., 1985) includemany teachers, some in large and some in small classes, but without accounting for teacher effects in thestudy. However, one would expect that the effect on student achievement due to variation amongteachers is much larger than any effect due to class size; thus, any model that does not correct for theeffect of different teachers will be unable to accurately identify a class-size effect. Indeed, the studies thatfail to account for teacher effects have a very poor fit between their models and their data.
Of course, student achievement is not the only measure of teaching success. Students' attitudesmay also be important, even if they are achieving more in one type of section (large or small). Studies ofstudents' attitudes in large and small courses give conflicting results. For example, Wood et al. (1974)conclude that student ratings of instructors declined as enrollment increased to 240, but beyond that point,ratings began to improve. But Marsh et al. (1979) found little correlation between class size and students'

Class size and teacher effects 4
attitudes about the course. And Sweeney et al. (1983) found that large economics courses were actuallypreferred over small ones.
Because student evaluations and attitude surveys are relatively unreliable measures and appear tovary widely from class to class, and even from day to day within a class, student dropout rates may be amore objective measure of student attitude. A secondary analysis of the effect of class size on dropoutrates is also included here, but clearly more work remains to be done on the effects of class size onstudent attitudes.
Preliminary Study: University A
Models
The object of the preliminary study, which was performed at a large land-grant institution in thesouthern United States (University A), was to study the effect of class size (S) on the performance ofstudents in a traditional (as opposed to “reformed”) Calculus I course, while adjusting for other importanteffects such as students' general mathematical ability as measured by their ACT score (A), students' sex(G), students' ethnic group (E), teacher (T), and semester (M). Performance was measured principally bya standardized final exam, but we were also interested to see if students' success (as measured by theirgrade) in Calculus II might be differently affected by class size. The following statistical models wereused for analysis of the data.
Model to measure size effects on final exam scores
Let yl(i,j,k) be the score on a standardized final exam of the student l in the class k taught by theteacher j in a class of type i (large if i=1, small if i=0).
Several factors were included that might affect yl(i,j,k). These areSize of the class: S1 := effect of large class on student performance. S0 := effect of small class on studentperformance.Teacher. Tj := effect of teacher j.Sex. Gl(i,j,k) := effect of sex.Ethnic Group. El(i,j,k) := effect of ethnic group.Semester. MK := effect of semester in which the course was taught.There are also potential effects due to interaction between different effects, for example:SGil(j,k) := interaction effect between class size and sex.SEil(j,k) := interaction effect between class size and ethnic group.GTlj(i,k) := interaction effect between sex and teacher.ETlj(i,k) := interaction effect between ethnic group and teacher.Also, there is an adjustment for initial aptitude and preparation, as measured by the ACT score Al andscaled by a linear factor β.
Letting µ be the overall mean, the basic model is
),,(),(),,(),(
),(),,(),,(),,(
... kjiljikkjilijklkjil
kjilijkkjilkjiljikjil
ASGETSE
SGSTMEGTSy
εδβ
µ
++++++
+++++++= (1)
Here δk(i,j) is the random error term associated to each class, and εl(i,j,k) the random error associated to eachstudent.
The initial factors of sex and ethnic group were decided on because other studies have found themto be significant (see, for example, McConnell and Sosin, 1984). It also seemed very likely that the
Class size and teacher effects 5
teacher would have a significant effect on achievement, and so teacher was also included as an initialfactor.
This statistical model is similar to a standard split-plot model, but differs in that we have anadjustment for the covariate (ACT score). The use of the covariate is important to compensate for the factthat various factors beyond our control may affect the types of students enrolled in the different-sizedclasses. For example, the small classes fill up more quickly, leaving those who register late in the largeclasses (this may also partially account for the common perception that large classes are worse). Thecovariate helps to account for these differences.
Model to Measure Calculus I Size Effects on Performance in Calculus II
The preceding model describes the effects of class size on student mastery of the material inCalculus I as measured by the departmental final exam. But it also seemed possible that class size inCalculus I might have a different effect on students' performance in the follow-up course, Calculus II,than it did on performance on the Calculus I final exam. The model we used to test this hypothesis wassimilar to the preceding model, but it used the restricted data set of only those students that continued onto Calculus II. Success in Calculus II was measured using students' final grade in Calculus II, afteradjusting for the additional effect of different teachers for Calculus II and adjusting for the higher orderinteractions that might be associated with this teacher effect.
Although it would be interesting and important to know the effects of large class size onsubsequent enrollment in mathematics, it is probably impossible to draw conclusions about such effectsfrom available data. The difficulty arises because student enrollment in subsequent mathematics courses,especially in Calculus II, is primarily dependent upon program requirements rather than studentpreference.
Preliminary Study Data
In this study, one instructor taught both a large (ca. 90 students) and a small (ca. 35 students)section of introductory calculus in the course of one academic year (1995-6). Eight other instructorstaught small sections, and their data are used to standardize the final exam, in particular to account fordifferences between semesters. Their data also helped identify some changes that needed to be made forthe main study at University B. This set contains data for 293 students.
Conclusions of the Preliminary Study
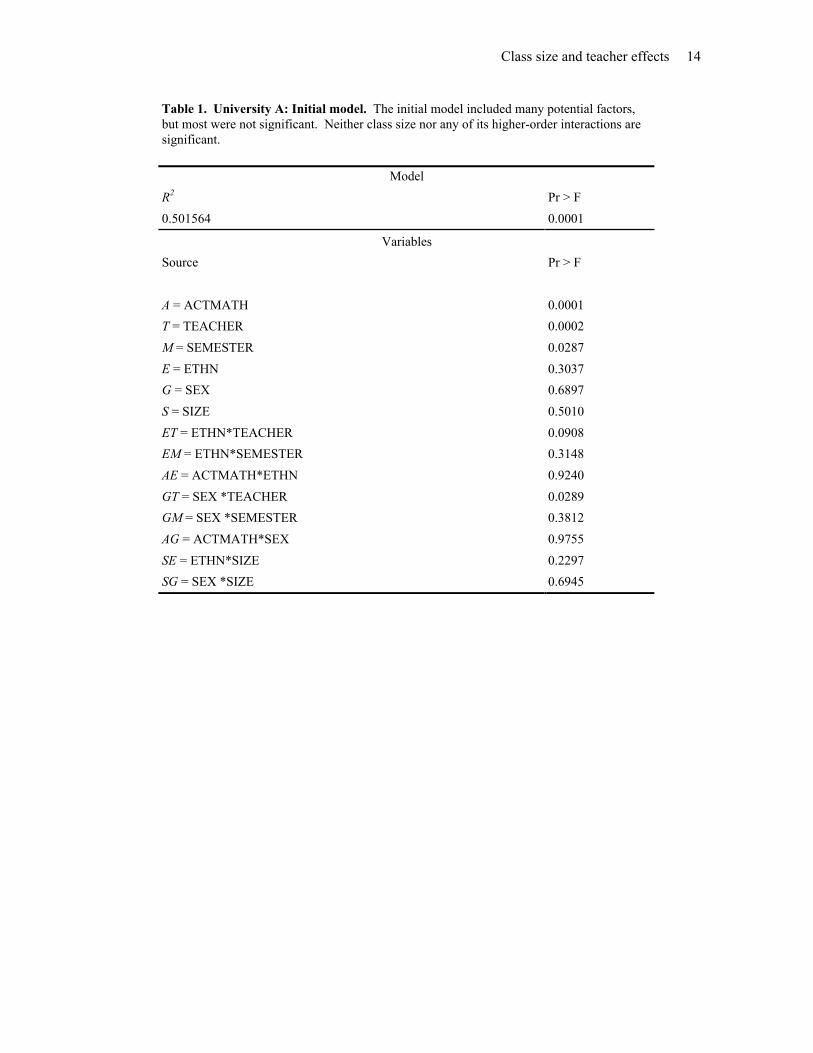
It was impossible to measure the interaction of teacher and class size because only one teachertaught both large and small sections. However, for that one teacher, class size was not statisticallysignificant. The interaction effects of class size with ethnic group and with sex were also not significant.See Tables 1 and 2 for more details.
By far the most significant influences on student performance were initial preparation andaptitude, as measured by the ACT math score, and teacher (although only one teacher taught both largeand small sections, eight others taught small sections). The fact that the teacher would have an effect isnot surprising. But the magnitude of this effect was large compared to all others (except the ACT scores).This seems to indicate that class size effects cannot be effectively measured without carefully adjustingfor teacher. Moreover, the widely varying nature of results of other studies that did not adjust for teachereffect (or which only include one teacher) indicates the potential for a large interaction between size andteacher.
Another large effect was associated with the semester in which the course was taught. This isprobably due to the fact that students who are well-prepared for Calculus I by their high school program

Class size and teacher effects 6
are likely to take Calculus I in the Fall semester of their first year, whereas the remaining students aremore likely to take Calculus I after first taking a semester of prerequisites.
The time of day the courses were offered varied through the regular school day (8 am to 4 pm),but despite some expectations to the contrary, time was not significant. It appears that the covariateaccounted for essentially all variation associated to differences in time of day.
The model measuring the performance of students in the subsequent class, Calculus II, showed noadditional information given by using students' grade in Calculus II to measure performance in Calculus I.In fact, after systematic removal of insignificant factors, the best model for student performance inCalculus II appeared to be one that depends only on teacher of the Calculus II section and the students'score on the Calculus I final. Because tracking students to Calculus II gave no information about studentmastery of Calculus I beyond that given by the final, that aspect was dropped in the main study.
Finally, although the R2 value of .49 for this model was stronger than many that have beenpublished on class size (ranging from R2=.39 in Glass and Smith, 1979, down to R2 =.01 in Williams etal., 1985) it still seemed relatively weak, indicating a need for a better covariate and for inclusion of othersignificant factors.
Implications of the Preliminary Study for the Main Study
The results of the preliminary study indicated several things that were important to change for themain study. First, since teacher effect was so large relative to other effects, and since the teacher-sizeinteraction term was suspected to be large as well, the main study needed several different teachers inboth large and small sections. Second, since the semester effect was significant, whereas the time of daywas not, the teachers should, when possible, teach both small and large sections in the same semester.Third, additional factors needed to be considered and a better covariate used in order to improve themodel.
Main Study: University B
The goal of the main study was to decide if size had a significant effect on student achievement incalculus, and to see if the teacher-size interaction was significant. This study was conducted at a large,private university in the western United States (University B).
Main Study Model
The model used for the main study was similar to the preliminary study, with some additionalfactors considered. These included a pretest as an additional covariate, instead of using just the ACT.We also included age, course load, major college, and total hours earned as factors that might affectstudent achievement. The pretest was included as an additional covariate because a significant number ofstudents had actually studied some calculus before enrolling in the sections included in this study.Although students who had previously taken calculus for university credit could be identified andexcluded from the study, those who had taken calculus in high school could not. The ACT math scoreseemed to be a good measure of general mathematical aptitude, but our pretest was designed to testpreparation specifically relevant to calculus.
We originally expected the ACT and the pretest to be linearly dependent (at least after accountingfor other factors such as students' age). However, a test of this hypothesis showed no significantcorrelation between the ACT math score and the pretest. This is probably because, as explained above,they actually test different things. Consequently, we included both in the model.
Main Study Data

Class size and teacher effects 7
The primary data consist of pretest and final exam scores for 1,984 students in first-semestercalculus and 134 students in second-semester calculus, collected over two years at University B. The dataalso include the various other potential factors described in the previous section that might influencestudent achievement.
The final exam was written by a departmental committee to represent the core topics and skillsthat were considered most important for students to know. This was considered a good measure oflearning since it represented the consensus of a large number of mathematics instructors about whatconstitutes successful (traditional) calculus learning.
For the purposes of this study, small classes are classes with 20-35 students, while large classescontain 150-240 students. Both kinds of classes included review sessions (20-35 students) twice a weekin addition to the main lectures.
Students who had taken the course previously were not included. Students who dropped the classwere also not included, since they did not take the final exam. There was some concern that weakstudents might be more likely to drop from a large section, but a separate logistic regression showed thatfor a given teacher, and after adjusting for pretest scores, students drop essentially randomly.
Calculus I Data
The Calculus I data cover four semesters (Fall and Winter of 1997 and 1998), and 27 teachers.One teacher (Teacher Q) taught both small and large sections in Winter 1997, a different teacher (TeacherL) taught both small and large sections in Fall 1997, a third teacher (Teacher T) taught both small andlarge sections in Winter 1998, and a fourth teacher (Teacher AA) taught both small and large in Fall 1998.Some of these four taught large and small sections in other semesters, but not simultaneously. One otherteacher (Teacher M) taught only large sections, and the remaining teachers taught only small sections.These other teachers are included for purposes of standardizing the pretest and final, and for estimatingthe relative magnitude of the teacher-size effect.
This set contains data for 1,984 students. They are divided into six ethnic groups and 11 majorcolleges (and also the option of an undeclared major).
Calculus II Data
One teacher taught both small and large sections of Calculus II in Fall 1997. The total number ofstudents in the data set (after removing students who dropped or who had taken the course before) is 134.The same demographic data were included here as those included in the Calculus I data set.
Main Study Analysis
Calculus I Analysis
Initially the model considered the potential effects of many factors, as described above. Classsize alone was not significant, nor were most of its higher-order interactions (see Table 3). After astandard, systematic elimination of insignificant variables, the model had as its main factors ACT, pretest,teacher, semester, major college, and the teacher-size interaction. Unlike in the case of University A, atUniversity B the interactions between teacher and ethnicity and between teacher and sex were notsignificant (see Table 4).
Major college is probably significant because those who have aptitudes in mathematics are mostlikely to major in mathematically challenging fields like engineering. But since interest and aptitude arenot easily changed by the university, they are of relatively little interest to teachers and administrators.
The factor that is the most interesting is the (weakly significant) teacher-size interaction term.The fact that size itself was not significant and that this interaction term was weakly significant in the

Class size and teacher effects 8
final model shows that the size effect, if there is any size effect at all, depends primarily uponcharacteristics of each individual teacher.
This final model had an R2 value of .61—a substantial improvement over the preliminary(University A) study.
Calculus II Analysis
Again, a variety of different potential factors were included and then insignificant terms weresystematically eliminated (see Table 5). And again, size was not significant. Teacher-size interactionwas not measurable here, since only one teacher is involved.
Unlike first-semester calculus, student’s age seemed to be a significant factor, as well as astudent's current course load. The appearance of age as a factor may be because many students delaytaking their second semester of calculus, sometimes for several years, whereas most students take theirfirst semester of calculus in their first year. On the other hand, many students with high schoolbackground in calculus will take second-semester calculus immediately in their first year. This gapbetween some but not all students' first and second semesters of calculus seems the most likelyexplanation for the role that students' age plays. The interaction between ACT math score and age maybe significant because students who take second-semester calculus immediately in their freshman yearhave also just recently taken the ACT, whereas others who delay taking second-semester calculus mayhave taken the ACT several years earlier, thus its predictive value will likely vary somewhat with thestudent's age.
The effect of student course load is harder to explain, but a possible explanation would be thatstudents in their first semester at the university will often simply take the recommended general educationcourses (including Calculus I) and the recommended total hours, whereas more experienced students willvary from the norm, perhaps because they think they know better what they want and how to accomplishit. Consequently, course load in the second-semester calculus courses may reflect a student's personalchoices and attitudes toward school work, rather than reflecting the advice of a the university or acounselor.
Major college plays no role in Calculus II, but it is significant in Calculus I. We conjecture thatthis is because many majors require only first-semester calculus, which also fulfills some universitygeneral education requirements, whereas most majors that require second-semester calculus are either inthe College of Engineering or the College of Physical and Mathematical Sciences, which have relativelysimilar coefficients in the first-semester model (see Table 6). Moreover, few students take the course asan elective.
Conclusions of the Main Study
Class size was not significant, and even the teacher-size interaction effect was only weaklysignificant (i.e., significant at p=.05, but not at p=.01). No other interaction terms involving size weresignificant. This suggests that if there is any effect on students' achievement due to class size, it is afunction of the individual teacher and her or his ability and attitude, rather than a function of the sizealone.
The important question to ask about class size is whether it is in the students' and the university'sbest interest to increase or decrease class sizes. The insignificance of size as factor in achievement is,taken alone, not enough to answer that question. In particular, we must ask whether some teachers inlarge classes are more effective than others in small classes. Also, it is important to know if morestudents drop out of large classes, since their data would not be included in the study without final examscores (failing students who did not drop were part of the main study). These two questions are thesubject of the additional analyses described in the next two sections.

Class size and teacher effects 9
Additional analysis—Net Effect of Teacher and Teacher-SizeEffects
In order to decide whether a good teacher in a large section was more effective than otherteachers in small sections, we solved for the (biased) coefficients in the previous Calculus I model.
The results are listed in Table 6. We found that the best teachers in large sections (three of fourwho taught large sections) were better for student achievement than all but four of the remaining 24teachers who taught in small sections.
In particular, teacher Q had an effect of 10.3 and a teacher-size interaction effect of -5.2 for largeclasses, making a total effect of 5.1 to a student's final exam score in teacher Q's large section. Teacher Monly taught large sections, and had an effect of 3.7, and teacher AA had a total effect of 2.62 in largeclasses. However, only four small-section teachers (B=14.1, H=8.8, L=5.4, and O=7.3) had a better effectin their small sections than these three teachers (M, Q, and AA) of large sections. The remaining 20teachers taught only small sections, and they had an effect that ranged from -5.8 up to 2.57. The vastmajority of the students were enrolled in small sections (about 1,300) but only about 120 students wereenrolled in the courses of the most effective small teachers (B, H, L, and O). The remaining 1,180 small-section students would have been better off in the large sections of M, Q, and AA.
Also, note that the teacher-size coefficient for teacher AA is positive—indicating that teacherAA was actually more effective in the large class than the small one. The remaining three teachers of bothlarge and small sections (Q, L, and T) appear to have been slightly more effective in small rather thanlarge sections. In all cases, the teacher-size interaction, if it should be included at all (being only weaklysignificant), is dwarfed by the effect due to teacher alone: the variation due to class size (i.e., thevariation among the teacher-size interaction terms) was only 6.08 compared to a variation of 19.97 due toteachers. This helps explain the widely differing conclusions and the poor fit between model and data inexisting class size studies that do not account for variation due to teacher—any size effects are completelymasked by teacher effects.
Additional Analysis—Dropping out
Some critics of large sections have claimed that students dislike large sections. This seemsdifficult to test carefully, so we ask instead if more students drop out of large sections than small sections.
Drop Model and Analysis
Using a standard logistic regression, we analyze the influence of class size on dropping in bothfirst- and second-semester calculus. For each of the teachers in the University B Calculus I and CalculusII data sets who taught both large and small sections simultaneously, we let Di(j) denote the odds ratio(that is, p/(1-p)) that student i in class j of type k (large or small) will drop the class. Let Pi denote studenti's pretest score, which will be scaled by a linear factor α, and let Sk denote the effect due to being in aclass of type k on the odds ratio of dropping.
For each teacher we compare the two models
),(),( )log( kjijkikkji PSD εδα +++= ,2)
and
),(),( )log( kjijkikji PD εδα ++= ,3)
where δjk is the random error term associated to each class, and εi(j,k) is the random error associated toeach student.

Class size and teacher effects 10
For two of the four Calculus I teachers (teachers Q and AA) the total number of students whodropped was so small, (3 of 183 and 8 of 238, respectively), that no conclusions about dropout rates couldreasonably be drawn from their classes. For both of the remaining two teachers of Calculus I and theteacher of Calculus II, the Wald χ2 indicated that size was not significant in the first model (2), and thevalue of c (a goodness-of-fit test comparable to R2) did not change significantly when size was deleted(model (3)). These results are summarized in Table 7.
As in the case of achievement, the influence of class size on students' dropping appears to besmall or nonexistent. If it is a factor, it probably varies with the teacher, but it appears to be insignificantfor the three teachers involved in this study. However, the goodness-of-fit statistic c in these models isfairly close to .5, which seems to indicate a relatively poor fit, so more studies and a better model areneeded to get a clear answer about the effect of class size on students’ dropping out.
Caveats
The results of all of these studies apply only to the difference between classes of about 30 andclasses of about 90 to 180. It is very possible (and even likely, based on evidence from primary andsecondary schools—see Glass and Smith, 1979) that a significant difference in achievement will existbetween very small classes (ten or fewer students) and those which are small for a university mathematicsclass (20-30 students).
It is also important to remember that, although both the preliminary and the main studies foundno significant effect due to size of the lecture section, all classes in the main study were supplemented bysmall review sessions (held twice weekly). These review sections were all small—about 30 studentseach. In the preliminary study, neither the large nor small sections had associated review sections. Whilethe preliminary study showed no significant effect due to class size even without these small reviewsections, the review sections did appear to be helpful to students in both large and small sections alike, sowithout further research, we cannot recommend replacing small sections by large ones that have nosmaller review sections. It is possible that the size of the review session does have an impact on studentachievement even when the size of the main lecture does not. Indeed, Kennedy and Siegfried (1997) citework of Attiyeh and Lumsden from 1972 which shows some evidence that this is the case in introductoryeconomics classes. Further research in this direction is warranted.
Summary
Our main results are that class size effects on achievement and dropout rates in universitycalculus classes appear to be a function of the teacher only. In particular, averaging over all teachers inthe study, class size had no significant effect on students' achievement on the final exam in calculus.However, some teachers are substantially less effective in a large class than other teachers are, and someteachers are more effective in a large class than in a small one. More significant is the conclusion of thesecond analysis, comparing the relative effectiveness of different teachers; namely, three teachers of largesections were more effective than all but four of 24 teachers of small sections. Consequently, value added(in terms of student achievement on the final exam) was generally greater in the large sections with thesemore-effective teachers than it was in the small ones with the less-effective teachers.
Final Conclusions
More careful studies on the effects of class size versus teacher effect are warranted. The workdescribed in this paper is the only study to date on the effects of class size in mathematics classes at theuniversity level, despite the fact that research shows class size effects vary depending on discipline andstudents' age. This study is also one of the few carefully designed studies on effects of class size at the

Class size and teacher effects 11
university level in any subject. Despite the enormous, well-demonstrated effect of teacher onachievement, few studies even attempt to correct for teacher effects, let alone attempt to design anexperiment explicitly controlling for teacher, as done here. Similarly, despite the many reasons thatstudents of a given background and ability might tend to enroll in a larger or a smaller section, thusskewing results, very few studies of class size attempt to control for or account for this phenomenon, aswe have done here with the pretest and ACT scores. This lack is especially pronounced in studies at theuniversity level, and even more so among those studies that also control for teacher effects.
This study shows that teacher effects probably dwarf all other effects, but a study with moreteachers and more sections would be very valuable. Unfortunately, logistic and political barriers make itdifficult to conduct a larger study. Since both large and small sections’ being offered in the samesemester requires large numbers of students, and because the number of faculty both available and willingto teach both small and large sections of calculus in the same semester is relatively limited, even at a largeuniversity like University B, no larger study than this one is likely to be conducted at a single university.Any study involving more teachers will probably require cooperation from faculty and administrators atseveral universities to ensure, among other things, a common syllabus, pretest and final exam, andappropriate scheduling of instructors in both large and small sections. Thus, university faculty andadministrators must understand the importance of settling this question of class size effects and cooperatein such studies.
If, as this and other smaller studies seem to indicate, the individual teacher has a major effect, andclass size is an insignificant factor, both in terms of student achievement and in terms of students'likelihood to complete the course, then even if a university can afford to offer calculus in small sectionswith first-rate teachers, it still may not be the university’s best strategy. One of those teachers may wellbe more effective in a large class than most or all of the others in a small class; therefore, students mightbe better served in the large section than in most or all of the small ones. At most universities, however,small classes are achieved only by hiring adjuncts, graduate students, and less-qualified faculty. In such acase, reducing class size may be doing students a disservice while simultaneously increasing instructioncosts.
References
Bellante, D. M. (1972). A summary report on student performance in mass lecture classes of economics.Journal of Economic Education, 4(1):53-54.
Glass, G. V. and Smith, M. L. (1979). Meta-analysis of research on class size and achievement.Educational Evaluation and Policy Analysis, 1:2-16.
Hill, M. C. (1998). Class size and student performance in introductory accounting courses: Furtherevidence. Issues in Accounting Education, 13(1):47-64.
Kennedy, P. E. and Siegfried, J. J. (1997). Class size and achievement in introductory economics:evidence from the TUCE III data. Economics of Education Review, 16(4):385-94.
Marsh, H. W., Overall, J. U., and Kesler, S. (1979). Class size, students' evaluations, and instructionaleffectiveness. American Educational Research Journal, 16:57-70.
McConnell, C. R. and Sosin, K. (1984). Some determinants of student attitudes toward large classes.Journal of Economic Education, 15(3):181-90.
Raimondo, H. J., Esposito, L., and Gershenberg, I. (1990). Introductory class size and studentperformance in intermediate theory courses. Journal of Economic Education, 21(4):369-381.
Smith, M. L. and Glass, G. V. (1980). Meta-analysis of research on class size and its relationship toattitudes and instruction. American Educational Research Journal, 17(4):419-33.

Class size and teacher effects 12
Sweeney, M. J. B., Siegfried, J. J., Raymond, J. E., and Wilkinson, J. T. (1983). The structure of theintroductory economics course in united states colleges. Journal of Economic Education,14(4):68-75.
Thompson, P. A. (1991). The effect of section size on student performance in a statistics course. Collegestudent journal, 25:388-395.
Williams, D. D., Cook, P. F., Quinn, B., and Jensen, R. P. (1985). University class size: Is smaller better.Research in Higher Education, 23(3):307-18.
Wood, K., Linsky, A. S., and Straus, M. A. (1974). Class size and student evaluations of faculty. Journalof Higher Education, 45:524-34.

Class size and teacher effects 13
Author Note
This research supported in part by NSF grant DMS-9501617. I am grateful to GovindaWeerakody and David Whiting for help with the statistical models, and to Ralph Brown, Bruce Collings,Tamara Cooper, Missie Elkins, Pedro Geoffrey, Donald Jarvis, Matt Johnson, and KrishnaswamyVenkata for helpful discussions.
Correspondence concerning this article should be addressed to Tyler J. Jarvis, Department ofMathematics, Brigham Young University, Provo, UT 84602. Electronic mail may be sent [email protected]
Class size and teacher effects 14
Table 1. University A: Initial model. The initial model included many potential factors,but most were not significant. Neither class size nor any of its higher-order interactions aresignificant.
Model
R2 Pr > F
0.501564 0.0001
Variables
Source Pr > F
A = ACTMATH 0.0001
T = TEACHER 0.0002
M = SEMESTER 0.0287
E = ETHN 0.3037
G = SEX 0.6897
S = SIZE 0.5010
ET = ETHN*TEACHER 0.0908
EM = ETHN*SEMESTER 0.3148
AE = ACTMATH*ETHN 0.9240
GT = SEX *TEACHER 0.0289
GM = SEX *SEMESTER 0.3812
AG = ACTMATH*SEX 0.9755
SE = ETHN*SIZE 0.2297
SG = SEX *SIZE 0.6945

Class size and teacher effects 15
Table 2: University A: Final Model This model is the result of systematic elimination of the insignificant variables.Note that ethnic group and sex are not significant themselves, but only in their interaction terms with teacher. Thatcoincides with the intuition that sex and ethnicity themselves do not play a role in achievement, but the way the teacherresponds to them does.
Model
R2 Pr > F
0.490446 0.0001
Variables
Source Pr > F
TEACHER 0.0001
ACTMATH 0.0001
SEMESTER 0.0276
ETHN 0.2957
SEX 0.6877
ETHN*TEACHER 0.0796
SEX *TEACHER 0.0306

Class size and teacher effects 16
Table 3: University B: Calculus I. Initial model. The initial model included a large number of potential factors,including total hours of credit the student had earned (THOURS), student's age (AGE), ethnic group (ETHN),sex (SEX), current course load (LOAD), and major college (MAJCOLL). Most of these were not significant andwere systematically removed.
Model
R2 Pr > F
0.641257 0.0001
Variables
Source Pr > F
SEMESTER 0.0001
ACTMATH 0.0001
PRETEST*SEMESTER 0.0001
TEACHER 0.0001
LOAD 0.0572
AGE 0.0161
AGE*AGE 0.0074
MAJCOLL 0.0292
SEX 0.9126
ETHN 0.5431
SIZE 0.1204
THOURS 0.7504
THOURS*THOURS 0.3043
TEACHER*SEX 0.9633
ACTMATH*AGE 0.0589
LOAD*MAJCOLL 0.4501
LOAD*LOAD 0.2868
SIZE*SEX 0.4114
SIZE*ETHN 0.4553
TEACHER*SIZE 0.1491
TEACHER*ETHN 0.4676
SEMESTER*TEACHER 0.0091
AGE*THOURS 0.4642

Class size and teacher effects 17
Table 4: University B: Calculus I. The final model, developed by systematic elimination of insignificant variables(including class size), shows that class size itself is not a significant factor, but the teacher-size interaction term mightbe significant.
Model
R2 Pr > F
0.612772 0.0001
Variables
Source Pr > F
SEMESTER 0.0001
ACTMATH 0.0001
TEACHER 0.0001
PRETEST 0.0001
MAJCOLL 0.0265
TEACHER*SIZE 0.0475

Class size and teacher effects 18
Table 5: University B: Calculus II. This model, developed by systematic elimination of insignificant variables,shows that class size is not significant for this particular teacher.
Model
R2 Pr > F
0.452498 0.0001
Variables
Source Pr > F
ACTMATH 0.0131
PRETEST 0.0001
SIZE 0.6948
LOAD 0.0014
AGE 0.0238
ACTMATH*AGE 0.0255

Class size and teacher effects 19

Class size and teacher effects 20
Table 6. University B: Calculus I. Estimated coefficients (biased) for the University B Calculus I model.
Parameter Estimate Parameter Estimate
INTERCEPT 10.34158770 TEACHER
ACTMATH 1.81378293 Teacher A 2.97328398
PRETEST 0.28145443 Teacher B 14.14475384
Teacher C -2.84780267
SEMESTER Teacher D -5.83704943
1997 Winter -22.81697752 Teacher E -1.72930695
1997 Fall -30.78852062 Teacher F 1.42747917
1998 Winter -31.56136904 Teacher G 2.36437273
1998 Fall 0.00000000 Teacher H 8.75866094
Teacher I 1.99462535
MAJOR COLLEGE Teacher J -1.34914128
Art 1.06288729 Teacher K 1.36048855
Biology 3.09426616 (large and small) Teacher L 5.36603618
Business 1.70441351 (large only) Teacher M 3.67414925
Education -1.64708684 Teacher N -3.54302678
Engineering 0.95833944 Teacher O 7.33831105
Family science -8.03393284 Teacher P -4.96070232
Health/PE 0.72086673 (large and small) Teacher Q 10.34994654
Humanities 2.41684870 Teacher R 0.41012342
Nursing 1.55783270 Teacher S 2.57185348
Phys. & math. science 2.44752224 (large and small) Teacher T 1.01064676
Social science -0.36290885 Teacher U -0.05621085
Undeclared 0.00000000 Teacher V -0.53756900
Teacher W -0.65055273
TEACHER*SIZE Teacher X -4.58577073
Teacher L large -6.08437615 Teacher Y -0.33776313
Teacher L small 0.00000000 Teacher Z 1.50086908
Teacher Q large -5.25948571 (large and small) Teacher AA 0.00000000
Teacher Q small 0.00000000
Teacher T large -3.17380207
Teacher T small 0.00000000
Teacher AA large 2.61853700
Teacher AA small 0.00000000

Class size and teacher effects 21
Table 7. Dropout rates: Logistic regression to evaluate the effect of size on a student's likelihoodof dropping the class shows that there is no significant effect due to class size for these teachers.
Calculus I Teacher L Winter 1998 Calculus I Teacher T Fall 1997 Calculus II
218 students 21 dropped 257 students 82 dropped 170 students 36 dropped
With size (Equation (2)) With size (Equation (2)) With size (Equation (2))
Variable Pr > Wald χ2 Variable Pr > Wald χ2 Variable Pr > Wald χ2
INTERCPT 0.0061 INTERCPT 0.0999 INTERCPT 0.4633
SIZE 0.5187 SIZE 0.2835 SIZE 0.5509
PRETEST 0.0001 PRETEST 0.4654 PRETEST 0.0036
c= 0.664 c = 0.587 c= 0.654
Without size (Equation (3)) Without size (Equation (3)) Without size (Equation (3))
Variable Pr > Wald χ2 Variable Pr > Wald χ2 Variable Pr > Wald χ2
INTERCPT 0.0004 INTERCPT 0.0976 INTERCPT 0.2871
PRETEST 0.0001 PRETEST 0.4179 PRETEST 0.0038
c = 0.658 c = 0.541 c = 0.652

Class size and teacher effects 22