wetting at polymer surfaces and interfaces · wetting at polymer surfaces and interfaces ......
TRANSCRIPT

Wetting at polymer surfaces and interfaces
Mark Geoghegana,*, Georg Krauschb
aDepartment of Physics and Astronomy, University of Sheffield, Hounsfield Road, Sheffield S3 7RH, UKbLehrstuhl fur Physikalische Chemie II, Bayreuther Institut fur Kolloid- und Grenzflachenforschung (BZKG), Universitat Bayreuth,
D-95440 Bayreuth, Germany
Received 4 February 2002; revised 2 August 2002; accepted 3 August 2002
Abstract
Experimental research on wetting in polymer films is a subject that is reaching maturity. We review progress from the past
few years in research into the influence of a boundary in polymer blends, concentrating largely on the wetting transition, and the
growth of wetting layers, where we pay particular attention to blends in which hydrodynamic flow plays a dominant role. A
summary of work over the same period concerning the dewetting of polymer films is also included, along with a discussion of
the role of pattern formation caused by dewetting and topographically and chemically patterned substrates. We conclude by
summarising some experiments that we believe may inspire future research. q 2002 Elsevier Science Ltd. All rights reserved.
Keywords: Polymer films; Wetting; Dewetting; Pattern formation; Polymer blends; Wetting transition
Contents
1. Introduction . . . . . . . . . . . . . . . . . . . . . . . . . . . . . . . . . . . . . . . . . . . . . . . . . . . . . . . . . . . . . . . . . . . 262
2. Experimental techniques . . . . . . . . . . . . . . . . . . . . . . . . . . . . . . . . . . . . . . . . . . . . . . . . . . . . . . . . . . 264
2.1. Depth profiling techniques . . . . . . . . . . . . . . . . . . . . . . . . . . . . . . . . . . . . . . . . . . . . . . . . . . . . 264
2.2. Microscopy techniques . . . . . . . . . . . . . . . . . . . . . . . . . . . . . . . . . . . . . . . . . . . . . . . . . . . . . . . 265
3. Polymer blends. . . . . . . . . . . . . . . . . . . . . . . . . . . . . . . . . . . . . . . . . . . . . . . . . . . . . . . . . . . . . . . . . 266
3.1. A brief historical introduction. . . . . . . . . . . . . . . . . . . . . . . . . . . . . . . . . . . . . . . . . . . . . . . . . . 266
3.2. Wetting transition . . . . . . . . . . . . . . . . . . . . . . . . . . . . . . . . . . . . . . . . . . . . . . . . . . . . . . . . . . 267
3.2.1. Experimental tests . . . . . . . . . . . . . . . . . . . . . . . . . . . . . . . . . . . . . . . . . . . . . . . . . . . . 267
3.3. Other polymer blend film depth profiling experiments . . . . . . . . . . . . . . . . . . . . . . . . . . . . . . . . 269
3.3.1. Kinetics of wetting layer growth . . . . . . . . . . . . . . . . . . . . . . . . . . . . . . . . . . . . . . . . . . 269
3.3.2. The approach to phase separation . . . . . . . . . . . . . . . . . . . . . . . . . . . . . . . . . . . . . . . . . 272
3.3.3. Hydrodynamic flow . . . . . . . . . . . . . . . . . . . . . . . . . . . . . . . . . . . . . . . . . . . . . . . . . . . 273
3.3.4. Surface segregation . . . . . . . . . . . . . . . . . . . . . . . . . . . . . . . . . . . . . . . . . . . . . . . . . . . 277
3.3.5. Variation of the segregated component . . . . . . . . . . . . . . . . . . . . . . . . . . . . . . . . . . . . . 278
3.4. Morphology of surface induced phase separation . . . . . . . . . . . . . . . . . . . . . . . . . . . . . . . . . . . . 279
3.5. Semi-conducting polymers . . . . . . . . . . . . . . . . . . . . . . . . . . . . . . . . . . . . . . . . . . . . . . . . . . . . 281
4. Spreading and dewetting . . . . . . . . . . . . . . . . . . . . . . . . . . . . . . . . . . . . . . . . . . . . . . . . . . . . . . . . . . 284
4.1. Spreading . . . . . . . . . . . . . . . . . . . . . . . . . . . . . . . . . . . . . . . . . . . . . . . . . . . . . . . . . . . . . . . . 284
4.2. Dewetting . . . . . . . . . . . . . . . . . . . . . . . . . . . . . . . . . . . . . . . . . . . . . . . . . . . . . . . . . . . . . . . . 284
4.2.1. Spinodal dewetting . . . . . . . . . . . . . . . . . . . . . . . . . . . . . . . . . . . . . . . . . . . . . . . . . . . . 284
4.2.2. Nucleation and growth . . . . . . . . . . . . . . . . . . . . . . . . . . . . . . . . . . . . . . . . . . . . . . . . . 287
4.2.3. Autophobicity . . . . . . . . . . . . . . . . . . . . . . . . . . . . . . . . . . . . . . . . . . . . . . . . . . . . . . . 287
4.2.4. Other forms of dewetting . . . . . . . . . . . . . . . . . . . . . . . . . . . . . . . . . . . . . . . . . . . . . . . 288
0079-6700/03/$ - see front matter q 2002 Elsevier Science Ltd. All rights reserved.
PII: S0 07 9 -6 70 0 (0 2) 00 0 80 -1
Prog. Polym. Sci. 28 (2003) 261–302
www.elsevier.com/locate/ppolysci
* Corresponding author.
E-mail addresses: [email protected] (M. Geoghegan), [email protected] (G. Krausch).

5. Pattern formation by structured substrates . . . . . . . . . . . . . . . . . . . . . . . . . . . . . . . . . . . . . . . . . . . . . 289
6. Outlook and conclusions . . . . . . . . . . . . . . . . . . . . . . . . . . . . . . . . . . . . . . . . . . . . . . . . . . . . . . . . . . 292
Acknowledgements . . . . . . . . . . . . . . . . . . . . . . . . . . . . . . . . . . . . . . . . . . . . . . . . . . . . . . . . . . . . . . . . 293
Appendix A. Mean-field theory of wetting. . . . . . . . . . . . . . . . . . . . . . . . . . . . . . . . . . . . . . . . . . . . . . . . 293
A.1. Theory of the wetting transition . . . . . . . . . . . . . . . . . . . . . . . . . . . . . . . . . . . . . . . . . . . . . . . . 293
A.2. The approach to wetting . . . . . . . . . . . . . . . . . . . . . . . . . . . . . . . . . . . . . . . . . . . . . . . . . . . . . . 294
A.3. Surface segregation . . . . . . . . . . . . . . . . . . . . . . . . . . . . . . . . . . . . . . . . . . . . . . . . . . . . . . . . . 295
References . . . . . . . . . . . . . . . . . . . . . . . . . . . . . . . . . . . . . . . . . . . . . . . . . . . . . . . . . . . . . . . . . . . . . . . 295
1. Introduction
The study of wetting phenomena at polymer surfaces and
interfaces is a rapidly maturing subject since the first
quantitative studies of surface segregation at the end of
1980s [1,2]. The wetting behaviour of thin polymer films is
of great importance not only because of the applications of
polymers for various industrial uses but also because of the
importance of polymers as model systems to test mean field
theories. Industrially, issues of wetting are clearly important
in coatings. Indeed, wherever a stable film is necessary an
understanding of wetting is required. The factors determin-
ing film stability, i.e. ensuring that the polymer wets the
surface, require that the opposite phenomenon (dewetting)
be also well understood. Wetting is also relevant for the
study of pattern formation and other aspects of soft
lithography. Finally, wetting phenomena are of interest in
the rapidly growing field of biophysics. Here, applications
range from the issue of biocompatibility, to the need for
‘smart’ surfaces that are capable of responding to the
properties of the surrounding medium such as pH, ion
concentration, or temperature.
Aside from its technological relevance, wetting
behaviour at polymer surfaces and interfaces has proven
to be important for the understanding of mean field
theories of wetting in general. This is due to the variable
length of polymer chains, the relatively small density
fluctuations, and the relatively slow motion of the long
chain molecules. Although the respective theories are
generally not limited to polymers, polymer physics often
offers the best test of the theory. A good example along
this line is the theory of spinodal decomposition [3],
which was developed to describe phase-separation
processes in binary metal alloys. Very convincing
observations of the early stages of phase separation
have been described for polymeric systems [4], due to
the possibility of observing the kinetics over longer time
scales. Another benefit of working with polymers is that
the size of the individual chains, typically a few
nanometres in length, can be tailored by altering the
molecular weight. In terms of wetting phenomena, this
was well exemplified by the observation of surface-
directed spinodal decomposition in polymer blends [5].
Here, phase separation does not proceed isotropically as
it would like to in the bulk but is directed by the surface,
and a layered structure is observed with a phase of the
lower surface energy wetting the surface, with the second
component forming a sub-layer below the surface. In the
absence of thermal noise, the layered structure would
proceed deep into the film. As it is, the layering is
eventually broken up by thermal noise. Altering the
molecular weight enables one to alter the miscibility of
the mixture by adjusting the entropy of mixing, but
without changing any thermodynamic parameters, and
this has enabled a study of wetting as a function of
miscibility [6].
The purpose of this review is to consider recent
developments in wetting phenomena at surfaces. There
have been several other reviews on this and related subjects
that may be of interest to the reader. For example, earlier
experiments on wetting in polymer films are reviewed in
detail by Krausch [7]. We shall also not give too much
consideration to segregation and wetting phenomena at
buried interfaces because this has been more than
adequately covered in a recent review by Budkowski [8].
An earlier review by Stamm may also be of interest here [9].
Stamm covers work on polymer interfaces but devotes most
of his review to the techniques available for their study. For
an overview of the relevant and important theory, the
interested reader is advised to consult the review by de
Gennes [10], which, though not recent, still contains much
to recommend it. A later discussion of various theories and
theoretical methods by Binder [11] is particularly useful
because it compares experiment and theory from a
theoretician’s perspective. A discussion of the role of
Monte Carlo simulations and self-consistent field theory in
the structure of thin polymer blend films has recently been
published [12]. On a related subject, Puri and Frisch
published a shorter review concerning modelling in phase
separating systems [13]. We exclude here most of the recent
results on block copolymer thin films, which have been
reviewed both by Krausch [7] and more recently by Fasolka
and Mayes [14]. The science underpinning much of the
research in this review is covered in the book by Jones and
Richards [15].
The rest of the paper is organised as follows. We first
discuss the progress that has been made in the work on
wetting of the surface from one component of a polymer
blend before we consider the complementary effects of
spreading and dewetting. We conclude our review with a
M. Geoghegan, G. Krausch / Prog. Polym. Sci. 28 (2003) 261–302262

Nomenclature
AH Hamaker constant
a polymer segmental length
b Flory–Huggins lattice parameter
D diffusion coefficient
d- deuterated-
Df0 energy cost in having different surface composition from bulk
FReS forward recoil spectrometry
F8BT poly(9,90-dioctylfluorene-alt-benzothiadiazole)
G Gibbs free energy
Gbulk Flory–Huggins free energy of mixing of a polymer blend
DGsurface surface contribution to Gibbs free energy
g ‘squared gradient’ term in the free energy of a polymer blend
h- protonated- (non-deuterated)
ITO indium tin oxide
kB Boltzmann’s constant
L layer, film thickness
l size of prewetting layer
ld,SAM size of layer at SAM interface
LED light emitting diode
LE-FReS low energy forward recoil spectrometry
Mw molecular weight
N, NA, NB chain length (number of segments), and length of polymers A and B
NEXAFS near edge X-ray absorption fine structure
NR neutron reflectometry
NRA nuclear reaction analysis
PB polybutadiene
PCL poly(1-caprolactone)
PEDOT poly(3,4-ethylene dioxythiophene)
PEO poly(ethylene oxide)
PEP poly(ethylene propylene)
PFB poly(9,90-dioctylfluorene-alt-bis-N,N0-(4-butylphenyl)-bis-N,N0-phenyl-1,4-phenylenediamine)
PFO poly(9,90-dioctylfluorene)
PI polyisoprene
PMMA poly(methyl methacrylate)
PS polystyrene
PSS poly(4-styrene sulphonic acid)
PSxBrS12x poly(styrene-co-bromostyrene)
PtBMA poly(tert-butyl methacrylate)
PVDF poly(vinylidene fluoride)
PVME poly(vinyl methyl ether)
PVP poly(2-vinyl pyridine)
PaMS poly(a-methyl styrene)
Rg polymer radius of gyration
S spreading coefficient
s surface interaction parameter
SAM self-assembled monolayer
SAN poly(styrene-co-acrylonitrile)
SBS polystyrene-block-polybutadiene-block-polystyrene
SEM scanning electron microscopy
SIMS secondary ion mass spectrometry
SFM scanning force microscopy
SNOM scanning near-field optical microscopy
M. Geoghegan, G. Krausch / Prog. Polym. Sci. 28 (2003) 261–302 263

discussion of the present situation of wetting as a mean to
obtain pattern formation on structured substrates, before
briefly discussing the areas that we believe will contribute
significantly in the years to come.
2. Experimental techniques
Although we do not wish to provide a comprehensive
review of the experimental techniques available for the
study of wetting in polymer films, it is necessary to briefly
describe some of the more important techniques in order to
aid the following discussion. There are two classes of
techniques that are relevant: depth profiling techniques and
different forms of microscopy, which provide information
on the lateral distribution of material. Several techniques,
such as infrared experiments, that are not discussed here
may also be relevant in certain experimental situations, and
we refer the reader to the review by Stamm [9] for a fuller
list and description of the techniques of interest. Many of the
techniques described below are covered in more detail in the
earlier review by Krausch [7], as well as the more specific
reviews for the individual techniques cited below.
2.1. Depth profiling techniques
Depth profiling is used to determine the composition of
one or more components of a film as a function of depth (i.e.
in the direction perpendicular to the film’s surface). In
general these techniques are not particularly useful at
providing lateral information on the composition of films
but there is progress being made in this area. Ion scattering
techniques and reflection experiments are the primary tools
used for depth profiling.
Depth profiling is particularly important, when one
requires information on the wetting properties of multi-
component polymer mixtures. These mixtures are often
unstable, and the component with the lower surface energy
will segregate preferentially to the surface. However,
whether or not this segregation corresponds to a wetting
layer can only be determined by knowing the composition
profile as a function of depth. The same applies to the
wetting of a buried interface, e.g. a substrate, from a
polymer mixture. One way of tackling such problems is to
t time
T absolute temperature
tav average thickness of polymer film on topographically rough substrate
TEM transmission electron microscopy
ToF time of flight
tpeak smallest thickness of polymer film on topographically rough substrate
WvdW energy due to van der Waals interactions
x distance, film thickness
XPS X-ray photoelectron spectroscopy
z depth
z p surface excess
x Flory–Huggins interaction parameter
xs Flory–Huggins interaction parameter evaluated on the spinodal
Dg surface energy (tension) difference
Dma;1 ›G=›f; evaluated at f ¼ fa or f1
1 quench depth
g, gA, gB, gAB surface energy (polymer film surface, substrate surface, film–substrate interface)
G molecular surface excess
F surface energy
f volume fraction
fs surface volume fraction
f1 and fd bulk and depletion layer volume fractions
fa; fb lower and upper coexistence volume fractions
l characteristic wavelength of dewetting or phase separation
m, ms, m1 chemical potential, surface chemical potential, surface chemical potential difference
QA, QB contact angles for a film A dewetting a deformable substrate, B
r density
s surface free energy
j bulk correlation length
z thickness of surface segregated/wetting layer
M. Geoghegan, G. Krausch / Prog. Polym. Sci. 28 (2003) 261–302264

etch away at the film, and taking measurements as the
below-surface region is revealed, layer by layer. This is the
principle behind dynamic secondary ion mass spectrometry
(dynamic SIMS) [16]. With this technique a beam of ions,
typically O2þ or Arþ, etches the film, and the emitted
fragments are analysed with a mass spectrometer. For
known etching rates, it is possible to reveal a detailed profile
of the composition of most elements in the film as a function
of depth. SIMS can also be used in scanning and dynamic
modes to obtain three-dimensional images, with a lateral
resolution down to between 0.1 and 1 mm, either by
scanning the image at each etching step [17], or by using
an ion microscope [18].
Another method of direct depth profiling is MeV ion
beam scattering [19,20]. Here, a beam of ions, produced by a
van de Graaff or other accelerator is incident on the sample.
These ions are scattered at the surface, or within the sample,
and the particles emitted from nuclear reactions or
fragments from collisions are detected. Scattering within
the sample is due to collisions with the electron clouds,
which act to reduce the incident energy of the ion. Such
techniques can be used for depth profiling because the
energy of the detected particles depends primarily on
the energy of the incident particles, which, because of the
inelastic collisions, in turn depends on the depth in the
sample at which the scattering event took place.
Three MeV ion beam techniques are of particular
importance and are worth mentioning separately. The first
of these is Rutherford backscattering. An ion beam, usually
of 4Heþþ , is backscattered by collisions with heavier
elements in the sample. In wetting experiments, the
technique is rarely used because of the need for a heavy
element not usually found in polymer systems, although a
form of contrast can be introduced by selectively staining
one component of a mixture [21].
The ion beam technique with historically the greatest
impact has probably been forward recoil spectrometry
(FReS) [19,22], also referred to as elastic recoil detection
analysis. Here, a 4Heþþ beam scatters deuterium and
hydrogen in the sample, which can both be detected in the
forward scattering direction. With care a depth profile can
be built up for both hydrogenated and deuterated com-
ponents in a blend. Data accumulation in this technique is
particularly rapid, but there have also been several
developments of this technique to improve the depth
resolution which is typically ,80 nm depending on the
angle of incidence of the beam to the sample, such as
the optimisation of energy (LE- or low energy FReS [23]),
the use of a time-of-flight (ToF) apparatus [24], or the use of
different ions [25,26] instead of 4Heþþ . However, each of
these techniques has its drawbacks and, although not
impossible, resolutions of better than ,10 nm are difficult
to achieve.
The final ion beam technique worth mentioning is 3He
nuclear reaction analysis (NRA) [27,28]. Here, 3Heþþ ions
undergo a nuclear reaction with deuterons in the sample to
give off a-particles and protons. Either of these can be
detected, and their energy corresponds to the depth in the
sample at which the reaction took place. As with FReS
therefore, deuterium is used for contrast but the experimen-
tal arrangement is quite simple and a resolution of better
than 20 nm can be routinely obtained.
The depth profiling techniques mentioned above obtain
information about the composition in real space. By
contrast, methods such as X-ray [29] and neutron reflecto-
metry (NR) [29–31] offer depth information in reciprocal or
momentum space. In these techniques, neutrons or X-rays
are reflected from the sample, and the reflected radiation is
detected as a function of the incident beam intensity. As
with light, the amount reflected is dependent on the
refractive index of the medium (we do not talk of a neutron
refractive index, but rather the scattering length density of a
material). The de Broglie wavelength of neutrons, cooled to
a temperature of a little over 20 K by a liquid hydrogen
moderator, is of the order of a few Angstroms, and similar to
that of X-rays. As a result, these techniques reveal
information on much shorter length scales compared to
those of the real-space depth profiling techniques discussed
above. A resolution of better than 1 nm is routinely
achieved. NR is perhaps better suited to polymer depth
profiling because of the ready availability of deuterium for
contrast. X-ray reflectometry requires the presence of heavy
elements for successful depth profiling. Since many
materials are transparent to neutrons and X-rays, these
techniques are particularly well suited for studies of buried
interfaces. A difficulty with reflection techniques is the
absence of real-space information because reflectivity is a
function of neutron momentum and does not provide a
unique one-to-one correspondence with a depth profile.
Often the user will need to use a complementary technique,
such as an ion scattering technique, in order to have enough
information to fit the reflectivity data.
2.2. Microscopy techniques
In case information on the lateral distribution of material
is required, alternative techniques are indispensable. In the
field of wetting, optical and scanning force microscopy
(SFM) have proven to be quite helpful. As long as the
characteristic lengths are of the order of microns, optical
microscopy is by far the easiest technique to obtain
information on the lateral distribution of material in thin
films. Reflection white light interference microscopy can
provide sufficient contrast between lateral areas of different
film thickness and/or optical beam paths. If smaller features
are to be revealed, SFM is the method of choice.
Topographical features are easily revealed and material
contrast can be established either by differences in the
mechanical properties of the materials [32,33] or by
selective removal of one of the two phases in a selective
solvent [34]. Care must, however, be taken when
topographical features are imaged by TappingModee
M. Geoghegan, G. Krausch / Prog. Polym. Sci. 28 (2003) 261–302 265

SFM in case the different phases have strongly different
mechanical properties [35]. Here, differences in tip
indentation into the surface may interfere with real
topographical features and the interpretation of the apparent
surface topography may be non-trivial.
As an alternative technique, scanning near-field optical
microscopy (SNOM or NSOM) combines the aspects of
both optical microscopy and SFM [36,37]. By use of a
nanoscopically sized optical aperture, which is usually a
tapered optical fibre, kept some nanometres above the
sample surface by a non-contact force measurement (‘shear
force’ distance control), the diffraction limit of conventional
optics can be circumvented. The technique has been applied
to the early stage of lateral phase separation in polymer
blends [38]. It is fair to say, however, that SNOM is still
subject to technical problems and has not played the role
anticipated in the early 1990s [39].
A recent and quite powerful alternative to SFM
measurements is the use of a scanning electron microscope
(SEM) equipped with a field emission electron source. Due
to the small source size, rather low acceleration voltages are
sufficient to achieve the desired lateral resolution. In
consequence, many thin polymer films—though non-con-
ductive in bulk—can be imaged without coverage by a
conducting material (metals, carbon, etc.). Different poly-
meric materials can often be distinguished without heavy
metal staining by virtue of work function differences.
Indeed, field emission SEM can also be operated in
transmission mode to circumvent problems associated
with normal transmission electron microscopy (TEM),
such as poor contrast [40]. Compared to SFM, fast large
area scans and fast zoom ups are possible and even a
chemical contrast can often be realised. However, height
differences cannot quantitatively be mapped.
Finally, we point to a recent extension of SFM to bulk
imaging [41]. Magerle has shown that high spatial
resolution volume images can be created by an iteration of
SFM and suitable removal of a thin surface layer, e.g. by
plasma etching. In case of multiphase materials, where the
different phases can be distinguished, e.g. by their
mechanical properties, the bulk structure of the material
can be reconstructed from a stack of SFM topography and
phase images by suitable image processing. This technique
is referred to as nanotomography. Konrad et al. have applied
this technique to unravel the thin film structure of a PS-
block-PB-block-PS triblock copolymer (SBS, where PS
refers to polystyrene and PB refers to polybutadiene) [42].
Spatial resolution of some few nanometres along all three
spatial axes was demonstrated.
Surface analysis by ion scattering is also possible,
although usually fails to provide the lateral resolution
offered by the scanning probe techniques. However, both
SIMS and X-ray photoelectron spectroscopy (XPS) can
provide lateral chemical information. XPS is probably the
more commonly used given its relatively simple principle.
In XPS experiments [43], X-rays are incident on the sample.
Photoelectrons are emitted from the first few nanometres of
the sample, and their energy is not only characteristic of the
elemental composition of the sample, but also of the
bonding, which can provide important molecular infor-
mation. The principle behind SIMS has already been
mentioned above. Probably, the best method of using
‘static’ SIMS to obtain quantitative surface information is
by using a ToF spectrometer [44], whereby large mass
fragments of several kDa can be detected and sensitivity in
the detection of the emitted ions is maximised.
There have also been improvements in the microscopy of
surfaces using X-rays. The main contribution has come from
workers using the near edge X-ray absorption fine structure
(NEXAFS) technique [45]. The NEXAFS technique
requires the use of an X-ray microscope on a synchrotron
source. Despite demanding requirements, the ability of
NEXAFS to provide chemical contrast with a spatial
resolution of much better than 0.1 mm has ensured its use
in a number of studies on polymer blends [46–48]. Both X-
ray and NR can reveal in plane information such as
roughness but both X-ray and neutrons also have the
capacity to seek out lateral length scales by either analysing
diffuse scattering with X-rays [49–51] or by considering
off-specular neutron reflection [52].
3. Polymer blends
3.1. A brief historical introduction
Early work on the surface of polymer blends was
concerned with the characterisation of the near-surface
composition by techniques such as XPS or attenuated total
reflection–Fourier transform infrared (ATR-FTIR) spec-
troscopy [53]. A particularly important example of early
work pertinent to the material covered in the present review
was light scattering and optical microscopy measurements
characterising the formation of domains in phase separating
thin films of PS and poly(vinyl methyl ether) (PVME) [54].
In another PS/PVME blend (although this one was
miscible), XPS was used to show that PVME preferentially
adsorbs to the surface [1]. By varying the angle at which the
photoelectrons were ejected, a depth profile was obtained.
This enabled the authors to obtain the characteristic length
for the surface-enriched layer, which was seen to be of the
order of the chain size.
A few years before these pioneering XPS measurements,
important theoretical work was being developed to describe
surface effects in a polymer blend film [55]. This work
extended the applicability of the mean field theory of wetting
[56] to include polymer mixtures. Importantly, it allowed the
experimentalist to easily predict the shape of the depth profile,
provided there was sufficient knowledge of relevant material
parameters (molecular weight, Flory–Huggins x-parameter
[57,58], and the surface energy difference between the two
M. Geoghegan, G. Krausch / Prog. Polym. Sci. 28 (2003) 261–302266

components). The first experiment describing a test of this
theory was published by Jones et al. in 1989 [2]. Taking
advantage of the small difference in surface energies
between the components of isotopic polymer mixtures, the
authors used FReS to quantify the surface segregation of
deuterated polystyrene (d-PS) from a mixture with normal
(non-deuterated) PS. The lower surface energy of the d-PS is
believed to lie in the small difference in polarisability in the
C–H and C–D bonds, respectively.
The next major step, also from Jones et al., was the
demonstration of self-assembly in thin films of an
immiscible polymer blend of an isotopic mixture of
poly(ethylene propylene) (PEP) [5]. In this case the mixture
would normally phase separate without an energy barrier via
spinodal decomposition leading to a spatially isotropic
domain structure. However, the preferential accumulation of
the lower surface energy component leads to one-dimen-
sional composition waves in the direction perpendicular to
the plane of the surface. In the experiments described, these
composition waves met and interfered in the centre of the
film.
Progress in this field was rapid, with various authors next
considering the effect of the chemical nature of the substrate
[59], the film thickness [60], and the growth rate of the
surface-wetting layer [61,62].
Although there have been more recent experiments
relating to the development of some of the above, we first
turn our attention to the historically important quest for the
observation of the wetting transition in a polymer blend
film.
3.2. Wetting transition
As we have mentioned, the framework for discussing
wetting phenomena in binary mixtures derives from the first
paper by Cahn in 1977 [56]. A few years later, it was
realised that polymer mixtures are ideal for the study of
wetting, first by Nakanishi and Pincus [63], and then by
Schmidt and Binder [55]. However, as should be apparent
from earlier comments in this review, these two papers were
somewhat ahead of their time because the experimental
techniques at the beginning of the 1980s were not suitable
for the indisputable observation of a wetting transition.
Indeed, it was not until the year 2000 that the first
observations in polymer mixtures were published.
A wetting transition occurs when the free energies of a
partially wetting film is the same as that of a completely
wetting film. The transition can be viewed by altering
relevant experimental parameters. For a first order phase
transition hysteresis is expected while this is not the case for
a second order transition. The mathematics of the wetting
transition is discussed in Appendix A.
In the purest sense, observation of a wetting transition
requires the demonstration of the transition from a partially
wetted surface to a macroscopically thick wetting layer. It
has been argued that, because of the long diffusion times of
polymers, a macroscopically thick wetting layer would be
very difficult to achieve [11], meaning that the wetting
transition could not be observed in polymer blend films. In
this case the experiments that are described in this section
merely locate the wetting transition rather than present an
observation of it. However, this is an issue of semantics and
so we do not consider it further.
3.2.1. Experimental tests
In a polymer blend, there are three experimental
parameters that can be varied to observe the wetting
transition: temperature, composition, and molecular weight.
In the two studies identifying the wetting transition, Rysz
et al. [64] varied temperature and composition, while
Geoghegan et al. [6] varied the molecular weight, Mw.
The polymer blend chosen by Rysz and co-workers was a
mixture of random polyolefin copolymers of poly(ethylene-
co-ethylethylene) with differing ratios of ethylene to
ethylethylene in the components of the blend. A mixture
of 75% deuterated ethylethylene characterised by degree of
polymerisation, N ¼ 1625; with a copolymer containing
66% ethylethylene (non-deuterated, N ¼ 2030) was used
for the studies. The depth profiling techniques of dynamic
SIMS and NRA were used for these studies; hence the need
for deuterium to give contrast. The approach of Rysz et al.
was to observe both equilibrium profiles and the dynamics
of wetting. The necessity for the dynamics is clear; a wetting
layer must grow indefinitely, whereas a layer corresponding
to partial wetting will stop growing when it achieves
equilibrium. However, the equilibrium profile is useful as it
provides a conformation that the Cahn model describes the
system. As the binodal is approached, the adsorbed amount
increases asymptotically. The adsorbed amount is often
denoted by the surface excess, zp (Fig. 1), which is defined
by
zp ¼ð1
0ðfðzÞ2 f1Þdz; ð1Þ
where fðzÞ is the fraction of material by volume (volume
fraction) at a depth, z and f1 is the bulk volume fraction
ðz ¼ 1Þ: If a depletion layer ðf , f1Þ exists between the
wetting layer and the bulk, then the surface excess is defined
with respect to the height of the depletion layer and not the
bulk material. Rysz et al. were able to observe the increase
in surface excess as a function of bulk volume fraction. The
phase diagram was measured previously [65] and is shown
Fig. 1. Schematic diagram illustrating the measured adsorbed
amount or surface excess ðzpÞ:
M. Geoghegan, G. Krausch / Prog. Polym. Sci. 28 (2003) 261–302 267

in Fig. 2 along with the samples measured. In Fig. 3 we
show their results for two temperatures, 365 and 337 K,
respectively, above and below the wetting transition
temperature, ðTw ¼ 340 ^ 5 KÞ: The data are plotted as a
function of distance from coexistence (i.e. f1=fa). Samples
measured at 365 K exhibit larger equilibrium surface
excess, as they are nearer to coexistence in comparison
with the blends at the lower temperature. By measuring the
adsorbed amount, it is possible to determine the surface
energy difference between the two components, and thus
calculate the surface chemical potential, 2dF=dfs: The
details of this calculation are shown in Appendix A, and
further discussion of the surface energy of these polyolefin
blends has been presented elsewhere [65,66]. In Fig. 4 we
show 2dF=dfs plotted with the corresponding bulk term
2ffiffiffiffiffiffiffiffiffiffiffiffiðgDf 0ðfÞÞ
p(g and Df0(f ) are defined in Appendix A). The
2dF=dfs term represents the benefit in having the
component of the lower surface energy at the surface,
whereas the 2ffiffiffiffiffiffiffiffiffiffiffiffiðgDf 0ðfÞÞ
pterm corresponds to the cost in
having a composition gradient and a surface composition
different to that in the bulk. If the curve for 2dF=dfs does
not intersect the bulk term, 2ffiffiffiffiffiffiffiffiffiffiffiffiðgDf 0ðfÞÞ
p; then only total
wetting can occur. If these lines do intersect then the free
energy minimum is governed by whichever term dominates,
and this is discussed in Appendix A. The fit to 2dF=dfs
intersects 2ffiffiffiffiffiffiffiffiffiffiffiffiðgDf 0ðfÞÞ
pin the region of partial wetting at the
lower temperature (i.e. between the two values of surface
volume fraction fs, where 2ffiffiffiffiffiffiffiffiffiffiffiffiðgDf 0ðfÞÞ
p¼ 0), and in the
region of complete wetting at 365 K (i.e. the intersection
occurs at a value offs greater than where 2ffiffiffiffiffiffiffiffiffiffiffiffiðgDf 0ðfÞÞ
p¼ 0),
demonstrating that these two temperatures straddle the
wetting transition.
Although the surface segregation measurements dis-
cussed above demonstrate the existence of a wetting
transition, there is little difference between partial and
complete wetting. To remove any doubt that they had
located the wetting transition, Rysz and co-workers
performed measurements on the dynamics of wetting [64].
A difficulty in measuring wetting dynamics is that, as the
surface layer grows, the bulk is depleted of material. This
means that, unless the film is very thick, a continuously
growing wetting layer is difficult to observe. However, this
problem can be circumvented following an idea of Steiner
and co-workers [67–69]. Two coexisting layers are placed
in contact with each other. On annealing, the wetting layer
should grow with a continuous supply of material from the
lower film, which is rich in the wetting component. This is
shown in Fig. 5. Indeed, if the two layers are not particularly
thick, the layers will eventually invert [69]. By annealing
these films for periods of more than 2 months, it becomes
possible to distinguish which layers had reached equilibrium,
Fig. 2. Phase diagram for the polyolefin blend studied by Rysz et al.
[64]. The circles represent the samples for which measurements
were taken, and the diamonds correspond to the points on the
coexistence curve corresponding to the wetting transition, Tw and
the critical point, Tc. Reprinted with permission from Europhys Lett
2000;50:35. q 2000 EDP Sciences [64].
Fig. 3. Two adsorption isotherms as a function of f1=fa for the
polyolefin mixture [64] at temperatures above and below Tw.
Reprinted with permission from Europhys Lett 2000;50:35. q 2000
EDP Sciences [64].
Fig. 4. Phase portraits for the blends used by Rysz et al. [64]. The
intersection of 2ffiffiffiffiffiffiffiffiffiffiffiffiðgDf 0ðfÞÞ
p(broken lines) with 2dF=dfs (solid
lines and symbols) occurs on either side of the wetting transition.
The mathematics of such phase portraits is discussed in Appendix
A. Reprinted with permission from Europhys Lett 2000;50:35.
q 2000 EDP Sciences [64].
M. Geoghegan, G. Krausch / Prog. Polym. Sci. 28 (2003) 261–302268

and which grew continuously; we show representative data
in Fig. 6. The bilayer film annealed for 73.2 days at 332 K is
unchanged from a profile obtained after annealing for 12.6
days and so has reached equilibrium but the one annealed
for 3.4 days at 352 K exhibits a wetting layer that is still
growing. Scaling the temperature of the wetting film to
332 K gives an annealing time of 18.8 days [70], so the
different wetting behaviour must lie in the films being
annealed on either side of a wetting transition.
Another route to the observation of the wetting transition
utilises the two-phase region of the phase diagram. The
surface layer should be stable for shallow quenches into the
two-phase region, but is expected to break-up into droplets
for deeper quenches. This was exploited by Geoghegan et al.
[6], who looked at partially miscible blends of d-PS and
poly(a-methylstyrene) (PaMS) in the unstable region of the
phase diagram. In an earlier study, it was observed that the
wetting layer in this blend grows logarithmically with time
[62], an observation previously associated with wetting at
coexistence [68]. Puri and Frisch later suggested that the d-
PS/PaMS blend represented a good example of a low noise
system [13], which in turn meant that the more common t 1/3
growth of the surface layer should be achieved by deeper
quenches. By changing the molecular weight, deeper
quenches were accessible, and NRA measurements on the
growth law showed that there was indeed a transition to a
faster growth law. The t 1/3 growth is indicative of the
coarsening of droplets at the surface. SFM measurements on
these films showed that there was a change in the roughness
of the film. The logarithmic growth corresponded to
surfaces that remained flat (r.m.s. roughness remained
below 1 nm), whereas the deeper quenches corresponded
to much rougher films (r.m.s. roughness of typically
,4 nm).
The identification of a wetting transition by both sets of
workers completes what we believe to be the final major
task concerning the fundamental physics of wetting in
polymer blends. However, there are still many important
goals for the interested experimentalist to achieve. Hyster-
esis in the location of the transition between partial and
complete wetting was not observed in any of the
experiments discussed above even though hysteresis is
inherent in any first order transition. Another interesting
challenge is the observation of a second order wetting
transition [56,71], although there are theoretical arguments
suggesting that this might be very difficult to achieve
experimentally [71,72] (see also Appendix A).
3.3. Other polymer blend film depth profiling experiments
3.3.1. Kinetics of wetting layer growth
The growth of surface layers is largely, but not
exclusively, dependent on thermodynamic factors, with
the miscibility of the polymer blend being a crucial
example. First experiments were performed on mixtures of
polyisoprene (PI) and PEP [73]. Using light scattering two
length scales of phase separation were observed; a bulk
length scale growing linearly with time, t, and a wetting
layer that grew with t 3/2. The bulk behaviour is to be
expected from hydrodynamic flow, but the explanation of
the ‘fast mode’ of surface growth is still something of a
mystery. Explanations for the fast mode include a coarsen-
ing-related effect [74], but most workers believe it to be of
hydrodynamic origin [75,76] although as yet no theory has
been fully tested. We shall turn to hydrodynamic wetting
layer growth later in this review. However, measurements
on a less immiscible isotopic mixture of PEP revealed a t 1/3
growth law [61]. Although it is not a trivial matter to
identify the growth law with the nature of the wetting layer,
the authors observed dynamic scaling, meaning that the
shape of the depth profiles becomes independent of time
when the profiles are scaled to the thickness of the wetting
layer. Since the wetting layer is growing as t 1/3 and dynamic
Fig. 5. Schematic diagram showing how a film of two coexisting
phases will wet the surface layer. At t ¼ 0 the lower coexisting
phase is at the surface, with the upper coexisting phase underneath.
However, with the upper coexisting phase favouring the surface,
material will flow through the film from the substrate layer to the
surface. The net effect of this is to shift the lower coexisting phase
towards the substrate.
Fig. 6. Dynamic SIMS data for polyolefin films annealed for 73.2
days at 332 K and 3.4 days at 352 K. See text for molecular
parameters. These films were initially bilayers at their coexisting
compositions at the required temperatures as described in Fig. 5.
The sample annealed at 332 K has reached equilibrium, whilst that
at 352 K consists of a growing wetting layer.
M. Geoghegan, G. Krausch / Prog. Polym. Sci. 28 (2003) 261–302 269

scaling is observed, bulk phase separation also exhibits a t 1/3
behaviour. Other measurements on polyolefin blends found
growth laws slower than the t 1/3, which were explained in
terms of long-range forces. Steiner and Klein [67] observed
the wetting layer to grow as t 0.20, but a logarithmic growth
law could fit the data equally well. Because the logarithmic
growth is a signature of a short-range surface potential, the
authors estimated a decay length for an exponentially
decaying surface field to some 31 nm. This rather large
value led the authors to question the role of short-range
forces. In truth other short-range surface fields will give a
logarithmic growth [77,78], so the validity of this decay
length is not clear. However, to extinguish any doubt
concerning the importance of long-range forces for the
growth of the wetting layers in their system, Steiner and
Klein calculated a Hamaker constant from their power law
growth to be in the order of 10221–10220 J in agreement
with the expectation for such non-polar mixtures.
Later measurements on a blend of PS and poly(a-
methylstyrene) (PaMS) showed a logarithmic growth of the
surface layer as well [62]. A power law growth of t 0.14,
which also could provide a good fit to the data, cannot be
readily explained in terms of long-range forces. However, in
the same study, a layer near, but not at, the substrate
exhibited a t 1/3 growth. This implies that, like the earlier
measurements on the mixture of PI and PEP [73], not all
systems demonstrate the same behaviour in the bulk and at
the surface. A more detailed study of mixtures of PS and PaMS
revealed three growth laws as the molecular weight wa
changed, thereby changing the immiscibility [6]. The quench
depth, 1, is a measure of immiscibility and is given by
1 ¼x2 xs
xs
; ð2Þ
where xs is the value of the Flory–Huggins interaction
parameter, x on the spinodal. The results for the surface
excess as a function of annealing time for three of the
quench depths studied are shown in Fig. 7, taken from Ref.
[6]. For the shallowest quench inside the two-phase region
(1 ¼ 0:06; corresponding to Mwðd-PSÞ ¼ 35 kDa and
MwðPaMSÞ ¼ 41:7 kDa) a t 1/2 growth law was observed
(Fig. 7(c)), which slowed down at later times. For slightly
deeper quenches (1 ¼ 0:44; corresponding to Mwðd-PSÞ ¼
80 kDa and MwðPaMSÞ ¼ 41:7 kDa) a region of logarith-
mic growth was observed (Fig. 7(b)). At the deepest
quenches (1 ¼ 2:4; Mwðd-PSÞ ¼ 163 kDa and Mw
ðPaMSÞ ¼ 108 kDa), the t 1/3 behaviour was recovered
(Fig. 7(a)). The crossover from logarithmic to t 1/3 surface
growth corresponds to the crossover from complete to
partial wetting, and it is therefore between these quench
depths that the wetting transition discussed above lies
(Section 3.2).
In Fig. 8 we schematise the growth of wetting layers for
the different quench depths. At the bottom we show a
surface layer that is rich in the wetting component, but for
which the wetting layer is not stable, and droplets are
Fig. 7. Wetting layer growth for a d-PS-rich phase from a
mixture with PaMS for three different molecular weight pairs
[6]. (a) A very immiscible blend (Mw(d-PS) ¼ 163 kDa,
Mw(PaMS) ¼ 108 kDa, and f1 ¼ 0:43) with 1 ¼ 2:4 exhibits
a t 0.37 growth of the surface excess. (b) A blend with 1 ¼ 0:44
(Mw(d-PS) ¼ 80 kDa, Mw(PaMS) ¼ 41.7 kDa, and f1 ¼ 0:37)
has a wetting layer that grows logarithmically in time. (c) The
wetting layer for a shallow quench (Mw(d2PS) ¼ 35 kDa,
Mw(PaMS) ¼ 41.7 kDa, and f1 ¼ 0:52), with 1 ¼ 0:06; grows
initially with t 0.47 before slowing to t 0.13. This growth at later
times may well be logarithmic. Reprinted with permission from
Phys Rev E 2000;62:940. q 2000 American Physical Society
[6].
M. Geoghegan, G. Krausch / Prog. Polym. Sci. 28 (2003) 261–302270

formed on the surface. The wetting layer is not stable
because the x-parameter is so large that a growing wetting
layer cannot survive and breaks up. Here, there are also
droplets in the bulk, and both surface and bulk droplets are
growing with t 1/3 behaviour because they are both
exhibiting Lifshitz–Slyozov-like coarsening (t 1/3) [79].
For shallower quenches (middle diagram of Fig. 8), the
surface-wetting layer is stable and grows continuously. At
the same time, there are domains growing in the bulk. As
these domains grow, there is less material to be supplied to
the wetting layer and so the wetting layer cannot grow with a
diffusion-limited t 1/2 growth, but instead grows logarithmi-
cally with time.
The most surprising growth law is the t 1/2 behaviour.
The t 1/2 growth itself suggests a simple diffusive growth.
However, if the bulk were not being depleted in the
component which wets the surface, a t 1/2 growth would be
possible. The authors assumed that droplets were forming
on the surface, and because no phase separation was (yet)
occurring in the bulk, the bulk was behaving like a semi-
infinite reservoir for the surface layer. This is illustrated
schematically in the top diagram of Fig. 8. At later times,
this was not the case and the surface layer became starved of
material, eventually slowing down the wetting layer growth
(middle diagram of Fig. 8).
To test these hypotheses, dynamic scaling was used.
Here, the wetting layer is assumed to have constant
thickness with time, and the depth profile is normalised so
that the wetting layer thickness does not change. If there is
no phase separation in the bulk, as we supposed for the t 1/2
growth, then dynamic scaling should occur as there is only
one length scale present in the system, i.e. the thickness of
the wetting layer. For the logarithmic growth, dynamic
scaling should fail because the wetting layer is growing
logarithmically but Lifshitz–Slyozov-like coarsening (t 1/3)
[79] is expected to be occurring in the bulk. Finally, the
Fig. 8. Schematic diagram of the growth of the wetting layer as a
function of quench depth. For the shallowest quench, wetting begins
with a t 1/2 growth law as the surface-favoured component diffuses
to the surface to form surface droplets. Slightly deeper quenches
have a wetting layer growing with bulk phase separation occurring
simultaneously. Here, the surface layer growth is logarithmic. For
the deepest quench, the behaviour at the surface is similar to that in
the bulk, with phase-separated droplets coarsening. The growth of
the surface layer is then t 1/3.
Fig. 9. Dynamic scaling plots corresponding to the same blends as in
Fig. 7 [6]. The order parameter is given by f2 f1 and the wetting
layer is scaled to a thickness of 1. Dynamic scaling is not exhibited
only where logarithmic growth is observed (b).
M. Geoghegan, G. Krausch / Prog. Polym. Sci. 28 (2003) 261–302 271

region of t 1/3 growth should exhibit dynamic scaling for the
same reasons as in the earlier experiments of Krausch et al.
[61], i.e. a surface layer and bulk phase separation are both
occurring with a t 1/3 behaviour. As can be seen from Fig. 9
this is indeed what was observed.
In closing this discussion we note that, although the
arguments noted above are relatively simple, theoretical
work is ongoing and may shed some further light on the
interpretation of this, and similar, work [80].
In this section, we have described the kinetics of the
growth of wetting layers, and we have given some indication
of how wetting layers may form by describing experiments
on very shallow quenches [6], but the question as to what
precedes the wetting layer is still an open one. It may well be
the case that before logarithmic growth there may well be a
small region of t 1/2 growth, but there are as yet no data on
how the wetting layer is formed in films which are expected
to exhibit t 1/3 or hydrodynamic ( / t ) growth. We expect
that future research will consider this problem in more
detail, but a related problem as to how the surface layer
forms in systems prior to phase separation has been
achieved, and we turn to this next.
3.3.2. The approach to phase separation
In a miscible polymer blend, the time scale for the
surface layer formation is controlled by how long it takes for
the polymer with the lower surface energy to diffuse to the
surface. This diffusion-limited surface layer growth was
discussed by Jones and Kramer [81] in terms of a simple
model. The model consists of the depth profile of a polymer
blend controlled by three compositions: the surface volume
fraction, fs, the volume fraction of the depletion layer
underneath the surface layer, fd, and the volume fraction in
the bulk material, f1. The assumption underpinning the
three-layer model is that the layers are continuously in
equilibrium with each other [82]. Then one can set the
surface excess, zp to be given by
zp ¼ ðf1 2 fdðtÞÞffiffiffiffiDt
p; ð3Þ
where D is the interdiffusion diffusion coefficient. Since the
size of the surface layer in an undersaturated system (i.e.
f1 , fa) grows logarithmically with the distance from the
binodal ðfa 2 fdÞ; we obtain (see Appendix A for details of
the calculation and the inherent assumptions)
zp ¼ 2z lnfa 2 fd
fa
� �; ð4Þ
where z is a length representing the size of the surface
segregated layer. Eliminating fd, we obtain
zp ¼ ðf1 2 fað1 2 expð2zp=zÞÞÞffiffiffiffiDt
p: ð5Þ
As phase separation is approached, the logarithmic term in
the surface excess becomes important. Geoghegan et al.
tested this kinetics on an isotopic PS blend using NR [83]. In
these experiments, the surface excess was measured as a
function of annealing time at a constant measurement
temperature of 457 K. In Fig. 10 we show this growth as a
function ofp
t for the two blends measured. The agreement
with the model is reasonable. The simulations (solid lines)
were produced by least square fits varying the values of z
and D. The mutual diffusion coefficient obtained from these
results was also compared with previous measurements
[84–86], and agreement was found to be acceptable (within
an order of magnitude). The surface energy difference
between the two components was obtained from fs
(Appendix A) to 0.12 mJ/m2 for the miscible blend. For
the partially miscible blend, a somewhat larger value of
0.21 mJ/m2 was found. This is a significant variation, given
that the surface energy of high polymers is only a weak
function of molecular weight [87]. Nevertheless, the values
obtained are in reasonable agreement with other similar
studies [2,26,88]. Despite minor discrepancies it is possible
to conclude that standard mean-field theory may be used to
explain the behaviour of polymer blends as the coexistence
curve is approached. We now contrast these results with a
related experiment, in which the standard theory, as outlined
above, cannot be used.
In a different approach to study surface segregation at the
onset to phase separation, Genzer and Composto studied
thin films of PS (with NA ¼ 1650 chain segments) and a
random copolymer of styrene and bromostyrene (PSxBrS12x,
with NB ¼ 1670 chain segments and x ¼ 0:92) as the critical
point was approached [89]. The thickness of the surface
layer in such experiments was found to be smaller than the
values predicted by the standard mean field theory discussed
above, suggesting that bulk parameters such as x were
playing an increasingly important role in the size of the
surface layer. In these experiments, LE-FReS was used to
measure the surface excess as Tc was approached from the
Fig. 10. Measurements of surface excess as a function of annealing
time for the two blends of d-PS and h-PS [83]. In each case the d-PS
and h-PS have the same molecular weight: 1.03 £ 106 Da for a
completely miscible blend (with f1 ¼ 0:14), and 1.95 £ 106 Da for
a partially miscible blend (with f1 ¼ 0:05 and 0.10). The solid
lines are simulations obtained from the simple theory discussed in
the text. Reprinted with permission from Macromolecules
1997;30:4220. q 1997 American Chemical Society [83].
M. Geoghegan, G. Krausch / Prog. Polym. Sci. 28 (2003) 261–302272

one phase region ðTc < 462 KÞ: In Fig. 11 the values of
surface excess determined for four different temperatures
are shown as a function of f1 (the system was symmetric
with a critical volume fraction of 0.502). From these data,
one sees that the surface excess increases as the critical point
is approached. However, it is also possible to calculate the
surface free energy from the off-critical data, and it was
noted that the surface chemical potential, ms (Appendix A)
remained constant except for the symmetric blends, where it
decreased. The discrepancy was observed to be larger closer
to Tc. In Fig. 12 we show zp for symmetric systems as the
critical point is approached. The values calculated from the
surface free energy are also shown; here they are
considerably larger than the measured values. To explain
this result, the bulk correlation length j was invoked as the
size of the surface layer, with the approximation that
zp < jðfs 2 f1Þ: ð6Þ
The bulk correlation represents the length over which
composition fluctuations remain significant and can be
shown for symmetric systems to be [90]
j ¼a
6ffiffiffiffiffiffiffiffiffiffiffiffiffiffiffiffiffiffiffiffiffiffiffiffiffiffif1ð1 2 f1Þðxs 2 xÞ
p ; ð7Þ
where xs corresponds to the value of x at the critical point.
Using a form for the surface tension derived from the Gibbs
adsorption equation [91]:
2dg
dfs
¼ 2kBTzprðxs 2 xÞdfs
df1
� �21
ð8Þ
as well as Eqs. (6) and (7), it can readily be shown that
ms /ffiffiffiffiffiffiffiffiffiffiffiffiffiffiffiffiffiffiffiffiffiffiffiffiffixs 2 4xf1ð1 2 f1Þ
p; ð9Þ
which, as Tc is approached, tends to zero for symmetric
systems. This provides a plausible explanation of why the
increase in surface excess is less than expected.
Although the above explanation is plausible, there are
other possible contributions to the depressed values of zp
near the critical point. A rigorous understanding of the
temperature dependence of the surface free energy and the
surface energy difference between the components would be
particularly useful. Related experiments on the temperature
dependence of surface energy have been performed using
ion scattering from polyolefin blends [8,92,93]. It has been
suggested, for example, that finite size effects, not accounted
for in the above explanation, will play an important role
[11]. Another reason concerns the location of Tc itself.
Fluctuations tend to decrease Tc slightly, because slight
variations in composition in the two-phase region close to
the critical point will move the blend into the miscible
region of the phase diagram [94]. Therefore, it is possible
that fluctuations will contribute to the depressed value of zp.
In general, however, it is hard to see how such bulk effects
cannot play a role in the growth of a wetting layer close to
Tc, although whether or not this is a large effect is as yet
untested experimentally. One aspect that is likely to prove
interesting is the kinetics of segregation close to Tc, where
the correlation length has been seen to affect the diffusion of
polymer chains [95]. When the correlation length is of the
same size as the segregating polymer, it is expected that the
approach to equilibrium will be significantly impeded,
providing an interesting test of whether or not such
segregation near Tc is diffusion-limited.
3.3.3. Hydrodynamic flow
A phase-separated medium can either consists of many
Fig. 11. Equilibrium surface excess of d-PS ðN ¼ 1650Þ mixed with
PSxBrS12x (x ¼ 0:92; N ¼ 1670) for various values of f1 at
various temperatures approaching the critical point ðTc ¼ 462 KÞ
[89]. The symbols are the LE-FReS data and the solid lines are
guides to the eye. Reprinted with permission from Europhys Lett
1997;38:171. q 1997 EDP Sciences [89].
Fig. 12. Equilibrium surface excess as a function of T 2 Tc for d-
PS/PSxBrS12x mixtures at f1 < 0:5 [89]. Solid circles represent
the experimental low energy FReS data, whilst open circles show
theoretical predictions obtained by using mean field theory to
calculate the surface free energies. The solid lines are guides to the
eye. Reprinted with permission from Europhys Lett 1997;38:171.
q 1997 EDP Sciences [89].
M. Geoghegan, G. Krausch / Prog. Polym. Sci. 28 (2003) 261–302 273

domains dissolved in a majority component, or as a
bicontinuous structure. In the former case, coarsening is
driven by the Laplace pressure exerted by the domains on
the surrounding matrix, which forces the domains to grow in
size and can even force the volume fraction of the majority
component in the domain to be slightly greater than the
coexistence value. These domains may well meet, and the
formation of a new, larger domain is no longer governed by
coarsening, but is driven by the surface tension between the
phases and the viscosity of the components. This is
hydrodynamic flow. A simple scaling law for flow-driven
growth of these bulk domains has been described by Siggia
[96], who predicts a crossover from a t 1/3 behaviour to a
linear growth law. Marko extended this analysis to the
growth of surface domains [75]. The ideas developed by
Marko were used to explain the behaviour of wetting layer
growth in off-critical isotopic blends of PEP [97], which
were linear in time, but exhibited a t 1/3 growth law for
critical quenches. Although such explanations were convin-
cingly backed up with computer (cell dynamical) simu-
lations of hydrodynamic flow, evidence for the necessary
interconnected structure (tubes) linking the bulk with the
wetting layer was missing. In the case of a bicontinuous
structure, the conditions for hydrodynamic flow are already
present in that the interconnected structure allows the fast
material transport that is its signature. The behaviour of a
wetting layer from a film of a mixture in which droplets of
one phase are dissolved in the other is not, however, the
same as that from mixtures that exhibit a bicontinuous
structure in the bulk [76].
Identifying systems that exhibit hydrodynamic flow
means finding systems by which the conditions for fast
material transport are available. This is generally achieved
in the late stages of phase separation, when a mixture can
break-up into a bicontinuous structure. Very early studies on
hydrodynamic flow in polymeric mixtures were undertaken
by Tanaka, who used optical microscopy to study a mixture
of PS and PVME [98]. We concentrate here on work on a
critical mixture of deuterated PMMA (d-PMMA) and a
random copolymer of acrylonitrile and styrene (SAN)
[99–102], which forms a bicontinuous morphology just
below the wetting layer. Nevertheless, off-critical mixtures
can also exhibit hydrodynamic flow, as has been shown for
an isotopic PEP mixture, in which the majority d-PEP phase
wetted the surface [103].
A method of identifying hydrodynamic flow is to use ion
beam analysis to observe the growth of the surface layer,
whilst accessing the bulk with SFM. This can be performed
by dissolving the surface layer in a selective solvent. Two
groups have performed such work; in one study a mixture of
PS and a random copolymer of styrene and bromostyrene
was studied [104]. The growth of the PS-rich surface layer
was followed using dynamic SIMS and NRA. Dissolving
the PS in cyclohexane enabled the random copolymer in the
bulk to be studied by SFM. These authors were also able to
vary the surface energy with the addition of a PS-block-PI
diblock copolymer, which preferentially segregates to the
surface [105].
The other series of experiments into the morphology of
thin film blends exhibiting hydrodynamic flow is due to
Wang and Composto using blends of PMMA and SAN
[99–101]. The surface behaviour was measured using
FReS, and the bulk was observed using SFM. In order to
access the bulk of the material, the PMMA was selectively
dissolved in acetic acid. Along with identifying hydrodyn-
amic growth, these authors were able to follow the evolution
of the film during each stage of growth.
The difficulties inherent in identifying hydrodynamic
growth of wetting layers in polymer blend films stem from
the different growth stages taking place during annealing. In
a first stage, the lower surface energy component (A) of the
phase-separated mixture will wet the surface, and in the case
of the work by Wang and Composto, the substrate, too [99].
After this stage hydrodynamic flow of material to the
surface is expected to occur. However, in a thin film, wetting
of surface and substrate will cause a trilayer structure to
occur. Such a structure will tend to break-up, with a third
stage consisting of material flow from both the surface and
the substrate. This flow will use the ‘tubes’, which fed the
wetting layer growth, but will occur via a coarsening
mechanism. Finally, the middle region (B-rich) will break-
up, dewet from the A-rich region. Correspondingly, the
interfacial roughness will increase.
In Fig. 13 we show low energy FReS data describing the
growth of a wetting layer of deuterated PMMA from a blend
with the SAN copolymer. In Fig. 14 the thickness, z, of the
wetting layer is presented as a function of time. In the
case of the data for the samples annealed at 458 K, it is
clear that the surface layer thickness grows linearly in
time over an order of magnitude in time. SFM was also
used to image the samples, along with the selective
dissolution of the PMMA in acetic acid. As can be seen
n Fig. 15, the SAN surface is much rougher than the surface
Fig. 13. Volume fraction profiles for d-PMMA
ðMw ¼ 90 kDaÞ/SAN (Mw ¼ 124 kDa; 33% acrylonitrile by
weight) blend films annealed at 463 K with f1 ¼ 0:47 as measured
by LE-FReS [100]. The rapidly increasing surface excess is
indicative of hydrodynamic flow. Reprinted from Phys Rev E
2000;61:1659 with permission from RJ Composto [100].
M. Geoghegan, G. Krausch / Prog. Polym. Sci. 28 (2003) 261–302274

of the PMMA wetting layer and exhibits a bicontinuous
morphology.
Although hydrodynamic growth is revealed in the first
hour or so of annealing, the film continues to develop long
after that. In Fig. 16 the low energy FReS data show a rather
dramatic phase evolution. The film first breaks up via an
apparently homogenous phase to form a bilayer structure.
Of course, such FReS depth profiles do not reveal the full
three-dimensional morphology, and SFM was used to
measure the lateral length scale and roughness dominating
the films at each stage in the evolution of the structure [99,
101]. The SFM images, shown in Fig. 17, reveal both the
surface morphology and the morphology of the near surface,
which was exposed by acetic acid etching of the PMMA.
These images can be compared with the FReS data in Fig.
16. In Fig. 17(b), after 20 min annealing, a bicontinuous
structure is visible in the below-surface scan, which is
clearly not observable from the surface scan (Fig. 17(a)).
The surface scans show a clear increase of the lateral length
scale of the wetting layer, from sub-micron sizes (after
20 min) to ,20 mm (after 262 h). The same increase in
length scale is happening to the near-surface morphology,
except that smaller PMMA-rich holes are present and
remain throughout annealing, although their size does
change. As a result of these images, the authors were able
to correlate the structures and roughnesses obtained by
SFM, with phase separation at different locations in the film.
The lateral length scale can be revealed from Fourier
transforms of these SFM images and is seen (Fig. 18) to
crossover from a linear growth to a Lifshitz–Slyozov-like
t 1/3 coarsening behaviour. The Lifshitz–Slyozov behaviour
does not start after the hydrodynamic regime, but rather
starts during it, but is not observed because the much faster
hydrodynamic flow is dominant. Nevertheless, one can see
that the crossover to coarsening behaviour in the Fourier
transforms occurs after only 15 min, whereas the wetting
layer growth displays hydrodynamic behaviour beyond this
to well over an hour (Fig. 14). This means that the trilayer
structure breaks up because of the coarsening occurring
parallel to the surface. However, as well as this coarsening,
another mechanism of break-up is occurring. A film rich in
SAN sandwiched between the PMMA-rich layers is
thermodynamically unstable and will dewet by spinodal
Fig. 16. Volume fraction-depth profile of d-PMMA as measured by
FReS for a ,500 nm thick film of a blend with SAN annealed at
458 K [101]. The profile develops from a homogenous film to a
bilayer, with d-PMMA wetting the surface. The path to equilibrium
is interesting, with a trilayer morphology giving way to the final
bilayer structure, via the apparently homogenous structure shown in
(d). Reprinted from J Chem Phys 2000;113:10386 with permission
from RJ Composto [101].
Fig. 15. SFM surface image of a d-PMMA/SAN blend film with the
d-PMMA removed after being first annealed for an hour at 458 K
[100]. The acetic acid treatment reveals the bicontinuous mor-
phology of the SAN underneath the PMMA wetting layer.
Reprinted from Phys Rev E 2000;61:1659 with permission from
RJ Composto [100].
Fig. 14. Thickness of d-PMMA wetting layer (from a blend with
SAN) plotted against time. The straight lines show linear fits
indicating hydrodynamic flow [101]. In the sample annealed at
463 K, the growth of the wetting layer slows down after 1 h due to
depletion of d-PMMA from the wetting layer. The d-PMMA has
Mw ¼ 90 kDa and f1 < 0:5 and the SAN has Mw ¼ 124 kDa (with
an acrylonitrile content of 33% by weight). Reprinted from J Chem
Phys 2000;113:10386 with permission from RJ Composto [101].
M. Geoghegan, G. Krausch / Prog. Polym. Sci. 28 (2003) 261–302 275

dewetting due to long-range forces [106]. This mechanism
of rupture, convolved with the coarsening is responsible for
the particular sample morphology observed here [101] and
explains why the final structure is a series of droplets.
Further detailed discussion of these rupture mechanisms is
discussed in a later publication [102].
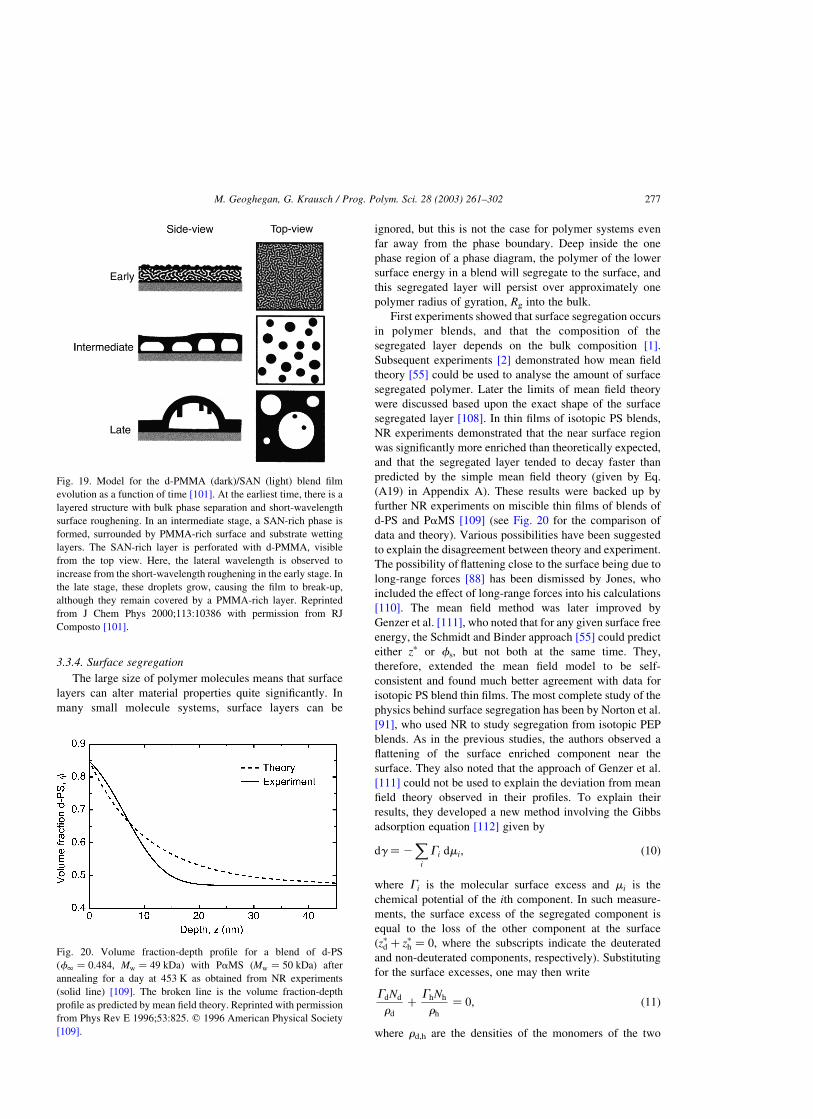
We show in Fig. 19 a schematic diagram displaying the
early, intermediate, and late stages of phase evolution of the
films. However, to briefly summarise here, the film
morphology develops in a three-stage process, which begins
with hydrodynamic wetting of the surface and substrate by
d-PMMA. The component wetting the surfaces (d-PMMA)
flows back into the bulk of the film, whilst the phases in the
middle layer coarsen. Capillary fluctuations in this middle
layer cause its rupture and eventually break-up into a final
dewetted droplet morphology.
Although the above work using solvents to selectively
remove one component from the mixture represents a
major contribution to the study of hydrodynamic flow in
polymer blend films, much has also been deduced about
hydrodynamic flow from ion beam depth profiling and SFM
[103] or optical phase interference microscopy [107].
Fig. 17. SFM images of d-PMMA/SAN blend films showing the
surface (left column) and sub-surface morphology after dissolving
the d-PMMA with acetic acid (right column) of films with f1 ¼
0:47 annealed at 458 K [101]. The images are (length scale and
annealing time): (a and b) 10 mm £ 10 mm, 20 min; (c and d)
50 mm £ 50 mm, 240 min; (e and f) 50 mm £ 50 mm, 2880 min; (g
and h) 50 mm £ 50 mm, 4320 min; (i and j) 80 mm £ 80 mm,
8160 min; (k and l) 80 mm £ 80 mm, 15 720 min. Reprinted from J
Chem Phys 2000;113:10386 with permission from RJ Composto
[101].
Fig. 18. Lateral characteristic wave number ðq ¼ 2p=lÞ of the phase
separation of films of d-PMMA and SAN annealed at 458 K [101].
The gradients reveal hydrodynamic flow (for t , 15 min; the slope
is 21.02) and Lifshitz–Slyozov coarsening (for t . 15 min,
the slope is 20.35). The beginning of the coarsening mechanism
is not observed here because it is obscured by much more
rapid hydrodynamic flow. Reprinted from J Chem Phys
2000;113:10386 with permission from RJ Composto [101].
M. Geoghegan, G. Krausch / Prog. Polym. Sci. 28 (2003) 261–302276
3.3.4. Surface segregation
The large size of polymer molecules means that surface
layers can alter material properties quite significantly. In
many small molecule systems, surface layers can be
ignored, but this is not the case for polymer systems even
far away from the phase boundary. Deep inside the one
phase region of a phase diagram, the polymer of the lower
surface energy in a blend will segregate to the surface, and
this segregated layer will persist over approximately one
polymer radius of gyration, Rg into the bulk.
First experiments showed that surface segregation occurs
in polymer blends, and that the composition of the
segregated layer depends on the bulk composition [1].
Subsequent experiments [2] demonstrated how mean field
theory [55] could be used to analyse the amount of surface
segregated polymer. Later the limits of mean field theory
were discussed based upon the exact shape of the surface
segregated layer [108]. In thin films of isotopic PS blends,
NR experiments demonstrated that the near surface region
was significantly more enriched than theoretically expected,
and that the segregated layer tended to decay faster than
predicted by the simple mean field theory (given by Eq.
(A19) in Appendix A). These results were backed up by
further NR experiments on miscible thin films of blends of
d-PS and PaMS [109] (see Fig. 20 for the comparison of
data and theory). Various possibilities have been suggested
to explain the disagreement between theory and experiment.
The possibility of flattening close to the surface being due to
long-range forces [88] has been dismissed by Jones, who
included the effect of long-range forces into his calculations
[110]. The mean field method was later improved by
Genzer et al. [111], who noted that for any given surface free
energy, the Schmidt and Binder approach [55] could predict
either zp or fs, but not both at the same time. They,
therefore, extended the mean field model to be self-
consistent and found much better agreement with data for
isotopic PS blend thin films. The most complete study of the
physics behind surface segregation has been by Norton et al.
[91], who used NR to study segregation from isotopic PEP
blends. As in the previous studies, the authors observed a
flattening of the surface enriched component near the
surface. They also noted that the approach of Genzer et al.
[111] could not be used to explain the deviation from mean
field theory observed in their profiles. To explain their
results, they developed a new method involving the Gibbs
adsorption equation [112] given by
dg ¼ 2X
i
Gi dmi; ð10Þ
where Gi is the molecular surface excess and mi is the
chemical potential of the ith component. In such measure-
ments, the surface excess of the segregated component is
equal to the loss of the other component at the surface
(zpd þ zph ¼ 0; where the subscripts indicate the deuterated
and non-deuterated components, respectively). Substituting
for the surface excesses, one may then write
GdNd
rd
þGhNh
rh
¼ 0; ð11Þ
where rd,h are the densities of the monomers of the two
Fig. 19. Model for the d-PMMA (dark)/SAN (light) blend film
evolution as a function of time [101]. At the earliest time, there is a
layered structure with bulk phase separation and short-wavelength
surface roughening. In an intermediate stage, a SAN-rich phase is
formed, surrounded by PMMA-rich surface and substrate wetting
layers. The SAN-rich layer is perforated with d-PMMA, visible
from the top view. Here, the lateral wavelength is observed to
increase from the short-wavelength roughening in the early stage. In
the late stage, these droplets grow, causing the film to break-up,
although they remain covered by a PMMA-rich layer. Reprinted
from J Chem Phys 2000;113:10386 with permission from RJ
Composto [101].
Fig. 20. Volume fraction-depth profile for a blend of d-PS
(f1 ¼ 0:484; Mw ¼ 49 kDa) with PaMS ðMw ¼ 50 kDaÞ after
annealing for a day at 453 K as obtained from NR experiments
(solid line) [109]. The broken line is the volume fraction-depth
profile as predicted by mean field theory. Reprinted with permission
from Phys Rev E 1996;53:825. q 1996 American Physical Society
[109].
M. Geoghegan, G. Krausch / Prog. Polym. Sci. 28 (2003) 261–302 277

components. The mathematics is described elsewhere [91,
113], but in summary, the chemical potential is obtained
from Flory–Huggins mean field theory, enabling one to
calculate dm. Provided df1/df1 is known through exper-
imental measurement, it is a simple matter to obtain Eq. (8)
if we use the substitution
dg
df1
¼dg
df1
df1
df1
� �21
: ð12Þ
Because df1/df1 is a measured parameter, this method of
extracting the surface energy difference is model indepen-
dent, and only requires knowledge of the bulk thermodyn-
amics. Despite this progress a full understanding of the
behaviour of the surface energy and surface composition
profile of polymer blends is still lacking, not only because
there are some differences in the theories discussed above,
but because of the discrepancies between the results for
polymer blends and for recent models of the interfacial
tension in simple polymeric liquids [114].
Segregation from a binary polymer blend (B/C) to an
interface of a homopolymer A is another subject that has
been addressed theoretically [115] and experimentally [113,
116]. This issue is important because the segregation of one
component to the interface may have practical importance in
compatibilising two films by lowering the interfacial
tension. The authors used LE-FReS depth profiling on an
interface between PS and a miscible blend of two random
copolymers of PS and partially brominated PS (PSxBrS12x
and d-PSyBrS12y, with different molecular weights and
degrees of bromination x and y, respectively). Segregation
was indeed observed and reached a maximum for a
particular concentration of d-PSyBrS12y, which corre-
sponded to the best compatibilisation. Their results were
found to agree well to self-consistent mean field theory
calculations. In contrast to other means of interface
compatibilisation involving block copolymers [117,118],
this method circumvents the necessity for expensive block
copolymer synthesis and may therefore be of technological
relevance. It should, however, be noted that there are other
methods of using polymers to compatibilise interfaces by,
for example, the addition of random [119,120] copolymers
to one of the components at either side of the interface, or by
the use of grafted chains to form an interface, either with
another polymer [121] or with an inorganic substrate [122,
123].
Another practical use of surface segregation is found in
applications where particular surface properties need to be
established and eventually regenerated throughout the
lifetime of the material. As an example, consider the
problem of fouling the hulls of ships, where bio-resistant
surfaces are of major economic importance. A particularly
interesting study in this respect is the work by Hester et al.
[124]. Here, an amphiphilic comb polymer with PEO side
chains and a PMMA backbone is blended with poly(viny-
lidene fluoride) (PVDF). XPS measurements showed that
the comb polymer segregates to the surface on annealing.
Furthermore, these samples were exposed to a solution
containing the plasma protein bovine serum albumin and
found that the comb polymer imparted significant protein
resistance when compared to the unannealed film or pure
PVDF. Since significant amounts of the comb polymer
segregate to the surface on annealing (the authors quote 45%
surface coverage for only 3% bulk volume fraction), very
little of the comb polymer is necessary in the bulk of the
film, ensuring that the bulk properties of the material are
largely unaffected by the additive. An additional bonus of
this method is that, although the surface layer degrades on
exposure to acidity, further annealing regenerates the
surface, because there is still enough material left in the
bulk to replenish the surface layer. This latter property is
clearly not available with separate coating technologies. An
understanding of the physics of these systems is only present
at the qualitative stage, however, because of the complicated
nature of the molecules involved. At present very little work
involving surface segregation involving branched polymers
[125] (such as combs) and networks [126] has been
undertaken.
3.3.5. Variation of the segregated component
The importance of the substrate surface energy for the
particular domain structure formed during thin film phase
separation was already realised in the early experiments on
this subject [59]. However, these studies were rather
qualitative as they compared substrates of highly different
surface energy. Quantitative studies were first performed by
Genzer and Kramer, who used mixed self-assembled
monolayers (SAMs) made from thiols with two different
end groups [127,128]. In this case the surface energy of the
SAM can be continuously varied via the SAM composition.
Another means to the same end could be achieved by using
random copolymers of varying composition as a substrate
layer or coating [129].
Genzer and Kramer used SAM-coated substrates to
cause a wetting reversal transition in an isotopic blend. They
were able to alter a layering of d-PEP/PEP/d-PEP/SAM into
d-PEP/PEP/SAM [127] by variation of the substrate surface
energy. The kinetics of the transition is particularly
interesting, because it demonstrates the effect of long-
range forces in wetting in polymeric liquid mixtures. In Fig.
21 the structure of an isotopic PEP film for six different
substrate energies is presented. As the substrate energy is
raised, the thickness of the d-PEP wetting layer at the
substrate, ld,SAM decreases. With only short-range forces
present, this would not be possible, as is shown in their
calculations in Fig. 22, where a remarkably abrupt transition
in ld,SAM is predicted. This is not surprising because
calculations have shown a dramatic increase in the effect
of long-range forces as the phase boundary is approached
[110].
Although changing the nature of the substrate is the most
effective means of tailoring wetting properties, it is by no
means the only way. Other experiments on surface
M. Geoghegan, G. Krausch / Prog. Polym. Sci. 28 (2003) 261–302278

segregated layers of isotopic PS blends demonstrated a
similar reversal. By varying the molecular weights of the
polymers, neutron reflection experiments showed that the
surface could be enriched in either d-PS or h-PS [130]. Later
experiments on PS and PB blend films showed that the effect
of Mw on wetting layer reversal was not restricted to isotopic
polymer blends [21]. More recent work on a polyolefin
blend has shown that either component of the blend can
segregate to the surface if 2dF/dfs changes sign for f , 0
(enrichment-depletion duality) [8,131]. Although a wetting
layer may be removed by changing the nature of the
substrate, it is also possible to create a wetting layer only
transiently as the route to a different phase-separated or
dewetted morphology. Such transient wetting has been
reported in different experiments [38,99,107].
3.4. Morphology of surface induced phase separation
One of the major themes concerning wetting in phase
separating systems is the interplay of the surface phase with
the bulk film. The experimental goal in such studies is to
understand the final three-dimensional morphology of these
mixtures. This has already been discussed above with
respect to hydrodynamic flow (Section 3.3.3) but an equally
interesting topic concerns very thin films, in which the
substrate is also playing a role. Such films could also have
useful applications in technology; in one study an
immiscible polymer blend had one component removed
using a selective solvent [132]. The resultant nanoporous
film was observed not to reflect light, a property that might
find application in solar cells, for example.
One of the first studies on phase-separated polymer blend
films was undertaken by Bruder and Brenn [59], who looked
at mixtures of PS and PSxBrS12x on silicon and chromium
substrates. In another early work, as-cast mixtures of PS and
PB were studied using NRA, NR, and TEM to reveal that a
lamellar morphology could be obtained as the PS [133] (and
in some cases PB [21]) wetted the surfaces. It should be
pointed out that there are experiments dating from before the
above that consider the morphology of phase-separated
polymer blend films [54,134].
Blends of PS and PMMA are probably the most studied
immiscible system [132,135–140]. In one study [135], thin
films of blends of PS ðMw ¼ 94:9 kDaÞ and PMMA ðMw ¼
100 kDaÞ were spin cast from a common solvent and the
resultant morphology studied using SFM, where necessary
with the selective dissolution by acetic acid or cyclohexane
to remove the PMMA or PS, respectively, without
disturbing the other component. Since it is very difficult to
find a ternary system (polymer/polymer/solvent), whereby
the solvent is equally good for both of the polymers, it was
interesting to study the effect of different solvents on the
film morphology. The authors also considered the effect of
film thickness. Finally, three different surface treatments
were used for the silicon substrates: the native oxide layer
provided a high energy substrate, low energy substrates
were produced by depositing an alkane SAM on the silicon,
and a surface energy in between these two extremes was
created by depositing a gold layer on the silicon via an
intermediate chrome layer. The three solvents that were
used were tetrahydrofuran (which is nearly a neutral solvent
for the two polymers), toluene (which is a better solvent for
PS) and methyl ethyl ketone (which prefers PMMA). To
summarise the results where the surface energy and solvent
were varied, rounded surface structures were obtained when
Fig. 22. The thickness of the d-PEP-rich wetting layer at the
interface between the isotopic PEP blend and the SAM normalised
by the total film thickness as a function of the substrate surface
energy, g [128]. The solid line represents the best fit utilising long-
range van der Waals forces, and the broken line includes only short-
range forces. This result clearly demonstrates that the behaviour
observed in Fig. 21 is due to long-range forces. Reprinted with
permission from Europhys Lett 1998;44:180. q 1998 EDP Sciences
[128].
Fig. 21. FReS volume fraction profiles for d-PEP in a blend with h-
PEP as the substrate surface energy is increased from (a) 20.5 to (f)
25.6 mJ/m2 after annealing at 314 K for 2 weeks [128]. The broken
lines represent the volume fraction profile before convolution with
the instrumental resolution function. The shaded region underneath
the film represents the location of the SAM. Reprinted with
permission from Europhys Lett 1998;44:180. q 1998 EDP Sciences
[128].
M. Geoghegan, G. Krausch / Prog. Polym. Sci. 28 (2003) 261–302 279

the common solvent used for casting is better for the
polymer with the greater surface energy. In the opposite
case, the casting delivers surface structure with sharp, well-
defined edges. Either the PMMA or the PS preferentially
wetted the substrate, depending on the substrate treatment.
In terms of controlling the morphology of the film, it was
also observed that for thicker films, the lateral phase
separation was considerably larger than is the case for
thinner films. To illustrate this, SFM images of the
morphology of such PS/PMMA blend films are shown in
Fig. 23, whose thickness was varied by altering the spin-
coating speed. In these films, phase separation starts during
solvent evaporation and continues until the film reaches
equilibrium or solvent evaporation has rendered the film
glassy. However, during solvent evaporation the film thins
and geometrical constraints also become important. For this
reason the phase-separated structures become small for
thinner films. As a final remark on this paper, it was noted
that during solvent casting it was also possible that a
dewetting mechanism also existed. The simultaneous
existence of phase separation and dewetting in immiscible
films is extremely difficult to quantify and it is only recently
that workers have started to attempt to understand such
phenomena [141–143].
Although it is accepted that quantitative analysis of spin-
cast films is extremely difficult, there are other ways to
manage this problem. One particularly promising route was
shown in blends of PSxBrS12x and PSyBrS12y [144]. By
tuning x and y, one can vary the miscibility of the blends as
effectively by varying Mw and far more easily than by
adjusting the temperature. When x and y are similar, these
blends are quite miscible, but when x < 1 and y < 0; the
mixture is highly immiscible. As an example we show in
Fig. 24 SFM images of such films, which clearly reveal that
there is much greater phase separation and much sharper
interfaces between the domains when the difference
between x and y is large.
The influence of the confining walls on the final
morphology after annealing has also been studied using
NRA [145]. A blend of random copolymers of ethylene and
ethylethylene was used for these studies. One component
was deuterated and this contained a greater fraction of
ethylene. The films were either cast directly onto a gold
covered silicon wafer, or floated onto a previously heavily
cross-linked (by ion beam irradiation) polyolefin film. In the
former case (on gold), the deuterated component preferen-
tially wetted the vacuum interface and the non-deuterated
Fig. 23. Blends of PS ðMw ¼ 94:9 kDaÞ and PMMA ðMw ¼ 100 kDaÞ
spin cast from toluene onto a gold surface [135]. The films are of
thickness (a) 140, (b) 105, (c) 95 and (d) 80 nm. Clearly, the typical
size of the phase-separated structure increases with film thickness.
The scale bar is 10 mm and in all cases the PS concentration was
50% by weight. Data used from Ref. [135]. Fig. 24. SFM images (the scale bar is 5 mm) of films of blends of
PBr0.91S0.09 ðMw ¼ 393 kDaÞ and d-PBr0.07S0.93 ðMw ¼ 253 kDaÞ
with (a) f ¼ 0:93; (b) 0.78, (c) 0.69, and (d) 0.39. In these films the
blend is highly immiscible and phase separation is well defined. We
also show SFM images (the scale bar is 1 mm) for PBr0.91S0.09
blended with d-PBr0.67S0.33 ðMw ¼ 364 kDaÞ with (e) f ¼ 0:91; (f)
0.72, (g) 0.62, and (h) 0.32 [144]. The deuteration in these blends is
incidental to the physics behind the film morphology. Reproduced
by permission of the Royal Society of Chemistry from Faraday
Discuss 1999;112:285 [144].
M. Geoghegan, G. Krausch / Prog. Polym. Sci. 28 (2003) 261–302280
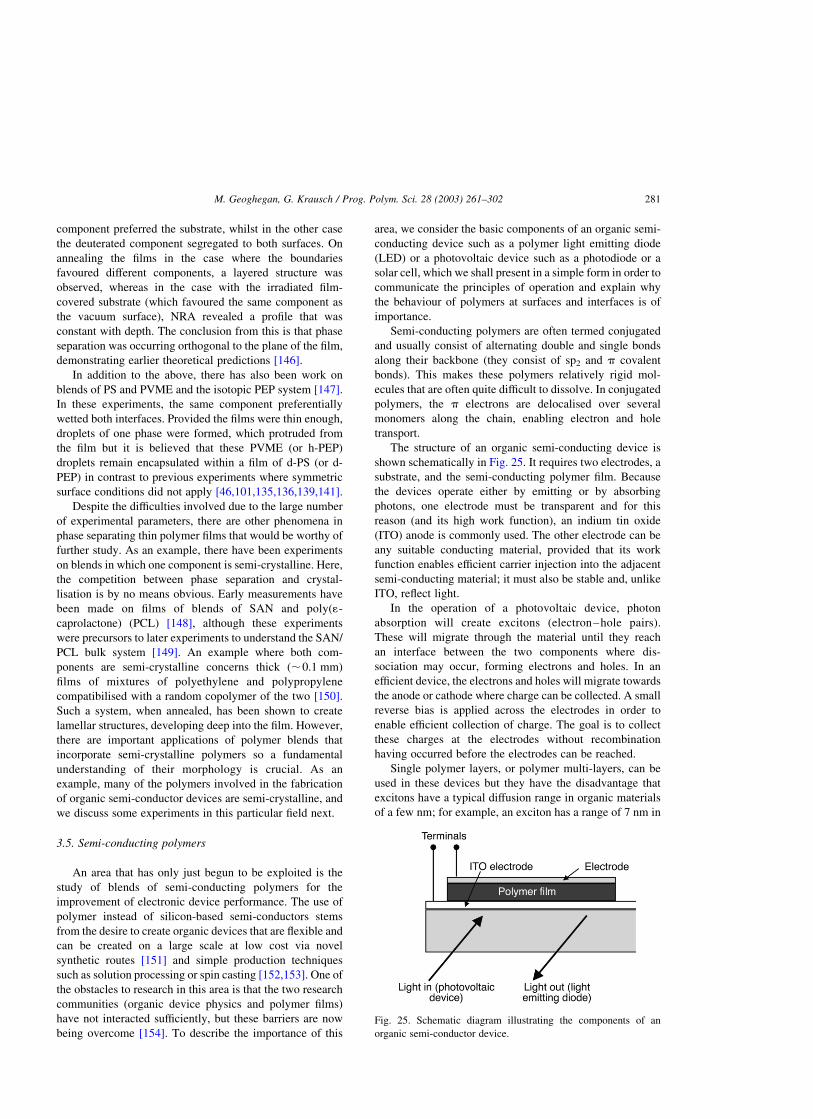
component preferred the substrate, whilst in the other case
the deuterated component segregated to both surfaces. On
annealing the films in the case where the boundaries
favoured different components, a layered structure was
observed, whereas in the case with the irradiated film-
covered substrate (which favoured the same component as
the vacuum surface), NRA revealed a profile that was
constant with depth. The conclusion from this is that phase
separation was occurring orthogonal to the plane of the film,
demonstrating earlier theoretical predictions [146].
In addition to the above, there has also been work on
blends of PS and PVME and the isotopic PEP system [147].
In these experiments, the same component preferentially
wetted both interfaces. Provided the films were thin enough,
droplets of one phase were formed, which protruded from
the film but it is believed that these PVME (or h-PEP)
droplets remain encapsulated within a film of d-PS (or d-
PEP) in contrast to previous experiments where symmetric
surface conditions did not apply [46,101,135,136,139,141].
Despite the difficulties involved due to the large number
of experimental parameters, there are other phenomena in
phase separating thin polymer films that would be worthy of
further study. As an example, there have been experiments
on blends in which one component is semi-crystalline. Here,
the competition between phase separation and crystal-
lisation is by no means obvious. Early measurements have
been made on films of blends of SAN and poly(1-
caprolactone) (PCL) [148], although these experiments
were precursors to later experiments to understand the SAN/
PCL bulk system [149]. An example where both com-
ponents are semi-crystalline concerns thick (,0.1 mm)
films of mixtures of polyethylene and polypropylene
compatibilised with a random copolymer of the two [150].
Such a system, when annealed, has been shown to create
lamellar structures, developing deep into the film. However,
there are important applications of polymer blends that
incorporate semi-crystalline polymers so a fundamental
understanding of their morphology is crucial. As an
example, many of the polymers involved in the fabrication
of organic semi-conductor devices are semi-crystalline, and
we discuss some experiments in this particular field next.
3.5. Semi-conducting polymers
An area that has only just begun to be exploited is the
study of blends of semi-conducting polymers for the
improvement of electronic device performance. The use of
polymer instead of silicon-based semi-conductors stems
from the desire to create organic devices that are flexible and
can be created on a large scale at low cost via novel
synthetic routes [151] and simple production techniques
such as solution processing or spin casting [152,153]. One of
the obstacles to research in this area is that the two research
communities (organic device physics and polymer films)
have not interacted sufficiently, but these barriers are now
being overcome [154]. To describe the importance of this
area, we consider the basic components of an organic semi-
conducting device such as a polymer light emitting diode
(LED) or a photovoltaic device such as a photodiode or a
solar cell, which we shall present in a simple form in order to
communicate the principles of operation and explain why
the behaviour of polymers at surfaces and interfaces is of
importance.
Semi-conducting polymers are often termed conjugated
and usually consist of alternating double and single bonds
along their backbone (they consist of sp2 and p covalent
bonds). This makes these polymers relatively rigid mol-
ecules that are often quite difficult to dissolve. In conjugated
polymers, the p electrons are delocalised over several
monomers along the chain, enabling electron and hole
transport.
The structure of an organic semi-conducting device is
shown schematically in Fig. 25. It requires two electrodes, a
substrate, and the semi-conducting polymer film. Because
the devices operate either by emitting or by absorbing
photons, one electrode must be transparent and for this
reason (and its high work function), an indium tin oxide
(ITO) anode is commonly used. The other electrode can be
any suitable conducting material, provided that its work
function enables efficient carrier injection into the adjacent
semi-conducting material; it must also be stable and, unlike
ITO, reflect light.
In the operation of a photovoltaic device, photon
absorption will create excitons (electron–hole pairs).
These will migrate through the material until they reach
an interface between the two components where dis-
sociation may occur, forming electrons and holes. In an
efficient device, the electrons and holes will migrate towards
the anode or cathode where charge can be collected. A small
reverse bias is applied across the electrodes in order to
enable efficient collection of charge. The goal is to collect
these charges at the electrodes without recombination
having occurred before the electrodes can be reached.
Single polymer layers, or polymer multi-layers, can be
used in these devices but they have the disadvantage that
excitons have a typical diffusion range in organic materials
of a few nm; for example, an exciton has a range of 7 nm in
Fig. 25. Schematic diagram illustrating the components of an
organic semi-conductor device.
M. Geoghegan, G. Krausch / Prog. Polym. Sci. 28 (2003) 261–302 281

poly( p-phenylene vinylene), meaning that an interface
should be no more than 7 nm from where the exciton is
formed if it is to be successfully dissociated and the resultant
charges separated [155]. Polymer blends typically give
better performance than single layer structures [154] and are
certainly less expensive and easier to fabricate than bilayer
structures, and are very often more efficient too, especially
in the case of photovoltaic devices. However, polymer
blends can give rise to undesirable isolated phases rich in
one component within the device. One therefore would like
to create a large interface area between the two phases, each
of which continuously connects towards the respective
electrode. The large interfacial area is important because it
will help to ensure that excitons are never too far from an
interface, where dissociation can occur. A schematic
diagram of the shape of such an interface is shown in Fig.
26(a); similar structures may be achievable via a dewetting
mechanism or by a Mullins–Sekerka wetting instability
[156], although neither of these phenomena are likely to
achieve the narrow structures that would provide optimal
device performance. Of course, by having a flat interface
between two thin layers, one can achieve the requirement
that the excitons are no more than one diffusion length from
an interface, but another advantage of a structure such as
that in Fig. 26(a) is that, compared to a flat interface, a larger
proportion of the volume is within a diffusion length from an
interface. This means that an exciton is less likely to reach
and dissociate at an interface when the interface is flat.
Another advantage of the structure shown in Fig. 26(a) is
that the polymer layer can be thicker than for thin flat
homopolymer layers. This is important because the thicker
the layer, the greater the photon collection efficiency in a
photovoltaic device.
For the operation of an LED, a forward bias is applied
across the polymer blend film by the two electrodes. An
electron from the donor polymer is injected into the
conduction level (by analogy with traditional semi-con-
ductors) at the metal electrode. At the ITO electrode, a hole
is injected and these charges will migrate throughout the
material until they recombine. Recombination may occur
where there are two different chains in close contact, and
often (but not always) this will be at an interface between
two phases. On recombination, electrons and holes will form
an exciton, which will eventually decay via photon
emission. An efficient geometry could have a hole carrier
matrix with a surface segregated or wetting layer of the
electron carrier at the cathode. The surface segregated layer
must be large enough to prevent recombination too close to
the cathode, because this would quench photoemission.
However, a diffuse interface could allow diffusion of the
electrons into the hole-carrying matrix, where an exciton
may eventually be formed. Diffuse (graded) interfaces have
been shown [157] to be appropriate in the fabrication of
LEDs because sharp interfaces can inhibit carrier motion.
This means that, although the principle of operation of
photovoltaic devices and LEDs is similar, the practicalities
of designing the optimal structure are somewhat different;
we present a possible idealised structure in Fig. 26(b). It
must be emphasised, however, that this is a rather new area
of research and these issues are not yet fully resolved; it is
quite possible that the similar structure to that for a
photovoltaic device would work just as well in an LED.
Given the above, it should be clear that phase separation
into non-continuous domains in the bulk of the film is
undesirable. This would inhibit charge transport to the
electrodes and thereby lower the device efficiency. Blends
are needed where the electrodes are wetted almost perfectly
by the required component, but the interface between the
two phases has the required properties; be it a graded
interface, and/or one with a large interfacial area. The
difficulty here is that these kinds of structures are normally
hallmarks of very immiscible mixtures. In the future work
concerned with optimising organic semi-conductor devices,
it will therefore be necessary to not only understand the
wetting and bulk properties of the materials, but also the
interplay between the two. Such experiments are feasible if
an appropriate technique such as nanotomography [41] is
used.
One particularly useful blend for the fabrication of LEDs
is that of poly(styrene sulphonic acid) (PSS) and poly(3,4-
ethylene dioxythiophene) (PEDOT), which is marketed by
Bayer AG (Leverkusen, Germany) as Baytron Pe. The
PSS/PEDOT mixture is used (with the PSS acting as a
dopant to facilitate hole transport) in LEDs, when placed
between an ITO substrate and an electroluminescent
polymer layer. Knowledge of the wetting behaviour of
such films is consequently particularly important. In a first
experiment, particularly rough films were shown by XPS or
ultraviolet photoelectron spectroscopy to have almost
complete segregation of the PSS to the N2 or vacuum
(depending on treatment) surface [158]. More recent
experiments on this blend have used NR measurements of
surface segregation to obtain the surface composition profile
[159]. These experiments are particularly illuminating
because they make it possible for quantitative analysis of
semi-conducting polymer films using the Schmidt and
Binder [55] analysis. This will be particularly interesting
because such rigid molecules are not usually considered in
such a way; the rigidity alters the conformational entropy of
these polymers, resulting in a very large step length for a
random walk chain conformation.
Fig. 26. Schematic diagrams showing possible morphologies which
could be effectively used in the creation of (a) photovoltaic devices
and (b) LEDs.
M. Geoghegan, G. Krausch / Prog. Polym. Sci. 28 (2003) 261–302282
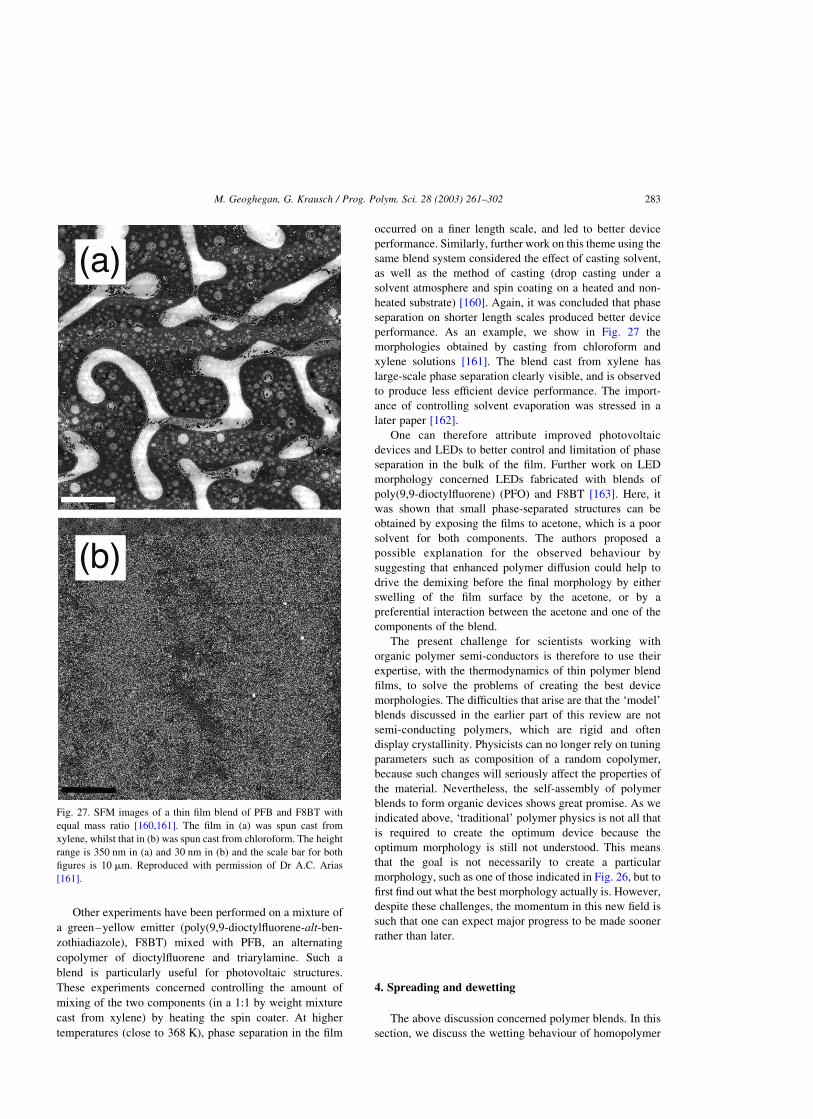
Other experiments have been performed on a mixture of
a green–yellow emitter (poly(9,9-dioctylfluorene-alt-ben-
zothiadiazole), F8BT) mixed with PFB, an alternating
copolymer of dioctylfluorene and triarylamine. Such a
blend is particularly useful for photovoltaic structures.
These experiments concerned controlling the amount of
mixing of the two components (in a 1:1 by weight mixture
cast from xylene) by heating the spin coater. At higher
temperatures (close to 368 K), phase separation in the film
occurred on a finer length scale, and led to better device
performance. Similarly, further work on this theme using the
same blend system considered the effect of casting solvent,
as well as the method of casting (drop casting under a
solvent atmosphere and spin coating on a heated and non-
heated substrate) [160]. Again, it was concluded that phase
separation on shorter length scales produced better device
performance. As an example, we show in Fig. 27 the
morphologies obtained by casting from chloroform and
xylene solutions [161]. The blend cast from xylene has
large-scale phase separation clearly visible, and is observed
to produce less efficient device performance. The import-
ance of controlling solvent evaporation was stressed in a
later paper [162].
One can therefore attribute improved photovoltaic
devices and LEDs to better control and limitation of phase
separation in the bulk of the film. Further work on LED
morphology concerned LEDs fabricated with blends of
poly(9,9-dioctylfluorene) (PFO) and F8BT [163]. Here, it
was shown that small phase-separated structures can be
obtained by exposing the films to acetone, which is a poor
solvent for both components. The authors proposed a
possible explanation for the observed behaviour by
suggesting that enhanced polymer diffusion could help to
drive the demixing before the final morphology by either
swelling of the film surface by the acetone, or by a
preferential interaction between the acetone and one of the
components of the blend.
The present challenge for scientists working with
organic polymer semi-conductors is therefore to use their
expertise, with the thermodynamics of thin polymer blend
films, to solve the problems of creating the best device
morphologies. The difficulties that arise are that the ‘model’
blends discussed in the earlier part of this review are not
semi-conducting polymers, which are rigid and often
display crystallinity. Physicists can no longer rely on tuning
parameters such as composition of a random copolymer,
because such changes will seriously affect the properties of
the material. Nevertheless, the self-assembly of polymer
blends to form organic devices shows great promise. As we
indicated above, ‘traditional’ polymer physics is not all that
is required to create the optimum device because the
optimum morphology is still not understood. This means
that the goal is not necessarily to create a particular
morphology, such as one of those indicated in Fig. 26, but to
first find out what the best morphology actually is. However,
despite these challenges, the momentum in this new field is
such that one can expect major progress to be made sooner
rather than later.
4. Spreading and dewetting
The above discussion concerned polymer blends. In this
section, we discuss the wetting behaviour of homopolymer
Fig. 27. SFM images of a thin film blend of PFB and F8BT with
equal mass ratio [160,161]. The film in (a) was spun cast from
xylene, whilst that in (b) was spun cast from chloroform. The height
range is 350 nm in (a) and 30 nm in (b) and the scale bar for both
figures is 10 mm. Reproduced with permission of Dr A.C. Arias
[161].
M. Geoghegan, G. Krausch / Prog. Polym. Sci. 28 (2003) 261–302 283

thin films on surfaces. In order to fully understand
homopolymer wetting, one also needs to know the
circumstances under which a film breaks up (dewetting).
There is an enormous amount of work on the subject, which
is well beyond the scope of this article. The interested reader
will find further information in the reviews by de Gennes
[10], Krausch [164] and Findenegg and Herminghaus [165]
as well as the more recent article by Seemann et al. [166]. In
this section we limit ourselves to a few examples illustrating
some important ideas, as well as future directions that will
be significant.
4.1. Spreading
The wetting transition, which was discussed above for
polymer blends, is also important in thin films of
homopolymers. As an example we consider the experiments
by Maas et al., who studied the wetting behaviour of a PS
film on a grafted PS layer (brush) [167]. The brush was
created by the strong spontaneous adsorption of the polar
poly(2-vinyl pyridine) (PVP) block of a PS-block-PVP
diblock copolymer to an oxidised silicon substrate. The
authors observed both stable and unstable homopolymer
films depending on the grafting density of the brush layer.
For low grafting densities the films were unstable, while for
higher grafting densities stable films were found. For very
large grafting densities, the PS homopolymer film suffers
conformational restrictions and autophobic dewetting
occurs [168]. The instability at low grafting densities was
caused by a large repulsion of the PS homopolymer with the
PVP block of the copolymer. However, for grafting
densities within the range studied in this work both droplets
and stable thin PS layers were observed in the same film
corresponding to a wetting transition. However, droplets
were also observed to be in local equilibrium with somewhat
thicker layers, which was unexpected, demonstrating the
complexities involved in the study of wetting.
We have mentioned before in this review the importance
of wetting to industrial applications. A good example of
work in this direction concerns the enhancement of wetting
in small molecule liquids by the addition of polymers [169].
The issue considered here is the use of pesticides on plants,
which are well known for their ability to cause water to
bounce off their leaves. Past methods of dealing with this
problem involve the use of organic solvents, which wet the
surface more readily. However, the use of such toxic
materials is best avoided for environmental reasons. By
adding a water-soluble polymer, poly(ethylene oxide)
(PEO), it was possible to change the behaviour of a droplet
on hitting a surface. The polymer additive changes the liquid
flow from simple Newtonian to a non-Newtonian behaviour.
On hitting a hydrophobic surface, a droplet of a Newtonian
fluid begins to coat that surface as its weight counters any
repulsion due to the incompatible surface energies.
However, as the energy due to gravity is dissipated, the
surface tension causes the droplet to retract again, a process
which may occur so rapidly as to reject some water through
a rebound, causing loss. The addition of polymer may slow
down this retraction by lowering the surface tension and/or
by changing the viscosity of the fluid. The surface tension of
the liquid was not significantly altered by the presence of a
small amount of polymer additive. However, rheological
experiments showed that the elongational viscosity of the
solution was greatly increased by the polymeric additive,
slowing the retraction and thereby increasing the effective-
ness of the surface coating.
The spreading of polymer films from solution into
ordered structures is a powerful and simple method to create
polymer nanostructures. As an example silicon and
aluminium nanotubes were placed in a polymer solution
so that the polymer could coat the nanotube templates [170].
After coating, the nanotube templates could be removed by
etching in aqueous KOH solution. Polytetrafluoroethylene,
PS, and PMMA nanotubes were all created in this way.
The opposite situation, whereby a droplet can be made
completely incompatible with a surface should also be
possible. This has already been achieved with a fluorinated
powder additive to a water mixture causing complete
hydrophobicity with a glass substrate [171]. In contrast to
the above situation, in this case the additive segregates to the
surface of the fluid and changes in surface tension dominate
over rheological effects. Another study by the same group
has shown how lithographed surfaces can be used to create
nearly spherical droplets ‘pearl drops’ [172]. This is due to
the observation that, depending on the interaction between
the fluid and the substrate, a microscopically ‘spiked’
surface can dramatically worsen (or improve) wettability.
4.2. Dewetting
As we have pointed out above, if one is to understand
how a polymer wets a surface, it is necessary to understand
what causes a polymer films to dewet surfaces. However, the
amount of published work essentially means that dewetting
deserves a review in its own right, and we restrict ourselves
here to a summary of some of the most important aspects of
dewetting.
4.2.1. Spinodal dewetting
One of the first quantitative studies of the dewetting of
polymer films is also probably the simplest experiment.
Reiter [173] used optical microscopy to observe the break-
up of PS films on silicon substrates as a function of film
thickness. In these experiments, Reiter pointed out that the
break-up of the films could be reasonably well explained as
a spinodal process (spinodal dewetting) [106,174], whereby
long-range van der Waals forces cause an amplification of
film thickness fluctuations eventually resulting in film
break-up. Intuitively, it may be difficult to see how long-
range van der Waals forces can cause film break-up since
they are always attractive, and would seem to encourage
film stability. However, if the attractive interaction between
M. Geoghegan, G. Krausch / Prog. Polym. Sci. 28 (2003) 261–302284

a film and surrounding medium is weaker than the substrate
and the surrounding medium, then the film will break-up.
The details of the simple calculation of the attractive energy
between two planar surfaces are reviewed elsewhere [175]
and the result is (per unit area at a separation x )
WvdW ¼ 2AH
12px2; ð13Þ
where AH is the Hamaker constant describing the interaction
between the two surfaces. Different authors use a different
sign convention for the corresponding forces and the reader
is therefore advised caution. The dispersive forces driving
the dewetting are counterbalanced by the inherent energy
cost having a large interface. As a result of the competition
between these two terms, a dominant wavelength l emerges,
which grows faster than any other unstable wavelength
[174]. Films are, however, stable to thickness fluctuations
below a critical wavelength, given by l/2. Should the
polymer film be confined to an area smaller than the
dominant wavelength, then the spinodal dewetting is
suppressed [176]. Spinodal dewetting is not, however, a
phenomenon unique to polymer films and has been convin-
cingly identified earlier in thin metal films [177].
The identification of spinodal dewetting as a mechanism
for the break-up of polymer films has been further pinned
down by SFM measurements of PS films on silicon [178]. In
these experiments, the authors determined the fastest
growing length l as a function of film thickness. In this
case the experiments showed uniformly distributed surface
undulations in contrast to the random distribution of holes
observed by Reiter [173]. There have been several other
studies of the dewetting of PS from silicon substrates [166,
179–190], although not all of these are attributable to
spinodal dewetting. NR measurements on the interface in
bilayers of PMMA on PS [52] showed convincingly that the
fastest growing length scale had the expected inverse square
behaviour on PMMA film thickness. Moreover, their results
were not inconsistent with the expected inverse sixth power
behaviour of the rise time of the instability on the PMMA
film thickness. These results were obtained by analysing the
off-specular reflection; specular reflectivity was used to
describe the surface and interfacial roughness as a function
of time. Later work concerned in situ NR measurements to
investigate the time dependence of the spinodal dewetting
[191].
An important aspect of spinodal dewetting, which may
be exploited in future work, is the ability to create patterned
structures with a given dominant length scale. This has
already been extensively theoretically discussed [192–196].
Spinodal dewetting has already been used to create
structured patterns [197], where the simple act of rubbing
a substrate imposed a preferred orientation on the dewetting
process and PMMA was observed to dewet from PS to form
a corrugated structure (Fig. 28). This provides a clear
analogy with surface-directed spinodal decomposition [5]
because the nucleation point only triggers the dewetting or
phase separation, but does not impose a length scale; the
system itself chooses its own preferred length scale from the
thermodynamics.
Another means by which self-assembly due to spinodal
dewetting can be used to create intricate patterns is due to
chemical inhomogeneities in the substrate [192,193,198,
199]. In very thin films, where spinodal dewetting is a rapid
process, such structure formation may well be quite
common and difficult to control. As an example, we show
in Fig. 29 the dewetting structure of a thin bilayer of PMMA
on PS as measured by SFM. The origin of this instability
may well be due to heterogeneity in the substrate.
Theoretical work has shown how such patterns may form
[192,193,199], and also that their formation can be much
more rapid than the usual spinodal dewetting process. In this
case, one might consider an imperfection, possibly only a
few micrometres in size, on the silicon substrate causing a
chemical heterogeneity. Only a small patch is necessary to
induce a gradient in chemical potential along the substrate.
This gradient will induce rupture in the film, in this case, the
PS layer. The rim of the hole formed in the initial stages of
rupture results in thickness fluctuations in the film, which
can result in a spinodal mechanism taking over, with long-
range pattern formation resulting. However, this discussion
can only be the basis of a true explanation because the PS is
sandwiched between PMMA and silicon, neither of which
will be passive in the dewetting process. Further related
theoretical work on this subject concerns chemical patterns
on the substrate, rather than simple heterogeneities [200,
201]. We discuss experiments related to pattern formation
on structured substrates in Section 5.
Fig. 28. Fifteen nanometre-thick of film of PMMA dewetting from a
300 nm film of PS (respective molecular weights of 112 and
259 kDa) after annealing at 423 K for 1 h. By imposing an
orientation on the glass substrate (by gently rubbing it in one
direction with a lens cleaning cloth) prior to spin coating and
floating the PMMA film onto water, it is possible to create oriented
dewetting [197]. The scale bar is 20 mm. Figure supplied by Dr
A.M. Higgins.
M. Geoghegan, G. Krausch / Prog. Polym. Sci. 28 (2003) 261–302 285

The stability of polymer films on highly incompatible
substrates has also been considered with thin films of
polystyrene near its glass transition on PDMS-coated silicon
substrates [202]. Although the PS film is close to its glass
transition, the speed of film rupture is much more rapid than
one would expect given the viscosity of the polymer in the
bulk state. As well as the rapid kinetics, the shape of the hole
also differs from previous experiments. Possible expla-
nations of these results have been provided, with sugges-
tions of mechanisms due to a plastic deformation [203] or
shear thinning [204].
Experiments concerning spinodal dewetting of polymer
films need not be limited to the simple air (or inert gas or
vacuum)/polymer film (or bilayer)/substrate geometry.
There is also the possibility of immersing the entire system
in a fluid (for example, water) to change the very nature of
the polymer–substrate interactions. Such experiments have
been performed successfully with thin films of PDMS on a
silicon substrate compatibilised with a PDMS brush
[205–208]. These experiments showed that the strength of
the interaction was much larger than expected from
calculations [207], and was even large enough to destroy
the chemically grafted brush layers [206]. Further evidence
of the remarkable strength of these interactions was
observed when a PS film was placed on the PDMS in
water as a surrounding medium [209]. In this case, the PS
film was deformed due to the rupture of the PDMS brush
below it. Another way to control the interaction of a polymer
film with its substrate is to add a copolymer one component
of which prefers the substrate, and the other the film. First
experiments along these lines have recently been published
[210]. These experiments are nice examples for a situation
where the knowledge of surface segregation, discussed in
the beginning of this article, is utilised to improve film
stability against dewetting.
An interesting alternative to immersing a polymer film
on a substrate into some liquid is to perform experiments on
freestanding films. Experiments have been performed on
hole growth and rupture in freestanding PDMS [211,212]
and PS films [213], all of which show how viscoelastic
behaviour plays an important role in the rupture of the films.
Freestanding PS films were also studied after coating with
thin layers of silicon oxide [214,215]. The films were
annealed such that the PS remained in the molten state,
whilst the SiOx coating remained solid, causing a mechan-
ical confinement of the films. Dispersion forces (i.e. van der
Waals forces) cause the film to crumple, although the
resistance provided by the SiOx layers limits this effect. An
optical microscopy image of a PS film coated with two SiOx
layers is shown in Fig. 30. The minimisation of the total free
energy confers the annealed film with its characteristic
wavelength of ,6 mm. By equating the pressures induced in
the film due to dispersion and bending forces, the authors
were able to derive a simple scaling law, which was
supported by their data and showed that the wavelength of
the instability behaved as
l/L3=4
x þ 2L; ð14Þ
where L is the thickness of the two SiOx capping layers and x
is the thickness of the PS film. The constant of proportion-
ality depends on the Young’s modulus and Poisson’s ratio of
the capping layer as well as the Hamaker constant for the
system. Although these films were freestanding, the issue of
dewetting in a deformable medium (such as the SiOx or the
other layers used in the above study) is an important issue
that has been discussed both theoretically [216–218] and
experimentally [209,218].
4.2.2. Nucleation and growth
In the above, experiments concerned with how long-
range forces can cause a film to rupture and break-up were
Fig. 29. Dewetting of a PMMA (Mw ¼ 23:8 kDa; ,30 nm thick)
film from PS (Mw ¼ 166 kDa; originally ,15 nm thick) on silicon.
The SFM images (a, b, d and e) were taken after the PMMA had
been selectively removed with acetic acid. The dewetting structure
was obtained after annealing for (a) 15 min and (b, c, d and e) 24 h
at 443 K. In (a), the highest points are some 50 nm above the lowest
regions of the film; the other height scales are (b and e) 100, (c) 40
and (d) 80 nm. The lateral scales are 10 mm £ 10 mm (a and b) and
20 mm £ 20 mm (e). In (d) we show a scan of part of the film in (e).
The image in (c) is a scan over the same region as in (d) but before
acetic acid washing (so the PMMA is still present on the surface).
M. Geoghegan, G. Krausch / Prog. Polym. Sci. 28 (2003) 261–302286

briefly discussed. Many polymer films are metastable and
break-up by the thermal nucleation of holes, or by
nucleation at impurities or dust particles in the film or on
the substrate. The key to whether or not a film is stable on a
given substrate is given by Young’s equation [219] for the
spreading coefficient,
S ¼ gB 2 ðgAB þ gAÞ; ð15Þ
where gA, gB, and gAB are the surface energies of the
polymer film, substrate, and film–substrate interface,
respectively (Fig. 31). If the spreading coefficient is
negative, then the film is unstable. Scaling laws have been
presented to describe the behaviour of the dewetting speed
as a function of film thickness [174], and these were
developed and tested using films of PDMS on silicon
substrates [220].
A particularly interesting subject is that of the dewetting
from the interface between two liquids [164]. Although
spinodal dewetting at liquid–liquid interfaces has also been
experimentally [221] and theoretically [106] discussed, we
restrict ourselves here to experiments on nucleated dewet-
ting. In this case, the upper film will deform the lower film
as it dewets, and one note that both the horizontal and
vertical component of the capillary force must vanish at the
contact line. This is described by the von Neumann
construction (Fig. 31(b)) and can be written in the limit of
small contact angles as
gAQA ¼ gABQB; ð16Þ
where QA and QB are the contact angles defining the
deformation into the upper and lower film, respectively. In
order to study such deformation in films of PS on PMMA,
the PS top layer was removed by selective dissolution in
cyclohexane [34]. In these experiments, the dewetting speed
was measured as a function of substrate viscosity, and it was
found that the speed exhibited a minimum. The authors
performed SFM measurements before and after selective
dissolution of the PS, the latter giving insight into the shape
of the initially buried PS/PMMA interface. They identified a
crossover between a liquid substrate and a solid substrate. In
the liquid substrate regime, the rim of the dewetting PS layer
deforms the PMMA film (Fig. 31(b)), leading to holes
growing as t 2/3 [106,222]. For larger PMMA molecular
weight, the PMMA behaves like a solid substrate (Fig.
31(a)), i.e. the holes in the PS film grow rapidly in
comparison to movement in the much higher viscosity
PMMA substrate. In this case, a constant dewetting speed is
observed in agreement with the theoretical expectation
[174]. Further work on this system provided a quantitative
investigation of the dewetting speed as a function of
polymer molecular weight [223] and film thickness [224]. In
Fig. 32, we show SFM scans of a PS film dewetting a
PMMA lower layer, before (Fig. 32(a)) and after (Fig.
32(b)) cyclohexane etching. A line scan of the same hole
before and after etching shows how one can obtain the
complete three-dimensional morphology of the hole,
revealing the PS–PMMA–N2 contact line (Fig. 32(c)). In
these studies, the dewetting speed is well explained by
simple scaling theory [106]. However, experiments on
bilayers of polycarbonate (PC) on a SAN copolymer are not
in agreement with the theory. The discrepancies include a
rate of hole growth in some films, which increased with
annealing time [225,226]. It is quite possible that the
interaction (miscibility) of the two layers plays an important
role because it appears that PS and PMMA are more
immiscible than PS and SAN.
4.2.3. Autophobicity
We return to our discussion of the wetting properties of
homopolymer films on polymer brushes. As mentioned
briefly above, there are situations when the polymer would
want to dewet the brush itself for purely entropic reasons.
Because the brush and film are of the same chemical species,
one expects a certain miscibility between the two. However,
depending on the molecular weights and the grafting
density, it is possible that conformational restrictions will
force the polymer to dewet a dense brush. These
conformational restrictions can be relaxed by using shorter
homopolymer chains, or lowering the grafting density. It has
also been theoretically demonstrated that a bimodal brush
Fig. 31. Schematic diagram illustrating the criteria for dewetting on
a (a) flat solid substrate and (b) deformable liquid substrate. If there
is a finite contact angle, Q the spreading coefficient (Eq. (15)) is
negative and the film will dewet the substrate at equilibrium. In the
case of a liquid substrate there are two contact angles, which can be
used to describe the requirement that the vertical component of the
capillary force must vanish at the contact line (Eq. (16)).
Fig. 30. Optical micrograph of a freestanding PS film capped by
evaporated SiOx layers [215] after annealing at 483 K for 3 h. The
scale bar is 20 mm. Image provided by Professor K. Dalnoki-Veress.
M. Geoghegan, G. Krausch / Prog. Polym. Sci. 28 (2003) 261–302 287

can suppress autophobic dewetting by broadening the
brush/polymer interface [227].
Early experiments showed that PS films would entropi-
cally dewet a PS brush created by adsorption of a PS-block-
PVP diblock copolymer [168] or PS chemically grafted to
the silicon substrate [228,229]. Another study of such
autophobic behaviour replaced the brush by a cross-linked
film. In these studies [230,231], a polyolefin film was
transferred onto a cross-linked film of the same material.
Cross-linking was achieved by a-particle irradiation. For
high enough cross-link densities, the authors observed
complete wetting, which was attributed to roughening of the
network surface. At moderate cross-linking densities
autophobic dewetting was observed, whilst complete
wetting was recovered at low cross-linking densities.
Although the conclusions of these studies probably stand
up, it should be pointed out that, compared to for example,
proton-irradiated networks [232], such a-irradiated net-
works are very difficult to characterise [233] due to the
effect of chain scission and radical formation. The high
doses used (fluences of up to 1015 ions cm22), and the large
energy loss of a-particles imply that the highly cross-linked
systems are not chemically identical to the films placed on
top of them.
The study of autophobic behaviour has now matured
considerably and recent work includes quantitative studies;
for example, the kinetics of dewetting of PDMS films from
chemically identical brushes measured in situ [234,235]. In
another study, it was shown how PS, end-terminated with a
sulphonate group, can create a densely packed brush layer,
from which the remainder of the end-terminated PS film
autophobically dewets [236].
4.2.4. Other forms of dewetting
It has also been shown that polymer films can dewet
wettable substrates [237]. In this case, PEP films were
observed to dewet silicon substrates, when the film thickness
became less than the polymer radius of gyration. This points to
the importance of understanding the nature of the confor-
mational entropy of a polymer chain in a thin polymer film, and
whether or not it is the same as that in the bulk. Simple theory
suggests that there is no entropy cost in having a chain at the
surface [238], whilst more detailed work considers the small
entropy cost due to chain ends [239]. Monte Carlo simulations
also support the suggestion that there are deviations from the
bulk conformation in thin films [240]. Recently, experiments
have addressed this problem [241–245]. We shall return to this
issue in the context of dewetting from corrugated substrates
below [185]. It has also been theoretically demonstrated that
fluctuations in density, perhaps due to composition fluctu-
ations in a polymer blend, or a film close to a critical point, can
initiate dewetting on a wettable substrate [246]. As yet, there
has been no experimental demonstration of this mechanism.
Other mechanisms for dewetting are possible and we
briefly mention some here. A Marangoni flow mechanism of
dewetting has been proposed to explain dewetting in an
immiscible oligomer blend [247]. After phase separation had
commenced, this mixture dewetted inwards from the outside
of the sample. Another unusual example concerned thick
polybutadiene films placed on a liquid crystalline polymer
[248] in which the dewetting behaviour depended on the phase
of the liquid crystalline polymer below. The authors measured
both the advancing (spreading) and receding (dewetting)
contact angles [175] and observed that the receding contact
angle dropped somewhat on passing from the smectic to the
isotropic phase. The advancing contact angle, however, was
found to be independent of temperature. Finally, it has recently
been shown using bilayers of PS on PMMA on silicon
substrates that electric fields can induce a spinodal instability
that causes rupturing of the PS layer [249]. In these
experiments, 60 V applied across two electrodes ,2 mm
apart is enough to destabilise ,300 nm thick films of PS on
similarly thick PMMA layers.
5. Pattern formation by structured substrates
So far we have largely dealt with the wetting properties
of free surfaces and laterally homogeneous substrates. In
recent years, however, the study of patterned substrates and,
Fig. 32. (a) SFM image of a hole in a 270 nm film of PS ðMw ¼ 32
kDaÞ dewetting from a 500 nm film of PMMA ðMw ¼ 31 kDaÞ after
annealing at 435 K for 990 min in nitrogen atmosphere. (b) The same
hole as in (a) but after washing in cyclohexane to remove the upper PS
layer. (c) Section through this hole; the black line in the SFM scans
shows the location of the section. The large size of the hole means that
the complete rim has not been imaged. These images form part of a
study of dewetting at the polymer–polymer interface [224]. SFM
images were provided courtesy of Dr C. Wang.
M. Geoghegan, G. Krausch / Prog. Polym. Sci. 28 (2003) 261–302288
in particular, the interplay between the length scales
provided by the substrate pattern and the inherent length
scale of the (de)wetting process has become an area of
intensive research. Such substrate patterns may be topo-
graphical and/or chemical in nature. The idea of what may
best be called ‘structured wetting’ dates back to the early
1990s, when Whitesides and co-workers demonstrated that
microscopic liquid structures are created spontaneously in a
liquid film on a substrate exhibiting lateral variations of
surface energy [250,251]. In recent years, beautiful
quantitative studies along these lines were reported by the
Herminghaus group in Ulm [252]. These authors used a
mask to enable the patterned deposition of a hydrophilic
MgF2 layer onto a hydrophobic silicone rubber. They
showed that water follows the path of the hydrophilic
component on the substrate and studied the stability of the
resulting liquid structures as a function of the amount of
water condensing onto the substrate. Along with the
experimental work, theoretical calculations were performed
which nicely agreed with the experimental observations
[253].
The first reported use of patterned substrates for the
creation of polymeric microstructures was by Krausch in
1995 [7]. The authors studied phase separation in a polymer
blend in the presence of a laterally patterned substrate.
Micron size metal lines were prepared lithographically on a
silicon substrate. Thin films of a blend of PS and partially
brominated PS were cast onto these substrates. The polymer
domains formed on phase separation were found to align
with the underlying line pattern, while laterally isotropic
domain structures were observed on homogenous parts of
the substrate. Later, Boltau et al. [137] continued work
along these lines and carried the substrate driven domain
alignment to some perfection. They studied various
immiscible polymer blends (e.g. PS/PSxBrS12x and PS/
PVP) in the presence of lateral patterns of surface energy.
By selective dissolution of one of the phases after phase
separation was completed, they were able to transcribe a
surface energy pattern into a topographic pattern in a
polymer film. For perfect replication of the underlying
structure, the inherent domain size formed during phase
separation had to match the lateral size of the substrate
pattern. Since the former is a function of the film thickness
[135], for any given structure size on the substrate an
optimum film thickness was identified. If the films were too
thick, the domains were too large and did not follow the
underlying grating. In thinner films, on the other hand,
the domains are too small and recognise the small parts of
the substrate pattern as homogenous substrates. Again, no
pattern transfer was possible.
Another polymer blend, which has been shown to have
its phase separation controlled by a surface energy pattern is
a mixture of PB and PS [254]. In this work, thin (,70 nm)
films of the blend were observed to follow a template
created by microcontact printing of SAMs on silicon
substrates. At about the same time Nisato et al. [255,256]
reported on a similar study, which in addition to the work
quoted above addressed the time development of the thin
film domain structures in the presence of a laterally
patterned substrate. Later work on two blends, PVP/
PSxBrS12x and PS/PVP, blends used dynamic SIMS and
SFM to quantify the topography and morphology on a SAM
microcontact printed onto gold [257]. Here, the effective-
ness of pattern transfer as a function of the size of
phase-separated domains was studied, with the best results
being obtained when the pattern length scale is the same as
that of the phase-separated morphology.
In the above-mentioned studies, the structural size of the
patterned substrates was significantly larger than the
molecular length scales of the (polymeric) liquid film.
Given the rather large size of individual polymer molecules,
it is tempting to study the wetting behaviour of thin polymer
films on substrates exhibiting a lateral structure of
comparable size. Various approaches have been reported
aiming towards this direction. Obviously, the preparation of
the patterned substrate becomes somewhat more involved
when lateral scales of order 10 nm rather than microns are
striven for. Electron beam lithography would in principle be
able to create such structures, however, at high cost and on
small areas only. Alternatively, self-organisation processes
can be employed for substrate generation.
A quite elegant way to create a patterned substrate by
self-organisation uses the well-established effects of surface
reconstruction on silicon surfaces [258–260]. Here, surfaces
of silicon single crystals are prepared with a surface
orientation slightly off a low index crystal axis. Under
suitable conditions (ultra-high vacuum annealing at around
1120 K), the surface develops facets of low index crystal
planes. As an example, a silicon surface cut slightly off the
k113l direction towards the k001l direction will develop a
shallow sawtooth surface structure consisting of adjacent
(113) and (114) facets. The angle between adjacent facets is
5.88. When cooled to room temperature and exposed to air, a
thin layer of native oxide forms on top of the facets, leaving
the surface topography unchanged. An example of such a
corrugated silicon substrate is shown in Fig. 33 [185].
Depending on the annealing time and temperature, the mean
spacing between the corrugations along with their mean
depth can be varied between some ten and some hundred
nanometres. Such substrates were first used by Fasolka et al.
to study their influence on the microdomain structure in
diblock copolymer thin films [261]. Later, Rockford et al.
showed that in addition to the topographical pattern, a
chemical heterogeneity could be created on the corrugated
silicon substrates by glancing angle metal evaporation [138,
262]. On these substrates, the authors studied the wetting
behaviour of homopolymers, homopolymer blends, and
diblock copolymers.
When a thin enough homopolymer film is coated on top
of a corrugated substrate, the film is found to rupture into
what may be called polymer ‘nanochannels’ (Fig. 34). This
effect was first shown by Rehse et al. [185]. The results were
M. Geoghegan, G. Krausch / Prog. Polym. Sci. 28 (2003) 261–302 289

surprising in that a PS film would only wet the corrugated
substrate if the film thickness in the thinnest regions (tpeak,
the thickness above the peaks of the corrugations) was more
than about half of the chain radius of gyration. In Fig. 35 we
show the stability phase diagram for thin PS films of
differing Mw on these corrugated substrates as a function of
tpeak. Above the line of stability, tpeak ¼ 0:55Rg the films
remain stable after annealing, whereas for thicknesses
smaller than 0.55Rg, dewetting is observed. Test experi-
ments on flat substrates, indicated by solid symbols in Fig.
35, exhibit the same behaviour, with thinner films dewetting
the substrate and thicker ones remaining stable, although
here there are not enough data to confirm a Mw dependence.
Unstable films ruptured along the crests of the corrugation to
form ordered nanochannels filling the valleys. The expla-
nation of the stability phase diagram of these thin polymer
films as a function of chain size is not wholly clear.
Confinement effects appear to play a role, as was the case in
the earlier experiments on topographically and chemically
homogeneous substrates briefly mentioned above [237], but
the effect of film preparation also needs to be considered. If a
chemical heterogeneity is added to the topographical pattern
by evaporation of Au on every other facet, the results look
similar [138]. However, closer inspection of the ruptured
films reveals that the nanochannels no longer fill the grooves
symmetrically but preferentially cover the Au coated facets
(Fig. 36) [185]. This effect can be understood given the wetting
properties of PS on both SiOx and Au, respectively [263].
Rockford et al. reported on quite interesting results
regarding homopolymer blend thin films prepared on a
corrugated and chemically patterned silicon substrate [138].
The chemical pattern is due to an evaporated gold layer on
one side of each facet. The authors investigated the effect of
the nanoscopic substrate pattern on the domain morphology
of blends of PS and PMMA. On micron scales, an isotropic
domain pattern appeared quite similar to a homogenous
substrate with no preferential attraction to either of the two
polymers. Here, the patterning resulted in a ‘neutralisation’
of the substrate, while homogenous surfaces of both SiOx
and Au are known to attract PMMA and PS, respectively
[135]. After selective removal of the PMMA phase,
however, the authors found that in the immediate vicinity
Fig. 33. SFM Tapping Modee topography image of a corrugated
silicon surface of the type used for previous wetting experiments
[138,185,261,262]. The scale bar is 4 mm, and the peak-to-valley
distance (height) is ,5 nm. In the inset, a three-dimensional image
of a 2 mm £ 2 mm area is shown. Note that the height scale and the
lateral scales are different, strongly exaggerating the aspect ratio of
the surface structure. (These results are taken from the paper by
Rehse et al. [185].) Reprinted with permission from Eur Phys J E
2001;4:69. q 2001 EDP Sciences [185].
Fig. 34. (a and b) SFM TappingModee topography images (the
scale bar is 2 mm) of a thin PS film (Mw ¼ 100 kDa and average
thickness, tav ¼ 5 nm) on a corrugated silicon substrate after
annealing at 423 K for 3 h [185]. The film has broken into linear
channels following the grooves of the substrate. The area shown in
(b) is a 1.5 mm £ 1.5 mm scan. (c) Average line scan along the
horizontal taken from the image (b). The solid line is
the experimental result. The dashed line depicts the position of
the substrate surface. Reprinted with permission from Eur Phys J E
2001;4:69. q 2001 EDP Sciences [185].
M. Geoghegan, G. Krausch / Prog. Polym. Sci. 28 (2003) 261–302290

of the substrate, laterally directed separation of PMMA and
PS had taken place with PS selectively adsorbing onto the
Au lines. Therefore, the presence of the nanoscopic grating
indeed reduced the length scale of phase separation down to
the molecular level.
Fukunaga et al. obtained similar results by using a quite
different route of substrate patterning [264]. The authors
adsorbed linear triblock copolymers of PS, PVP, and
PtBMA onto the SiOx surface of a silicon wafer. Since
PVP strongly physisorbs on the polar substrate, the resulting
film can be thoroughly washed to remove all loosely bound
material. The resulting polymer brush consists of PS and
PtBMA end blocks bound to the substrate by the PVP
middle block. The PS and PtBMA blocks microphase separate
and create a surface pattern of characteristic lateral spacing.
The authors studied the wetting behaviour of thin films of a
homopolymer blend of PS and PtBMA on such surfaces and
observed that the domain size was significantly reduced in thin
enough films (Fig. 37). A simple estimate of the interfacial
energies involved predicts that the effect of the nanoscopically
patterned substrate should influence the domain size up to a
film thickness of about a quarter of the characteristic lateral
spacing in agreement with the experimental observation.
The authors also demonstrated that for thin enough films the
effect of domain size reduction by the substrate is
significantly more effective than the addition of PS-block-
PtBMA copolymers acting as polymeric surfactants.
6. Outlook and conclusions
In this review much of what we have discussed concerns
the fundamental physical processes that are important in the
wetting behaviour of thin polymer films. Although there are
still gaps in our knowledge, many of which have been
alluded to elsewhere in this review, the subject is relatively
well understood. In the section of dewetting, we discussed
how various instability mechanisms could be used to
generate pattern formation. The ways that patterned
substrates could play a role in controlling the morphology
of polymer films were discussed in the following section.
We believe that such work will be more prevalent in the
years to come as the fundamental understanding acquired
during the previous 10 years, along with new fabrication
procedures, is put to use. To conclude we summarise a few
experiments that we believe will play an important role in
future work involving the wetting of polymer films.
There are two directions to the research that we believe
will dominate wetting phenomena in polymers in the years
to come. We have described many relatively fundamental
experiments, and it is now time to see how these can be
applied, as an example, we have already discussed semi-
conducting polymer blend films. Secondly, work will
consider how wetting behaviour is altered in unusual
geometries. As an example of the latter scenario, work is
already starting to appear with confined polymers. For
example, experiments have been performed where PS or
SBS were confined to strips in a lithographed PDMS mask
[265]. The polymer broke up, forming holes with a length
scale of dewetting that was dependent on the size of the
strips. Further experiments by these authors considered the
Fig. 36. (a) SFM TappingModee topography image of a thin PS
film (Mw ¼ 100 kDa; tav ¼ 5 nm) on a chemically patterned,
corrugated silicon substrate after annealing at 423 K for 3 h [185].
Every other facet has been coated with a thin Au layer. The film has
broken into linear channels following the grooves of the substrate.
(b) Average line scan along the horizontal taken from the area inside
the box indicated in image (a). The solid line is the experimental
result. The dashed line depicts the position of the substrate surface.
Reprinted with permission from Eur Phys J E 2001;4:69. q 2001
EDP Sciences [185].
Fig. 35. Stability phase diagram for thin PS films on corrugated
silicon substrates. Squares indicate stable PS films, while triangles
refer to films where the formation of nano-channels was observed
[185]. The dashed line indicates tpeak ¼ 0:55Rg: The solid symbols
indicate data taken from substrates with no corrugation. Reprinted
with permission from Eur Phys J E 2001;4:69. q 2001 EDP
Sciences [185].
M. Geoghegan, G. Krausch / Prog. Polym. Sci. 28 (2003) 261–302 291

final morphology of blends of PS and PB annealed under
PDMS masks [266]. Related experiments along the same lines
were performed to create PMMA patterns after embossing in a
silicon mask [267]. In a different experiment, blends of PMMA
and SAN films were confined laterally on silicon substrates
[268]. In this work the shapes of phase-separated domains
depend upon the aspect ratio of the confinement (width and
film thickness). For wider films, phase-separated domains
are visible, whereas for films that are confined into thin
strips, the domains are shaped more like capsules.
A recurring theme of research discussed in this review is
that of self-assembly and pattern formation. A particularly
interesting example of this is the use of electric fields to
align polymers. Electric fields have a long-range behaviour,
and can easily be tuned, which makes their use particularly
desirable. Additionally, because thin films are being
considered, only small potential differences can be used to
generate large electric fields. We have already mentioned
the use of electric fields in inducing dewetting, and it has
also been shown that by placing a homopolymer film in an
electric field, one can create uniform structures [269,270].
By using a patterned electrode one can select particular
patterns [269]. These authors have performed similar
experiments at polymer/oligomer and polymer/polymer
interfaces [271,272]. Other related experiments were
performed with copolymers; electric fields were used to
align PS-block-PMMA to create PMMA cylinders in a
matrix of PS [273]. A nice extension of this theme
involves the use of ultra-violet irradiation to degrade the
PMMA, whilst simultaneously cross-linking (i.e. fixing)
the PS [274]. Rinsing in solvent (e.g. acetic acid) will
remove the degraded PMMA leaving cylindrical nanopores,
which, as an example, have been filled with cobalt to create
magnetic nanostructures [275].
Another means of pattern formation that has been reported
involves the annealing of polymer films above the glass
transition typically,100 nm below a mask, which is usually a
silicon wafer coated with a surfactant monolayer to provide a
low-energy surface [276,277]. In these initial experiments,
thin films (between 100 nm and 2 mm) of PMMA were used.
On cooling, the PMMA was observed to have risen against
gravity, forming regularly spaced (a few micrometres) pillars
in contact with the mask. The origin of this process is
not yet understood although it may have electrostatic
origins and could be related to some of the work
involving pattern formation in stamps [267]; its use for
Fig. 37. (a) SFM TappingModee topography image of the surface
of a 5 nm thick film of a PS-block-PVP-block-PtBMA triblock
copolymer grafted onto a silicon wafer [264]. The respective
molecular weights of the blocks are 51, 68, and 50 kDa. The height
scale ranges between 0 and 5 nm. The r.m.s. roughness of the layer
amounts to some 3 nm. (b) Topography image of a 20 nm thick film
of a PS ðMw ¼ 104 kDaÞ/PtBMA ðMw ¼ 80 kDaÞ blend spun cast
onto a plain silicon wafer (50% PS by weight). The height scale
ranges between 0 and 50 nm. In the inset (top left corner) a larger
area scan of the same sample is shown. (c) Topography image of a
20 nm thick film of a PS/PtBMA blend spun cast onto a silicon
wafer coated with a graft layer of PS-block-PVP-block-PtBMA).
The height scale ranges between 0 and 30 nm. Reprinted with
permission from Langmuir 2000;16:3474. q 2000 American
Chemical Society [264].
M. Geoghegan, G. Krausch / Prog. Polym. Sci. 28 (2003) 261–302292
lithography should however be clear. It is difficult to see
if a particular method of pattern formation will dominate in
the coming years, because new methods are appearing with
great regularity. As an example of a couple of other
methods, the reader might like to consider the use of
polyelectrolyte multi-layers [278] or the microbuckling of
polymer films in water [279].
Acknowledgements
We thank Professors Jan Genzer, Russ Composto, Kari
Dalnoki-Veress and Drs David Lidzey, Anthony Higgins,
Ana Claudia Arias, Chun Wang, Peter Muller-Buschbaum,
and Jakub Rysz for supplying data and figures, and for many
useful comments. In particular we acknowledge Professor
Andrzej Budkowski for a thorough critical reading of the
manuscript. Figs. 2–4, 11, 12, 21 and 22 are reproduced
with permission from EDP Sciences. The authors thank the
Deutsche Forschungsgemeinschaft (SPP 1081) for generous
financial support.
Appendix A. Mean-field theory of wetting
A.1. Theory of the wetting transition
The mathematics of the wetting transition is not difficult
to follow as it involves a coupling of the theory of Cahn [56]
with the Flory–Huggins lattice theory [57,58]. The theory
of Cahn itself is simply a development of the van der Waals
theory of capillarity [280]. Briefly, one writes the free
energy of the binary mixture as a sum of the mixing entropy,
enthalpy, and the surface energy. The (Gibbs) free energy of
mixing per lattice site, G, for a polymer blend is given in the
usual Flory–Huggins form as
GbulkðfÞ
kBT¼
f
NA
ln fþ1 2 f
NB
lnð1 2 fÞ
þ xfð1 2 fÞ; ðA1Þ
where NA and NB are the chain lengths. The difference in
free energy caused by having a surface involves three terms:
a surface energy term reflecting the benefit in having the
component with the lower surface energy at the surface; a
term dependent on the gradient in the free energy, which
reflects the cost in having a composition gradient in the
medium; and finally an energy cost in having a different
surface composition to that in the bulk (f1). These may be
written as
DGsurfaceðfÞ
kBT¼ FðfsÞ þ
ð1
0g
df
dz
� �2
þDf 0ðfÞ
!dz; ðA2Þ
and the cost in having the surface at a composition different
from the bulk is given by
kBTDf 0ðfÞ ¼ GðfÞ2 Gðf1Þ2 ðf2 f1Þ›G
›f
� �f1
: ðA3Þ
The prefactor to the ‘gradient squared term’, g, represents
the energy cost of having a composition gradient. Normally,
g is assumed to be a constant, but in polymer systems it is
calculated using the random phase approximation [90], and
is given by
g ¼a2
36fð1 2 fÞ: ðA4Þ
For very immiscible blends, the factor 1/36 is sometimes
replaced by 1/24 [281]. The integral term in the surface free
energy (Eq. (A2)) can be minimised by solving the Euler
equation (this is a special case, in which the integrand does
not contain z explicitly, see for example [282])
Df 0ðfÞ ¼ gdf
dz
� �2
: ðA5Þ
Integrating the above (Eq. (A5)), we obtain the concen-
tration profile
z ¼ 2ðf1
fs
ffiffiffiffiffiffiffiffiffiffig
Df 0ðfÞ
rdf; ðA6Þ
which can be numerically solved using Eqs. (A1), (A3) and
(A4).
By removing ðdf=dzÞ2 from Eq. (A2), using Eq. (A5), we
arrive at the equilibrium surface free energy (with reduced
dimensions of length)
s ¼ FðfsÞ þðfs
f1
a
3
ffiffiffiffiffiffiffiffiffiffiffiffiffiDf 0ðfÞ
fð1 2 fÞ
sdf; ðA7Þ
which, because it corresponds to thermodynamic equili-
brium, yields the surface chemical potential, ms:
ms ¼dF
dfs
¼ 22ffiffiffiffiffiffiffiffiffiffiffigDf 0ðfsÞ
p¼
2a
3
ffiffiffiffiffiffiffiffiffiffiffiffiffiffiffiDf 0ðfsÞ
fsð1 2 fsÞ
s: ðA8Þ
The importance of this surface chemical potential is
revealed when both curves are plotted. This is the basis of
the Cahn plot, or phase portrait, and is exemplified in Fig.
38. Eq. (A8) is solved when the curves cross. It can be seen
that for particularly low values of 2dF=dfs; there are three
solutions to this equation. This means that partial and
complete wetting can coexist. When there is only one
solution, complete wetting is the only possible outcome. If
the areas A and B are equal, there is a wetting transition.
Note that in Fig. 4 for the experiments of Rysz et al. [64],
partial wetting occurs without an area B defined because
they have a surface chemical potential with the solution
2dF=dfs ¼ 0 for f , 1: A consequence of this ‘enrich-
ment-depletion duality’ [131] is that the polyolefin blend in
M. Geoghegan, G. Krausch / Prog. Polym. Sci. 28 (2003) 261–302 293

this study could well be a good candidate for the observation
of a second order wetting transition.
A.2. The approach to wetting
The approach to wetting was considered by Cahn [56],
who discussed the possibility of prewetting in under-
saturated systems. In such a case, a first order prewetting
transition is possible whereby a mesoscopic (but finite)
wetting layer could exist at the surface in equilibrium with a
much smaller surface segregated layer.
The energy cost in having a surface segregated (or
wetting) layer at a composition different from the bulk value
is given by Eq. (A3), but one can also write this as a Taylor
expansion around the upper coexistence volume fraction
fb :
Df 0ðfÞ ¼ Df 0min þ12ðf2 fbÞ
2 ›2G
›f2
!fb
: ðA9Þ
The first term corresponds to the distance of the tangent of
the free energy curve at f1 to the free energy at fb [56].
This distance is reached via an approximation
Df 0min ¼ Gðf1Þ2 GðfbÞ2 ðf1 2 fbÞ›G
›f
� �f1
< ðfa 2 f1Þðfb 2 faÞ›2GðfÞ
›f2
!fa
; ðA10Þ
where fa and fb are, respectively, the lower and upper
coexistence volume fractions. Eq. (A10) can be justified
because ð›G=›fÞf1< ðf1 2 faÞð›
2G=›f2Þfaand we also
replace f1 2 fb with fa 2 fb: For this to be possible we
need to assume a symmetric or nearly symmetric blend.
Cahn was primarily interested in binary metal alloys, for
which, at coexistence ð›G=›fÞfa¼ ð›G=›fÞfb
¼ 0: For this
reason the first order differential is missing from the Taylor
expansion (Eq. (A9)).
We can now substitute Eq. (A9) into Eq. (A6) and obtain
l
2¼ 2
ffiffiffiffiffiffiffiffiffiffiffiffiffiffi2g
›2G
›f2
!fb
vuuuutðfs
f1
dfffiffiffiffiffiffiffiffiffiffiffiffiffiffiffiffiffiffiffiffiffiffiffiffiffiffiffiffiffiffiffi2Df 0min
›2G
›f2
!fb
þ ðf2 fbÞ2
vuuuuut:
ðA11Þ
In small molecule systems g can be treated as constant and
the standard integralÐ
du=ffiffiffiffiffiffiffiffiffiffia2 þ u2
p¼ lnðu þ
ffiffiffiffiffiffiffiffiffiffia2 þ u2
pÞ can
be used to obtain
l
2¼ 2
ffiffiffiffiffiffiffiffiffiffiffiffiffiffi2g
›2G
›f2
!fb
vuuuut
12
ln
2Df 0min ›2G
›f2
!fb
!
2 ln
ðfs 2 fbÞ þ
ffiffiffiffiffiffiffiffiffiffiffiffiffiffiffiffiffiffiffiffiffiffiffiffiffiffiffiffiffiffiffiffiðfs 2 fbÞ
2 þ2Df 0min ›2G
›f2
!fb
vuuuuut!!
:
ðA12Þ
If we assume that Df 0min p Df 0ðfsÞ; which is valid in
symmetric systems near saturation, we can allow fs 2 fb to
dominate the last term in the root of Eq. (A12) (inspection of
Eq. (A9) should confirm this).
Neglecting Df 0min; we can substitute Eq. (A9) into Eq.
(A8) to obtain
2ðfs 2 fbÞ ¼
ffiffiffiffiffiffiffiffiffiffiffiffiffiffiffiffi2m2
s
g›2G
›f2
!fb
vuuuuut ; ðA13Þ
which we can substitute into Eq. (A12) to yield
l
2¼
ffiffiffiffiffiffiffiffiffiffiffiffiffiffiffiffig
2›2G
›f2
!fb
vuuuut lnm2
s
g2 ln Df 0min
!: ðA14Þ
As f1 ! fa; the size of the prewetting layer, l diverges
logarithmically. As has been pointed out earlier, g is a
function of f and so Eq. (A11) can only be solved
numerically. However, as a first approximation it is
perfectly acceptable, and was used by Geoghegan et al.
[6] to fit their adsorption isotherm for a d-PS/PaMS blend,
although this will not be the ideal way to extract a value for
ms. Earlier simulations demonstrated the validity of this
approximation for d-PS/h-PS blends [83]. For a more
quantitative analysis, the approach used for segregation in
polyolefin blends is recommended [66].
Fig. 38. Idealised phase portrait. If the area in A is less than that in B,
total wetting represents the free energy minimum. If the area under
A is greater than that under B, partial wetting is the more
energetically favourable. When the two areas are equal, a wetting
transition occurs.
M. Geoghegan, G. Krausch / Prog. Polym. Sci. 28 (2003) 261–302294

A.3. Surface segregation
The form for the surface energy in polymer mixtures has
been presented by different authors in different forms to
account for differing results. The simplest, and most
commonly used, is that due to Schmidt and Binder [55],
which contains two terms
Fs ¼ 2m1fs 2sf2
s
2; ðA15Þ
which are the leading terms in a Taylor expansion of the
bare surface energy. It is necessary that m1 þ s=2 . 0 and fs
be small, which can result in corrections for nearly complete
wetting of the surface by one of the phases when surface
entropy terms become important [88,283]. (Another
approach [91], which is based on the Gibbs adsorption
equation, is discussed briefly in Sections 3.3.2 and 3.3.4.)
The two terms in the Schmidt and Binder form have
physical meaning: m1 is a surface chemical potential
difference (not to be confused with ms) and s/2 is a surface
interaction parameter accounting for both the change in
dimensionality and the different interactions from the bulk.
We write the surface energy difference between the two
components as
Dg ¼kBT
b3m1 þ
s
2
� �; ðA16Þ
with b being the size of a lattice unit. The surface interaction
parameter s can be related to the bulk interaction parameter
by [284–286]:
s ¼ 2bx: ðA17Þ
Differentiating Eq. (A15) with respect to fs, and substitut-
ing this, Eqs. (A3), (A4), (A16) and (A17) into Eq. (A8), we
obtain
b3Dg
kBT2 bx f2 1
2
� �
¼a
3
ffiffiffiffiffiffiffiffiffiffiffiffiffiffiffiffiffiffiffiffiffiffiffiffiffiffiffiffiffiffiffiffiffiffiffiffiffiffiffiffiGðfÞ2 GðfaÞ2 ðf2 faÞDma
kBTfð1 2 fÞ
s; ðA18Þ
where Dma ¼ ð›G=›fÞfaand any composition dependence
off has been neglected. The composition profile is obtained
from Eq. (A6) and is recast in the Flory–Huggins form here
to give the volume fraction-depth profile
z ¼affiffiffiffiffikBT
p
6
ðf1
fs
dfffiffiffiffiffiffiffiffiffiffiffiffiffiffiffiffiffiffiffiffiffiffiffiffiffiffiffiffiffiffiffiffiffiffiffiffiffiffiffiffiGðfÞ2 Gðf1Þ2 fð1 2 fÞDm1
p ; ðA19Þ
where Dm1 ¼ ð›G=›fÞf1: Similarly, the surface excess is
given by
zp ¼affiffiffiffiffikBT
p
6
ðf1
fs
ðf2 f1ÞdfffiffiffiffiffiffiffiffiffiffiffiffiffiffiffiffiffiffiffiffiffiffiffiffiffiffiffiffiffiffiffiffiffiffiffiffiffiffiffiffiGðfÞ2 Gðf1Þ2 fð1 2 fÞDm1
p :
ðA20Þ
References
[1] Bhatia QS, Pan DH, Koberstein JT. Preferential surface
adsorption in miscible blends of polystyrene and poly(vinyl
methyl ether). Macromolecules 1988;21:2166–75.
[2] Jones RAL, Kramer EJ, Rafailovich MH, Sokolov J, Schwarz
SA. Surface enrichment in an isotopic polymer blend film.
Phys Rev Lett 1989;62:280–3.
[3] Cahn JW. Phase separation by spinodal decomposition in
isotropic systems. J Chem Phys 1965;42:93–9.
[4] Hashimoto T. Dynamics in spinodal decomposition of
polymer mixtures. Phase Trans 1988;12:47–119.
[5] Jones RAL, Norton LJ, Kramer EJ, Bates FS, Wiltzius P.
Surface-directed spinodal decomposition. Phys Rev Lett
1991;66:1326–9 ibid p. 3087.
[6] Geoghegan M, Ermer H, Jungst G, Krausch G, Brenn R.
Wetting in a phase separating polymer blend film: quench
depth dependence. Phys Rev E 2000;62:940–50.
[7] Krausch G. Surface induced self assembly in thin polymer
films. Mater Sci Engng 1995;R14:1–94.
[8] Budkowski A. Interfacial phenomena in thin polymer films:
phase coexistence and segregation. Adv Polym Sci 1999;148:
1–111.
[9] Stamm M. Polymer interfaces on a molecular scale:
comparison of techniques and some examples. Adv Polym
Sci 1992;100:357–400.
[10] de Gennes PG. Wetting: statics and dynamics. Rev Mod Phys
1985;57:827–63.
[11] Binder K. Phase transitions of polymer blends and block
copolymer melts in thin films. Adv Polym Sci 1999;138:
1–89.
[12] Muller M, Binder K, Albano EV. Phase equilibria in thin
polymer films. Int J Mod Phys B 2001;15:1867–903.
[13] Puri S, Frisch HL. Surface-directed spinodal decomposition:
modelling and numerical simulations. J Phys: Condens
Matter 1997;9:2109–33.
[14] Fasolka MJ, Mayes AM. Block copolymer thin films: physics
and applications. Annu Rev Mater Res 2001;31:323–55.
[15] Jones RAL, Richards RW. Polymers at surfaces and
interfaces. Cambridge: Cambridge University Press; 1999.
[16] Schwarz SA, Wilkens BJ, Pudensi MAA, Rafailovich MH,
Sokolov J, Zhao X, Zhao W, Zheng X, Russell TP, Jones
RAL. Studies of surface and interface segregation in polymer
blends by secondary ion mass spectrometry. Mol Phys 1992;
76:937–50.
[17] Bernasik A, Rysz J, Budkowski A, Kowalski K, Camra J,
Jedlinski J. Three-dimensional information on the phase
domain structure of thin films of polymer blends revealed by
secondary ion mass spectroscopy. Macromol Rapid Commun
2001;22:829–34.
[18] Gray KH, Gould S, Leasure RM, Musselman IH, Lee JJ,
Meyer TJ, Linton RW. Three-dimensional characterization
of conducting polymer arrays using secondary ion mass
spectrometry. J Vac Sci Technol, A 1992;10:2679–84.
[19] Composto RJ, Walters RM, Genzer J. Application of ion
scattering techniques to characterize polymer surfaces and
interfaces. Mater Sci Engng 2002;R38:107–80.
[20] Geoghegan M. MeV ion beam profiling of polymer
surfaces and interfaces. In: Richards RW, Peace SK, editors.
Polymer surfaces and interfaces III. Chichester: Wiley; 1999.
p. 43–73.
M. Geoghegan, G. Krausch / Prog. Polym. Sci. 28 (2003) 261–302 295

[21] Geoghegan M, Jones RAL, Clough AS, Penfold J. The
morphology of as-cast films of a polymer blend: dependence
on polymer molecular weight. J Polym Sci, Part B: Polym
Phys 1995;33:1307–11.
[22] Mills PJ, Green PF, Palmstrøm CJ, Mayer JW, Kramer EJ.
Analysis of diffusion in polymers by forward recoil
spectrometry. Appl Phys Lett 1984;45:957–9.
[23] Genzer J, Rothman JB, Composto RJ. Improved hydrogen
and deuterium depth profiling in polymers using low energy
forward recoil spectrometry. Nucl Instr Meth B 1994;86:
345–54.
[24] Sokolov J, Rafailovich MH, Jones RAL, Kramer EJ.
Enrichment depth profiles in polymer blends measured by
forward recoil spectrometry. Appl Phys Lett 1989;54:590–2.
[25] Ermer H, Pfaff O, Straub W, Geoghegan M, Brenn R.
Deuterium depth profiling in polymers using heavy ion
elastic recoil detection. Nucl Instr Meth B 1998;134:237–48.
[26] Geoghegan M, Abel F. High resolution elastic recoil
detection analysis of polystyrene depth profiles using carbon
ions. Nucl Instr Meth B 1998;143:371–80.
[27] Chaturvedi UK, Steiner U, Zak O, Krausch G, Schatz G,
Klein J. Structure at polymer interfaces determined by high-
resolution nuclear reaction analysis. Appl Phys Lett 1990;56:
1228–30.
[28] Payne RS, Clough AS, Murphy P, Mills PJ. Use of the
D(3He,p)4He reaction to study polymer diffusion in polymer
melts. Nucl Instr Meth B 1989;42:130–4.
[29] Russell TP. X-ray and neutron reflectivity for the investi-
gation of polymers. Mater Sci Rep 1990;5:171–271.
[30] Bucknall DG, Higgins JS. Neutron reflection studies of
polymer–polymer interfaces. In: Hommell H, editor. Poly-
mer surfaces and interfaces—a versatile combination: recent
research developments in polymer science. Trivandrum,
India: Research Signpost; 1998. p. 161–99.
[31] Penfold J, Thomas RK. The application of the specular
reflection of neutrons to the study of surfaces and interfaces.
J Phys: Condens Matter 1990;2:1369–412.
[32] Cleveland JP, Anczykowski B, Schmid AE, Elings VB.
Energy dissipation in tapping-mode atomic force
microscopy. Appl Phys Lett 1998;72:2613–5.
[33] Krausch G, Hipp M, Boltau M, Mlynek J, Marti O. High
resolution imaging of polymer surfaces with chemical
sensitivity. Macromolecules 1995;28:260–3.
[34] Lambooy P, Phelan KC, Haugg O, Krausch G. Dewetting at
the liquid–liquid interface. Phys Rev Lett 1996;76:1110–3.
[35] Knoll A, Magerle R, Krausch G. Tapping mode atomic force
microscopy on polymers: where is the true sample surface?
Macromolecules 2000;34:4159–65.
[36] Pohl DW, Denk W, Lanz M. Optical stethoscopy: image
recording with resolution l/20. Appl Phys Lett 1984;44:
651–3.
[37] Betzig E, Trautmann JK. Near-field optics: microscopy,
spectroscopy, and surface modification beyond the diffrac-
tion limit. Science 1992;257:189–95.
[38] Straub W, Bruder F, Brenn R, Krausch G, Bielefeldt H,
Kirsch A, Marti O, Mlynek J, Marko JF. Transient wetting
and 2D spinodal decomposition in a binary polymer blend.
Europhys Lett 1995;29:353–8.
[39] Betzig E. Principles and applications of near-field scanning
optical microscopy (NSOM). In: Pohl DW, Courjon D,
editors. Near field optics. Dordrecht: Kluwer; 1993. p. 7–15.
[40] Laurer JH, Winey KI. Direct imaging of ionic aggregates in
Zn-neutralized poly(ethylene-co-methacrylic acid) copoly-
mers. Macromolecules 1998;31:9106–8.
[41] Magerle R. Nanotomography. Phys Rev Lett 2000;85:
2749–52.
[42] Konrad M, Knoll A, Krausch G, Magerle R. Volume imaging
of an ultrathin SBS triblock copolymer film. Macromolecules
2000;33:5518–23.
[43] Ertl G, Kuppers J. X-ray photoelectron spectroscopy (XPS).
Low energy electrons and surface chemistry, Weinheim:
VCH; 1985. p. 65–85.
[44] Short RD, Ameen AP, Jackson ST, Pawson DJ, O’Toole L,
Ward AJ. TOF-SIMS in polymer surface studies. Vacuum
1993;44:1143–60.
[45] Ade H, Zhang X, Cameron S, Costello C, Kirz J, Williams S.
Chemical contrast in X-ray microscopy and spatially
resolved XANES spectroscopy of organic specimens.
Science 1992;258:972–5.
[46] Ade H, Winesett DA, Smith AP, Qu S, Ge S, Sokolov J,
Rafailovich MH. Phase segregation in polymer thin films:
elucidations by X-ray and scanning force microscopy.
Europhys Lett 1999;45:526–32.
[47] Slep D, Asselta J, Rafailovich MH, Sokolov J, Winesett DA,
Smith AP, Ade H, Anders S. Effect of an interactive surface
on the equilibrium contact angles in bilayer polymer films.
Langmuir 2000;16:2369–75.
[48] Slep D, Asselta J, Rafailovich MH, Sokolov J, Winesett DA,
Smith AP, Ade H, Strzhemechny Y, Schwarz SA, Sauer BB.
Phase separation of polystyrene and bromo-polystyrene
mixtures in equilibrium structures in thin films. Langmuir
1998;14:4860–4.
[49] Factor BJ, Russell TP, Toney MF. Surface-induced ordering
of an aromatic polyimide. Phys Rev Lett 1991;66:1181–4.
[50] Durell M, Macdonald JE, Trolley D, Wehrum A, Jukes PC,
Jones RAL, Walker CJ, Brown G. The role of surface-
induced ordering in the crystallisation of PET films.
Europhys Lett 2002;58:844–50.
[51] Muller-Buschbaum P, Stamm M. Correlated roughness,
long-range correlations, and dewetting of thin polymer
films. Macromolecules 1998;31:3686–92.
[52] Sferrazza M, Heppenstall-Butler M, Cubitt R, Bucknall DG,
Webster J, Jones RAL. Interfacial instability driven by
dispersive forces: the early stages of spinodal dewetting of a
thin polymer film on a polymer substrate. Phys Rev Lett
1998;81:5173–6.
[53] Gardella Jr JA. Recent advances in ion and electron
spectroscopy of polymer surfaces. Appl Surf Sci 1988;31:
72–102.
[54] Reich S, Cohen Y. Phase separation of polymer blends in thin
films. J Polym Sci, Polym Phys Ed 1981;19:1255–67.
[55] Schmidt I, Binder K. Model calculations for wetting
transitions in polymer mixtures. J Phys 1985;46:1631–44.
[56] Cahn JW. Critical point wetting. J Chem Phys 1977;66:
3667–72.
[57] de Gennes P-G. Scaling concepts in polymer physics. Ithaca:
Cornell University Press; 1979.
[58] Flory PJ. Principles of polymer chemistry. Ithaca: Cornell
University Press; 1953.
[59] Bruder F, Brenn R. Spinodal decomposition in thin films of a
polymer blend. Phys Rev Lett 1992;69:624–7.
[60] Krausch G, Dai C-A, Kramer EJ, Marko JF, Bates FS.
M. Geoghegan, G. Krausch / Prog. Polym. Sci. 28 (2003) 261–302296

Interference in spinodal waves in thin polymer films.
Macromolecules 1993;26:5566–71.
[61] Krausch G, Dai C-A, Kramer EJ, Bates FS. Real space
observation of dynamic scaling in a critical polymer mixture.
Phys Rev Lett 1993;71:3669–72.
[62] Geoghegan M, Jones RAL, Clough AS. Surface directed
spinodal decomposition in a partially miscible polymer
blend. J Chem Phys 1995;103:2719–24.
[63] Nakanishi H, Pincus P. Surface spinodals and extended
wetting in fluids and polymer solutions. J Chem Phys 1983;
79:997–1003.
[64] Rysz J, Budkowski A, Bernasik A, Klein J, Kowalski K,
Jedlinski J, Fetters LJ. Wetting transition in a binary polymer
blend. Europhys Lett 2000;50:35–40.
[65] Scheffold F, Eiser E, Budkowski A, Steiner U, Klein J,
Fetters LJ. Surface phase behavior in binary polymer
mixtures. I. Miscibility, phase coexistence, and interactions
in polyolefin blends. J Chem Phys 1996;104:8786–94.
[66] Scheffold F, Budkowski A, Steiner U, Eiser E, Klein J,
Fetters LJ. Surface phase behavior in binary polymer
mixtures. II. Surface enrichment from polyolefin blends.
J Chem Phys 1996;104:8795–806.
[67] Steiner U, Klein J. Growth of wetting layers from liquid
mixtures. Phys Rev Lett 1996;77:2526–9.
[68] Steiner U, Klein J, Eiser E, Budkowski A, Fetters LJ.
Complete wetting from polymer mixtures. Science 1992;258:
1126–9.
[69] Steiner U, Klein J, Fetters LJ. Surface phase inversion in
finite-sized binary mixtures. Phys Rev Lett 1994;72:
1498–501.
[70] Losch A, Salomonovich R, Steiner U, Fetters LJ, Klein J.
Self-diffusion in melts of statistical copolymers—the effect
of changes in microstructural composition. J Polym Sci, Part
B: Polym Phys 1995;33:1821–31.
[71] Jones RAL. The wetting transition for polymer mixtures.
Polymer 1994;35:2160–6.
[72] Muller M, Albano EV, Binder K. Symmetric polymer blend
confined into a film with antisymmetric surfaces: interplay
between wetting behavior and the phase diagram. Phys Rev E
2000;62:5281–95.
[73] Wiltzius P, Cumming A. Domain growth and wetting in
polymer mixtures. Phys Rev Lett 1991;66:3000–3.
[74] Troian SM. Coalescence induced domain growth near a wall
during spinodal decomposition. Phys Rev Lett 1993;71:
1399–402. see also the comment by Keblinski P, Ma WJ,
Maritan A, Koplik J, Banavar JR. 1994;72:3738 and reply
1994;72:3739.
[75] Marko JF. Influence of surface interactions on spinodal
decomposition. Phys Rev E 1993;48:2861–79.
[76] Tanaka H. Interplay between wetting and phase separation in
binary fluid mixtures: roles of hydrodynamics. J Phys:
Condens Matter 2001;13:4637–74.
[77] Puri S, Binder K. Surface effects on spinodal decomposition
in binary mixtures and the interplay with wetting phenomena.
Phys Rev E 1994;49:5359–77.
[78] Puri S, Binder K, Frisch HL. Surface effects on spinodal
decomposition in binary mixtures: the case with long-ranged
surface fields. Phys Rev E 1997;56:6991–7000.
[79] Lifshitz IM, Slyozov VV. The kinetics of precipitation from
supersaturated solid solutions. J Phys Chem Solids 1961;19:
35–50.
[80] Puri S, Binder K. Power laws and crossovers in off-critical
surface-directed spinodal decomposition. Phys Rev Lett
2001;86:1797–800.
[81] Jones RAL, Kramer EJ. Kinetics of formation of a surface
enriched layer in an isotopic polymer blend. Phil Mag B
1990;62:129–37.
[82] Lipowsky R, Huse DA. Diffusion-limited growth of wetting
layers. Phys Rev Lett 1986;57:353–6.
[83] Geoghegan M, Nicolai T, Penfold J, Jones RAL. Kinetics of
surface segregation and the approach to wetting in an isotopic
polymer blend. Macromolecules 1997;30:4220–7.
[84] Bates FS, Wignall GD. Nonideal mixing in binary blends of
perdeuterated and protonated polystyrene. Macromolecules
1986;19:932–4.
[85] Budkowski A, Steiner U, Klein J. The effects of confinement
and surface interactions on coexistence in a binary polymer
mixture. J Chem Phys 1992;97:5229–38.
[86] Green PF, Doyle BL. Isotope effects on interdiffusion in
blends of normal and perdeuterated polymers. Phys Rev Lett
1986;57:2407–10.
[87] Sauer BB, Dee GT. Molecular weight and temperature
dependence of polymer surface tension: comparison of
experiment with theory. Macromolecules 1991;24:2124–6.
[88] Zhao H, Zhao W, Sokolov J, Rafailovich MH, Schwarz SA,
Wilkens BJ, Jones RAL, Kramer EJ. Determination of the
concentration profile at the surface of d-PS/h-PS blends using
high-resolution ion scattering techniques. Macromolecules
1991;24:5991–6.
[89] Genzer J, Composto RJ. Surface segregation amplification in
miscible polymer blends near criticality. Europhys Lett 1997;
38:171–6.
[90] Strobl GR. The physics of polymers. Berlin: Springer; 1997.
[91] Norton LJ, Kramer EJ, Bates FS, Gehlsen MD, Jones RAL,
Karim A, Felcher GP, Kleb R. Neutron reflectometry study of
surface segregation in an isotopic poly(ethylenepropylene)
blend: deviation from mean-field theory. Macromolecules
1995;28:8621–8.
[92] Budkowski A, Rysz J, Scheffold F, Klein J, Fetters LJ. Effect
of deuterium substitution on the surface interactions in binary
polymer mixtures. J Polym Sci, Part B: Polym Phys 1998;36:
2691–702.
[93] Budkowski A, Scheffold F, Klein J, Fetters LJ. Surface phase
behavior in binary polymer mixtures. III. Temperature
dependence of surface enrichment and of wetting. J Chem
Phys 1997;106:719–27.
[94] Sariban A, Binder K. Critical properties of the Flory–
Huggins lattice model of polymer mixtures. J Chem Phys
1987;86:5859–73.
[95] Geoghegan M, Russ T, Brenn R. Thermodynamic suppres-
sion of Brownian motion. Phys Rev Lett 2001;86:2581–4.
[96] Siggia ED. Late stages of spinodal decomposition in binary
mixtures. Phys Rev A 1979;20:595–605.
[97] Krausch G, Kramer EJ, Bates FS, Marko JF, Brown G,
Chakrabarti A. Surface-induced asymmetries during spinodal
decomposition in off-critical polymer mixtures. Macro-
molecules 1994;27:6768–76.
[98] Tanaka H. Interplay between phase separation and wetting
for a polymer mixture confined in a two-dimensional
capillary: wetting induced domain ordering and coarsening.
Europhys Lett 1993;24:665–71.
[99] Wang H, Composto RJ. Understanding morphology
M. Geoghegan, G. Krausch / Prog. Polym. Sci. 28 (2003) 261–302 297

evolution and roughening in phase-separating thin-film
polymer blends. Europhys Lett 2000;50:622–7.
[100] Wang H, Composto RJ. Hydrodynamic-flow-driven wetting
in thin film polymer blends: growth kinetics and morphology.
Phys Rev E 2000;61:1659–63.
[101] Wang H, Composto RJ. Thin film polymer blends under-
going phase separation and wetting: identification of early,
intermediate, and late stages. J Chem Phys 2000;113:
10386–97.
[102] Wang H, Composto RJ. Kinetics of surface and interfacial
fluctuations in phase separating polymer blend films.
Macromolecules 2002;35:2799–809.
[103] Heier J, Kramer EJ, Revesz P, Battistig G, Bates FS. Spinodal
decomposition in a subsurface layer of a polymer blend film.
Macromolecules 1999;32:3758–65.
[104] Rysz J, Ermer H, Budkowski A, Bernasik A, Lekki J, Juengst
G, Brenn R, Kowalski K, Camra J, Lekka M, Jedlinski J.
Hydrodynamic-flow-driven phase evolution in a polymer
blend film modified by diblock copolymers. Eur Phys J E
2001;5:207–19.
[105] Rysz J, Bernasik A, Ermer H, Budkowski A, Brenn R,
Hashimoto T, Jedlinski J. Surface-directed spinodal
decomposition modified by a surface active copolymer.
Europhys Lett 1997;40:503–8.
[106] Brochard Wyart F, Martin P, Redon C. Liquid/liquid
dewetting. Langmuir 1993;9:3682–90.
[107] Hoppe H, Heuberger M, Klein J. Self-similarity and pattern
selection in the roughening of binary liquid films. Phys Rev
Lett 2001;86:4863–6.
[108] Jones RAL, Norton LJ, Kramer EJ, Composto RJ, Stein RS,
Russell TP, Mansour A, Karim A, Felcher GP, Rafailovich
MH, Sokolov J, Zhao X, Schwarz SA. The form of the
enriched surface layer in polymer blends. Europhys Lett
1990;12:41–6.
[109] Geoghegan M, Jones RAL, Sivia DS, Penfold J, Clough AS.
Experimental study of surface segregation and wetting in
films of a partially miscible polymer blend. Phys Rev E 1996;
53:825–37.
[110] Jones RAL. Effect of long-range forces on surface enrich-
ment in polymer blends. Phys Rev E 1993;47:1437–40.
[111] Genzer J, Faldi A, Composto RJ. Self-consistent mean-field
calculation of surface segregation in a binary polymer blend.
Phys Rev E 1994;50:2373–6.
[112] Rowlinson JS, Widom B. Molecular theory of capillarity.
Oxford: Oxford University Press; 1982.
[113] Genzer J, Composto RJ. Effect of molecular weight on the
interfacial excess, tension, and width in a homopolymer/
binary polymer blend system. Macromolecules 1998;31:
870–8.
[114] Aubouy M, Manghi M, Raphael E. Interfacial properties of
polymeric liquids. Phys Rev Lett 2000;84:4858–61. see also
the comment by Kumar SK, Jones RL. 2001;87:179601 and
reply 2001;87:179602.
[115] Helfand E. Theory of the homopolymer/binary-polymer-
mixture interface. Macromolecules 1992;25:1676–85.
[116] Faldi A, Genzer J, Composto RJ, Dozier WD. Segregation at
the interface between a homopolymer and a binary polymer
blend. Phys Rev Lett 1995;74:3388–91.
[117] Brown HR. Effect of a diblock copolymer on the adhesion
between incompatible polymers. Macromolecules 1989;22:
2859–60.
[118] Creton C, Kramer EJ, Hui C-Y, Brown HR. Failure
mechanisms of polymer interfaces reinforced with block
copolymers. Macromolecules 1992;25:3075–88.
[119] Benkoski JJ, Fredrickson GH, Kramer EJ. Effects of
composition drift on the effectiveness of random copolymer
reinforcement at polymer–polymer interfaces. J Polym Sci,
Part B: Polym Phys 2001;39:2363–77.
[120] Dai C-A, Dair BJ, Dai KH, Ober CK, Kramer EJ, Hui C-Y,
Jelinski LW. Reinforcement of polymer interfaces with
random copolymers. Phys Rev Lett 1994;73:2472–5. see
also the comment by Noolandi J, Shi A-C. 1995;74:2836 and
reply 1995;74:2837.
[121] Gersappe D, Irvine D, Balazs AC, Liu Y, Sokolov J,
Rafailovich M, Schwarz S, Peiffer DG. The use of graft-
copolymers to bind immiscible blends. Science 1994;265:
1072–4.
[122] Deruelle M, Leger L, Tirrell M. Adhesion at the solid–
elastomer interface: influence of the interfacial chains.
Macromolecules 1995;28:7419–28.
[123] Geoghegan M, Clarke CJ, Boue F, Menelle A, Russ T,
Bucknall DG. The kinetics of penetration of grafted polymers
into a network. Macromolecules 1999;32:5106–14.
[124] Hester JF, Bannerjee P, Mayes AM. Preparation of protein-
resistant surfaces on poly(vinylidene fluoride) membranes
via surface segregation. Macromolecules 1999;32:
1643–4650.
[125] Yethiraj A. Entropic and enthalpic surface segregation from
blends of branched and linear polymers. Phys Rev Lett 1995;
74:2018–21.
[126] Geoghegan M, Boue F, Menelle A, Abel F, Russ T, Ermer H,
Brenn R, Bucknall DG. Surface segregation from polystyrene
networks. J Phys: Condens Matter 2000;12:5129–42.
[127] Genzer J, Kramer EJ. Wetting of substrates with phase-
separated binary mixtures. Phys Rev Lett 1997;78:4946–9.
[128] Genzer J, Kramer EJ. Pretransitional thinning of a polymer
wetting layer. Europhys Lett 1998;44:180–5.
[129] Huang E, Rockford L, Russell TP. Nanodomain control in
copolymer thin films. Nature 1998;395:757–8.
[130] Hariharan A, Kumar SK, Russell TP. Reversal of the isotope
effect in the surface behavior of binary polymer blends.
J Chem Phys 1993;98:4163–73.
[131] Budkowski A, Rysz J, Scheffold F, Klein J. Surface
enrichment-depletion duality in a binary polymer blend.
Europhys Lett 1998;43:404–9.
[132] Walheim S, Schaffer E, Mlynek J, Steiner U. Nanophase-
separated polymer films as high-performance antireflection
coatings. Nature 1999;283:520–2.
[133] Geoghegan M, Jones RAL, Payne RS, Sakellariou P, Clough
AS, Penfold J. Lamellar structure in a thin polymer blend
film. Polymer 1994;35:2019–27.
[134] Nesterov A, Horichko V, Lipatov Y. Phase separation of
poly(vinyl acetate)–poly(methyl methacrylate) mixtures in
thin films. Makromol Chem, Rapid Commun 1991;12:
571–4.
[135] Walheim S, Boltau M, Mlynek J, Krausch G, Steiner U.
Structure formation via polymer demixing in spin-cast films.
Macromolecules 1997;30:4995–5003.
[136] Walheim S, Boltau M, Steiner U, Krausch G. Phase
separation in thin films of strongly incompatible polymer
blends. In: Richards RW, Peace SK, editors. Polymer
M. Geoghegan, G. Krausch / Prog. Polym. Sci. 28 (2003) 261–302298

surfaces and interfaces III. Chichester: Wiley; 1999.
p. 75–99.
[137] Boltau M, Walheim S, Mlynek J, Krausch G, Steiner U.
Surface-induced structure formation of polymer blends on
patterned substrates. Nature 1998;391:877–9.
[138] Rockford L, Liu Y, Mansky P, Russell TP, Yoon M, Mochrie
SGJ. Polymers on nanoperiodic heterogeneous surfaces. Phys
Rev Lett 1999;82:2602–5.
[139] Tanaka K, Takahara A, Kajiyama T. Film thickness
dependence of the surface structure of immiscible poly-
styrene/poly(methyl methacrylate) blends. Macromolecules
1996;29:3232–9.
[140] Dalnoki-Veress K, Forrest JA, Stevens JR, Dutcher JR. Phase
separation morphology of spin-coated polymer blend thin
films. Physica A 1997;239:87–94.
[141] Muller-Buschbaum P, O’Neill SA, Affrossman S, Stamm M.
Phase separation and dewetting of weakly incompatible
polymer blend films. Macromolecules 1998;31:5003–9.
[142] Zhang Newby B, Wakabayashi K, Composto RJ. Confine-
ment induced stabilization in polymer blend thin films.
Polymer 2001;42:9155–62.
[143] Wang H, Composto RJ, Hobbie EK, Han CC. Multiple lateral
length scales in phase-separating thin-film polymer blends.
Langmuir 2001;17:2857–60.
[144] Gutmann JS, Muller-Buschbaum P, Stamm M. Complex
pattern formation by phase separation of polymer blends in
thin films. Faraday Discuss 1999;112:285–97.
[145] Wendlandt M, Kerle T, Heuberger M, Klein J. Phase
separation in thin films of polymer blends: the influence of
symmetric boundary conditions. J Polym Sci, Part B: Polym
Phys 2000;38:831–7.
[146] Flebbe T, Dunweg B, Binder K. Phase separation versus
wetting: a mean field theory for symmetrical polymer
mixtures confined between selectively attractive walls.
J Phys II 1995;6:667–95.
[147] Karim A, Slawecki TM, Kumar SK, Douglas JF, Satija SK,
Han CC, Russell TP, Liu Y, Overney R, Sokolov J,
Rafailovich MH. Phase-separation induced surface patterns
in thin polymer blend films. Macromolecules 1998;31:
57–62.
[148] Svoboda P, Kressler J, Inoue T. Crystalline morphology in
polymer blends via competition with spinodal decompo-
sition. J Macromol Sci: Phys 1996;B35:505–25.
[149] Svoboda P, Keyzlarova L, Saha P, Rybnikar F, Chiba T,
Inoue T. Spinodal decomposition and succeeding crystal-
lization in PCL/SAN blends. Polymer 1999;40:1459–63.
[150] Moffitt M, Rharbi Y, Li H, Winnik MA. Novel morphology
evolution in thick films of a polymer blend. Macromolecules
2002;35:3321–4.
[151] Pron A, Rannou P. Processible conjugated polymers: from
organic semiconductors to organic metals and superconduc-
tors. Prog Polym Sci 2002;27:135–90.
[152] Kawase T, Sirringhaus H, Friend RH, Shimoda T. Inkjet
printed via-hole interconnections and resistors for all-
polymer transistor circuits. Adv Mater 2001;13:2001.
[153] Sirringhaus H, Kawase T, Friend RH, Shimoda T, Inbase-
karan M, Wu W, Woo EP. High-resolution inkjet printing of
all-polymer transistor circuits. Science 2000;290:2123–6.
[154] van Hutten PF, Krasnikov VV, Hadziioannou G. Role of
interfaces in semiconducting polymer optoelectronic devices.
In: Salaneck WR, Seki K, Kahn A, Pireaux J-J, editors.
Conjugated polymer and molecular interfaces. New York:
Marcel Dekker; 2001. p. 113–52.
[155] Halls JJM, Pichler K, Friend RH, Moratti SC, Holmes AB.
Exciton diffusion and dissociation in a poly( p-phenylene-
vinylene)/C60 heterojunction photovoltaic cell. Appl Phys
Lett 1996;68:3120–2.
[156] Mullins WW, Sekerka RF. Stability of a planar interface
during solidification of a dilute binary alloy. J Appl Phys
1964;35:444–51.
[157] Ho PKH, Kim J-S, Burroughes JH, Becker H, Li SFY, Brown
TM, Cacialli F, Friend RH. Molecular-scale interface
engineering for polymer light-emitting diodes. Nature
2000;404:481–4.
[158] Greczynski G, Kugler T, Salaneck WR. Characterization of
the PEDOT–PSS system by means of X-ray and ultraviolet
photoelectron spectroscopy. Thin Solid Films 1999;354:
129–35.
[159] Jukes PC. Grazing incidence X-ray diffraction and neutron
reflection studies of semi-crystalline polymer surfaces and
interfaces. PhD Thesis. University of Sheffield; 2002.
[160] Arias AC, MacKenzie JD, Stevenson R, Halls JJM,
Inbasekaran M, Woo EP, Richards D, Friend RH. Photo-
voltaic performance and morphology of polyfluorene blends:
a combined microscopic and photovoltaic investigation.
Macromolecules 2001;34:6005–13.
[161] Arias AC. Conjugated polymer phase separation and three-
dimensional thin-film structure for photovoltaics. PhD
Thesis. University of Cambridge; 2001.
[162] Arias AC, Corcoran N, Banach M, Friend RH, MacKenzie
JD, Huck WTS. Vertically segregated polymer-blend photo-
voltaic thin-film structures through surface-mediated solution
processing. Appl Phys Lett 2002;80:1695–7.
[163] Morgado J, Moons E, Friend RH, Cacialli F. De-mixing of
polyfluorene-based blends by contact with acetone: electro-
and photo-luminescence probes. Adv Mater 2001;13:810–4.
[164] Krausch G. Dewetting at the interface between two
immiscible polymers. J Phys: Condens Matter 1997;9:
7741–52.
[165] Findenegg GH, Herminghaus S. Wetting: statics and
dynamics. Curr Opin Colloid Interf Sci 1997;2:301.
[166] Seemann R, Herminghaus S, Jacobs K. Gaining control of
pattern formation of dewetting liquid films. J Phys: Condens
Matter 2001;13:4925–38.
[167] Maas JH, Cohen Stuart MA, Leermakers FAM, Besseling
NAM. Wetting transition in a polymer brush: polymer
droplet coexisting with two film thicknesses. Langmuir 2000;
16:3478–81.
[168] Liu Y, Rafailovich MH, Sokolov J, Schwarz SA, Zhong X,
Eisenberg A, Kramer EJ, Sauer BB, Satija SK. Wetting
behavior of homopolymer films on chemically similar block
copolymer surfaces. Phys Rev Lett 1994;73:440–3.
[169] Bergeron V, Bonn D, Martin JY, Vovelle L. Controlling
droplet deposition with polymer additives. Nature 2000;405:
772–5. see also Klein J. Smart polymer solutions. Nature
2000;405:745.
[170] Steinhart M, Wendorff JH, Greiner A, Wehrspohn RB,
Nielsch K, Schilling J, Choi J, Gosele U. Polymer nanotubes
by wetting of ordered porous templates. Science 2002;296:
1997.
[171] Aussillous P, Quere D. Liquid marbles. Nature 2001;411:
M. Geoghegan, G. Krausch / Prog. Polym. Sci. 28 (2003) 261–302 299

924–7. see also Mahadevan L. Non-stick water. Nature
2001;411:895.
[172] Bico J, Marzolin C, Quere D. Pearl drops. Europhys Lett
1999;47:220–6.
[173] Reiter G. Dewetting of thin polymer films. Phys Rev Lett
1992;68:75–8.
[174] Brochard Wyart F, Daillant J. Drying of solids wetted by thin
liquid films. Can J Phys 1990;68:1084–8.
[175] Israelachvili JN. Intermolecular and surface forces. London:
Academic Press; 1991.
[176] Suh KY, Park J, Lee HH. Controlled polymer dewetting by
physical confinement. J Chem Phys 2002;116:7714–8.
[177] Bischof J, Scherer D, Herminghaus S, Leiderer P. Dewetting
modes of thin metallic films: nucleation of holes and spinodal
dewetting. Phys Rev Lett 1996;77:1536–9.
[178] Xie R, Karim A, Douglas JF, Han CC, Weiss RA. Spinodal
dewetting of thin polymer films. Phys Rev Lett 1998;81:
1251–4.
[179] Jacobs K, Herminghaus S, Mecke KR. Thin liquid polymer
films rupture via defects. Langmuir 1998;14:965–9.
[180] Karapanagiotis I, Evans DF, Gerberich WW. Leveling and
dewetting processes of nanoindentation-induced defects on
thin polymer films. Macromolecules 2001;34:3741–7.
[181] Karapanagiotis I, Evans DF, Gerberich WW. Nucleation
processes for dewetting initiation of thin polymer films.
Langmuir 2001;17:3266–72.
[182] Karapanagiotis I, Gerberich WW, Evans DF. Early dewetting
stages of thin polymer films initiated by nanoindentation.
Langmuir 2001;17:2375–9.
[183] Muller-Buschbaum P, Gutmann JS, Stamm M. Dewetting of
confined polymer films: an X-ray and neutron scattering
study. Phys Chem, Chem Phys 1999;1:3857–63.
[184] Muller-Buschbaum P, Vanhoorne P, Scheumann V, Stamm
M. Observation of nano-dewetting structures. Europhys Lett
1997;40:655–60.
[185] Rehse N, Wang C, Hund M, Geoghegan M, Magerle R,
Krausch G. Stability of thin polymer films on a corrugated
substrate. Eur Phys J E 2001;4:69–76.
[186] Seemann R, Herminghaus S, Jacobs K. Dewetting patterns
and molecular forces: a reconciliation. Phys Rev Lett 2001;
86:5534–7.
[187] Sharma A, Reiter G. Instability of thin polymer films on
coated substrates: rupture, dewetting, and drop formation.
J Colloid Interf Sci 1996;178:383–99.
[188] Seemann R, Herminghaus S, Jacobs K. Shape of a liquid
front upon dewetting. Phys Rev Lett 2001;87:196101.
[189] Muller M, MacDowell LG, Muller-Buschbaum P, Wunnike
O, Stamm M. Nano-dewetting: interplay between van der
Waals- and short-ranged interactions. J Chem Phys 2001;
115:9960–9.
[190] Masson J-L, Green PF. Hole formation in thin polymer films:
a two-stage process. Phys Rev Lett 2002;88:205504.
[191] Higgins AM, Sferrazza M, Jones RAL, Jukes PC, Sharp JS,
Dryden LE, Webster J. The timescale of spinodal dewetting
at a polymer/polymer interface. Eur Phys J E 2002;8:
137–43.
[192] Kargupta K, Konnur R, Sharma A. Instability and pattern
formation in thin liquid films on chemically heterogeneous
substrates. Langmuir 2000;16:10243–53.
[193] Kargupta K, Konnur R, Sharma A. Spontaneous dewetting
and ordered patterns in evaporating thin liquid films on
homogeneous and heterogeneous substrates. Langmuir 2001;
17:1294–305.
[194] Khanna R, Sharma A. Pattern formation in spontaneous
dewetting of thin apolar films. J Colloid Interf Sci 1997;195:
42–50.
[195] Sharma A, Khanna R. Pattern formation in unstable thin
liquid films. Phys Rev Lett 1998;81:3463–6.
[196] Sharma A, Khanna R. Pattern formation in unstable thin
liquid films under the influence of antagonistic short- and
long-range forces. J Chem Phys 1999;110:4929–36.
[197] Higgins AM, Jones RAL. Anisotropic spinodal dewetting as
a route to self-assembly of patterned surfaces. Nature 2000;
404:476–8.
[198] Kargupta K, Sharma A. Templating of thin films induced by
dewetting on patterned surfaces. Phys Rev Lett 2001;86:
4536–9.
[199] Konnur R, Kargupta K, Sharma A. Instability and mor-
phology of thin liquid films on chemically heterogeneous
substrates. Phys Rev Lett 2000;84:931–4.
[200] Kargupta K, Sharma A. Morphological self-organization by
dewetting in thin films on chemically patterned substrates.
J Chem Phys 2002;116:3042–51.
[201] Kargupta K, Sharma A. Dewetting of thin films on periodic
physically and chemically patterned surfaces. Langmuir
2002;18:1893–903.
[202] Reiter G. Dewetting of highly elastic thin polymer films.
Phys Rev Lett 2001;87:186101.
[203] Shenoy V, Sharma A. Dewetting of glassy polymer films.
Phys Rev Lett 2002;88:236101.
[204] Saulnier F, Raphael E, de Gennes P-G. Dewetting of thin
polymer films near the glass transition. Phys Rev Lett 2002;
88:196101.
[205] Reiter G, Khanna R, Sharma A. Enhanced instability in thin
liquid films by improved compatibility. Phys Rev Lett 2000;
85:1432–5.
[206] Reiter G, Sharma A, Casoli A, David M-O, Khanna R, Auroy
P. Thin film instability induced by long-range forces.
Langmuir 1999;15:2551–8.
[207] Reiter G, Sharma A, Khanna R, Casoli A, David M-O. The
strength of long-range forces across thin liquid films.
J Colloid Interf Sci 1999;214:126–8.
[208] Reiter G, Sharma A, Casoli A, David M-O, Khanna R, Auroy
P. Destabilizing effect of long-range forces in thin liquid
films on wettable substrates. Europhys Lett 1999;46:512–8.
[209] David MO, Reiter G, Sitthaı T, Schultz J. Deformation of a
glassy polymer film by long-range intermolecular forces.
Langmuir 1998;14:5667–72.
[210] Oslanec R, Costa AC, Composto RJ, Vlcek P. Effect of block
copolymer adsorption on thin film dewetting kinetics.
Macromolecules 2000;33:5505–12.
[211] Debregeas G, de Gennes P-G, Brochard-Wyart F. The life
and death of bare viscous bubbles. Science 1998;279:
1704–7.
[212] Debregeas G, Martin P, Brochard-Wyart F. Viscous bursting
of suspended films. Phys Rev Lett 1995;75:3886–9.
[213] Dalnoki-Veress K, Nickel BG, Roth C, Dutcher JR. Hole
formation and growth in freely standing polystyrene films.
Phys Rev E 1999;59:2153–6.
[214] Dalnoki-Veress K, Forrest JA, Dutcher JR. Mechanical
confinement effects on the phase separation morphology of
polymer blend thin films. Phys Rev E 1998;57:5811–7.
M. Geoghegan, G. Krausch / Prog. Polym. Sci. 28 (2003) 261–302300

[215] Dalnoki-Veress K, Nickel BG, Dutcher JR. Dispersion-
driven morphology of mechanically confined polymer films.
Phys Rev Lett 1999;82:1486–9.
[216] Martin A, Rossier O, Buguin A, Auroy P, Brochard-Wyart F.
Spinodal dewetting of thin liquid films at soft interfaces. Eur
Phys J E 2000;3:337–41.
[217] Shenoy V, Sharma A. Pattern formation in a thin solid film
with interactions. Phys Rev Lett 2001;86:119–22.
[218] Martin A, Buguin A, Brochard-Wyart F. Dewetting nuclea-
tion centers at soft interfaces. Langmuir 2001;17:6553–9.
[219] Young T. An essay on the cohesion of fluids. Phil Trans R
Soc Lond 1805;95:65–87.
[220] Redon C, Brochard-Wyart F, Rondelez F. Dynamics of
dewetting. Phys Rev Lett 1991;66:715–8.
[221] Segalman RA, Green PF. Dynamics of rims and the onset of
spinodal dewetting at liquid/liquid interfaces. Macromol-
ecules 1999;32:801–7.
[222] Jacobs K, Seemann R, Schatz G, Herminghaus S. Growth of
holes in liquid films with partial slippage. Langmuir 1998;14:
4961–3.
[223] Qu S, Clarke CJ, Liu Y, Rafailovich MH, Sokolov J, Phelan
KC, Krausch G. Dewetting dynamics at a polymer–polymer
interface. Macromolecules 1997;30:3640–5.
[224] Wang C, Krausch G, Geoghegan M. Dewetting at a
polymer–polymer interface: film thickness dependence.
Langmuir 2001;17:6269–74.
[225] Faldi A, Composto RJ, Winey KI. Unstable polymer bilayers.
1. Morphology of dewetting. Langmuir 1995;11:4855–61.
[226] Pan Q, Winey KI, Hu HH, Composto RJ. Unstable polymer
bilayers. 2. The effect of film thickness. Langmuir 1997;13:
1758–66.
[227] Edgecombe SR, Gardiner JM, Matsen MW. Suppressing
autophobic dewetting by using a bimodal brush. Macromol-
ecules 2002;35:6475–7.
[228] Reiter G, Auroy P, Auvray L. Instabilities of thin polymer
films on layers of chemically identical grafted molecules.
Macromolecules 1996;29:2150–7.
[229] Voronov A, Shafranska O. Synthesis of chemically grafted
polystyrene brushes and their influence on the dewetting in
thin polystyrene films. Langmuir 2002;18:4471–7.
[230] Kerle T, Yerushalmi-Rozen R, Klein J. Cross-link-induced
autophobicity in polymer melts: a re-entrant wetting
transition. Europhys Lett 1997;38:207–12.
[231] Kerle T, Yerushalmi-Rozen R, Klein J. Wetting and
autophobicity of a polymer melt on a network of itself.
Macromolecules 1998;31:422–9.
[232] Russ T, Brenn R, Abel F, Boue F, Geoghegan M. Reptation
and interdiffusion in polystyrene networks. Eur Phys J E
2001;4:419–33.
[233] Klaumunzer S, Zhu QQ, Schnabel W, Schumacher G. Ion-
beam-induced crosslinking of polystyrene—still an unsolved
puzzle. Nucl Instr Meth B 1996;116:154–8.
[234] Reiter G, Khanna R. Kinetics of autophobic dewetting of
polymer films. Langmuir 2000;16:6351–7.
[235] Reiter G, Khanna R. Real-time determination of the slippage
length in autophobic polymer dewetting. Phys Rev Lett 2000;
85:2753–6.
[236] Henn G, Bucknall DG, Stamm M, Vanhoorne P, Jerome R.
Chain end effects and dewetting in thin polymer films.
Macromolecules 1996;29:4305–13.
[237] Zhao W, Rafailovich MH, Sokolov J, Fetters LJ, Plano R,
Sanyal MK, Sinha SK, Sauer BB. Wetting properties of thin
liquid polyethylene propylene films. Phys Rev Lett 1993;70:
1453–6.
[238] Silberberg A. Distribution of conformations and chain ends
near the surface of a melt of linear flexible macromolecules.
J Colloid Interf Sci 1982;90:86–91.
[239] Semenov AN. Theory of long-range interactions in polymer
systems. J Phys II 1996;6:1759–80.
[240] Muller M. Chain conformations and correlations in thin
polymer films: a Monte Carlo study. J Chem Phys 2002;116:
9930–8.
[241] Brulet A, Boue F, Menelle A, Cotton JP. Conformation of
polystyrene chain in ultrathin films obtained by spin coating.
Macromolecules 2000;33:997–1001.
[242] Jones RL, Kumar SK, Ho DL, Briber RM, Russell TP. Chain
conformation in ultrathin polymer films. Nature 1999;400:
146–9.
[243] Jones RL, Kumar SK, Ho DL, Briber RM, Russell TP. Chain
conformation in ultrathin polymer films using small-angle
neutron scattering. Macromolecules 2001;34:559–67.
[244] Kraus J, Muller-Buschbaum P, Kuhlmann T, Schubert DW,
Stamm M. Confinement effects on the chain conformation in
thin polystyrene films. Europhys Lett 2000;49:210–6.
[245] Shuto K, Oishi Y, Kajiyama T. Non-equilibrium character-
istics of a two-dimensional ultrathin film prepared by the
water casting method. Polymer 1995;36:549–57.
[246] Wensink KDF, Jerome B. Dewetting induced by density
fluctuations. Langmuir 2002;18:413–6.
[247] Yerushalmi-Rozen R, Kerle T, Klein J. Alternative dewetting
pathways of thin liquid films. Science 1999;285:1254–6.
[248] de Crevoisier G, Fabre P, Corpart J-M, Leibler L. Switchable
tackiness and wettability of a liquid crystalline polymer.
Science 1999;285:1246–9. see also Russell TP, Kim HC.
Tack—a sticky subject. Science 1999;285:1219.
[249] Lin Z, Kerle T, Russell TP, Schaffer E, Steiner U. Electric
field induced dewetting at polymer/polymer interfaces.
Macromolecules 2002;35:6255–62.
[250] Abbott NL, Folkers JP, Whitesides GM. Manipulation of the
wettability of surfaces on the 0.1- to 1-micrometer scale
through micromachining and molecular self-assembly.
Science 1992;257:1380–2.
[251] Biebuyck HA, Whitesides GM. Self-organisation of organic
liquids on patterned self-assembled monolayers of alka-
nethiolates on gold. Langmuir 1994;10:2790–3.
[252] Gau H, Herminghaus S, Lenz P, Lipowsky R. Liquid
morphologies on structured surfaces: from microchannels
to microchips. Science 1999;283:46–9. see also Grunze
M. Driven liquids. Science 1999;283:41.
[253] Swain PS, Lipowsky R. Wetting between structured surfaces:
liquid bridges and induced forces. Europhys Lett 2000;49:
203–9.
[254] Karim A, Douglas JF, Lee BP, Glotzer SC, Rogers JA,
Jackman RJ, Amis EJ, Whitesides GM. Phase separation of
ultrathin polymer-blend films on patterned substrates. Phys
Rev E 1998;57:R6723–6.
[255] Ermi BD, Nisato G, Douglas JF, Rogers JA, Karim A.
Coupling between phase separation and surface deformation
modes in self-organizing polymer blend films. Phys Rev Lett
1998;81:3900–3.
[256] Nisato G, Ermi BD, Douglas JF, Karim A. Excitation of
surface deformation modes of a phase-separating polymer
M. Geoghegan, G. Krausch / Prog. Polym. Sci. 28 (2003) 261–302 301

blend on a patterned substrate. Macromolecules 1999;32:
2356–64.
[257] Cyganik P, Bernasik A, Budkowski A, Bergues B, Kowalski
K, Rysz J, Lekki J, Lekka M, Postawa Z. Phase decompo-
sition in polymer blend films cast on substrates patterned
with self-assembled monolayers. Vacuum 2001;63:307–13.
[258] Song S, Mochrie SGJ. Tricriticality in the orientational phase
diagram of stepped Si(113) surfaces. Phys Rev Lett 1994;73:
995–8.
[259] Song S, Mochrie SGJ. Attractive step–step interactions,
tricriticality, and faceting in the orientational phase diagram
of silicon surfaces between [113] and [114]. Phys Rev B
1995;51:10068–84.
[260] Song S, Mochrie SGJ, Stephenson GB. Faceting kinetics of
stepped Si(113) surfaces: a time resolved X-ray scattering
study. Phys Rev Lett 1995;74:5240–3.
[261] Fasolka MJ, Harris DJ, Mayes AM, Yoon M, Mochrie SGJ.
Observed substrate topography-mediated lateral patterning of
diblock copolymer films. Phys Rev Lett 1997;79:3018–21.
[262] Rockford L, Mochrie SGJ, Russell TP. Propagation of
nanopatterned substrate templated ordering of block copoly-
mers in thick films. Macromolecules 2001;34:1487–92.
[263] Russell TP, Coulon G, Deline VR, Miller DC. Characteristics
of the surface-induced orientation for symmetric diblock PS/
PMMA copolymers. Macromolecules 1989;22:4600–6.
[264] Fukunaga K, Elbs H, Krausch G. Thin film phase separation
on a nanoscopically patterned substrate. Langmuir 2000;16:
3474–7.
[265] Suh KY, Lee HH. Anistropic hole formation in thin polymer
films confined by walls. J Chem Phys 2001;115:8204–8.
[266] Yoo PJ, Suh KY, Lee HH. Short- and long-range interactions
in thin films of polymer blends in microchannels. Macro-
molecules 2002;35:3205–12.
[267] Schift H, Heyderman LJ, Auf der Maur M, Gobrecht J.
Pattern formation in hot embossing of thin polymer films.
Nanotechnology 2001;12:173–7.
[268] Zhang Newby B, Composto RJ. Phase-morphology map of
polymer-blend thin films confined to narrow strips. Phys Rev
Lett 2001;87:098302.
[269] Schaffer E, Thurn-Albrecht T, Russell TP, Steiner U.
Electronically induced structure formation and pattern
transfer. Nature 2000;403:874–7.
[270] Schaffer E, Thurn-Albrecht T, Russell TP, Steiner U.
Electrohydrodynamic instabilities in polymer films. Euro-
phys Lett 2001;53:518–24.
[271] Lin Z, Kerle T, Baker SM, Hoagland DA, Schaffer E, Steiner
U, Russell TP. Electric field induced instabilities at liquid/
liquid interfaces. J Chem Phys 2001;114:2377–81.
[272] Lin Z, Kerle T, Russell TP, Schaffer E, Steiner U. Structure
formation at the interface of liquid/liquid bilayer in electric
field. Macromolecules 2002;35:3971–6.
[273] Thurn-Albrecht T, DeRouchey J, Russell TP, Jaeger HM.
Overcoming interfacial interactions with electric fields.
Macromolecules 2000;33:3250–3.
[274] Thurn-Albrecht T, Steiner R, DeRouchey J, Stafford CM,
Huang E, Bal M, Tuominen M, Hawker CJ, Russell TP.
Nanoscopic templates from oriented block copolymer films.
Adv Mater 2000;12:787–91.
[275] Thurn-Albrecht T, Schotter J, Kastle GA, Emley N,
Shibauchi T, Krusin-Elbaum L, Guarini K, Black CT,
Tuominen MT, Russell TP. Ultrahigh-density nanowire
arrays grown in self-assembled diblock copolymer tem-
plates. Science 2000;290:2126–9.
[276] Chou SY, Zhuang L. Lithographically induced self-assembly
of periodic polymer micropillar arrays. J Vac Sci Technol, B
1999;17:3197–202.
[277] Deshpande P, Sun X, Chou SY. Observation of dynamic
behavior of lithographically induced self-assembly of
supramolecular periodic pillar arrays in a homopolymer
film. Appl Phys Lett 2001;79:1688–90.
[278] Yang SY, Rubner MF. Micropatterning of polymer thin films
with pH-sensitive and cross-linkable hydrogen-bonded poly-
electrolyte multilayers. J Am Chem Soc 2002;124:2100–1.
[279] Sharp JS, Jones RAL. Micro-buckling as a route towards
surface patterning. Adv Mater 2002;14:799–802.
[280] van der Waals JD. Thermodynamische theorie der kapillaritat
unter Voraussetzung stetiger Dichteanderung. Z Phys Chem
1894;13:657–725. translated into English by Rowlinson JS.
J Stat Phys 1979;20:197–244.
[281] Fredrickson GH. Theoretical methods for polymer surfaces
and interfaces. In: Sanchez IC, editor. Physics of polymer
surfaces and interfaces. Boston: Butterworth–Heinemann;
1992. p. 1–28.
[282] Riley KF. Mathematical methods for the physical sciences.
Cambridge: Cambridge University Press; 1974. p. 332–40.
[283] Cohen SM, Muthukumar M. Critical wetting in two-
component polymer blends. J Chem Phys 1989;90:5749–55.
[284] Hariharan A, Kumar SK. Surface segregation in binary
polymer mixtures: a lattice model. Macromolecules 1991;24:
4909–17.
[285] Jerry RA, Nauman EB. Phase transitions in thin films of a
binary mixture. Phys Lett A 1992;167:198–204.
[286] Jones RAL, Kramer EJ, Rafailovich M, Sokolov J, Schwarz
SA. Surface enrichment in polymer blends: simple theory
and an experimental test. In: DeKoven BM, Rosenberg R,
Gellman AJ, editors. Interfaces between polymers, metals,
and ceramics. Pittsburgh: Materials Research Society; 1989.
p. 133–41.
M. Geoghegan, G. Krausch / Prog. Polym. Sci. 28 (2003) 261–302302