westside san joaquin river watershed coalition · westside san joaquin river semi-annual report...
TRANSCRIPT
San Joaquin Valley Drainage Authority
Westside San Joaquin River Watershed Coalition
Semi-Annual Monitoring Report 2011 Irrigation Season Report Assessment Monitoring Year
Covering the period: March through August, 2011
(Sampling Events 77 through 82)
November 30, 2011
Prepared by: Summers Engineering, Inc.
Consulting Engineers Hanford California
Prosecution Team Response to Comments - Attachment B
Prosecution Team Response to Comments - Attachment B
Westside San Joaquin River Semi-Annual Report Watershed Coalition June 15, 2011
i
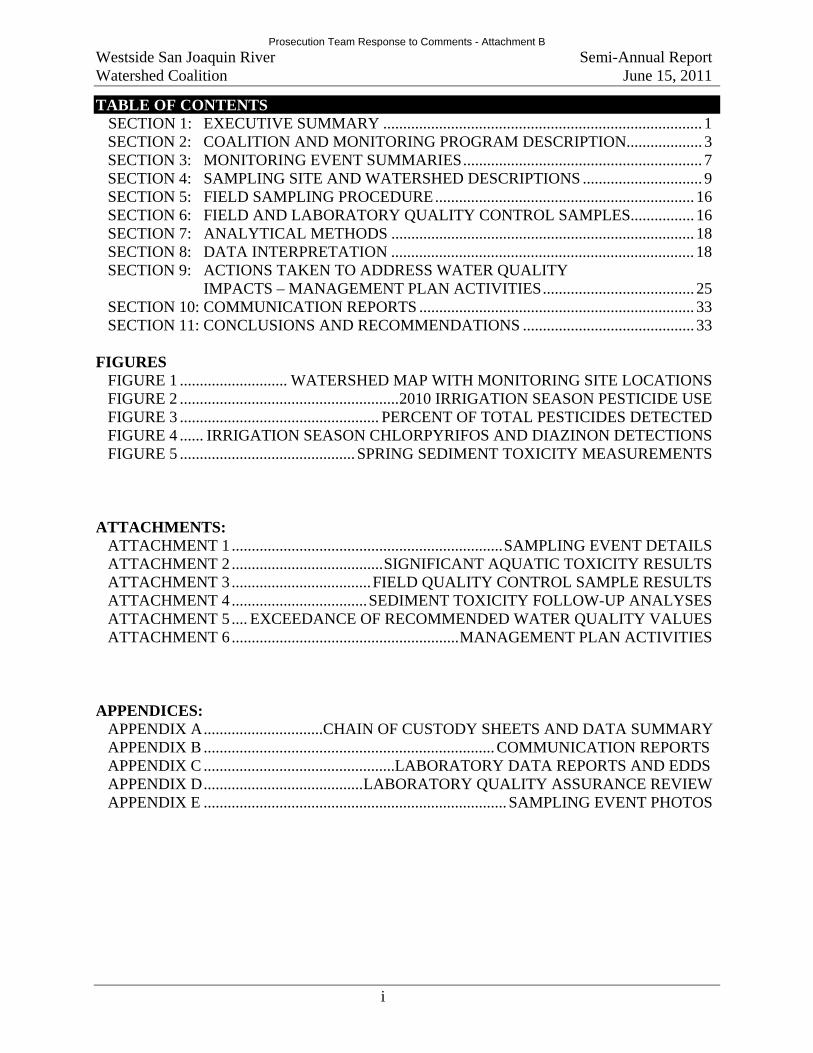
TABLE OF CONTENTS SECTION 1: EXECUTIVE SUMMARY ................................................................................ 1 SECTION 2: COALITION AND MONITORING PROGRAM DESCRIPTION................... 3 SECTION 3: MONITORING EVENT SUMMARIES............................................................ 7 SECTION 4: SAMPLING SITE AND WATERSHED DESCRIPTIONS .............................. 9 SECTION 5: FIELD SAMPLING PROCEDURE................................................................. 16 SECTION 6: FIELD AND LABORATORY QUALITY CONTROL SAMPLES................ 16 SECTION 7: ANALYTICAL METHODS ............................................................................ 18 SECTION 8: DATA INTERPRETATION ............................................................................ 18 SECTION 9: ACTIONS TAKEN TO ADDRESS WATER QUALITY IMPACTS – MANAGEMENT PLAN ACTIVITIES...................................... 25 SECTION 10: COMMUNICATION REPORTS ..................................................................... 33 SECTION 11: CONCLUSIONS AND RECOMMENDATIONS ........................................... 33
FIGURES FIGURE 1 ........................... WATERSHED MAP WITH MONITORING SITE LOCATIONS FIGURE 2 .......................................................2010 IRRIGATION SEASON PESTICIDE USE FIGURE 3 .................................................. PERCENT OF TOTAL PESTICIDES DETECTED FIGURE 4 ...... IRRIGATION SEASON CHLORPYRIFOS AND DIAZINON DETECTIONS FIGURE 5 ............................................ SPRING SEDIMENT TOXICITY MEASUREMENTS ATTACHMENTS:
ATTACHMENT 1 ....................................................................SAMPLING EVENT DETAILS ATTACHMENT 2 ......................................SIGNIFICANT AQUATIC TOXICITY RESULTS ATTACHMENT 3 ...................................FIELD QUALITY CONTROL SAMPLE RESULTS ATTACHMENT 4 ..................................SEDIMENT TOXICITY FOLLOW-UP ANALYSES ATTACHMENT 5 .... EXCEEDANCE OF RECOMMENDED WATER QUALITY VALUES ATTACHMENT 6 .........................................................MANAGEMENT PLAN ACTIVITIES
APPENDICES: APPENDIX A..............................CHAIN OF CUSTODY SHEETS AND DATA SUMMARY APPENDIX B .........................................................................COMMUNICATION REPORTS APPENDIX C ................................................LABORATORY DATA REPORTS AND EDDS APPENDIX D........................................LABORATORY QUALITY ASSURANCE REVIEW APPENDIX E ............................................................................ SAMPLING EVENT PHOTOS
Prosecution Team Response to Comments - Attachment B
Westside San Joaquin River Semi-Annual Report Watershed Coalition June 15, 2011
ii
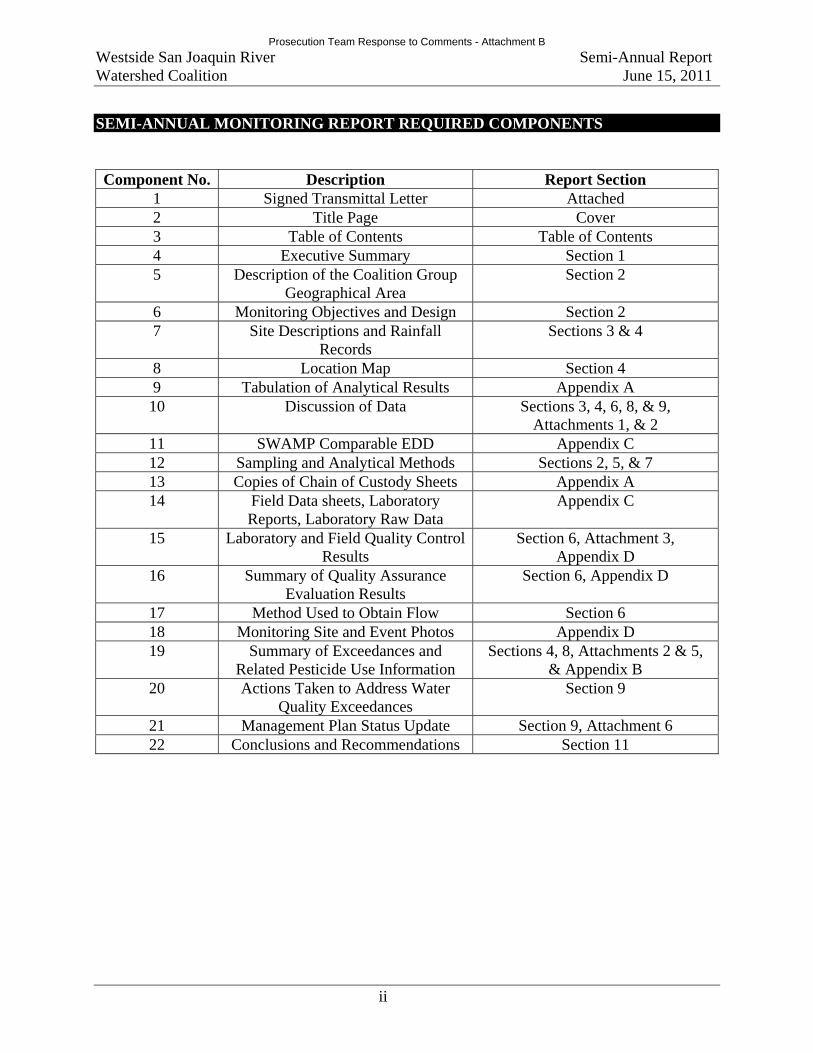
SEMI-ANNUAL MONITORING REPORT REQUIRED COMPONENTS
Component No. Description Report Section 1 Signed Transmittal Letter Attached 2 Title Page Cover 3 Table of Contents Table of Contents 4 Executive Summary Section 1 5 Description of the Coalition Group
Geographical Area Section 2
6 Monitoring Objectives and Design Section 2 7 Site Descriptions and Rainfall
Records Sections 3 & 4
8 Location Map Section 4 9 Tabulation of Analytical Results Appendix A 10 Discussion of Data Sections 3, 4, 6, 8, & 9,
Attachments 1, & 2 11 SWAMP Comparable EDD Appendix C 12 Sampling and Analytical Methods Sections 2, 5, & 7 13 Copies of Chain of Custody Sheets Appendix A 14 Field Data sheets, Laboratory
Reports, Laboratory Raw Data Appendix C
15 Laboratory and Field Quality Control Results
Section 6, Attachment 3, Appendix D
16 Summary of Quality Assurance Evaluation Results
Section 6, Appendix D
17 Method Used to Obtain Flow Section 6 18 Monitoring Site and Event Photos Appendix D 19 Summary of Exceedances and
Related Pesticide Use Information Sections 4, 8, Attachments 2 & 5,
& Appendix B 20 Actions Taken to Address Water
Quality Exceedances Section 9
21 Management Plan Status Update Section 9, Attachment 6 22 Conclusions and Recommendations Section 11
Prosecution Team Response to Comments - Attachment B
Westside San Joaquin River Semi-Annual Report Watershed Coalition June 15, 2011
1
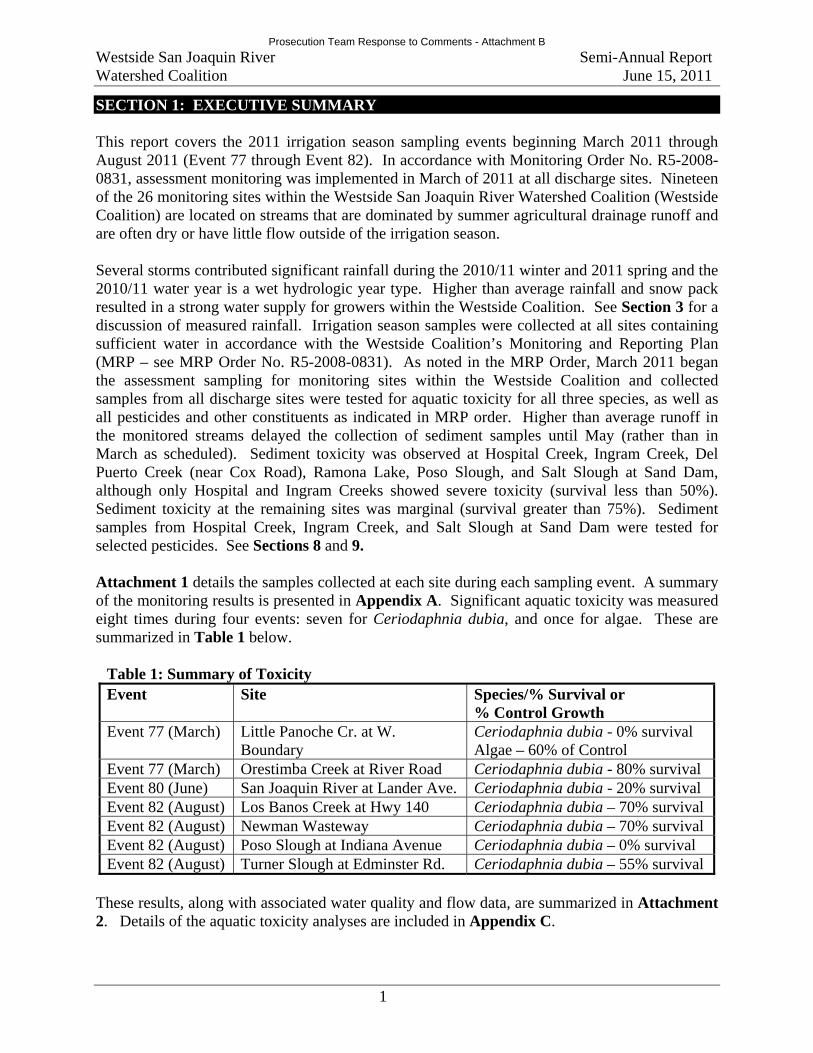
SECTION 1: EXECUTIVE SUMMARY This report covers the 2011 irrigation season sampling events beginning March 2011 through August 2011 (Event 77 through Event 82). In accordance with Monitoring Order No. R5-2008-0831, assessment monitoring was implemented in March of 2011 at all discharge sites. Nineteen of the 26 monitoring sites within the Westside San Joaquin River Watershed Coalition (Westside Coalition) are located on streams that are dominated by summer agricultural drainage runoff and are often dry or have little flow outside of the irrigation season. Several storms contributed significant rainfall during the 2010/11 winter and 2011 spring and the 2010/11 water year is a wet hydrologic year type. Higher than average rainfall and snow pack resulted in a strong water supply for growers within the Westside Coalition. See Section 3 for a discussion of measured rainfall. Irrigation season samples were collected at all sites containing sufficient water in accordance with the Westside Coalition’s Monitoring and Reporting Plan (MRP – see MRP Order No. R5-2008-0831). As noted in the MRP Order, March 2011 began the assessment sampling for monitoring sites within the Westside Coalition and collected samples from all discharge sites were tested for aquatic toxicity for all three species, as well as all pesticides and other constituents as indicated in MRP order. Higher than average runoff in the monitored streams delayed the collection of sediment samples until May (rather than in March as scheduled). Sediment toxicity was observed at Hospital Creek, Ingram Creek, Del Puerto Creek (near Cox Road), Ramona Lake, Poso Slough, and Salt Slough at Sand Dam, although only Hospital and Ingram Creeks showed severe toxicity (survival less than 50%). Sediment toxicity at the remaining sites was marginal (survival greater than 75%). Sediment samples from Hospital Creek, Ingram Creek, and Salt Slough at Sand Dam were tested for selected pesticides. See Sections 8 and 9. Attachment 1 details the samples collected at each site during each sampling event. A summary of the monitoring results is presented in Appendix A. Significant aquatic toxicity was measured eight times during four events: seven for Ceriodaphnia dubia, and once for algae. These are summarized in Table 1 below.
Table 1: Summary of Toxicity Event Site Species/% Survival or
% Control Growth Event 77 (March) Little Panoche Cr. at W.
Boundary Ceriodaphnia dubia - 0% survival Algae – 60% of Control
Event 77 (March) Orestimba Creek at River Road Ceriodaphnia dubia - 80% survival Event 80 (June) San Joaquin River at Lander Ave. Ceriodaphnia dubia - 20% survival Event 82 (August) Los Banos Creek at Hwy 140 Ceriodaphnia dubia – 70% survival Event 82 (August) Newman Wasteway Ceriodaphnia dubia – 70% survival Event 82 (August) Poso Slough at Indiana Avenue Ceriodaphnia dubia – 0% survival Event 82 (August) Turner Slough at Edminster Rd. Ceriodaphnia dubia – 55% survival
These results, along with associated water quality and flow data, are summarized in Attachment 2. Details of the aquatic toxicity analyses are included in Appendix C.
Prosecution Team Response to Comments - Attachment B
Westside San Joaquin River Semi-Annual Report Watershed Coalition June 15, 2011
2
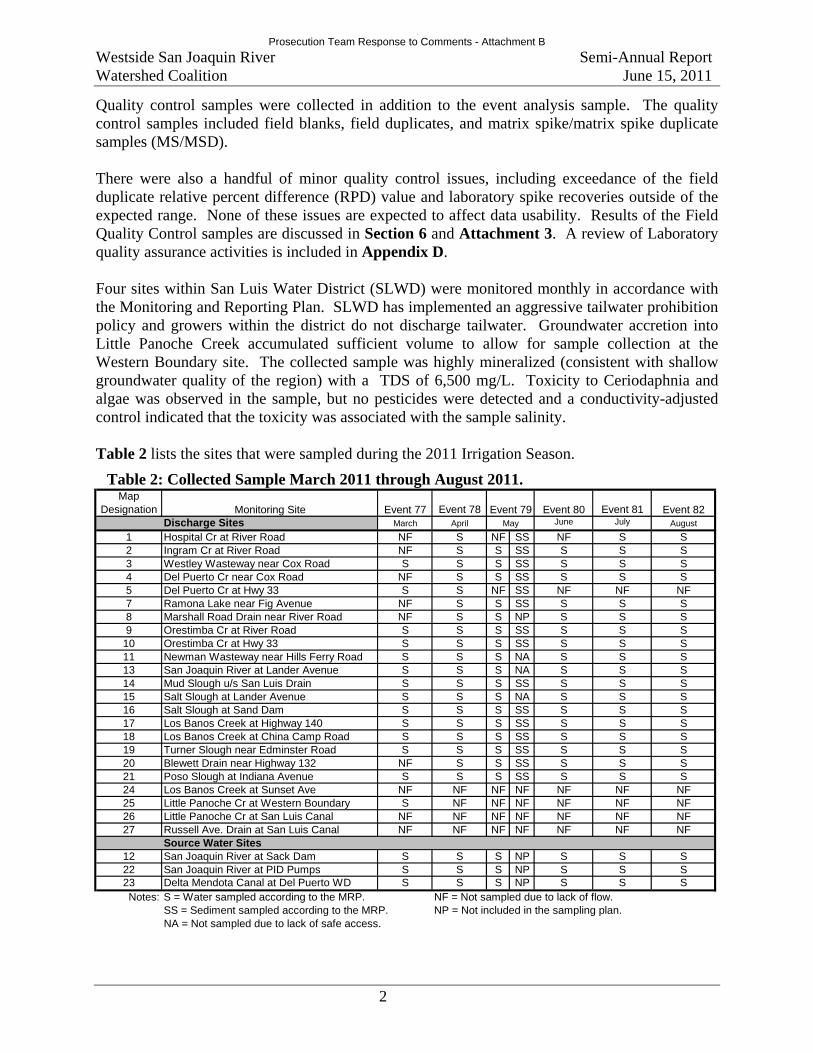
Quality control samples were collected in addition to the event analysis sample. The quality control samples included field blanks, field duplicates, and matrix spike/matrix spike duplicate samples (MS/MSD). There were also a handful of minor quality control issues, including exceedance of the field duplicate relative percent difference (RPD) value and laboratory spike recoveries outside of the expected range. None of these issues are expected to affect data usability. Results of the Field Quality Control samples are discussed in Section 6 and Attachment 3. A review of Laboratory quality assurance activities is included in Appendix D. Four sites within San Luis Water District (SLWD) were monitored monthly in accordance with the Monitoring and Reporting Plan. SLWD has implemented an aggressive tailwater prohibition policy and growers within the district do not discharge tailwater. Groundwater accretion into Little Panoche Creek accumulated sufficient volume to allow for sample collection at the Western Boundary site. The collected sample was highly mineralized (consistent with shallow groundwater quality of the region) with a TDS of 6,500 mg/L. Toxicity to Ceriodaphnia and algae was observed in the sample, but no pesticides were detected and a conductivity-adjusted control indicated that the toxicity was associated with the sample salinity. Table 2 lists the sites that were sampled during the 2011 Irrigation Season. Table 2: Collected Sample March 2011 through August 2011.
Map Designation Monitoring Site Event 77 Event 78 Event 80 Event 81 Event 82
Discharge Sites March April June July August
1 Hospital Cr at River Road NF S NF SS NF S S2 Ingram Cr at River Road NF S S SS S S S3 Westley Wasteway near Cox Road S S S SS S S S4 Del Puerto Cr near Cox Road NF S S SS S S S5 Del Puerto Cr at Hwy 33 S S NF SS NF NF NF7 Ramona Lake near Fig Avenue NF S S SS S S S8 Marshall Road Drain near River Road NF S S NP S S S9 Orestimba Cr at River Road S S S SS S S S
10 Orestimba Cr at Hwy 33 S S S SS S S S11 Newman Wasteway near Hills Ferry Road S S S NA S S S13 San Joaquin River at Lander Avenue S S S NA S S S14 Mud Slough u/s San Luis Drain S S S SS S S S15 Salt Slough at Lander Avenue S S S NA S S S16 Salt Slough at Sand Dam S S S SS S S S17 Los Banos Creek at Highway 140 S S S SS S S S18 Los Banos Creek at China Camp Road S S S SS S S S19 Turner Slough near Edminster Road S S S SS S S S20 Blewett Drain near Highway 132 NF S S SS S S S21 Poso Slough at Indiana Avenue S S S SS S S S24 Los Banos Creek at Sunset Ave NF NF NF NF NF NF NF25 Little Panoche Cr at Western Boundary S NF NF NF NF NF NF26 Little Panoche Cr at San Luis Canal NF NF NF NF NF NF NF27 Russell Ave. Drain at San Luis Canal NF NF NF NF NF NF NF
Source Water Sites12 San Joaquin River at Sack Dam S S S NP S S S22 San Joaquin River at PID Pumps S S S NP S S S23 Delta Mendota Canal at Del Puerto WD S S S NP S S SNotes: S = Water sampled according to the MRP. NF = Not sampled due to lack of flow.
SS = Sediment sampled according to the MRP. NP = Not included in the sampling plan.NA = Not sampled due to lack of safe access.
Event 79May
Prosecution Team Response to Comments - Attachment B
Westside San Joaquin River Semi-Annual Report Watershed Coalition June 15, 2011
3
SECTION 2: COALITION AND MONITORING PROGRAM DESCRIPTION In June, 2003, the San Joaquin Valley Drainage Authority (SJVDA) submitted a Conditional Waiver Report for the Westside San Joaquin River Watershed Coalition (Westside Coalition). The Westside Coalition watershed generally lies on the westside of the San Joaquin River from approximately the Stanislaus River on the north to 10 miles south of Mendota and encompasses an area of approximately 460,500 acres. There are approximately 4,000 landowners and 1,500 operators within the watershed. Most of the watershed receives water supplies from the Central Valley Project, while certain areas receive water from the State Water Project. In addition, some areas receive supplies from the San Joaquin River and local water sources, one area receives a Kings River supply, and some areas receive water from groundwater wells. The Delta-Mendota Canal and San Luis Canal run through the center of the watershed. Water deliveries are made to Federal Central Valley Project Contractors and to San Joaquin River Exchange Contractors from these facilities. State water deliveries are also made to one area. The Grassland Drainage Area encompasses 97,400 acres that are geographically within the watershed. The Grassland Drainage Area is covered under waste discharge requirements (No. 5-01-234), which regulates the discharge of subsurface drainage water through the San Luis Drain to the San Joaquin River. Tailwater is aggressively controlled and not allowed to discharge from the region. The area coordinates its separate monitoring and reporting program under the above waste discharge requirements. The Westside Coalition area also includes federal, state and private managed wetlands. These areas share water delivery and drainage conveyance systems with the surrounding agricultural areas. Due to the integrated nature of the water facilities the managed wetlands have joined the Westside Coalition as a wetland sub-watershed participant to comply with the Conditional Waiver and effectively and efficiently address water quality issues. The effects of discharges from the wetland areas are covered in this monitoring program. The communities of Grayson, Westley, Vernalis, Crows Landing, Patterson, Newman, Gustine, Stevinson, Los Banos, Dos Palos, South Dos Palos, Firebaugh, Mendota and Tranquillity lie within the geographic area of the Westside Coalition. These communities do not have discharges from irrigated lands and are not included in the Westside Coalition, but contribute storm waters and municipal waste waters to the watershed and may impact discharges from irrigated lands. Interstate Highway 5 and State Highways 33, 140, 165 and 152 and many county roads run through the geographic area of the Westside Watershed. Storm water discharges from these roads and highways can contribute contaminants to the same water bodies that carry agricultural return water. The San Joaquin Valley Drainage Authority, a joint powers agency, is the umbrella organization for the Westside Coalition for purposes of the Conditional Waiver of Waste Discharge Requirements for Discharges from Irrigated Lands within the Central Valley Region (Resolution No.R5-2003-0105). On July 30, 2004, the Westside Coalition received approval for its irrigated
Prosecution Team Response to Comments - Attachment B
Westside San Joaquin River Semi-Annual Report Watershed Coalition June 15, 2011
4
agricultural monitoring plan from the Central Valley Regional Water Quality Control Board. The first sampling event took place on July 6, 2004, with subsequent event samples collected monthly. In February, 2008, the Westside Coalition received approval for a revised Monitoring and Reporting Plan (Revised MRP). The Revised MRP was designed to focus monitoring efforts at sites with known water or sediment issues and to support the Management Plan issues. The Revised MRP was implemented in March of 2008. Monitoring and Reporting Program Order No. R5-2008-0831 (MRP Order or MRP) was issued by the Regional Board in September 2008. This order was largely reflective of the Revised MRP and took effect in March 2009. The MRP Order includes a targeted monthly sampling plan for 26 monitoring sites within the Coalition area as well as plans for sampling for two rain events during each year. The monitoring sites include three source water sites and 23 sites that discharge agricultural drain water. Four of the discharge sites are within San Luis Water District, which maintains a tailwater discharge prohibition. These sites generally only discharge during severe storm events. During any given sampling event, each accessible site is visited, visually assessed, and samples are collected in accordance with the field sampling manual. See Table 2. The objectives of the original monitoring program are:
To assess the existing water quality characteristics of major agricultural drains within the watershed area.
To determine the location and magnitude of water quality problems. To determine the cause of water quality problems and develop solutions.
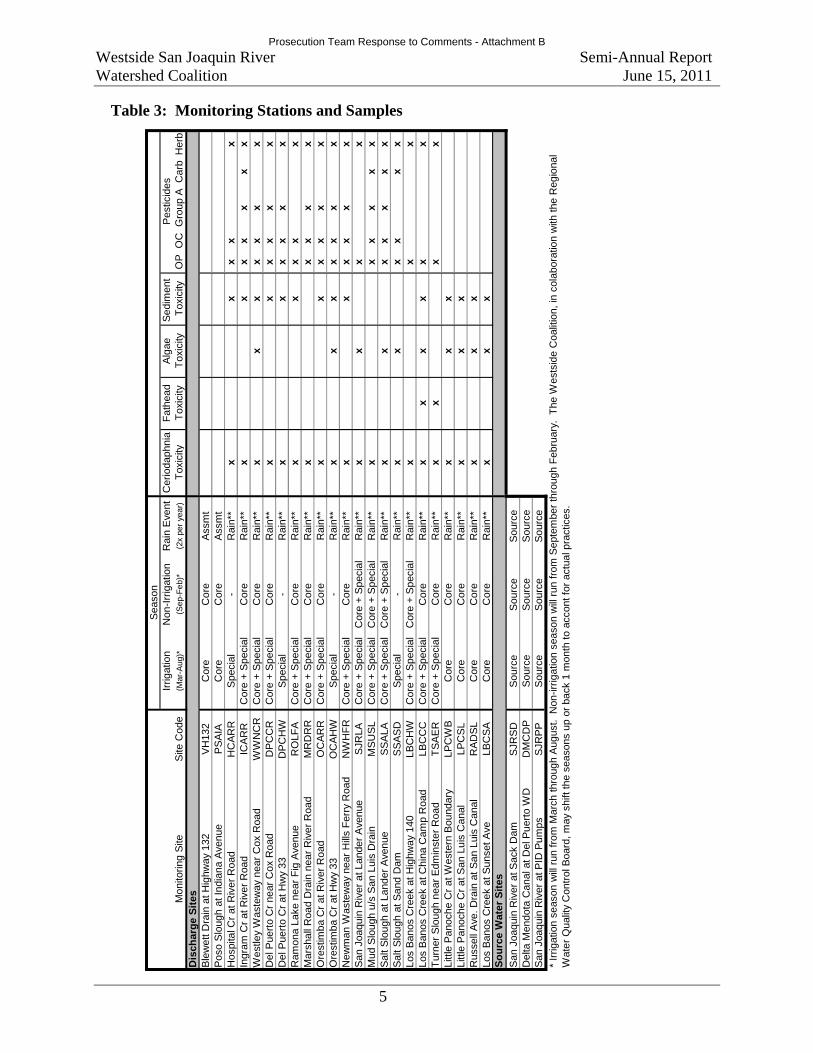
Three sampling crews have been trained by the analytical laboratories to collect samples according to the Westside Coalition’s QAPP and Field Sampling Manual. These crews are responsible for collecting samples at each of the 26 sites; the field coordinator for the northerly region is responsible for collecting samples north of Newman Wasteway. The field coordinator for the southerly region is responsible for collecting samples south of (and including) Newman Wasteway, and staff from San Luis Water District are responsible for monitoring and sampling sites within that district. The sampling responsibilities include completion of the field data sheets, collection of water and sediment samples, completion of labels and chain of custody sheets, and coordination with the labs for sample pickup. The parameters analyzed at each site are shown in Table 3. The laboratory, method, and constituents analyzed are shown in Table 4.
Prosecution Team Response to Comments - Attachment B
Westside San Joaquin River Semi-Annual Report Watershed Coalition June 15, 2011
5
Table 3: Monitoring Stations and Samples
Irrig
atio
nN
on-I
rrig
atio
nR
ain
Eve
ntC
erio
daph
nia
Fat
head
Alg
aeS
edim
ent
Mo
nito
ring
Site
Site
Co
de(M
ar-A
ug)*
(Se
p-F
eb)
*(2
x pe
r ye
ar)
Tox
icity
Tox
icity
Tox
icity
Tox
icity
OP
OC
Gro
up A
Ca
rbH
erb
Dis
cha
rge
Sit
es
Ble
wet
t Dra
in a
t H
ighw
ay 1
32V
H13
2C
ore
Cor
eA
ssm
tP
oso
Slo
ugh
at In
dian
a A
venu
eP
SA
IAC
ore
Cor
eA
ssm
tH
ospi
tal C
r at
Riv
er R
oad
HC
AR
RS
peci
al
-R
ain*
*x
xx
xx
Ingr
am C
r at
Riv
er
Roa
dIC
AR
RC
ore
+ S
pec
ial
Cor
eR
ain*
*x
xx
xx
xx
Wes
tley
Was
tew
ay n
ear
Cox
Roa
dW
WN
CR
Cor
e +
Spe
cial
Cor
eR
ain*
*x
xx
xx
xx
Del
Pue
rto
Cr
near
Cox
Roa
dD
PC
CR
Cor
e +
Spe
cial
Cor
eR
ain*
*x
xx
xx
xD
el P
uert
o C
r at
Hw
y 33
DP
CH
WS
peci
al
-R
ain*
*x
xx
xx
xR
amon
a La
ke n
ear
Fig
Ave
nue
RO
LFA
Cor
e +
Spe
cial
Cor
eR
ain*
*x
xx
xx
Mar
shal
l Roa
d D
rain
nea
r R
iver
Roa
dM
RD
RR
Cor
e +
Spe
cial
Cor
eR
ain*
*x
xx
xx
Ore
stim
ba
Cr
at R
iver
Ro
adO
CA
RR
Co
re +
Sp
ecia
lC
ore
Rai
n**
xx
xx
xx
Ore
stim
ba C
r at
Hw
y 33
OC
AH
WS
peci
al-
Rai
n**
xx
xx
xx
xN
ewm
an W
aste
way
nea
r H
ills
Fer
ry R
oad
NW
HF
RC
ore
+ S
peci
alC
ore
Rai
n**
xx
xx
xx
San
Joa
quin
Riv
er a
t Lan
der
Ave
nue
SJR
LAC
ore
+ S
pec
ial
Cor
e +
Sp
ecia
lR
ain*
*x
xx
xM
ud S
lou
gh u
/s S
an L
uis
Dra
inM
SU
SL
Co
re +
Sp
ecia
lC
ore
+ S
pec
ial
Rai
n**
xx
xx
xx
Sal
t S
loug
h at
Lan
der
Ave
nue
SS
ALA
Cor
e +
Spe
cial
Cor
e +
Spe
cial
Rai
n**
xx
xx
xx
xS
alt
Slo
ugh
at S
and
Dam
SS
AS
DS
peci
al-
Rai
n**
xx
xx
xx
Los
Ban
os C
ree
k at
Hig
hway
140
LB
CH
WC
ore
+ S
pec
ial
Cor
e +
Sp
ecia
lR
ain*
*x
xx
Los
Ban
os C
reek
at
Chi
na C
amp
Roa
dLB
CC
CC
ore
+ S
peci
alC
ore
Rai
n**
xx
xx
xx
Tur
ner
Slo
ugh
near
Ed
min
ste
r R
oad
TS
AE
RC
ore
+ S
pec
ial
Cor
eR
ain*
*x
xx
xLi
ttle
Pan
oche
Cr
at W
este
rn B
ound
ary
LPC
WB
Cor
eC
ore
Rai
n**
xx
xLi
ttle
Pa
noch
e C
r at
San
Lu
is C
anal
LP
CS
LC
ore
Cor
eR
ain*
*x
xx
Rus
sell
Ave
. Dra
in a
t S
an L
uis
Can
alR
AD
SL
Cor
eC
ore
Rai
n**
xx
xLo
s B
anos
Cre
ek a
t S
unse
t A
veLB
CS
AC
ore
Cor
eR
ain*
*x
xx
So
urc
e W
ate
r S
ites
San
Joa
quin
Riv
er a
t Sac
k D
amS
JRS
DS
ourc
eS
ourc
eS
ourc
eD
elta
Men
dota
Can
al a
t D
el P
uer
to W
DD
MC
DP
So
urce
So
urce
So
urce
San
Joa
quin
Riv
er a
t PID
Pu
mp
sS
JRP
PS
ourc
eS
ourc
eS
our
ce
Pes
ticid
esS
eas
on
* Ir
rigat
ion
seas
on w
ill r
un f
rom
Mar
ch th
roug
h A
ugus
t. N
on-ir
riga
tion
seas
on w
ill r
un f
rom
Sep
tem
ber
thro
ugh
Feb
ruar
y. T
he W
ests
ide
Coa
litio
n, in
col
abor
atio
n w
ith t
he R
egio
nal
Wa
ter
Qu
ality
Con
trol
Bo
ard
, may
shi
ft th
e se
aso
ns u
p o
r ba
ck 1
mon
th t
o ac
con
t for
act
ual p
ract
ices
.
Prosecution Team Response to Comments - Attachment B
Westside San Joaquin River Semi-Annual Report Watershed Coalition June 15, 2011
6
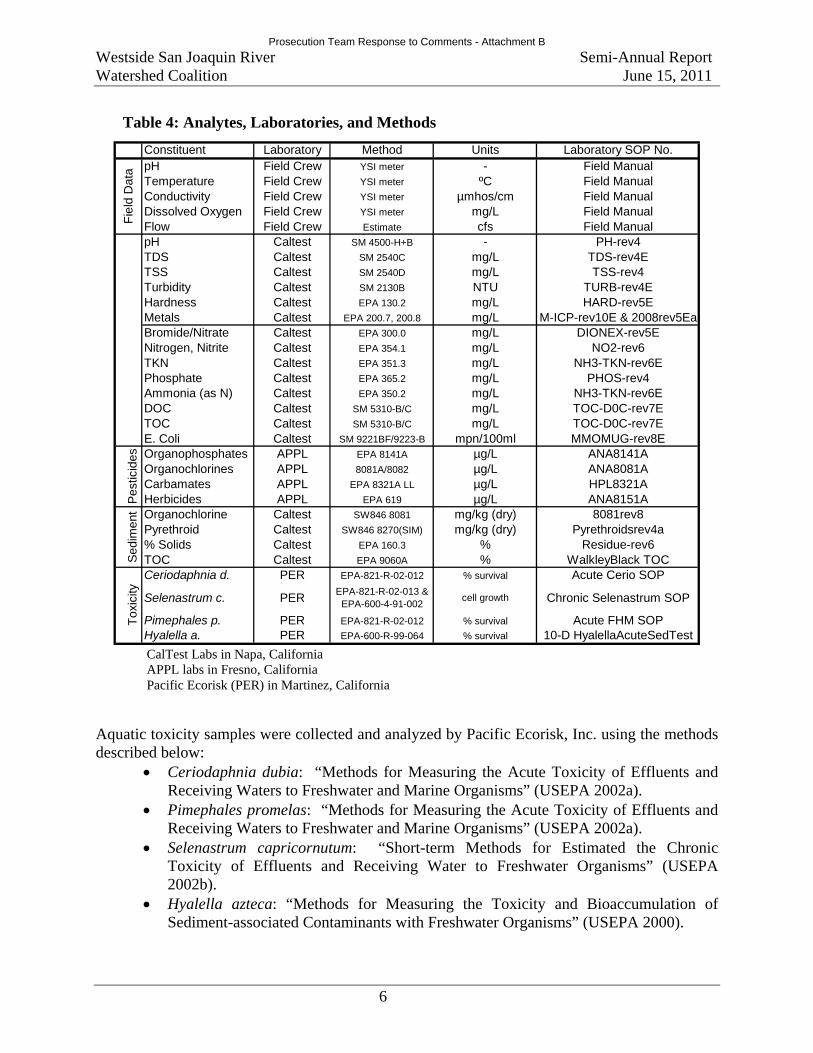
Aquatic toxicity samples were collected and analyzed by Pacific Ecorisk, Inc. using the methods described below:
Ceriodaphnia dubia: “Methods for Measuring the Acute Toxicity of Effluents and Receiving Waters to Freshwater and Marine Organisms” (USEPA 2002a).
Pimephales promelas: “Methods for Measuring the Acute Toxicity of Effluents and Receiving Waters to Freshwater and Marine Organisms” (USEPA 2002a).
Selenastrum capricornutum: “Short-term Methods for Estimated the Chronic Toxicity of Effluents and Receiving Water to Freshwater Organisms” (USEPA 2002b).
Hyalella azteca: “Methods for Measuring the Toxicity and Bioaccumulation of Sediment-associated Contaminants with Freshwater Organisms” (USEPA 2000).
Table 4: Analytes, Laboratories, and Methods
CalTest Labs in Napa, California APPL labs in Fresno, California Pacific Ecorisk (PER) in Martinez, California
Constituent Laboratory Method Units Laboratory SOP No.pH Field Crew YSI meter - Field ManualTemperature Field Crew YSI meter ºC Field ManualConductivity Field Crew YSI meter µmhos/cm Field ManualDissolved Oxygen Field Crew YSI meter mg/L Field ManualFlow Field Crew Estimate cfs Field ManualpH Caltest SM 4500-H+B - PH-rev4TDS Caltest SM 2540C mg/L TDS-rev4ETSS Caltest SM 2540D mg/L TSS-rev4Turbidity Caltest SM 2130B NTU TURB-rev4EHardness Caltest EPA 130.2 mg/L HARD-rev5EMetals Caltest EPA 200.7, 200.8 mg/L M-ICP-rev10E & 2008rev5EaBromide/Nitrate Caltest EPA 300.0 mg/L DIONEX-rev5ENitrogen, Nitrite Caltest EPA 354.1 mg/L NO2-rev6TKN Caltest EPA 351.3 mg/L NH3-TKN-rev6EPhosphate Caltest EPA 365.2 mg/L PHOS-rev4Ammonia (as N) Caltest EPA 350.2 mg/L NH3-TKN-rev6EDOC Caltest SM 5310-B/C mg/L TOC-D0C-rev7ETOC Caltest SM 5310-B/C mg/L TOC-D0C-rev7EE. Coli Caltest SM 9221BF/9223-B mpn/100ml MMOMUG-rev8EOrganophosphates APPL EPA 8141A µg/L ANA8141AOrganochlorines APPL 8081A/8082 µg/L ANA8081ACarbamates APPL EPA 8321A LL µg/L HPL8321AHerbicides APPL EPA 619 µg/L ANA8151AOrganochlorine Caltest SW846 8081 mg/kg (dry) 8081rev8Pyrethroid Caltest SW846 8270(SIM) mg/kg (dry) Pyrethroidsrev4a% Solids Caltest EPA 160.3 % Residue-rev6TOC Caltest EPA 9060A % WalkleyBlack TOCCeriodaphnia d. PER EPA-821-R-02-012 % survival Acute Cerio SOP
Selenastrum c. PEREPA-821-R-02-013 &
EPA-600-4-91-002cell growth Chronic Selenastrum SOP
Pimephales p. PER EPA-821-R-02-012 % survival Acute FHM SOPHyalella a. PER EPA-600-R-99-064 % survival 10-D HyalellaAcuteSedTest
To
xici
tyF
ield
Dat
aP
estic
ides
Sed
imen
t
Prosecution Team Response to Comments - Attachment B
Westside San Joaquin River Semi-Annual Report Watershed Coalition June 15, 2011
7
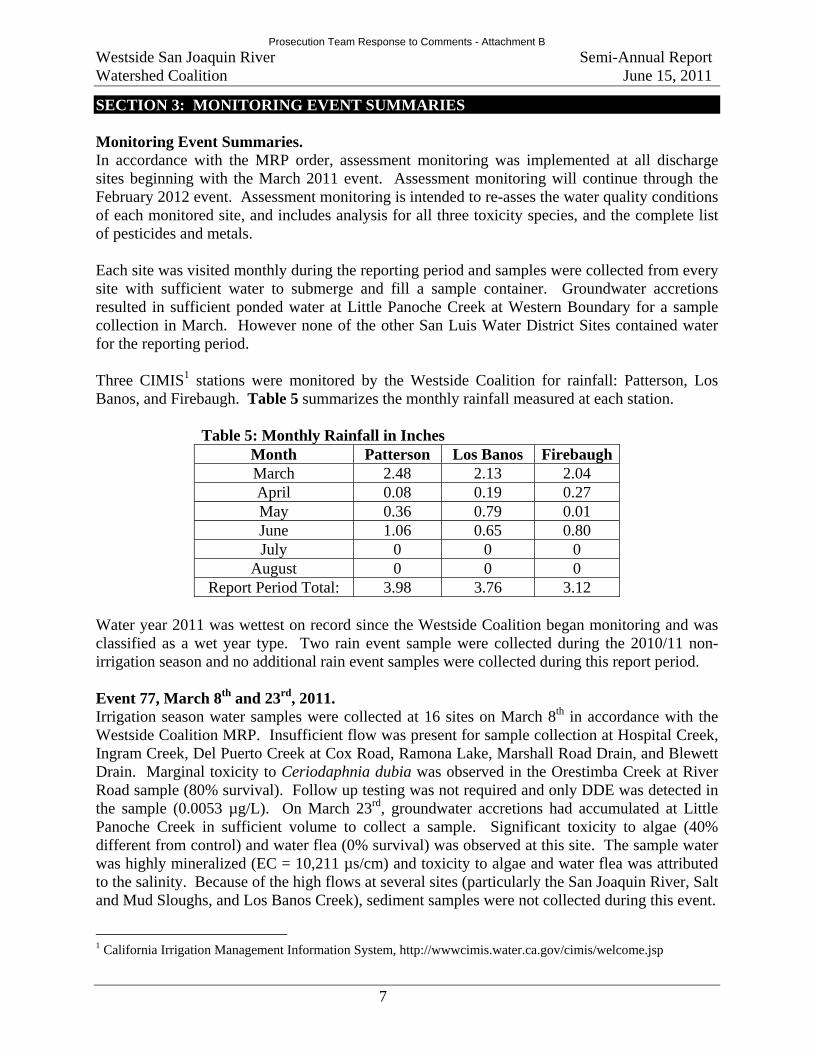
SECTION 3: MONITORING EVENT SUMMARIES Monitoring Event Summaries. In accordance with the MRP order, assessment monitoring was implemented at all discharge sites beginning with the March 2011 event. Assessment monitoring will continue through the February 2012 event. Assessment monitoring is intended to re-asses the water quality conditions of each monitored site, and includes analysis for all three toxicity species, and the complete list of pesticides and metals. Each site was visited monthly during the reporting period and samples were collected from every site with sufficient water to submerge and fill a sample container. Groundwater accretions resulted in sufficient ponded water at Little Panoche Creek at Western Boundary for a sample collection in March. However none of the other San Luis Water District Sites contained water for the reporting period. Three CIMIS1 stations were monitored by the Westside Coalition for rainfall: Patterson, Los Banos, and Firebaugh. Table 5 summarizes the monthly rainfall measured at each station.
Table 5: Monthly Rainfall in Inches Month Patterson Los Banos Firebaugh March 2.48 2.13 2.04 April 0.08 0.19 0.27 May 0.36 0.79 0.01 June 1.06 0.65 0.80 July 0 0 0
August 0 0 0 Report Period Total: 3.98 3.76 3.12
Water year 2011 was wettest on record since the Westside Coalition began monitoring and was classified as a wet year type. Two rain event sample were collected during the 2010/11 non-irrigation season and no additional rain event samples were collected during this report period. Event 77, March 8th and 23rd, 2011. Irrigation season water samples were collected at 16 sites on March 8th in accordance with the Westside Coalition MRP. Insufficient flow was present for sample collection at Hospital Creek, Ingram Creek, Del Puerto Creek at Cox Road, Ramona Lake, Marshall Road Drain, and Blewett Drain. Marginal toxicity to Ceriodaphnia dubia was observed in the Orestimba Creek at River Road sample (80% survival). Follow up testing was not required and only DDE was detected in the sample (0.0053 µg/L). On March 23rd, groundwater accretions had accumulated at Little Panoche Creek in sufficient volume to collect a sample. Significant toxicity to algae (40% different from control) and water flea (0% survival) was observed at this site. The sample water was highly mineralized (EC = 10,211 µs/cm) and toxicity to algae and water flea was attributed to the salinity. Because of the high flows at several sites (particularly the San Joaquin River, Salt and Mud Sloughs, and Los Banos Creek), sediment samples were not collected during this event.
1 California Irrigation Management Information System, http://wwwcimis.water.ca.gov/cimis/welcome.jsp
Prosecution Team Response to Comments - Attachment B
Westside San Joaquin River Semi-Annual Report Watershed Coalition June 15, 2011
8
Event 78, April 12, 2011. Irrigation season water samples were collected at 22 monitoring sites on April 12th in accordance with the Westside Coalition MRP. No aquatic toxicity was observed in any of tested sites. All four SLWD sites were dry. Event 79, May 10th and May 24th 2011. Irrigation season water samples were collected at 21 sites on May 10th and sediment samples were collected at 15 sites on May 24th in accordance with the Westside Coalition’s MRP. There was insufficient flow at Hospital Creek and Del Puerto Creek at Highway 33 to collect water samples and high water conditions prevented sediment collections at Newman Wasteway, San Joaquin River at Lander Avenue, and Salt Slough at Lander Avenue. Four of the algae toxicity tests were contaminated with a foreign algae species and had to be retested, however no other aquatic toxicity was observed. Sediment toxicity was observed at Hospital Creek (8.75% survival), Ingram Creek (16.3% survival), Salt Slough at Sand Dam (78.8% survival), Poso Slough (87.5% survival), and Ramona Lake (92.5% survival). Although this is an increase in the number of sites with statistically significant toxicity, only two sites showed severe toxicity (<50% survival, Ingram and Hospital Creeks), with the observed survival at the other three sites >75%. Sediment samples from Ingram Creek, Hospital Creek, and Salt Slough at Sand Dam were analyzed for pesticides. See Section 8. Event 80, June 14th, 2011. Irrigation season water samples were collected at 20 sites on June 14th in accordance with the Westside Coalition’s MRP. There was insufficient flow at the Hospital Creek and Del Puerto Creek (Highway 33) sites for sample collection and the four SLWD sites were dry. Aquatic toxicity to Ceriodaphnia dubia was observed at the San Joaquin River at Lander Avenue (20% survival). A TIE was performed, however toxicity was not persistent in any of the treatments (including the baseline) and the test was inconclusive. No pesticides were detected in the sample and the cause of toxicity is not known. No other aquatic toxicity was observed. Event 81, July 12th, 2011. Irrigation season water samples were collected at 21 monitoring sites on July 12th. Insufficient flow was present at Del Puerto Creek at Highway 33 for sample collection and all of the SLWD sites were dry. No aquatic toxicity was observed in any of the samples. Event 82, August 9th, 2011. Irrigation season water samples were collected at 21 monitoring sites on August 9th in accordance with the Westside Coalition’s MRP. Insufficient flow was present at Del Puerto Creek at Highway 33 and the four SLWD sites were dry. Aquatic toxicity to Ceriodaphnia dubia was observed at Newman Wasteway (70% survival), Los Banos Creek at Highway 140 (70 survival), Turner Slough (55% survival), and Poso Slough (0% survival). A dilution series and TIE were performed on the Poso Slough sample. The dilution series measured 2.8 toxic units, and the TIE indicated that a non-polar organic compound(s) was the likely cause of toxicity. Chlorpyrifos was the only detected pesticide in the sample (1.3µg/L) and is likely the cause of toxicity. No follow up was required for the other three samples that exhibited toxicity, and no pesticides were detected. See Attachment 2.
Prosecution Team Response to Comments - Attachment B
Westside San Joaquin River Semi-Annual Report Watershed Coalition June 15, 2011
9
SECTION 4: SAMPLING SITE AND WATERSHED DESCRIPTIONS Figure 1 shows the Westside Coalition area and the location of the monitoring sites. Following is a description and rationale for the monitoring sites.
Blewett Drain near Highway 132 (originally called Vernalis at Highway 132 [VH132]). This site is located at the northerly boundary of the Westside Coalition. The cropping pattern for discharges into this drain is similar to that of Hospital Creek. Flow at this site is calculated as an estimated velocity and measured flow area. The Westside Coalition began monitoring this site in 2008.
Poso Slough at Indiana Avenue (PSAIA). This site is located on Poso Slough near the boundary between San Luis Canal Company and Central California Irrigation District in the Dos Palos Subarea of the Westside Coalition. Flow at this site is calculated as an estimated velocity and measured flow area. The Westside Coalition began monitoring this site in 2008. Poso Slough is a tributary to Salt Slough, discharging upstream of the Sand Dam monitoring site.
Hospital Creek at River Road (HCARR). This site is a significant drainage for the Patterson Subarea of the Westside Coalition and has been monitored since July 2004 for a variety of constituents. Sediment discharge, sediment toxicity, aquatic toxicity (water flea), and pesticides have been measured at this site. It is on the 303(d) list for pesticides. Flow at this site is measured by a rectangular weir.
Ingram Creek at River Road (ICARR). This site is a significant drainage for the Patterson Subarea of the Westside Coalition and has been monitored since July 2004 for a variety of constituents. Sediment discharge, sediment toxicity, aquatic toxicity (water flea), and pesticides have been measured at this site. It is on the 303(d) list for pesticides. Flow at this site is measured by a rectangular weir.
Westley Wasteway near Cox Road (WWNCR). Westley Wasteway is a significant drainage for the Patterson Subarea for both tailwater and storm runoff. Land use upstream of this monitoring station is similar to that of Del Puerto Creek. This site has been monitored for a variety of constituents since 2004. Sediment discharge, sediment toxicity, aquatic toxicity (water flea), and pesticides have been measured at this site. Flow at this site is measured by a rectangular weir.
Del Puerto Creek near Cox Road (DPCCR) and Del Puerto Creek near Highway 33 (DPCHW). Del Puerto Creek is on the 303(d) list for pesticides and is a major drainage for the Patterson Subarea and major storm runoff collector. Two stations are identified on this waterbody; one near the discharge to the San Joaquin River, and one at Highway 33, near the middle of the Patterson Subarea. Biological assessments are performed on Del Puerto Creek to assess its overall health, which will be useful in relating to collected water quality data. Both of these sites have been monitored for a variety of constituents since 2004. Sediment discharge, sediment toxicity, aquatic toxicity (water flea), and pesticides have been measured at both sites. Flow at this site is measured through a stream rating.
Ramona Lake near Fig Avenue (ROLFA). This site monitors discharge from a small lake as it flows into the San Joaquin River. Agricultural and storm runoff from the Patterson
Prosecution Team Response to Comments - Attachment B
Westside San Joaquin River Semi-Annual Report Watershed Coalition June 15, 2011
10
Subarea can discharge into the lake. This site has been monitored for a variety of constituents since 2004. Some pesticides have been measured at this site.
Marshall Road Drain near River Road (MRDRR). This site monitors a pipe drain that carries agricultural and storm runoff from the Patterson Subarea of the Westside Coalition. This site has been monitored for a variety of constituents since 2004. Some pesticides and aquatic toxicity have been measured at this site. Flow from this site is measured by a weir within the pipe. During periods of high flow, the weir can become submerged and incapable of measuring flow.
Orestimba Creek at River Road (OCARR) and Highway 33 (OCAHW). There are two monitoring locations on Orestimba Creek; one near the discharge point to the San Joaquin River; and one upstream at Highway 33. Orestimba Creek is similar to that of Del Puerto in both the surrounding landscape and discharged water quality. It is on the 303(d) list for pesticides, is a major drainage for the Patterson Subarea, and is included in the biological assessment portion of the monitoring program. Pesticides, sediment discharge, sediment toxicity, and aquatic toxicity have been measured at these sites. USGS monitors are reports flow at Orestimba Creek at River Road. Flow at Orestimba Creek at Highway 33 is calculated through an estimated velocity and cross-sectional flow area.
Newman Wasteway near Hills Ferry Road (NWHFR). The Newman Wasteway is a significant drainage for the Patterson Subarea and is on the 303(d) list for salt and pesticides. This site measures drainage that originates from the southerly region of the Patterson Subarea, and has been monitored for a variety of constituents since 2004. Pesticides, sediment discharge, sediment toxicity, and aquatic toxicity have been measured at this site. Flow at this site is calculated through an estimated velocity and cross-sectional flow area.
The San Joaquin River at Lander Avenue (SJRLA). This site is both a receiving waterbody for agricultural and storm drainage and a source water for districts that pump from the San Joaquin River. It also receives drainage flows from irrigated wetlands in the fall and winter months. It has been monitored for a variety of constituents since 2004, and pesticides, sediment toxicity, and aquatic toxicity have been measured. Flow at this site is reported by a nearby CDEC station.
Mud Slough upstream of the San Luis Drain (MSUSL). This site measures drainage originating from the Dos Palos and Los Banos Subareas that flow through the wetlands as well as the wetlands themselves. Mud Slough is on the 303(d) list for a variety of constituents. In addition to the Westside Coalition’s monitoring program, the Central Valley Regional Water Quality Control Board, Surface Water Ambient Monitoring Program (SWAMP) collects and analyzes samples from this site throughout the year. These samples are analyzed for selenium, boron, and EC, along with other constituents. Flow at this site is calculated as the difference between the flow downstream of the San Luis Drain (reported by CDEC) and the measured San Luis Drain Discharge. The SWAMP Data is available via the internet at: http://www.waterboards.ca.gov/centralvalley/programs/agunit/swamp/index.html.
Salt Slough at Lander Avenue (SSALA) Salt Slough at Lander Avenue measures agricultural, storm, and wetland runoff from the Dos Palos and Los Banos Subareas, and has been monitored (and 303(d) listed) for a variety of constituents since 2004. In addition to the Westside Coalition’s monitoring program, the Central Valley Regional
Prosecution Team Response to Comments - Attachment B
Westside San Joaquin River Semi-Annual Report Watershed Coalition June 15, 2011
11
Water Quality Control Board, SWAMP collects and analyzes samples from this site throughout the year. These samples are analyzed for selenium, boron, and EC, along with other constituents. Flow at this site is reported by CDEC. The SWAMP Data is available via the internet at: http://www.waterboards.ca.gov/centralvalley/programs/agunit/swamp/index.html.
Salt Slough at Sand Dam (SSASD). This site is upstream of the Lander Avenue site and measures agricultural and storm drainage originating in portions of the Dos Palos Subarea. Pesticides and aquatic toxicity have been measured at this site, which has been monitored for a variety of constituents since 2004. Flow at this site is measured by a weir.
Los Banos Creek at Highway 140 (LBCHW). This site carries agricultural, storm and irrigated wetland runoff from the Los Banos Subarea. Some pesticides have been measured at this site. Flow at this site is calculated through an estimated velocity and cross-sectional flow area.
Los Banos Creek at China Camp Road (LBCCC). This site monitors agricultural and storm runoff from the Los Banos Subarea, upstream of the Highway 140 site. There is a farmer-maintained dam downstream of this site which is frequently used to stop flows so that it may be diverted for irrigation. Flow at this site is calculated through an estimated velocity and cross-sectional flow area.
Turner Slough near Edminster Road (TSAER). This station is located on the eastside of the San Joaquin River and measures drainage from a portion of the Patterson Subarea. A very small number of pesticides have been detected at this site since 2004. In 2007, Stevinson Water District constructed a drain water return system upstream of the Turner Slough discharge (and monitoring) point. This system captures most of the drainage that flows through Turner Slough and returns it to the Stevinson Water District irrigation system. Since the construction of this system, discharges from Turner Slough into the San Joaquin River have become infrequent. Flow at this site is calculated through an estimated velocity and cross-sectional flow area.
Little Panoche Creek at Western Boundary (LPCWB) and at San Luis Canal (LPCSL). These two sites were incorporated from the San Luis Water District Water Quality Coalition. Because San Luis Water District has a strict no-discharge policy, these sites are typically dry. High water levels in the Panoche Creek Reservoir have caused shallow groundwater to accrete into the creek at the Western Boundary site, but no other flows (either agricultural discharges or storm runoff) have been observed at either site.
Russell Avenue Drain at San Luis Canal (RADSL). This is a small drain along Russell Avenue that discharges into the San Luis Canal. These two sites were incorporated from the San Luis Water District Water Quality Coalition. Because San Luis Water District has a strict no-discharge policy, this site will typically measure only storm runoff. Since inclusion within the Westside Coalition, this site has not had any observed flow and has not been sampled.
Los Banos Creek at Sunset Avenue (LBCSA). This monitoring site was incorporated from the San Luis Water District Water Quality Coalition, and is located near the western boundary of the Westside Coalition, downstream of the Los Banos Reservoir. There is not a large amount of actively farmed land at or upstream of this site, and discharges here are typically releases from the Los Banos Reservoir.
Prosecution Team Response to Comments - Attachment B
Westside San Joaquin River Semi-Annual Report Watershed Coalition June 15, 2011
12
San Joaquin River at Sack Dam (SJRSD). This is a source water monitoring site located at the diversion point for San Luis Canal Company. This site is monitored for source water constituents. Flow at this site is measured across the dam.
Delta Mendota Canal at Del Puerto Water District (DMCDP). This site monitors water quality in the Delta Mendota Canal at a Del Puerto Water District turnout. This site characterizes the source water quality typical of the Delta Mendota Canal, and is monitored for source water constituents. Flow is not measured at this site.
San Joaquin River at Patterson Irrigation District Pumps (SJRPP). This monitoring site is located at the Patterson Irrigation District pump station on the San Joaquin River and characterizes the source water quality of the San Joaquin River in the Patterson Subarea. This site is monitored for source water constituents. Flow from this site is reported by CDEC.
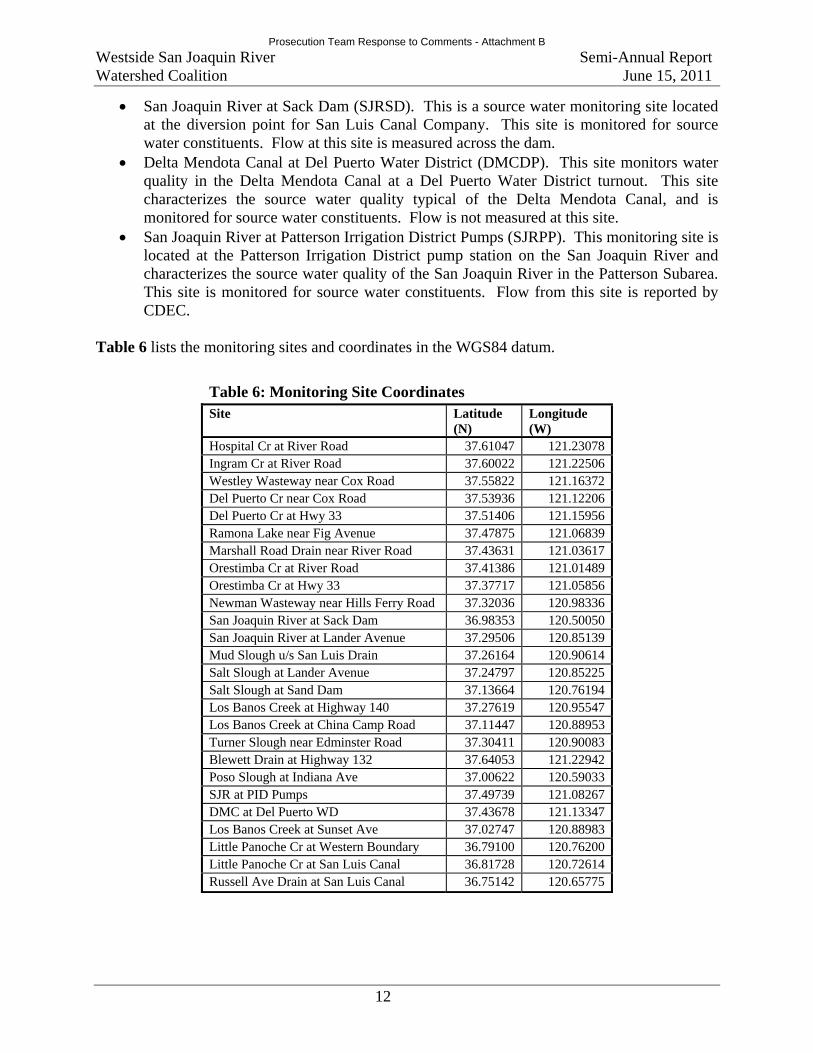
Table 6 lists the monitoring sites and coordinates in the WGS84 datum.
Table 6: Monitoring Site Coordinates Site Latitude
(N) Longitude (W)
Hospital Cr at River Road 37.61047 121.23078 Ingram Cr at River Road 37.60022 121.22506 Westley Wasteway near Cox Road 37.55822 121.16372 Del Puerto Cr near Cox Road 37.53936 121.12206 Del Puerto Cr at Hwy 33 37.51406 121.15956 Ramona Lake near Fig Avenue 37.47875 121.06839 Marshall Road Drain near River Road 37.43631 121.03617 Orestimba Cr at River Road 37.41386 121.01489 Orestimba Cr at Hwy 33 37.37717 121.05856 Newman Wasteway near Hills Ferry Road 37.32036 120.98336 San Joaquin River at Sack Dam 36.98353 120.50050 San Joaquin River at Lander Avenue 37.29506 120.85139 Mud Slough u/s San Luis Drain 37.26164 120.90614 Salt Slough at Lander Avenue 37.24797 120.85225 Salt Slough at Sand Dam 37.13664 120.76194 Los Banos Creek at Highway 140 37.27619 120.95547 Los Banos Creek at China Camp Road 37.11447 120.88953 Turner Slough near Edminster Road 37.30411 120.90083 Blewett Drain at Highway 132 37.64053 121.22942 Poso Slough at Indiana Ave 37.00622 120.59033 SJR at PID Pumps 37.49739 121.08267 DMC at Del Puerto WD 37.43678 121.13347 Los Banos Creek at Sunset Ave 37.02747 120.88983 Little Panoche Cr at Western Boundary 36.79100 120.76200 Little Panoche Cr at San Luis Canal 36.81728 120.72614 Russell Ave Drain at San Luis Canal 36.75142 120.65775
Prosecution Team Response to Comments - Attachment B
Westside San Joaquin River Semi-Annual Report Watershed Coalition June 15, 2011
13
FIGURE 1: WATERSHED MAP W/ MONITORING SITES.
Prosecution Team Response to Comments - Attachment B
Westside San Joaquin River Semi-Annual Report Watershed Coalition June 15, 2011
14
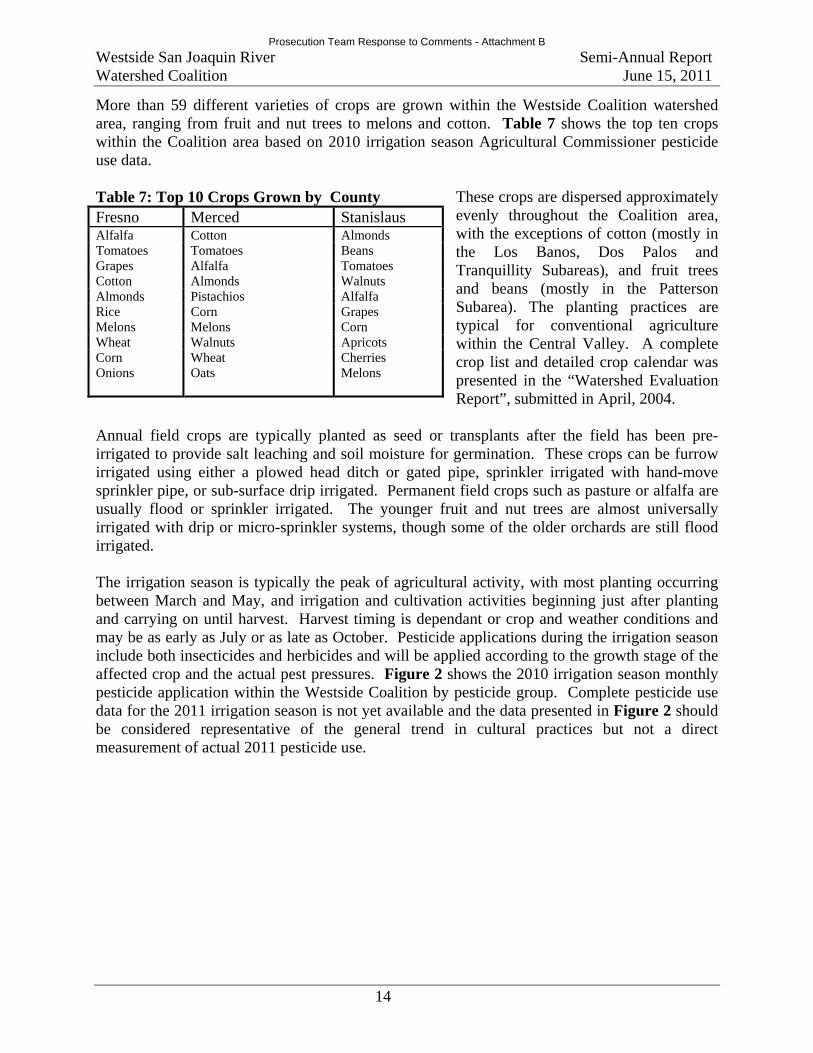
More than 59 different varieties of crops are grown within the Westside Coalition watershed area, ranging from fruit and nut trees to melons and cotton. Table 7 shows the top ten crops within the Coalition area based on 2010 irrigation season Agricultural Commissioner pesticide use data.
These crops are dispersed approximately evenly throughout the Coalition area, with the exceptions of cotton (mostly in the Los Banos, Dos Palos and Tranquillity Subareas), and fruit trees and beans (mostly in the Patterson Subarea). The planting practices are typical for conventional agriculture within the Central Valley. A complete crop list and detailed crop calendar was presented in the “Watershed Evaluation Report”, submitted in April, 2004.
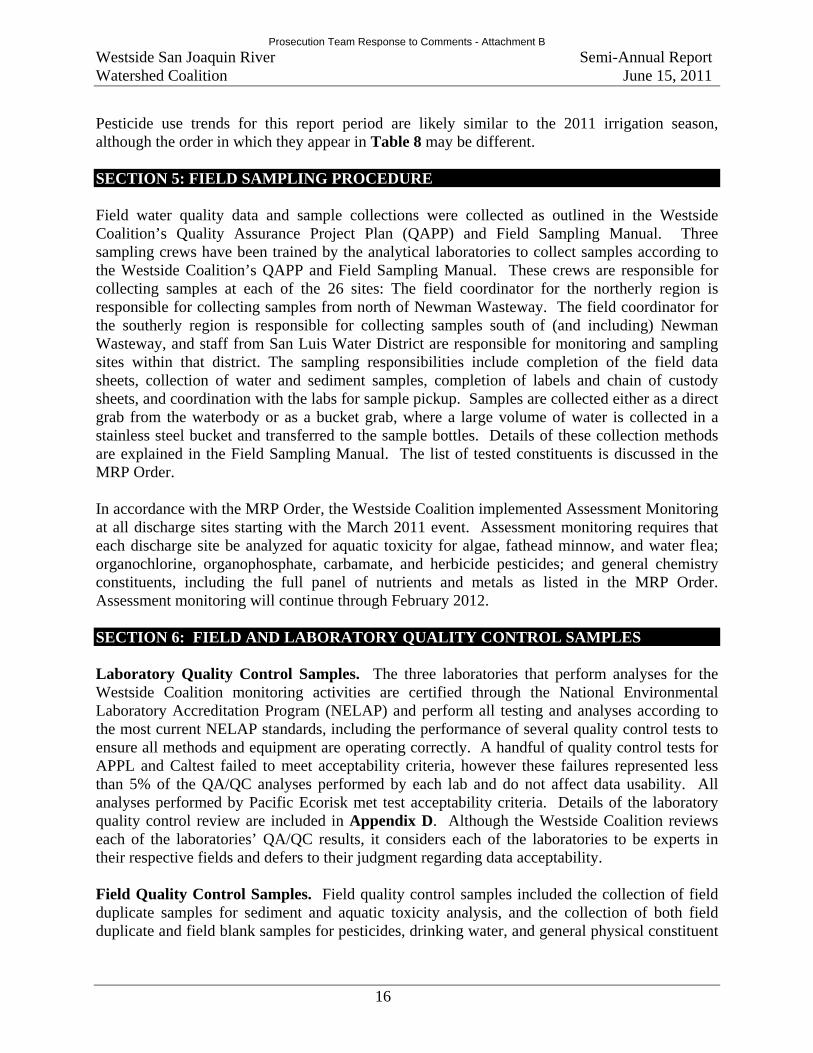
Annual field crops are typically planted as seed or transplants after the field has been pre-irrigated to provide salt leaching and soil moisture for germination. These crops can be furrow irrigated using either a plowed head ditch or gated pipe, sprinkler irrigated with hand-move sprinkler pipe, or sub-surface drip irrigated. Permanent field crops such as pasture or alfalfa are usually flood or sprinkler irrigated. The younger fruit and nut trees are almost universally irrigated with drip or micro-sprinkler systems, though some of the older orchards are still flood irrigated. The irrigation season is typically the peak of agricultural activity, with most planting occurring between March and May, and irrigation and cultivation activities beginning just after planting and carrying on until harvest. Harvest timing is dependant or crop and weather conditions and may be as early as July or as late as October. Pesticide applications during the irrigation season include both insecticides and herbicides and will be applied according to the growth stage of the affected crop and the actual pest pressures. Figure 2 shows the 2010 irrigation season monthly pesticide application within the Westside Coalition by pesticide group. Complete pesticide use data for the 2011 irrigation season is not yet available and the data presented in Figure 2 should be considered representative of the general trend in cultural practices but not a direct measurement of actual 2011 pesticide use.
Table 7: Top 10 Crops Grown by County Fresno Merced Stanislaus Alfalfa Cotton Almonds Tomatoes Tomatoes Beans Grapes Alfalfa Tomatoes Cotton Almonds Walnuts Almonds Pistachios Alfalfa Rice Corn Grapes Melons Melons Corn Wheat Walnuts Apricots Corn Wheat Cherries Onions
Oats Melons
Prosecution Team Response to Comments - Attachment B

Westside San Joaquin River Semi-Annual Report Watershed Coalition June 15, 2011
15
Westside San Joaquin River Watershed Coalition2010 Irrigation Season Pesticide Use
Stanislaus, Merced, and Fresno Counties
0
20,000
40,000
60,000
80,000
100,000
120,000
140,000
March April May June July August
Ac
res
Tre
ate
d
Carbamates Herbicides Organochlorine Organophosphorus Pyrethroids
A more detailed review of pesticide use and detections is provided in Section 8. Table 8 shows the 10 most commonly applied pesticides during the irrigation season (by acreage) within the three counties occupied by the Westside Coalition. Pesticide use reports from the county’s Agricultural Commissioner for the 2010 irrigation season were used as it was the most current complete record. Table 8: Most Commonly Applied Pesticides by County (2010 Irrigation Season)
Fresno County Merced County Stanislaus County Pesticide Class Pesticide Class Pesticide Class Lambda-cyhalothrin
Pyrethroid Glysophate Herbicide Dimethoate Organophosphorus
Trifluralin Herbicide Trifluralin Herbicide Lambda-cyhalothrin
Pyrethroid
Glysophate Herbicide Lambda-cyhalothrin
Pyrethroid Glysophate Herbicide
Malathion Organophosphorus Oxyfluorfen Herbicide Esfenvalerate Pyrethroid
Oxyfluorfen Herbicide Malathion Organophosphorus Oxyfluorfen Herbicide
Chlorpyrifos Organophosphorus Bifenthrin Pyrethroid Prowl Herbicide
Rimsulfuron Herbicide Chlorpyrifos Organophosphorus Chlorpyrifos Organophosphorus
Cupper Sulfate Herbicide Dimethoate Organophosphorus Acephate Organophosphorus
Prowl Herbicide Aldicarb Carbamates Bifenthrin Pyrethroid
Bifenthrin Pyrethroid Cyfluthrin Pyrethroid Metolachlor Herbicide
Figure 2: 2010 Irrigation Season Pesticide Use.
Prosecution Team Response to Comments - Attachment B
Westside San Joaquin River Semi-Annual Report Watershed Coalition June 15, 2011
16
Pesticide use trends for this report period are likely similar to the 2011 irrigation season, although the order in which they appear in Table 8 may be different. SECTION 5: FIELD SAMPLING PROCEDURE Field water quality data and sample collections were collected as outlined in the Westside Coalition’s Quality Assurance Project Plan (QAPP) and Field Sampling Manual. Three sampling crews have been trained by the analytical laboratories to collect samples according to the Westside Coalition’s QAPP and Field Sampling Manual. These crews are responsible for collecting samples at each of the 26 sites: The field coordinator for the northerly region is responsible for collecting samples from north of Newman Wasteway. The field coordinator for the southerly region is responsible for collecting samples south of (and including) Newman Wasteway, and staff from San Luis Water District are responsible for monitoring and sampling sites within that district. The sampling responsibilities include completion of the field data sheets, collection of water and sediment samples, completion of labels and chain of custody sheets, and coordination with the labs for sample pickup. Samples are collected either as a direct grab from the waterbody or as a bucket grab, where a large volume of water is collected in a stainless steel bucket and transferred to the sample bottles. Details of these collection methods are explained in the Field Sampling Manual. The list of tested constituents is discussed in the MRP Order. In accordance with the MRP Order, the Westside Coalition implemented Assessment Monitoring at all discharge sites starting with the March 2011 event. Assessment monitoring requires that each discharge site be analyzed for aquatic toxicity for algae, fathead minnow, and water flea; organochlorine, organophosphate, carbamate, and herbicide pesticides; and general chemistry constituents, including the full panel of nutrients and metals as listed in the MRP Order. Assessment monitoring will continue through February 2012. SECTION 6: FIELD AND LABORATORY QUALITY CONTROL SAMPLES Laboratory Quality Control Samples. The three laboratories that perform analyses for the Westside Coalition monitoring activities are certified through the National Environmental Laboratory Accreditation Program (NELAP) and perform all testing and analyses according to the most current NELAP standards, including the performance of several quality control tests to ensure all methods and equipment are operating correctly. A handful of quality control tests for APPL and Caltest failed to meet acceptability criteria, however these failures represented less than 5% of the QA/QC analyses performed by each lab and do not affect data usability. All analyses performed by Pacific Ecorisk met test acceptability criteria. Details of the laboratory quality control review are included in Appendix D. Although the Westside Coalition reviews each of the laboratories’ QA/QC results, it considers each of the laboratories to be experts in their respective fields and defers to their judgment regarding data acceptability. Field Quality Control Samples. Field quality control samples included the collection of field duplicate samples for sediment and aquatic toxicity analysis, and the collection of both field duplicate and field blank samples for pesticides, drinking water, and general physical constituent
Prosecution Team Response to Comments - Attachment B
Westside San Joaquin River Semi-Annual Report Watershed Coalition June 15, 2011
17
analysis. It should be noted that the field duplicate samples are typically collected as separate samples simultaneously with the event sample (as opposed to field split samples). The calculated RPD between the event sample and field duplicate sample should be considered a measurement of site water variability.
Water Chemistry Analyses. Six sets of field duplicate and field blank samples were collected during the reporting period and analyzed for general chemistry and drinking water constituents. A comparison of the event samples, duplicate samples, and blank samples is tabulated in Attachment 3. A total of 156 duplicate analyses were completed and compared to the event sample results. Twenty nine duplicate samples exceeded the 25% relative percent difference (RPD) established in the QAPP for:
Ammonia Bromide Copper (diss) Copper (tot) E. Coli Lead Nickel TKN TSS Turbidity Zinc (total)
These exceedances of the field duplicate quality control criteria are reflective of the complicated nature of the site water and the naturally occurring variations of the stream water quality. Four of the results exceeding the RPD criteria were detected below the reporting limit (flagged “DNQ”) where small variations between the duplicate and event sample can result in relatively large RPD values. The Westside Coalition does not expect these variations to impact data usability. Six field blank sample sets were analyzed during the report period (156 results, total). Of these, none resulted in values greater than 20% of the event sample result.
Pesticide Analyses. Six field duplicate and field blank samples sets were collected
during the reporting period and analyzed for pesticides (315 and 307 results, respectively). There were no pesticide detections in any of the field blank samples. Calculated RPD for field duplicate results did not exceeded the 25% threshold for any analyte. The results of the field blank, field duplicate and event sample comparisons are tabulated in Attachment 3.
Aquatic Toxicity Analyses. Field duplicate samples were collected and analyzed for
toxicity to all species tested during the report period. The calculated RPD value was less than 25% in all cases.
Sediment Toxicity Analyses. A field duplicate sample was collected for sediment
toxicity during the March sampling event (Event 65). The measured RPD was 3.8%.
Completeness for sampling collection and analysis was reviewed for samples collected during this monitoring program. Completeness was measured for sample collection and transit, sample analysis, and field quality control samples.
Collection and Transit: Completeness for this reporting period for sample collection and transit is 100%. No sample containers were lost or broken during this reporting period.
Prosecution Team Response to Comments - Attachment B
Westside San Joaquin River Semi-Annual Report Watershed Coalition June 15, 2011
18
Sample Analysis: Completeness for sample analysis during this reporting period is 100%. All collected samples were analyzed in accordance with the appropriate method.
Field Quality Control Samples: Completeness for toxicity duplicate samples is 100% for this reporting period. The completeness for field blank and duplicate samples is 100% for both pesticide analyses and water chemistry samples.
SECTION 7: ANALYTICAL METHODS Table 4 indicates the laboratories responsible for the analytical results of this monitoring program, the analytical method used, and the standard operating procedure (SOP) document number. This table reflects the constituents analyzed as part of the Revised MRP. Chain of Custody (COC) sheets were maintained from the time of sample collection to receipt at the laboratories. Copies of the COC sheets are included in Appendix A, along with a summary of the data results. The data summary includes all of the field readings, analytical chemistry results, pesticide scan results, and toxicity screening test results. The original laboratory reports are included in Appendix C. These reports also include all of the field and internal quality control results. The laboratory original data sheets (raw data) for the toxicity results are included in Appendix C, as part of the laboratory reports. Raw data for general physical results, drinking water results, and pesticide results are kept by the laboratories for a minimum of five years and are available upon request. SECTION 8: DATA INTERPRETATION The primary objective of the monitoring program is to identify water bodies that are adversely affected by agricultural discharges and to help determine the impacts of management activities. The monitoring program has used a combination of toxicity tests and pesticide analyses, along with close coordination among districts and growers to not only identify problem areas but also to determine the magnitude and cause of the problems. During this report period, toxicity analyses for all three species along with complete pesticide analyses and metals analyses were performed at each flowing site. The Westside Coalition’s monitoring program includes 26 monitoring sites on the Westside of the San Joaquin Valley (see Table 3 and Figure 2). These sites are representative of the various regions within the Coalition and include agricultural discharge sites, storm drainage sites, and irrigation source water sites. A summary of this data is presented in Appendix A, and the laboratory data reports are provided in Appendix C. All of the analyzed parameters were reviewed regularly to evaluate the overall health of the water bodies within the Coalition area. This reporting period covered the 2011 irrigation season months, during which there was significant agricultural activity, including planting, cultivation, irrigation, and harvest. The vast majority of all agricultural discharges occur during the irrigation season. Statistically significant aquatic toxicity occurred eight times during three
Prosecution Team Response to Comments - Attachment B
Westside San Joaquin River Semi-Annual Report Watershed Coalition June 15, 2011
19
events: seven to Ceriodaphnia dubia and one to algae. All observations of aquatic toxicity are detailed in Attachment 2. Ceriodaphnia dubia. Toxicity to Ceriodaphnia dubia was measured seven times during three events.
Orestimba Creek at River Road – Event 77 (March 8th), 80% survival. Low levels of DDE were measured (0.0053 µg/L) but no other pesticides were detected. The cause of toxicity is not apparent.
Little Panoche Creek at Western Boundary – Event 77 (March 23rd), 0% survival. No pesticides were detected in the sample, however sample salinity (EC = 10,211 µs/cm) exceeded the normal threshold of Ceriodaphnia dubia. A conductivity controlled TIE and dilution series confirmed that the level of dissolved solids in the sample was likely cause of toxicity. Because of the high level of salinity, the collected water was likely to be accreted shallow groundwater rather than agricultural runoff.
San Joaquin River at Lander Avenue – Event 80 (June 14th), 20% survival. No pesticides were detected in the sample. A TIE was initiated on June 20th, however no toxicity was observed in the baseline nor any of the treatments. Given the lack of persistence in toxicity and the absence of any pesticide or other apparent cause, this was likely an anomaly.
Poso Slough at Indiana Avenue – Event 82 (August 9th), 0% survival. A dilution series measured 2.8 toxic units and the TIE observed toxicity through all treatments. Chlorpyrifos was detected in this sample (1.3µg/L) at levels expected to cause complete mortality and is likely the cause of toxicity.
Turner Slough at Edminster Road – Event 82 (August 9th), 55% survival. No pesticides were detected in the sample and the cause of toxicity is not apparent.
Newman Wasteway near Hills Ferry Road – Event 82 (August 9th), 70% survival. No pesticides were detected in the sample and cause of toxicity is not apparent.
Los Banos Creek at Highway 140 – Event 82 (August 9th), 70% survival. No pesticides were detected in the sample and the cause of toxicity was not apparent.
Selenastrum capricornutum (algae). Toxicity to algae was observed once at Little Panoche Creek at Western Boundary during Event 77 (March). Water collected from this site was saline (EC = 10,211 µs/cm) and was likely accreted groundwater rather than irrigation runoff. No pesticides were detected in the sample and the toxicity is most likely associated with the sample water salinity. Pimephales Promelas (fathead minnow). No measurements of fathead minnow toxicity were observed during this reporting period. Sediment Toxicity (Hyalella azteca). The Westside Coalition’s MRP Order specifies that sediment sample collection should occur at the beginning of the irrigation season, between March 1st and April 30th 2. Due to high water levels in many of the monitored water bodies, sediment collection was delayed until May 24th. Sixteen samples were collected (including one duplicate) and tested for toxicity to Hyalella azteca. Statistically significant toxicity was
2 MRP Order No. R5-2008-0831, p. 16.
Prosecution Team Response to Comments - Attachment B
Westside San Joaquin River Semi-Annual Report Watershed Coalition June 15, 2011
20
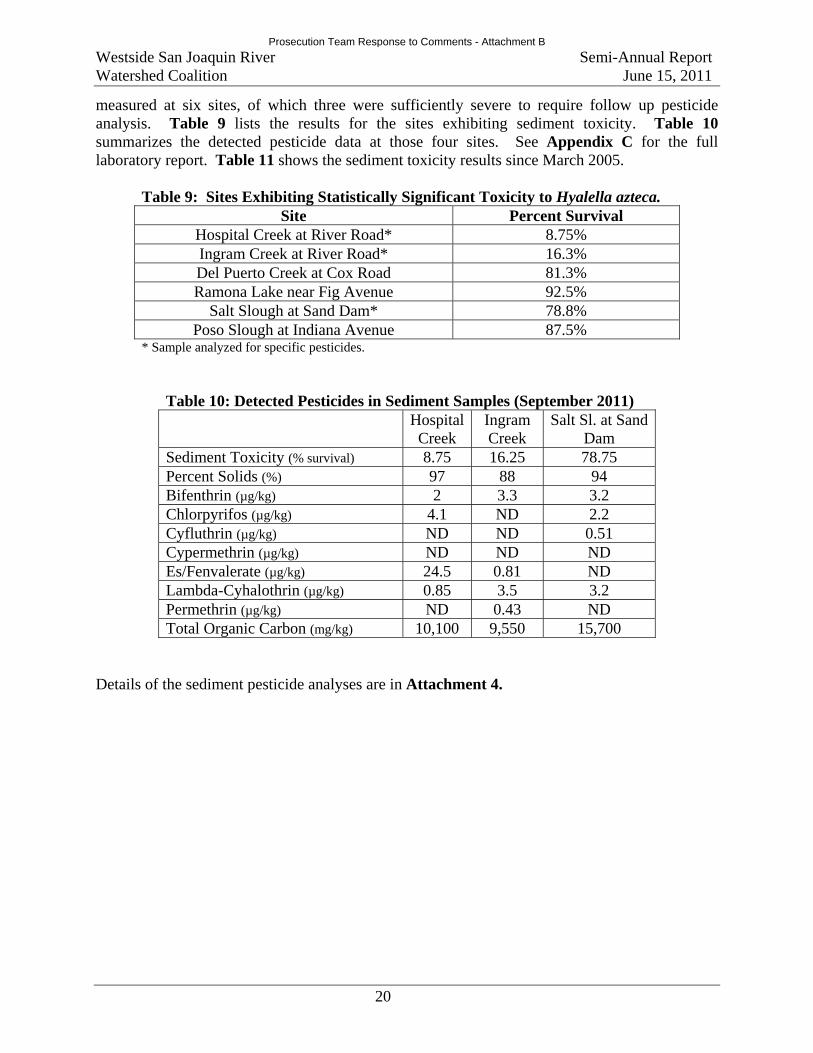
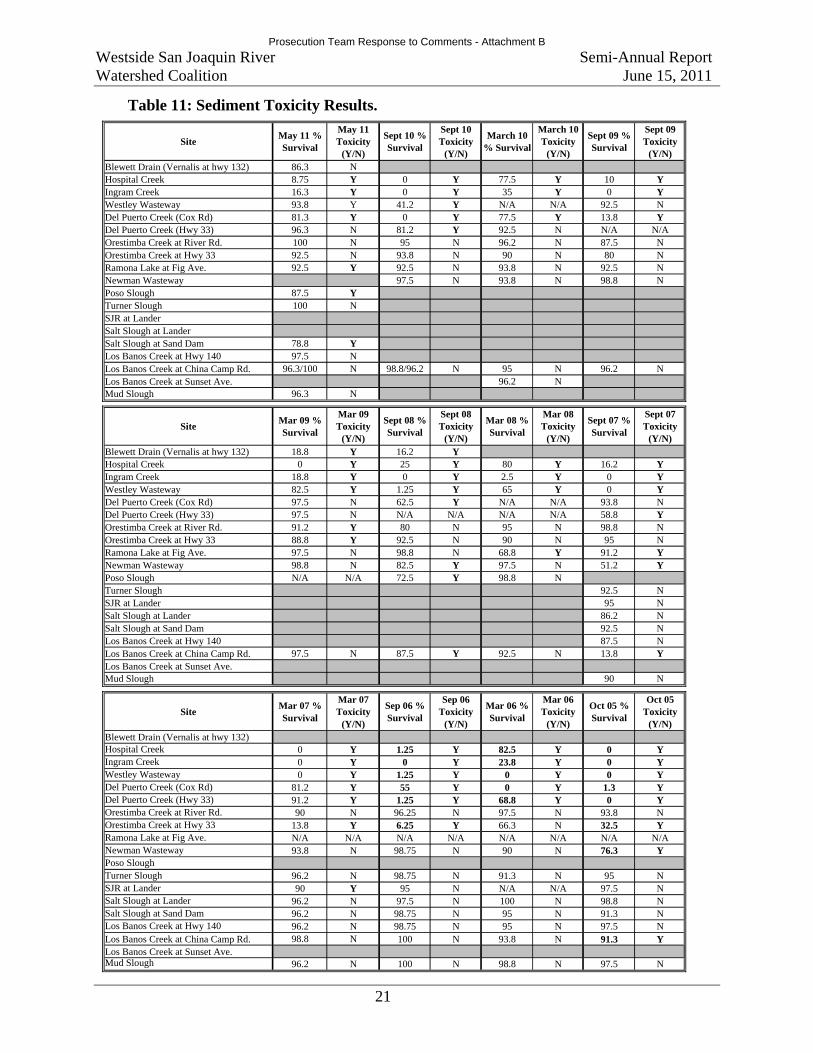
measured at six sites, of which three were sufficiently severe to require follow up pesticide analysis. Table 9 lists the results for the sites exhibiting sediment toxicity. Table 10 summarizes the detected pesticide data at those four sites. See Appendix C for the full laboratory report. Table 11 shows the sediment toxicity results since March 2005.
Table 9: Sites Exhibiting Statistically Significant Toxicity to Hyalella azteca. Site Percent Survival
Hospital Creek at River Road* 8.75% Ingram Creek at River Road* 16.3% Del Puerto Creek at Cox Road 81.3% Ramona Lake near Fig Avenue 92.5%
Salt Slough at Sand Dam* 78.8% Poso Slough at Indiana Avenue 87.5%
* Sample analyzed for specific pesticides.
Table 10: Detected Pesticides in Sediment Samples (September 2011) Hospital
Creek Ingram Creek
Salt Sl. at Sand Dam
Sediment Toxicity (% survival) 8.75 16.25 78.75 Percent Solids (%) 97 88 94 Bifenthrin (µg/kg) 2 3.3 3.2 Chlorpyrifos (µg/kg) 4.1 ND 2.2 Cyfluthrin (µg/kg) ND ND 0.51 Cypermethrin (µg/kg) ND ND ND Es/Fenvalerate (µg/kg) 24.5 0.81 ND Lambda-Cyhalothrin (µg/kg) 0.85 3.5 3.2 Permethrin (µg/kg) ND 0.43 ND Total Organic Carbon (mg/kg) 10,100 9,550 15,700
Details of the sediment pesticide analyses are in Attachment 4.
Prosecution Team Response to Comments - Attachment B
Westside San Joaquin River Semi-Annual Report Watershed Coalition June 15, 2011
21
SiteMay 11 % Survival
May 11 Toxicity
(Y/N)
Sept 10 % Survival
Sept 10 Toxicity
(Y/N)
March 10 % Survival
March 10 Toxicity
(Y/N)
Sept 09 % Survival
Sept 09 Toxicity
(Y/N)Blewett Drain (Vernalis at hwy 132) 86.3 NHospital Creek 8.75 Y 0 Y 77.5 Y 10 YIngram Creek 16.3 Y 0 Y 35 Y 0 YWestley Wasteway 93.8 Y 41.2 Y N/A N/A 92.5 NDel Puerto Creek (Cox Rd) 81.3 Y 0 Y 77.5 Y 13.8 YDel Puerto Creek (Hwy 33) 96.3 N 81.2 Y 92.5 N N/A N/AOrestimba Creek at River Rd. 100 N 95 N 96.2 N 87.5 NOrestimba Creek at Hwy 33 92.5 N 93.8 N 90 N 80 NRamona Lake at Fig Ave. 92.5 Y 92.5 N 93.8 N 92.5 NNewman Wasteway 97.5 N 93.8 N 98.8 NPoso Slough 87.5 YTurner Slough 100 NSJR at LanderSalt Slough at LanderSalt Slough at Sand Dam 78.8 YLos Banos Creek at Hwy 140 97.5 NLos Banos Creek at China Camp Rd. 96.3/100 N 98.8/96.2 N 95 N 96.2 NLos Banos Creek at Sunset Ave. 96.2 NMud Slough 96.3 N
SiteMar 09 % Survival
Mar 09 Toxicity
(Y/N)
Sept 08 % Survival
Sept 08 Toxicity
(Y/N)
Mar 08 % Survival
Mar 08 Toxicity
(Y/N)
Sept 07 % Survival
Sept 07 Toxicity
(Y/N)Blewett Drain (Vernalis at hwy 132) 18.8 Y 16.2 YHospital Creek 0 Y 25 Y 80 Y 16.2 YIngram Creek 18.8 Y 0 Y 2.5 Y 0 YWestley Wasteway 82.5 Y 1.25 Y 65 Y 0 YDel Puerto Creek (Cox Rd) 97.5 N 62.5 Y N/A N/A 93.8 NDel Puerto Creek (Hwy 33) 97.5 N N/A N/A N/A N/A 58.8 YOrestimba Creek at River Rd. 91.2 Y 80 N 95 N 98.8 NOrestimba Creek at Hwy 33 88.8 Y 92.5 N 90 N 95 NRamona Lake at Fig Ave. 97.5 N 98.8 N 68.8 Y 91.2 YNewman Wasteway 98.8 N 82.5 Y 97.5 N 51.2 YPoso Slough N/A N/A 72.5 Y 98.8 NTurner Slough 92.5 NSJR at Lander 95 NSalt Slough at Lander 86.2 NSalt Slough at Sand Dam 92.5 NLos Banos Creek at Hwy 140 87.5 NLos Banos Creek at China Camp Rd. 97.5 N 87.5 Y 92.5 N 13.8 YLos Banos Creek at Sunset Ave.Mud Slough 90 N
SiteMar 07 % Survival
Mar 07 Toxicity
(Y/N)
Sep 06 % Survival
Sep 06 Toxicity
(Y/N)
Mar 06 % Survival
Mar 06 Toxicity
(Y/N)
Oct 05 % Survival
Oct 05 Toxicity
(Y/N)Blewett Drain (Vernalis at hwy 132)Hospital Creek 0 Y 1.25 Y 82.5 Y 0 YIngram Creek 0 Y 0 Y 23.8 Y 0 YWestley Wasteway 0 Y 1.25 Y 0 Y 0 YDel Puerto Creek (Cox Rd) 81.2 Y 55 Y 0 Y 1.3 YDel Puerto Creek (Hwy 33) 91.2 Y 1.25 Y 68.8 Y 0 YOrestimba Creek at River Rd. 90 N 96.25 N 97.5 N 93.8 NOrestimba Creek at Hwy 33 13.8 Y 6.25 Y 66.3 N 32.5 YRamona Lake at Fig Ave. N/A N/A N/A N/A N/A N/A N/A N/ANewman Wasteway 93.8 N 98.75 N 90 N 76.3 YPoso SloughTurner Slough 96.2 N 98.75 N 91.3 N 95 NSJR at Lander 90 Y 95 N N/A N/A 97.5 NSalt Slough at Lander 96.2 N 97.5 N 100 N 98.8 NSalt Slough at Sand Dam 96.2 N 98.75 N 95 N 91.3 NLos Banos Creek at Hwy 140 96.2 N 98.75 N 95 N 97.5 NLos Banos Creek at China Camp Rd. 98.8 N 100 N 93.8 N 91.3 YLos Banos Creek at Sunset Ave.Mud Slough 96.2 N 100 N 98.8 N 97.5 N
Table 11: Sediment Toxicity Results.
Prosecution Team Response to Comments - Attachment B
Westside San Joaquin River Semi-Annual Report Watershed Coalition June 15, 2011
22
Pesticide Analyses. A total of fifteen different pesticides were detected in water samples during the 2011 irrigation season for a total of 113 detections. Forty one of these detections (36%) were below the reporting limit and 47 (42%) were legacy pesticides that are no longer in use (aldrin, DDT, DDE, dieldrin, and toxaphene). Each of the detected pesticides is discussed below.
Aldrin (1 detection): Aldrin was a widely used organochlorine insecticide until its use was banned in the 1970’s. It is no longer used in the United States.
Carbaryl (1 detection): Carbaryl is a carbamate insecticide used to control insects on a variety of citrus and nut trees and fruit and fiber crops.
Carbofuran (1 detection): Carbofuran is a carbamate insecticide used to control insects on a variety of field, fruit, and vegetable crops. All uses of carbofuran were banned in 2009.
Chlorpyrifos (9 detections): Chlorpyrifos is a common organophosphate pesticide used to control a wide range of insects in orchards, pasture, and field crops. It can be used as a dormant spray for fruit and nut trees. Chlorpyrifos use during this reporting season likely occurred on field and forage crops (corn, cotton, alfalfa) in the fall and as dormant sprays on fruit and nut trees in the mid to late winter.
DDT/DDE (6 DDT detections, 35 DDE detections): DDT is an organochlorine pesticide that was banned for agricultural use in 1972. It is a legacy pesticide that is still detected in the watershed at relatively low levels. DDE and DDD have no commercial use but are compounds normally associated with the degradation of DDT.
Dieldrin (2 detections): Dieldrin is an orgaonchlorine insecticide that was used on a variety of field and orchard crops including cotton, corn, and citrus. Most uses of Dieldrin were banned in 1987.
Dimethoate (6 detections): Dimethoate is an organophosphate pesticide used to control a wide range of insects. It is used on a variety of field crops including alfalfa, beans, tomatoes, and cotton.
Diuron (29 detections): Diuron is a substitute urea herbicide used to control weeds in a variety of field crops including cotton, alfalfa, walnuts and wheat. It is also effective in controlling algae.
Malathion (5 detections): Malathion is an organophosphate insecticide used on a variety of crops including alfalfa, walnuts, lettuce, grapes, and cotton.
Methomyl (3 detections): Methomyl is a carbamate insecticide used to control a variety of pests on vegetable, fruit, and field crops.
Methoxychlor (1 detection): Methoxychlor is an organochlorine insecticide that was used to control various nuisance pests (such as cockroaches and mosquitoes) and protect vegetables, fruits, ornamentals, and stored grain. Methoxychlor was banned by the U.S. EPA in 2003.
Prowl (11 detections): Prowl is a herbicide used to control broadleaf and grassy weeds and is approved for a variety of crops including cotton, field corn, beans, rice, and vineyards.
Simazine (1 detection): Simazine is a triazine herbicide used to control broadleaf weeds and annual grasses in a variety of field crops.
Toxaphene (2 detections): Toxaphene was used as an insecticide to treat mange in cattle as well as to control pests in cotton and corn. Toxaphene was banned in the United States in 1986.
Prosecution Team Response to Comments - Attachment B
Westside San Joaquin River Semi-Annual Report Watershed Coalition June 15, 2011
23
Exceedances of Recommended Water Quality Values. Water chemistry analyses were compared to recommended water quality values3 (RWQV). Attachment 5 tabulates all of the RWQV exceedances for the reporting period by site.
Field, General Physical and Drinking Water Quality Exceedances. Comparisons were made to several RWQVs. Attachment 5 tabulates the results for these constituents and the comparison to the RWQVs. The Westside Coalition performed analyses or observed 3,600 field and chemistry (non-pesticide) parameters during the reporting period, during which, 229 (6%) results were greater than the RWQVs. Electrical conductivity and total dissolved solids (TDS) accounted for 54 and 53 of these exceedances (respectively, approximately 47% of the exceedances, combined). E. coli results accounted for 40 of these exceedances, 27 for boron and 14 for dissolved oxygen. The RWQV for cadmium, copper, lead, nickel, and zinc are dependant on site water hardness and is a calculated value. One exceedance of copper was measured during Event 81 (July) at Westley Wasteway (measured concentration of 8.9µg/L with a RWQV of 7µg/L). Potential causes for EC/TDS, E. coli, DO, and boron exceedances are discussed below.
o EC/TDS. Electrical Conductivity and TDS are measures of the amount of salts dissolved in the water column. There are a variety of sources of salts that may be contributing to these results including natural marine sediments, accretion of shallow/perched ground water, and the irrigation source water. Additionally, the many growers to rely on wells to supplement surface water supplies. Most of the groundwater wells within the Westside Coalition are more saline than the surface water sources.
o E. coli. E. coli is a measurement of bacteria in the water column. The Westside Coalition has participated in a study to attempt to identify the source of these exceedances. The preliminary results were not conclusive, however human sources were identified as the possible cause for at least some of the exceedances. There is also some suspicion that E. coli colonies have become self-sustaining within some watersheds. The Westside Coalition’s Management Plan, approved November 18, 2008, discusses future activities related to the E. coli exceedances.
o Dissolved Oxygen. DO is measured through a field probe at the time of sample collection. By it’s nature, DO is a highly variable and influenced by a variety of conditions including sunlight exposure (related to time of day and time of year), turbidity, biological growth and decay, and channel turbulence. The cause of the DO exceedances measured during this report period is not immediately clear, in many cases, a low DO measurement is accompanied with no flow – indicating that the water is stagnant. As part of the Management Plan, the Westside Coalition has reviewed DO exceedances from historic data.
o Boron. Boron is a metal element commonly found in soils on the Westside of the San Joaquin Valley. It is not applied by growers for any agricultural
3 Water Quality Limits were provided by the Central Valley Regional Water Quality Control Board as part of the MRP Order. Water quality limits for cadmium, copper, lead, nickel and zinc are calculated from equations provided by the Central Valley Regional Water Quality Control Board.
Prosecution Team Response to Comments - Attachment B
Westside San Joaquin River Semi-Annual Report Watershed Coalition June 15, 2011
24
Irrigation Season Detected PesticidesMarch through August
0.0%
1.0%
2.0%
3.0%
4.0%
5.0%
6.0%
7.0%
8.0%
9.0%
10.0%
2005 2006 2007 2008 2009 2010 2011
Pe
rce
nt
De
tec
ted
purpose but may be dissolved in tail water, storm runoff, subsurface flows, or groundwater supplies.
The number and type of field and general chemistry exceedances was not dramatically different than those of prior years.
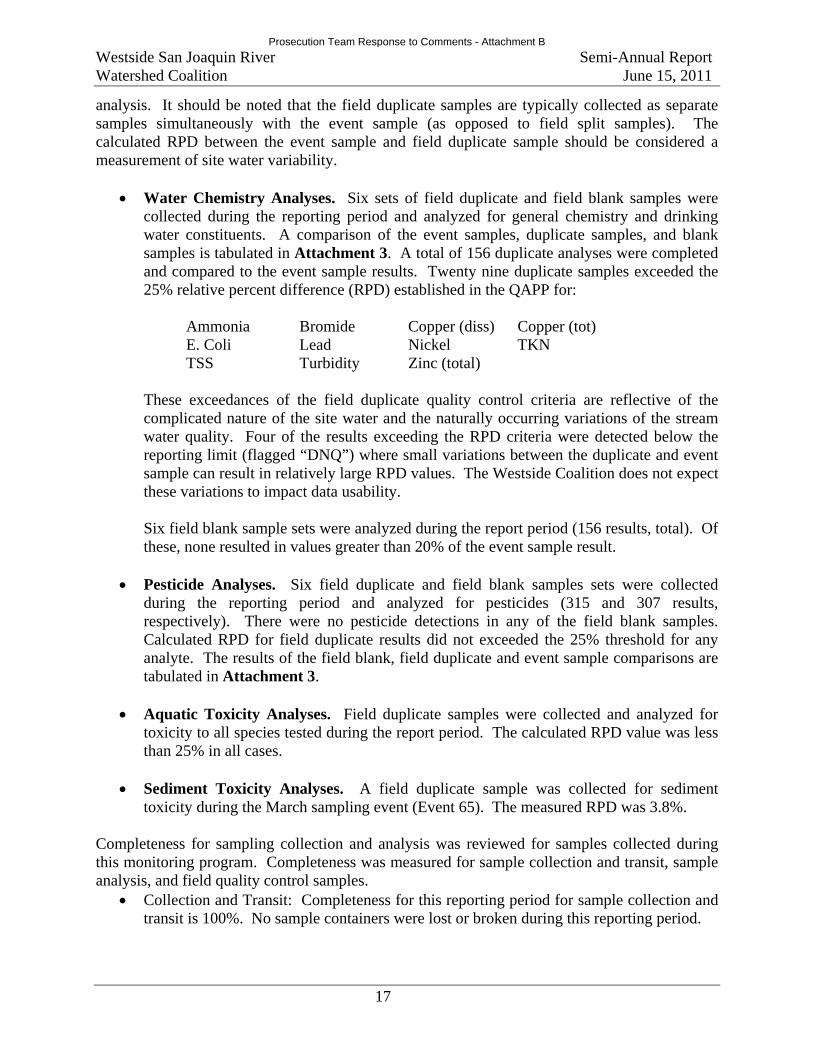
Pesticide exceedances. The Westside Coalition tested for more than 5,400 pesticides during the reporting period, 98% of which resulted in no detection. Of the detected pesticides (113), 63 were greater than established RWQVs. Of the 63 exceedances, 44 were caused by legacy pesticides (DDT, DDE, aldrin, and toxaphene), which are not currently in use. Of the remaining 19, nine were caused by chlorpyrifos, and five by diuron and five by malathion.
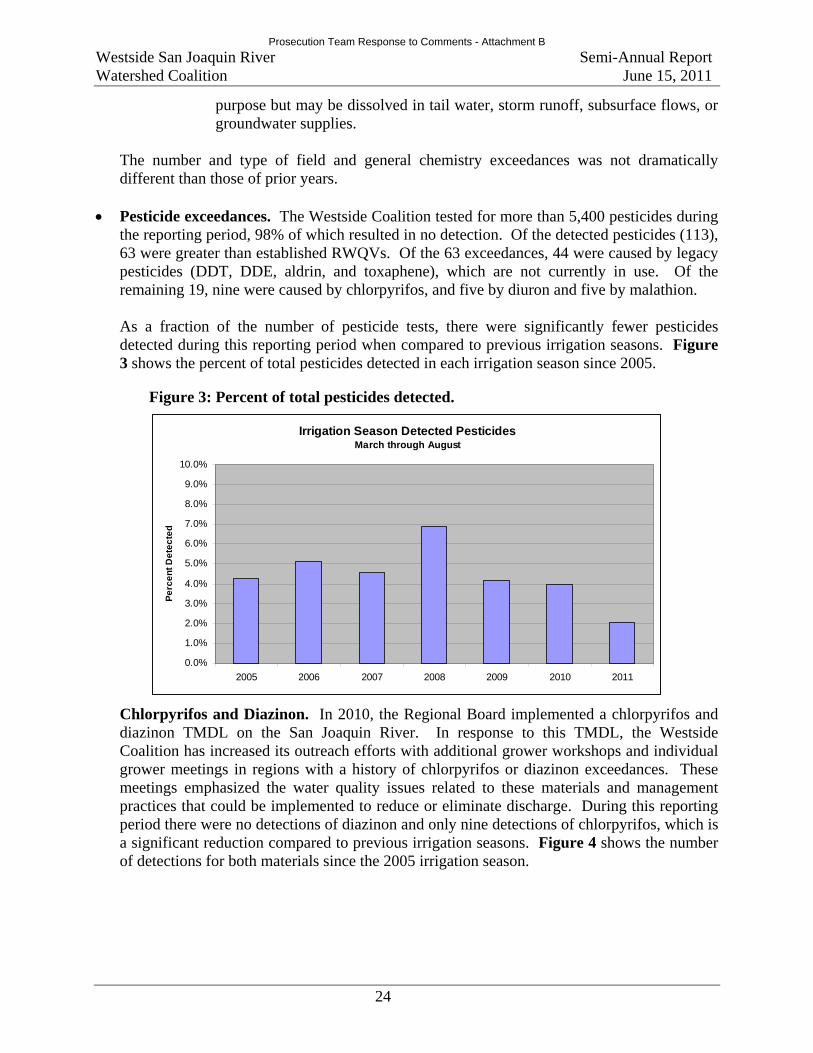
As a fraction of the number of pesticide tests, there were significantly fewer pesticides detected during this reporting period when compared to previous irrigation seasons. Figure 3 shows the percent of total pesticides detected in each irrigation season since 2005.
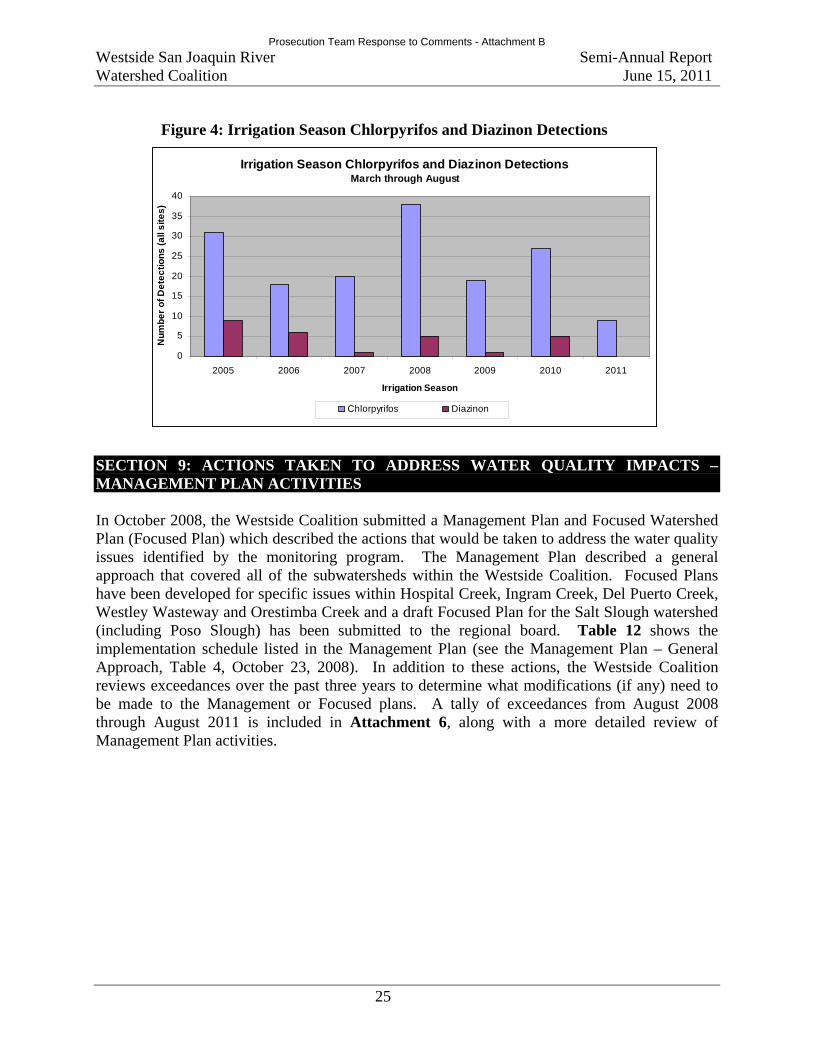
Chlorpyrifos and Diazinon. In 2010, the Regional Board implemented a chlorpyrifos and diazinon TMDL on the San Joaquin River. In response to this TMDL, the Westside Coalition has increased its outreach efforts with additional grower workshops and individual grower meetings in regions with a history of chlorpyrifos or diazinon exceedances. These meetings emphasized the water quality issues related to these materials and management practices that could be implemented to reduce or eliminate discharge. During this reporting period there were no detections of diazinon and only nine detections of chlorpyrifos, which is a significant reduction compared to previous irrigation seasons. Figure 4 shows the number of detections for both materials since the 2005 irrigation season.
Figure 3: Percent of total pesticides detected.
Prosecution Team Response to Comments - Attachment B
Westside San Joaquin River Semi-Annual Report Watershed Coalition June 15, 2011
25
SECTION 9: ACTIONS TAKEN TO ADDRESS WATER QUALITY IMPACTS – MANAGEMENT PLAN ACTIVITIES In October 2008, the Westside Coalition submitted a Management Plan and Focused Watershed Plan (Focused Plan) which described the actions that would be taken to address the water quality issues identified by the monitoring program. The Management Plan described a general approach that covered all of the subwatersheds within the Westside Coalition. Focused Plans have been developed for specific issues within Hospital Creek, Ingram Creek, Del Puerto Creek, Westley Wasteway and Orestimba Creek and a draft Focused Plan for the Salt Slough watershed (including Poso Slough) has been submitted to the regional board. Table 12 shows the implementation schedule listed in the Management Plan (see the Management Plan – General Approach, Table 4, October 23, 2008). In addition to these actions, the Westside Coalition reviews exceedances over the past three years to determine what modifications (if any) need to be made to the Management or Focused plans. A tally of exceedances from August 2008 through August 2011 is included in Attachment 6, along with a more detailed review of Management Plan activities.
Irrigation Season Chlorpyrifos and Diazinon DetectionsMarch through August
0
5
10
15
20
25
30
35
40
2005 2006 2007 2008 2009 2010 2011
Irrigation Season
Nu
mb
er
of
De
tec
tio
ns
(a
ll s
ite
s)
Chlorpyrifos Diazinon
Figure 4: Irrigation Season Chlorpyrifos and Diazinon Detections
Prosecution Team Response to Comments - Attachment B
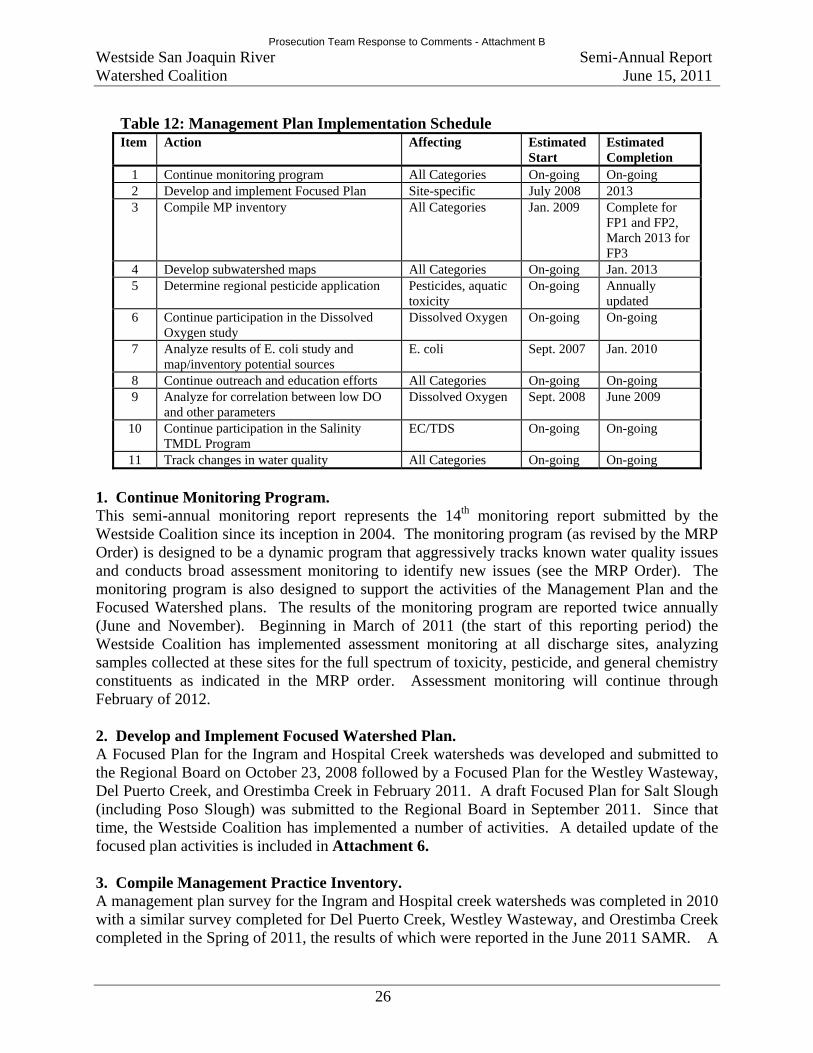
Westside San Joaquin River Semi-Annual Report Watershed Coalition June 15, 2011
26
Table 12: Management Plan Implementation Schedule Item Action Affecting Estimated
Start Estimated Completion
1 Continue monitoring program All Categories On-going On-going 2 Develop and implement Focused Plan Site-specific July 2008 2013 3 Compile MP inventory All Categories Jan. 2009 Complete for
FP1 and FP2, March 2013 for FP3
4 Develop subwatershed maps All Categories On-going Jan. 2013 5 Determine regional pesticide application Pesticides, aquatic
toxicity On-going Annually
updated 6 Continue participation in the Dissolved
Oxygen study Dissolved Oxygen On-going On-going
7 Analyze results of E. coli study and map/inventory potential sources
E. coli Sept. 2007 Jan. 2010
8 Continue outreach and education efforts All Categories On-going On-going 9 Analyze for correlation between low DO
and other parameters Dissolved Oxygen Sept. 2008 June 2009
10 Continue participation in the Salinity TMDL Program
EC/TDS On-going On-going
11 Track changes in water quality All Categories On-going On-going
1. Continue Monitoring Program. This semi-annual monitoring report represents the 14th monitoring report submitted by the Westside Coalition since its inception in 2004. The monitoring program (as revised by the MRP Order) is designed to be a dynamic program that aggressively tracks known water quality issues and conducts broad assessment monitoring to identify new issues (see the MRP Order). The monitoring program is also designed to support the activities of the Management Plan and the Focused Watershed plans. The results of the monitoring program are reported twice annually (June and November). Beginning in March of 2011 (the start of this reporting period) the Westside Coalition has implemented assessment monitoring at all discharge sites, analyzing samples collected at these sites for the full spectrum of toxicity, pesticide, and general chemistry constituents as indicated in the MRP order. Assessment monitoring will continue through February of 2012. 2. Develop and Implement Focused Watershed Plan. A Focused Plan for the Ingram and Hospital Creek watersheds was developed and submitted to the Regional Board on October 23, 2008 followed by a Focused Plan for the Westley Wasteway, Del Puerto Creek, and Orestimba Creek in February 2011. A draft Focused Plan for Salt Slough (including Poso Slough) was submitted to the Regional Board in September 2011. Since that time, the Westside Coalition has implemented a number of activities. A detailed update of the focused plan activities is included in Attachment 6. 3. Compile Management Practice Inventory. A management plan survey for the Ingram and Hospital creek watersheds was completed in 2010 with a similar survey completed for Del Puerto Creek, Westley Wasteway, and Orestimba Creek completed in the Spring of 2011, the results of which were reported in the June 2011 SAMR. A
Prosecution Team Response to Comments - Attachment B
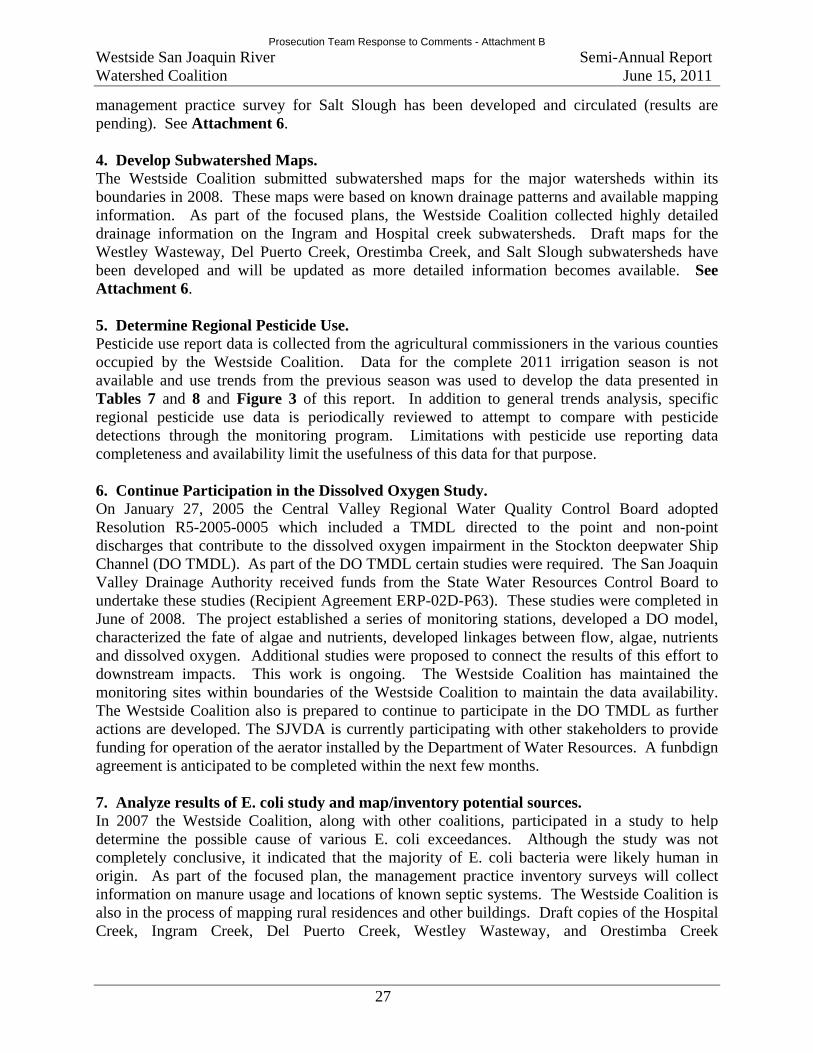
Westside San Joaquin River Semi-Annual Report Watershed Coalition June 15, 2011
27
management practice survey for Salt Slough has been developed and circulated (results are pending). See Attachment 6. 4. Develop Subwatershed Maps. The Westside Coalition submitted subwatershed maps for the major watersheds within its boundaries in 2008. These maps were based on known drainage patterns and available mapping information. As part of the focused plans, the Westside Coalition collected highly detailed drainage information on the Ingram and Hospital creek subwatersheds. Draft maps for the Westley Wasteway, Del Puerto Creek, Orestimba Creek, and Salt Slough subwatersheds have been developed and will be updated as more detailed information becomes available. See Attachment 6. 5. Determine Regional Pesticide Use. Pesticide use report data is collected from the agricultural commissioners in the various counties occupied by the Westside Coalition. Data for the complete 2011 irrigation season is not available and use trends from the previous season was used to develop the data presented in Tables 7 and 8 and Figure 3 of this report. In addition to general trends analysis, specific regional pesticide use data is periodically reviewed to attempt to compare with pesticide detections through the monitoring program. Limitations with pesticide use reporting data completeness and availability limit the usefulness of this data for that purpose. 6. Continue Participation in the Dissolved Oxygen Study. On January 27, 2005 the Central Valley Regional Water Quality Control Board adopted Resolution R5-2005-0005 which included a TMDL directed to the point and non-point discharges that contribute to the dissolved oxygen impairment in the Stockton deepwater Ship Channel (DO TMDL). As part of the DO TMDL certain studies were required. The San Joaquin Valley Drainage Authority received funds from the State Water Resources Control Board to undertake these studies (Recipient Agreement ERP-02D-P63). These studies were completed in June of 2008. The project established a series of monitoring stations, developed a DO model, characterized the fate of algae and nutrients, developed linkages between flow, algae, nutrients and dissolved oxygen. Additional studies were proposed to connect the results of this effort to downstream impacts. This work is ongoing. The Westside Coalition has maintained the monitoring sites within boundaries of the Westside Coalition to maintain the data availability. The Westside Coalition also is prepared to continue to participate in the DO TMDL as further actions are developed. The SJVDA is currently participating with other stakeholders to provide funding for operation of the aerator installed by the Department of Water Resources. A funbdign agreement is anticipated to be completed within the next few months. 7. Analyze results of E. coli study and map/inventory potential sources. In 2007 the Westside Coalition, along with other coalitions, participated in a study to help determine the possible cause of various E. coli exceedances. Although the study was not completely conclusive, it indicated that the majority of E. coli bacteria were likely human in origin. As part of the focused plan, the management practice inventory surveys will collect information on manure usage and locations of known septic systems. The Westside Coalition is also in the process of mapping rural residences and other buildings. Draft copies of the Hospital Creek, Ingram Creek, Del Puerto Creek, Westley Wasteway, and Orestimba Creek
Prosecution Team Response to Comments - Attachment B
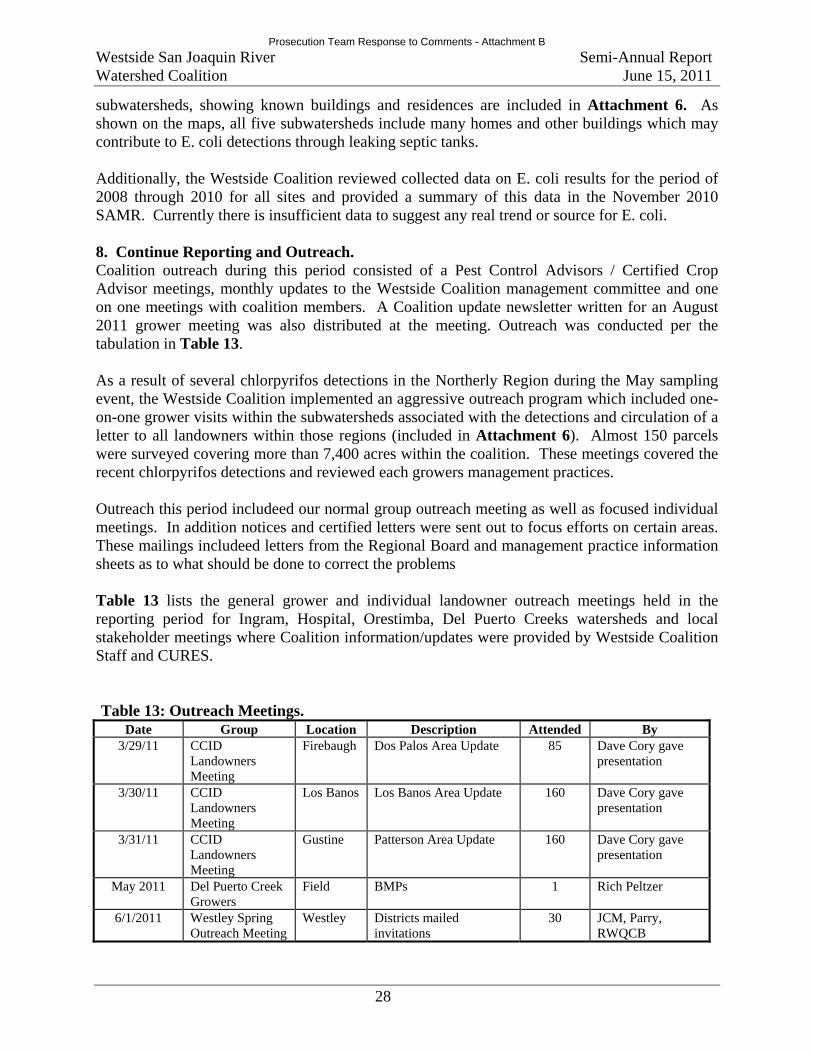
Westside San Joaquin River Semi-Annual Report Watershed Coalition June 15, 2011
28
subwatersheds, showing known buildings and residences are included in Attachment 6. As shown on the maps, all five subwatersheds include many homes and other buildings which may contribute to E. coli detections through leaking septic tanks. Additionally, the Westside Coalition reviewed collected data on E. coli results for the period of 2008 through 2010 for all sites and provided a summary of this data in the November 2010 SAMR. Currently there is insufficient data to suggest any real trend or source for E. coli. 8. Continue Reporting and Outreach. Coalition outreach during this period consisted of a Pest Control Advisors / Certified Crop Advisor meetings, monthly updates to the Westside Coalition management committee and one on one meetings with coalition members. A Coalition update newsletter written for an August 2011 grower meeting was also distributed at the meeting. Outreach was conducted per the tabulation in Table 13. As a result of several chlorpyrifos detections in the Northerly Region during the May sampling event, the Westside Coalition implemented an aggressive outreach program which included one-on-one grower visits within the subwatersheds associated with the detections and circulation of a letter to all landowners within those regions (included in Attachment 6). Almost 150 parcels were surveyed covering more than 7,400 acres within the coalition. These meetings covered the recent chlorpyrifos detections and reviewed each growers management practices. Outreach this period includeed our normal group outreach meeting as well as focused individual meetings. In addition notices and certified letters were sent out to focus efforts on certain areas. These mailings includeed letters from the Regional Board and management practice information sheets as to what should be done to correct the problems Table 13 lists the general grower and individual landowner outreach meetings held in the reporting period for Ingram, Hospital, Orestimba, Del Puerto Creeks watersheds and local stakeholder meetings where Coalition information/updates were provided by Westside Coalition Staff and CURES. Table 13: Outreach Meetings.
Date Group Location Description Attended By 3/29/11 CCID
Landowners Meeting
Firebaugh Dos Palos Area Update 85 Dave Cory gave presentation
3/30/11 CCID Landowners Meeting
Los Banos Los Banos Area Update 160 Dave Cory gave presentation
3/31/11 CCID Landowners Meeting
Gustine Patterson Area Update 160 Dave Cory gave presentation
May 2011 Del Puerto Creek Growers
Field BMPs 1 Rich Peltzer
6/1/2011 Westley Spring Outreach Meeting
Westley Districts mailed invitations
30 JCM, Parry, RWQCB
Prosecution Team Response to Comments - Attachment B
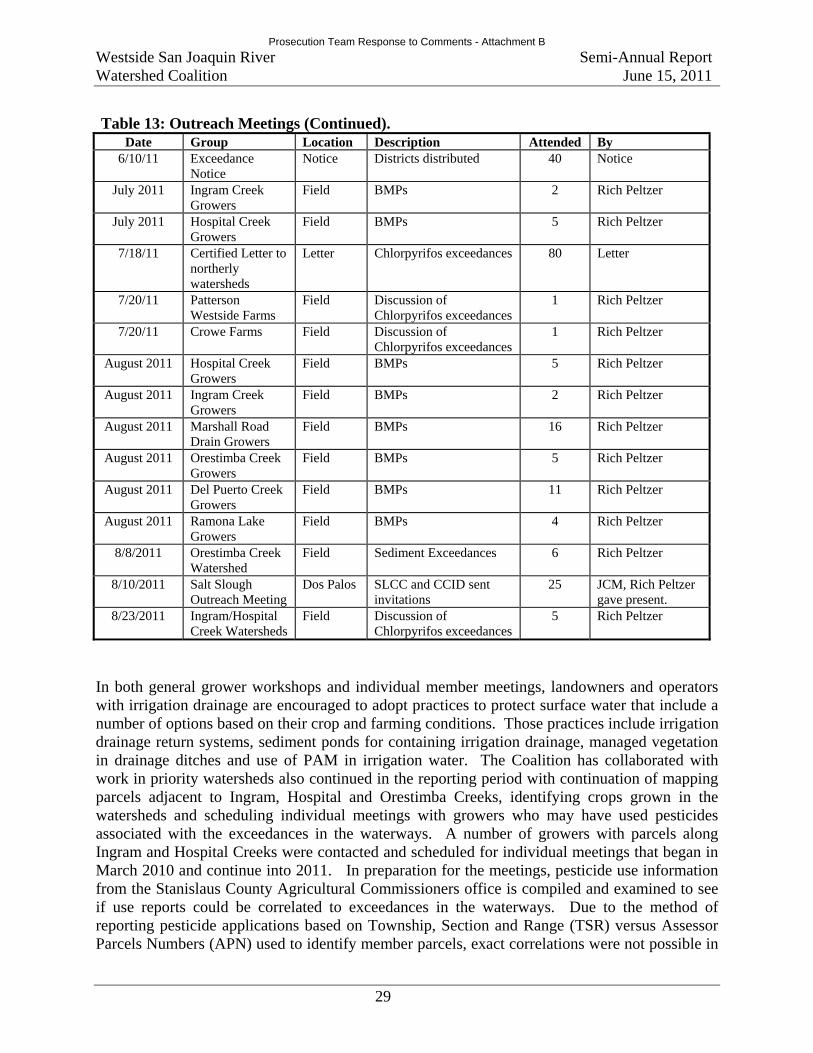
Westside San Joaquin River Semi-Annual Report Watershed Coalition June 15, 2011
29
Table 13: Outreach Meetings (Continued).
Date Group Location Description Attended By 6/10/11 Exceedance
Notice Notice Districts distributed 40 Notice
July 2011 Ingram Creek Growers
Field BMPs 2 Rich Peltzer
July 2011 Hospital Creek Growers
Field BMPs 5 Rich Peltzer
7/18/11 Certified Letter to northerly watersheds
Letter Chlorpyrifos exceedances 80 Letter
7/20/11 Patterson Westside Farms
Field Discussion of Chlorpyrifos exceedances
1 Rich Peltzer
7/20/11 Crowe Farms Field Discussion of Chlorpyrifos exceedances
1 Rich Peltzer
August 2011 Hospital Creek Growers
Field BMPs 5 Rich Peltzer
August 2011 Ingram Creek Growers
Field BMPs 2 Rich Peltzer
August 2011 Marshall Road Drain Growers
Field BMPs 16 Rich Peltzer
August 2011 Orestimba Creek Growers
Field BMPs 5 Rich Peltzer
August 2011 Del Puerto Creek Growers
Field BMPs 11 Rich Peltzer
August 2011 Ramona Lake Growers
Field BMPs 4 Rich Peltzer
8/8/2011 Orestimba Creek Watershed
Field Sediment Exceedances 6 Rich Peltzer
8/10/2011 Salt Slough Outreach Meeting
Dos Palos SLCC and CCID sent invitations
25 JCM, Rich Peltzer gave present.
8/23/2011 Ingram/Hospital Creek Watersheds
Field Discussion of Chlorpyrifos exceedances
5 Rich Peltzer
In both general grower workshops and individual member meetings, landowners and operators with irrigation drainage are encouraged to adopt practices to protect surface water that include a number of options based on their crop and farming conditions. Those practices include irrigation drainage return systems, sediment ponds for containing irrigation drainage, managed vegetation in drainage ditches and use of PAM in irrigation water. The Coalition has collaborated with work in priority watersheds also continued in the reporting period with continuation of mapping parcels adjacent to Ingram, Hospital and Orestimba Creeks, identifying crops grown in the watersheds and scheduling individual meetings with growers who may have used pesticides associated with the exceedances in the waterways. A number of growers with parcels along Ingram and Hospital Creeks were contacted and scheduled for individual meetings that began in March 2010 and continue into 2011. In preparation for the meetings, pesticide use information from the Stanislaus County Agricultural Commissioners office is compiled and examined to see if use reports could be correlated to exceedances in the waterways. Due to the method of reporting pesticide applications based on Township, Section and Range (TSR) versus Assessor Parcels Numbers (APN) used to identify member parcels, exact correlations were not possible in
Prosecution Team Response to Comments - Attachment B
Westside San Joaquin River Semi-Annual Report Watershed Coalition June 15, 2011
30
many cases. However, the effort enables the Coalition to focus its resources on identifying the sources of agricultural discharge within the priority subwatersheds that could lead to water quality impairments. Grant Funding The Westside Coalition continued to offer private grant funding in 2011 to its members totaling more $30,000 for construction of new tailwater silt ponds or to maintain existing ponds. The program funds 75% of the costs of any single project, up to a maximum of $6,000 per project. Proposition 84 has also been made available in 2011 a program managed by CURES and funded by the State Water Resources Control Board. Information on the grant funding availability has been communicated during the reporting period to landowners and operators through direct mailings, grower group meetings and individual contacts with landowners. A letter was sent in April 2011 to landowners with property along the Westside Coalitions priority watersheds (Ingram, Hospital, Orestimba and Del Puerto Creeks) regarding availability of Proposition 84 grant funds. The letters were mailed or hand delivered by irrigation districts encompassing the four watersheds. The Proposition 84 program provides funding for projects in the Central Valley. Outreach by CURES was focused on landowners with fields along waterways with management plans in place by the local watershed coalition and located in the northern San Joaquin Valley, San Joaquin County/Sacramento Rivers Delta and southern Sacramento Valley. Applications were accepted until the July 1, 2011 deadline. Of the 41 applications received by CURES, 12 were submitted by members of the Westside Coalitions and had irrigation drainage into one of the following waterways: Hospital Creek, Ingram Creek, Orestimba Creek or the San Joaquin River. The payment rate is 50% of the total cost of the project and is paid at project completion (reimbursement of expenses). Several projects are in combination with NRCS funding. Priority for the funding was be given to fields located in watersheds with existing Management Plans (those listed above) that have frequent irrigation or storm water drainage. The projects selected for funding are for installing drip or micro sprinkler irrigation systems in row crops or orchards. Most project construction is expected to be completed in winter 2011 or spring 2012. 9. Analyze for Correlation Between Low DO and Other Parameters. The Westside Coalition has performed a preliminary review of the low DO measurements and other data. A summary of this review was included in the November 2009 Semi-Annual Monitoring Report. 10. Continue Participation in the Salinity TMDL Program. The Westside Coalition is actively engaged in the Central Valley Salinity Alternatives for Long-term Sustainability (CVSALTS) process and is an active member of the Central Valley Salinity Coalition that has been organized to facilitate the funding of the CVSALT effort. The Coalition’s participation includes both monetary contributions and a substantial commitment of staff time. Specific actions by the Westside Coalition to support the CVSALT efforts include: (1) Coalition representative’s consistent participation in the CVSALT committees and sub-committees
Prosecution Team Response to Comments - Attachment B
Westside San Joaquin River Semi-Annual Report Watershed Coalition June 15, 2011
31
including serving as chair of the Economic and Social Impact Committee. (2) Consistent participation and economic contributions to the Central Valley Salinity Coalition, including representative serving as president of the CV Salinity Coalition. In addition the San Joaquin Valley Drainage Authority is providing contracting and contract administration services for the CVSALT effort. The Westside Coalition has committed to substantial resources to help ensure that the CVSALT effort results in an effective and efficient salinity management program for the Central Valley. 11. Track Changes in Water Quality. Water quality changes are tracked through the Westside Coalition’s monitoring program (see the MRP Order). Water quality data is reported and summarized twice annually. Other Activities.
Conversion to high efficiency irrigation systems: Several of the districts within the
Westside Coalition have implemented grant and loan programs to assist growers in upgrading their irrigation systems, and at least 6,000 acre of high efficiency systems came on-line during the 2011 irrigation season within the Westside Coalition.
Monitoring Results: Data gathered since the inception of the monitoring program has allowed the Westside Coalition to identify problem areas and issues. Details of sites exhibiting significant toxicity during this monitoring period are included in Attachment 2 and all results that exceeded RWQVs are included in Attachment 5. This information, along with results from previous years will be used as talking points during upcoming grower meetings to outline the problem issues and sites. The Management Plan and Focused Watershed Plan also outline approaches that will be implemented to address the highlighted issues. A number of preliminary conclusions can be made from the data collected so far:
Sediment Toxicity: Sediment toxicity tests were performed on 15 samples collected in May (Event 79). Statistically significant toxicity was measured at six sites (See Tables 10 and 11), however, only two of the five sites measured sever toxicity (survival less than 50%) with the other three sites measuring survival greater than 75%. Samples from Hospital Creek (8.75% survival), Ingram Creek (16.3% survival) and Salt Slough at Sand Dam (78.8% survival) were tested for a variety of pesticides as well as total organic carbon (TOC) and percent solids, the results of which were compared to literature values for the purpose of determining the probable cause of toxicity in each sample.
Hospital Creek: The likely cause of toxicity was esfenvalerate (1.53 toxic units).
Other detected pesticides, including bifenthrin (0.37 toxic units), chlorpyrifos (0.22 toxic units) and lambda-cyhalothrin (0.18 toxic units) likely contributed to the toxicity.
Ingram Creek: The likely causes of toxicity were lambda-cyhalothrin (0.72 toxic units) and bifenthrin (0.58 toxic units). Chlorpyrifos was also detected (0.22 toxic units) and may have contributed to the toxicity. Other detected pesticides had low toxic units and would have a negligible effect on sample toxicity.
Prosecution Team Response to Comments - Attachment B
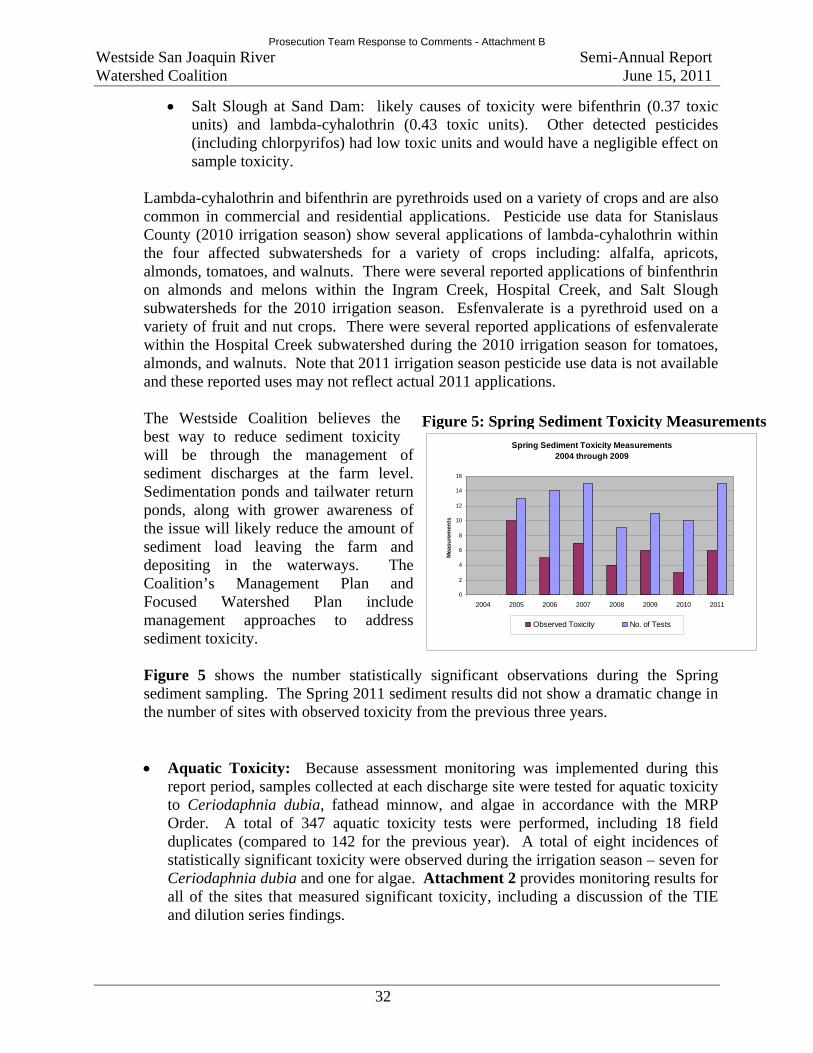
Westside San Joaquin River Semi-Annual Report Watershed Coalition June 15, 2011
32
Figure 5: Spring Sediment Toxicity MeasurementsSpring Sediment Toxicity Measurements
2004 through 2009
0
2
4
6
8
10
12
14
16
2004 2005 2006 2007 2008 2009 2010 2011
Mea
sure
men
ts
Observed Toxicity No. of Tests
Salt Slough at Sand Dam: likely causes of toxicity were bifenthrin (0.37 toxic units) and lambda-cyhalothrin (0.43 toxic units). Other detected pesticides (including chlorpyrifos) had low toxic units and would have a negligible effect on sample toxicity.
Lambda-cyhalothrin and bifenthrin are pyrethroids used on a variety of crops and are also common in commercial and residential applications. Pesticide use data for Stanislaus County (2010 irrigation season) show several applications of lambda-cyhalothrin within the four affected subwatersheds for a variety of crops including: alfalfa, apricots, almonds, tomatoes, and walnuts. There were several reported applications of binfenthrin on almonds and melons within the Ingram Creek, Hospital Creek, and Salt Slough subwatersheds for the 2010 irrigation season. Esfenvalerate is a pyrethroid used on a variety of fruit and nut crops. There were several reported applications of esfenvalerate within the Hospital Creek subwatershed during the 2010 irrigation season for tomatoes, almonds, and walnuts. Note that 2011 irrigation season pesticide use data is not available and these reported uses may not reflect actual 2011 applications.
The Westside Coalition believes the best way to reduce sediment toxicity will be through the management of sediment discharges at the farm level. Sedimentation ponds and tailwater return ponds, along with grower awareness of the issue will likely reduce the amount of sediment load leaving the farm and depositing in the waterways. The Coalition’s Management Plan and Focused Watershed Plan include management approaches to address sediment toxicity. Figure 5 shows the number statistically significant observations during the Spring sediment sampling. The Spring 2011 sediment results did not show a dramatic change in the number of sites with observed toxicity from the previous three years. Aquatic Toxicity: Because assessment monitoring was implemented during this
report period, samples collected at each discharge site were tested for aquatic toxicity to Ceriodaphnia dubia, fathead minnow, and algae in accordance with the MRP Order. A total of 347 aquatic toxicity tests were performed, including 18 field duplicates (compared to 142 for the previous year). A total of eight incidences of statistically significant toxicity were observed during the irrigation season – seven for Ceriodaphnia dubia and one for algae. Attachment 2 provides monitoring results for all of the sites that measured significant toxicity, including a discussion of the TIE and dilution series findings.
Prosecution Team Response to Comments - Attachment B

Westside San Joaquin River Semi-Annual Report Watershed Coalition June 15, 2011
33
Pesticide Analyses: During this reporting period, total of fifteen different pesticides were detected for a total of 113 detections. Sixty three of these detections exceeded the established RWQV, however 70% of these exceedances were caused by legacy pesticides like DDT. During this report period, aquatic toxicity was observed eight times and only one observation was linked to a pesticide.
Chlorpyrifos and Diazinon TMDL Program. In addition to its monthly monitoring
program, the Westside Coalition also participates in the San Joaquin River Chlorpyrifos and Diazinon TMDL program. The Westside Coalition collects water samples for chlorpyrifos and diazinon analysis at the San Joaquin River at Sack Dam, Lander Avenue, and Las Palmas Avenue (near the PID pumps) and collaborates with the Eastside Coalition in the development of the TMDL monitoring report and outreach activities. During this reporting period, chlorpyrifos was not detected at any of the San Joaquin River monitoring sites sampled by the Westside Coalition.
General Chemistry and Field Observations: The monitoring results for field and
general chemistry tests were generally similar to previous irrigation seasons. EC/TDS measured the largest number of exceedances for this reporting period (67 and 71 exceedances, respectively). Bacteria continues to be a leading source of exceedances (54 for E. Coli during this period). Other constituent exceedances include dissolved oxygen (9 exceedances), and boron (11 exceedances). Dissolved cadmium, copper, lead, nickel, and zinc results were compared to the calculated RWQV (based on site water hardness) and no exceedances was measured during this reporting period. With many of these constituents, the source of the exceedance is neither clear nor easily traceable, and often can be found in the source water itself (such as the San Joaquin River at Sack Dam or the Delta-Mendota Canal).
SECTION 10: COMMUNICATION REPORTS Exceedance reports were submitted to the Central Valley Regional Water Quality Control Board in response to monitoring results for the reporting period. These reports are included in Appendix B. Follow-up included reporting statistically significant toxic events and exceedences of water quality values to the overlying districts, PCA’s and to individual Coalition participants. The districts would then communicate with the affected growers to notify them that there is a problem. Meetings are then to be organized at the Coalition level as required to inform landowners, operators, PCA’s, chemical applicators and others on monitoring results and likely best management measures that could be undertaken to minimize these problems (see Table 15). SECTION 11: CONCLUSIONS AND RECOMMENDATIONS The Westside Coalition’s monitoring program has identified constituents of concern (see Attachments 2 and 5). The Westside Coalition has submitted a Management Plan and Focused Watershed Plan to address the water quality concerns discovered by previous monitoring. Implementation of these plans has begun.
Prosecution Team Response to Comments - Attachment B
Westside San Joaquin River Semi-Annual Report Watershed Coalition June 15, 2011
34
The Westside Coalition monitoring program has accumulated data from 82 regular monitoring events and 12 rain events. Data from this reporting period has verified previously identified water quality issues but has also showed some indications of an improving trend in water quality (see Section 9). As part of the Management Plan submitted in 2008, the Westside Coalition developed a tally of exceedances by constituent for the data collected between July 2004 through August 2007 (approximately three years). In comparison with the same sites over the most recent three year period (September 2008 through August 2011), there are some promising improvements:
Chlorpyrifos exceedances reduced by 12 and diazinon exceedances reduced by 8. Over the most recent three year period, only one diazinon exceedance have been measured.
Measurement of sediment toxicity reduced by 12. E. coli exceedances reduced by 94.
A complete tally of exceedances by site and constituent is included in Attachment 6.
Prosecution Team Response to Comments - Attachment B
Westside San Joaquin River Semi-Annual Report Watershed Coalition June 15, 2011
Attachment 1 Sampling Event Details
Prosecution Team Response to Comments - Attachment B
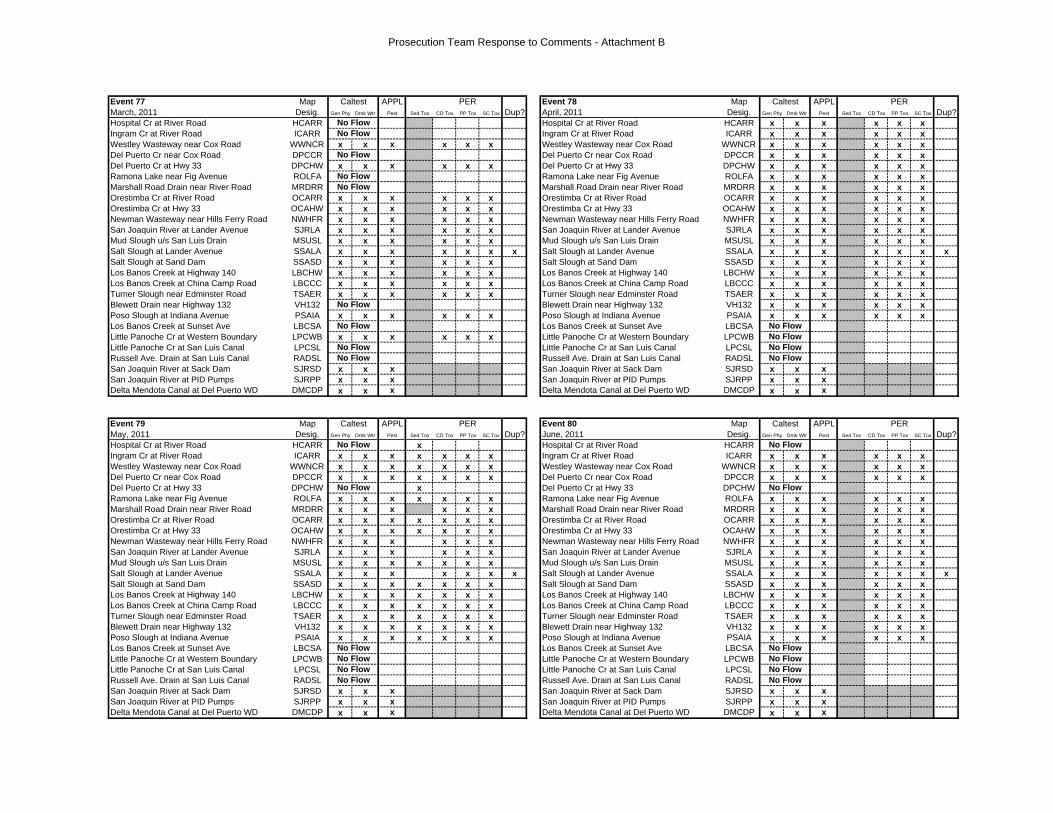
Event 77 APPL Event 78 APPLMarch, 2011 Gen Phy Drnk Wtr Pest Sed Tox CD Tox PP Tox SC Tox Dup? April, 2011 Gen Phy Drnk Wtr Pest Sed Tox CD Tox PP Tox SC Tox Dup?Hospital Cr at River Road HCARR Hospital Cr at River Road HCARR x x x x x xIngram Cr at River Road ICARR Ingram Cr at River Road ICARR x x x x x xWestley Wasteway near Cox Road WWNCR x x x x x x Westley Wasteway near Cox Road WWNCR x x x x x xDel Puerto Cr near Cox Road DPCCR Del Puerto Cr near Cox Road DPCCR x x x x x xDel Puerto Cr at Hwy 33 DPCHW x x x x x x Del Puerto Cr at Hwy 33 DPCHW x x x x x xRamona Lake near Fig Avenue ROLFA Ramona Lake near Fig Avenue ROLFA x x x x x xMarshall Road Drain near River Road MRDRR Marshall Road Drain near River Road MRDRR x x x x x xOrestimba Cr at River Road OCARR x x x x x x Orestimba Cr at River Road OCARR x x x x x xOrestimba Cr at Hwy 33 OCAHW x x x x x x Orestimba Cr at Hwy 33 OCAHW x x x x x xNewman Wasteway near Hills Ferry Road NWHFR x x x x x x Newman Wasteway near Hills Ferry Road NWHFR x x x x x xSan Joaquin River at Lander Avenue SJRLA x x x x x x San Joaquin River at Lander Avenue SJRLA x x x x x xMud Slough u/s San Luis Drain MSUSL x x x x x x Mud Slough u/s San Luis Drain MSUSL x x x x x xSalt Slough at Lander Avenue SSALA x x x x x x x Salt Slough at Lander Avenue SSALA x x x x x x xSalt Slough at Sand Dam SSASD x x x x x x Salt Slough at Sand Dam SSASD x x x x x xLos Banos Creek at Highway 140 LBCHW x x x x x x Los Banos Creek at Highway 140 LBCHW x x x x x xLos Banos Creek at China Camp Road LBCCC x x x x x x Los Banos Creek at China Camp Road LBCCC x x x x x xTurner Slough near Edminster Road TSAER x x x x x x Turner Slough near Edminster Road TSAER x x x x x xBlewett Drain near Highway 132 VH132 Blewett Drain near Highway 132 VH132 x x x x x xPoso Slough at Indiana Avenue PSAIA x x x x x x Poso Slough at Indiana Avenue PSAIA x x x x x xLos Banos Creek at Sunset Ave LBCSA Los Banos Creek at Sunset Ave LBCSALittle Panoche Cr at Western Boundary LPCWB x x x x x x Little Panoche Cr at Western Boundary LPCWBLittle Panoche Cr at San Luis Canal LPCSL Little Panoche Cr at San Luis Canal LPCSLRussell Ave. Drain at San Luis Canal RADSL Russell Ave. Drain at San Luis Canal RADSLSan Joaquin River at Sack Dam SJRSD x x x San Joaquin River at Sack Dam SJRSD x x xSan Joaquin River at PID Pumps SJRPP x x x San Joaquin River at PID Pumps SJRPP x x xDelta Mendota Canal at Del Puerto WD DMCDP x x x Delta Mendota Canal at Del Puerto WD DMCDP x x x
Event 79 APPL Event 80 APPLMay, 2011 Gen Phy Drnk Wtr Pest Sed Tox CD Tox PP Tox SC Tox Dup? June, 2011 Gen Phy Drnk Wtr Pest Sed Tox CD Tox PP Tox SC Tox Dup?Hospital Cr at River Road HCARR x Hospital Cr at River Road HCARRIngram Cr at River Road ICARR x x x x x x x Ingram Cr at River Road ICARR x x x x x xWestley Wasteway near Cox Road WWNCR x x x x x x x Westley Wasteway near Cox Road WWNCR x x x x x xDel Puerto Cr near Cox Road DPCCR x x x x x x x Del Puerto Cr near Cox Road DPCCR x x x x x xDel Puerto Cr at Hwy 33 DPCHW x Del Puerto Cr at Hwy 33 DPCHWRamona Lake near Fig Avenue ROLFA x x x x x x x Ramona Lake near Fig Avenue ROLFA x x x x x xMarshall Road Drain near River Road MRDRR x x x x x x Marshall Road Drain near River Road MRDRR x x x x x xOrestimba Cr at River Road OCARR x x x x x x x Orestimba Cr at River Road OCARR x x x x x xOrestimba Cr at Hwy 33 OCAHW x x x x x x x Orestimba Cr at Hwy 33 OCAHW x x x x x xNewman Wasteway near Hills Ferry Road NWHFR x x x x x x Newman Wasteway near Hills Ferry Road NWHFR x x x x x xSan Joaquin River at Lander Avenue SJRLA x x x x x x San Joaquin River at Lander Avenue SJRLA x x x x x xMud Slough u/s San Luis Drain MSUSL x x x x x x x Mud Slough u/s San Luis Drain MSUSL x x x x x xSalt Slough at Lander Avenue SSALA x x x x x x x Salt Slough at Lander Avenue SSALA x x x x x x xSalt Slough at Sand Dam SSASD x x x x x x x Salt Slough at Sand Dam SSASD x x x x x xLos Banos Creek at Highway 140 LBCHW x x x x x x x Los Banos Creek at Highway 140 LBCHW x x x x x xLos Banos Creek at China Camp Road LBCCC x x x x x x x Los Banos Creek at China Camp Road LBCCC x x x x x xTurner Slough near Edminster Road TSAER x x x x x x x Turner Slough near Edminster Road TSAER x x x x x xBlewett Drain near Highway 132 VH132 x x x x x x x Blewett Drain near Highway 132 VH132 x x x x x xPoso Slough at Indiana Avenue PSAIA x x x x x x x Poso Slough at Indiana Avenue PSAIA x x x x x xLos Banos Creek at Sunset Ave LBCSA Los Banos Creek at Sunset Ave LBCSALittle Panoche Cr at Western Boundary LPCWB Little Panoche Cr at Western Boundary LPCWBLittle Panoche Cr at San Luis Canal LPCSL Little Panoche Cr at San Luis Canal LPCSLRussell Ave. Drain at San Luis Canal RADSL Russell Ave. Drain at San Luis Canal RADSLSan Joaquin River at Sack Dam SJRSD x x x San Joaquin River at Sack Dam SJRSD x x xSan Joaquin River at PID Pumps SJRPP x x x San Joaquin River at PID Pumps SJRPP x x xDelta Mendota Canal at Del Puerto WD DMCDP x x x Delta Mendota Canal at Del Puerto WD DMCDP x x x
No FlowNo Flow
No Flow
No Flow
No Flow
No Flow
Map Desig.
No FlowNo Flow
No FlowNo Flow
No Flow
No Flow
No Flow
No Flow
No Flow
No FlowNo FlowNo Flow
No Flow
No Flow
No Flow
Caltest PER
Caltest PER
No FlowNo FlowNo Flow
Map Desig.
Map Desig.
Map Desig.
Caltest PER
Caltest
No Flow
PER
Prosecution Team Response to Comments - Attachment B

Event 81 APPL Event 82 APPLJuly, 2011 Gen Phy Drnk Wtr Pest Sed Tox CD Tox PP Tox SC Tox Dup? August, 2011 Gen Phy Drnk Wtr Pest Sed Tox CD Tox PP Tox SC Tox Dup?Hospital Cr at River Road HCARR x x x x x x Hospital Cr at River Road HCARR x x x x x xIngram Cr at River Road ICARR x x x x x x Ingram Cr at River Road ICARR x x x x x xWestley Wasteway near Cox Road WWNCR x x x x x x Westley Wasteway near Cox Road WWNCR x x x x x xDel Puerto Cr near Cox Road DPCCR x x x x x x Del Puerto Cr near Cox Road DPCCR x x x x x xDel Puerto Cr at Hwy 33 DPCHW Del Puerto Cr at Hwy 33 DPCHWRamona Lake near Fig Avenue ROLFA x x x x x x Ramona Lake near Fig Avenue ROLFA x x x x x xMarshall Road Drain near River Road MRDRR x x x x x x Marshall Road Drain near River Road MRDRR x x x x x xOrestimba Cr at River Road OCARR x x x x x x Orestimba Cr at River Road OCARR x x x x x xOrestimba Cr at Hwy 33 OCAHW x x x x x x Orestimba Cr at Hwy 33 OCAHW x x x x x xNewman Wasteway near Hills Ferry Road NWHFR x x x x x x Newman Wasteway near Hills Ferry Road NWHFR x x x x x xSan Joaquin River at Lander Avenue SJRLA x x x x x x San Joaquin River at Lander Avenue SJRLA x x x x x xMud Slough u/s San Luis Drain MSUSL x x x x x x Mud Slough u/s San Luis Drain MSUSL x x x x x xSalt Slough at Lander Avenue SSALA x x x x x x x Salt Slough at Lander Avenue SSALA x x x x x x xSalt Slough at Sand Dam SSASD x x x x x x Salt Slough at Sand Dam SSASD x x x x x xLos Banos Creek at Highway 140 LBCHW x x x x x x Los Banos Creek at Highway 140 LBCHW x x x x x xLos Banos Creek at China Camp Road LBCCC x x x x x x Los Banos Creek at China Camp Road LBCCC x x x x x xTurner Slough near Edminster Road TSAER x x x x x x Turner Slough near Edminster Road TSAER x x x x x xBlewett Drain near Highway 132 VH132 x x x x x x Blewett Drain near Highway 132 VH132 x x x x x xPoso Slough at Indiana Avenue PSAIA x x x x x x Poso Slough at Indiana Avenue PSAIA x x x x x xLos Banos Creek at Sunset Ave LBCSA Los Banos Creek at Sunset Ave LBCSALittle Panoche Cr at Western Boundary LPCWB Little Panoche Cr at Western Boundary LPCWBLittle Panoche Cr at San Luis Canal LPCSL Little Panoche Cr at San Luis Canal LPCSLRussell Ave. Drain at San Luis Canal RADSL Russell Ave. Drain at San Luis Canal RADSLSan Joaquin River at Sack Dam SJRSD x x x San Joaquin River at Sack Dam SJRSD x x xSan Joaquin River at PID Pumps SJRPP x x x San Joaquin River at PID Pumps SJRPP x x xDelta Mendota Canal at Del Puerto WD DMCDP x x x Delta Mendota Canal at Del Puerto WD DMCDP x x x
No Flow
No Flow No Flow
No FlowNo Flow
No FlowNo Flow
No Flow
PER
No Flow
Caltest
No Flow
PERCaltestMap Desig.
Map Desig.
Prosecution Team Response to Comments - Attachment B
Westside San Joaquin River Semi-Annual Report Watershed Coalition June 15, 2011
Attachment 2 Significant Aquatic Toxicity Results
Prosecution Team Response to Comments - Attachment B
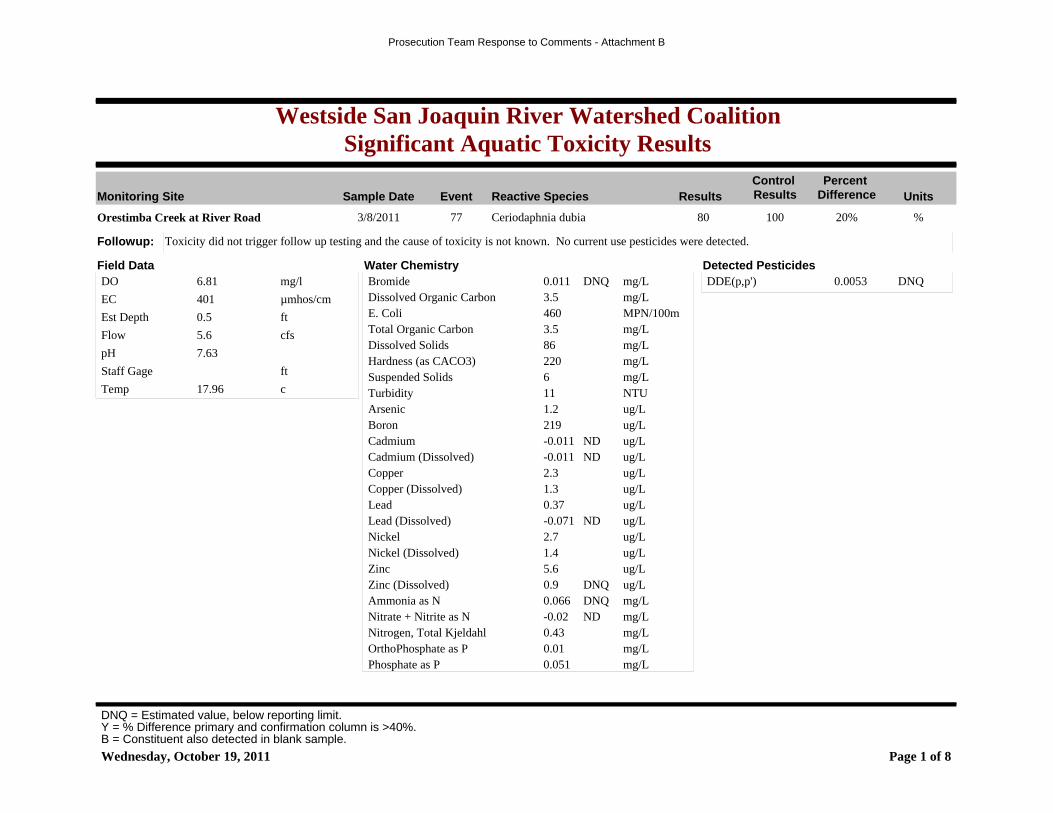
Westside San Joaquin River Watershed CoalitionSignificant Aquatic Toxicity Results
Reactive SpeciesSample Date ResultsControl Results UnitsMonitoring Site Event
Percent Difference
Ceriodaphnia dubia3/8/2011 %
Toxicity did not trigger follow up testing and the cause of toxicity is not known. No current use pesticides were detected.
Orestimba Creek at River Road
Water Chemistry Detected Pesticides
77
Field Data
Followup:
20%80 100
Bromide 0.011 mg/LDNQDissolved Organic Carbon 3.5 mg/LE. Coli 460 MPN/100mTotal Organic Carbon 3.5 mg/LDissolved Solids 86 mg/LHardness (as CACO3) 220 mg/LSuspended Solids 6 mg/LTurbidity 11 NTUArsenic 1.2 ug/LBoron 219 ug/LCadmium -0.011 ug/LNDCadmium (Dissolved) -0.011 ug/LNDCopper 2.3 ug/LCopper (Dissolved) 1.3 ug/LLead 0.37 ug/LLead (Dissolved) -0.071 ug/LNDNickel 2.7 ug/LNickel (Dissolved) 1.4 ug/LZinc 5.6 ug/LZinc (Dissolved) 0.9 ug/LDNQAmmonia as N 0.066 mg/LDNQNitrate + Nitrite as N -0.02 mg/LNDNitrogen, Total Kjeldahl 0.43 mg/LOrthoPhosphate as P 0.01 mg/LPhosphate as P 0.051 mg/L
DDE(p,p') 0.0053 DNQDO mg/l6.81
EC µmhos/cm401
Est Depth ft0.5
Flow cfs5.6
pH 7.63
Staff Gage ft
Temp c17.96
Wednesday, October 19, 2011 Page 1 of 8
DNQ = Estimated value, below reporting limit.Y = % Difference primary and confirmation column is >40%.B = Constituent also detected in blank sample.
Prosecution Team Response to Comments - Attachment B
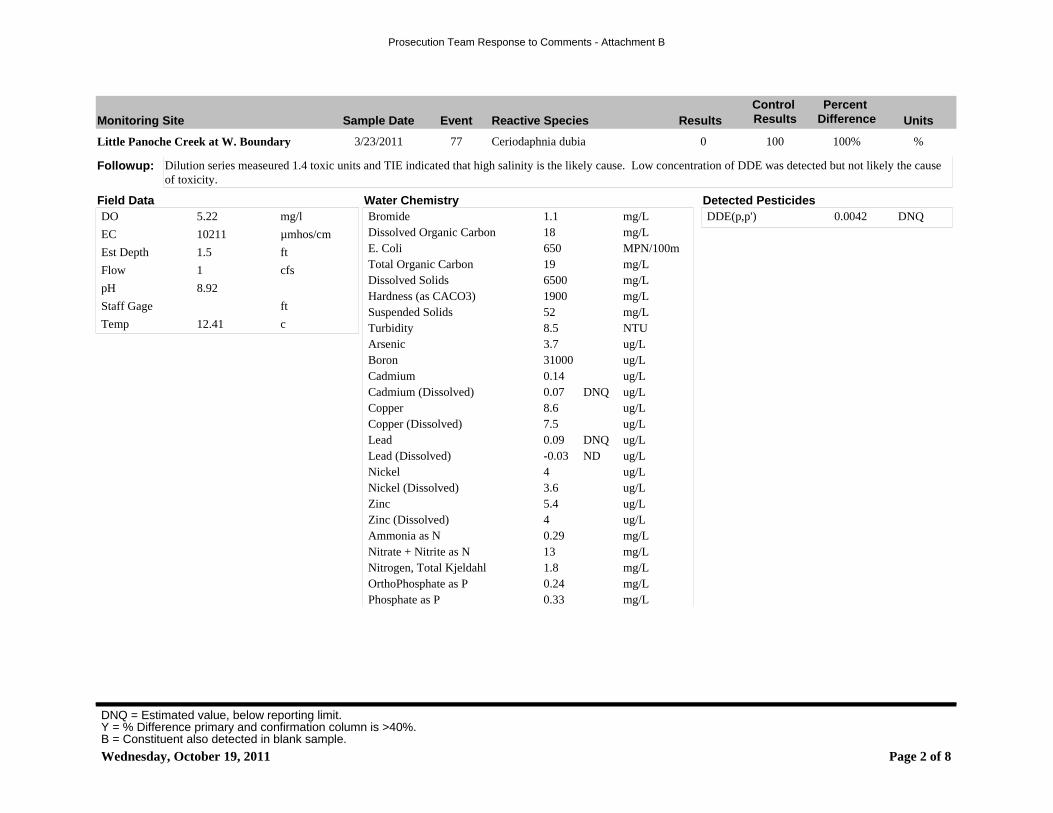
Reactive SpeciesSample Date ResultsControl Results UnitsMonitoring Site Event
Percent Difference
Ceriodaphnia dubia3/23/2011 %
Dilution series measeured 1.4 toxic units and TIE indicated that high salinity is the likely cause. Low concentration of DDE was detected but not likely the cause of toxicity.
Little Panoche Creek at W. Boundary
Water Chemistry Detected Pesticides
77
Field Data
Followup:
100%0 100
Bromide 1.1 mg/LDissolved Organic Carbon 18 mg/LE. Coli 650 MPN/100mTotal Organic Carbon 19 mg/LDissolved Solids 6500 mg/LHardness (as CACO3) 1900 mg/LSuspended Solids 52 mg/LTurbidity 8.5 NTUArsenic 3.7 ug/LBoron 31000 ug/LCadmium 0.14 ug/LCadmium (Dissolved) 0.07 ug/LDNQCopper 8.6 ug/LCopper (Dissolved) 7.5 ug/LLead 0.09 ug/LDNQLead (Dissolved) -0.03 ug/LNDNickel 4 ug/LNickel (Dissolved) 3.6 ug/LZinc 5.4 ug/LZinc (Dissolved) 4 ug/LAmmonia as N 0.29 mg/LNitrate + Nitrite as N 13 mg/LNitrogen, Total Kjeldahl 1.8 mg/LOrthoPhosphate as P 0.24 mg/LPhosphate as P 0.33 mg/L
DDE(p,p') 0.0042 DNQDO mg/l5.22
EC µmhos/cm10211
Est Depth ft1.5
Flow cfs1
pH 8.92
Staff Gage ft
Temp c12.41
Wednesday, October 19, 2011 Page 2 of 8
DNQ = Estimated value, below reporting limit.Y = % Difference primary and confirmation column is >40%.B = Constituent also detected in blank sample.
Prosecution Team Response to Comments - Attachment B
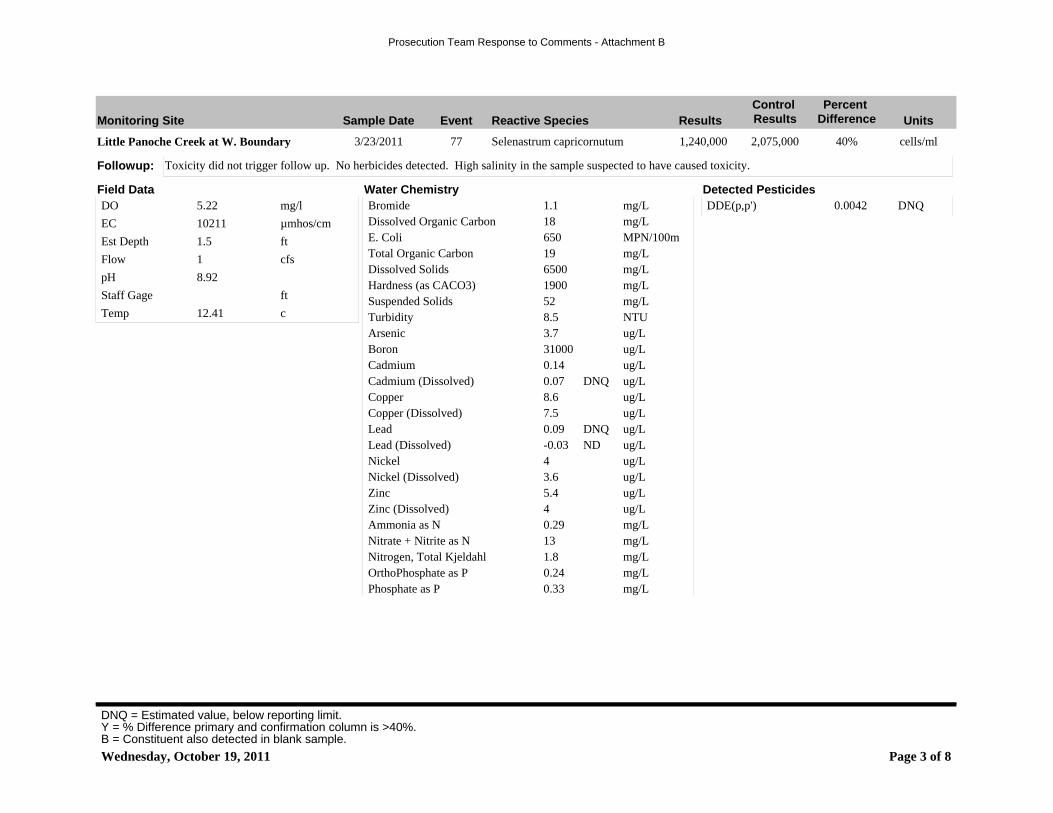
Reactive SpeciesSample Date ResultsControl Results UnitsMonitoring Site Event
Percent Difference
Selenastrum capricornutum3/23/2011 cells/ml
Toxicity did not trigger follow up. No herbicides detected. High salinity in the sample suspected to have caused toxicity.
Little Panoche Creek at W. Boundary
Water Chemistry Detected Pesticides
77
Field Data
Followup:
40%1,240,000 2,075,000
Bromide 1.1 mg/LDissolved Organic Carbon 18 mg/LE. Coli 650 MPN/100mTotal Organic Carbon 19 mg/LDissolved Solids 6500 mg/LHardness (as CACO3) 1900 mg/LSuspended Solids 52 mg/LTurbidity 8.5 NTUArsenic 3.7 ug/LBoron 31000 ug/LCadmium 0.14 ug/LCadmium (Dissolved) 0.07 ug/LDNQCopper 8.6 ug/LCopper (Dissolved) 7.5 ug/LLead 0.09 ug/LDNQLead (Dissolved) -0.03 ug/LNDNickel 4 ug/LNickel (Dissolved) 3.6 ug/LZinc 5.4 ug/LZinc (Dissolved) 4 ug/LAmmonia as N 0.29 mg/LNitrate + Nitrite as N 13 mg/LNitrogen, Total Kjeldahl 1.8 mg/LOrthoPhosphate as P 0.24 mg/LPhosphate as P 0.33 mg/L
DDE(p,p') 0.0042 DNQDO mg/l5.22
EC µmhos/cm10211
Est Depth ft1.5
Flow cfs1
pH 8.92
Staff Gage ft
Temp c12.41
Wednesday, October 19, 2011 Page 3 of 8
DNQ = Estimated value, below reporting limit.Y = % Difference primary and confirmation column is >40%.B = Constituent also detected in blank sample.
Prosecution Team Response to Comments - Attachment B

Reactive SpeciesSample Date ResultsControl Results UnitsMonitoring Site Event
Percent Difference
Ceriodaphnia dubia6/14/2011 %
A TIE was performed however toxicity was not persistant and the test was inconclusive. No pesticides were detected in the sample and the cause is not known.
San Joaquin River at Lander Ave
Water Chemistry Detected Pesticides
80
Field Data
Followup:
78%20 90
Bromide -0.01 mg/LNDDissolved Organic Carbon 2.9 mg/LE. Coli 47 MPN/100mTotal Organic Carbon 2.8 mg/LDissolved Solids 67 mg/LHardness (as CACO3) 28 mg/LSuspended Solids 29 mg/LTurbidity 44 NTUArsenic 1.8 ug/LBoron 16 ug/LCadmium -0.04 ug/LNDCadmium (Dissolved) -0.04 ug/LNDCopper 2.4 ug/LCopper (Dissolved) 1.1 ug/LLead 0.74 ug/LLead (Dissolved) 0.06 ug/LDNQNickel 1.9 ug/LNickel (Dissolved) 0.56 ug/LZinc 3.9 ug/LZinc (Dissolved) -0.7 ug/LNDAmmonia as N 0.077 mg/LDNQNitrate + Nitrite as N 0.09 mg/LNitrogen, Total Kjeldahl 0.43 mg/LOrthoPhosphate as P 0.036 mg/LPhosphate as P 0.095 mg/L
DO mg/l7.8
EC µmhos/cm89
Est Depth ft
Flow cfs1400
pH 7.51
Staff Gage ft
Temp c23.28
Wednesday, October 19, 2011 Page 4 of 8
DNQ = Estimated value, below reporting limit.Y = % Difference primary and confirmation column is >40%.B = Constituent also detected in blank sample.
Prosecution Team Response to Comments - Attachment B
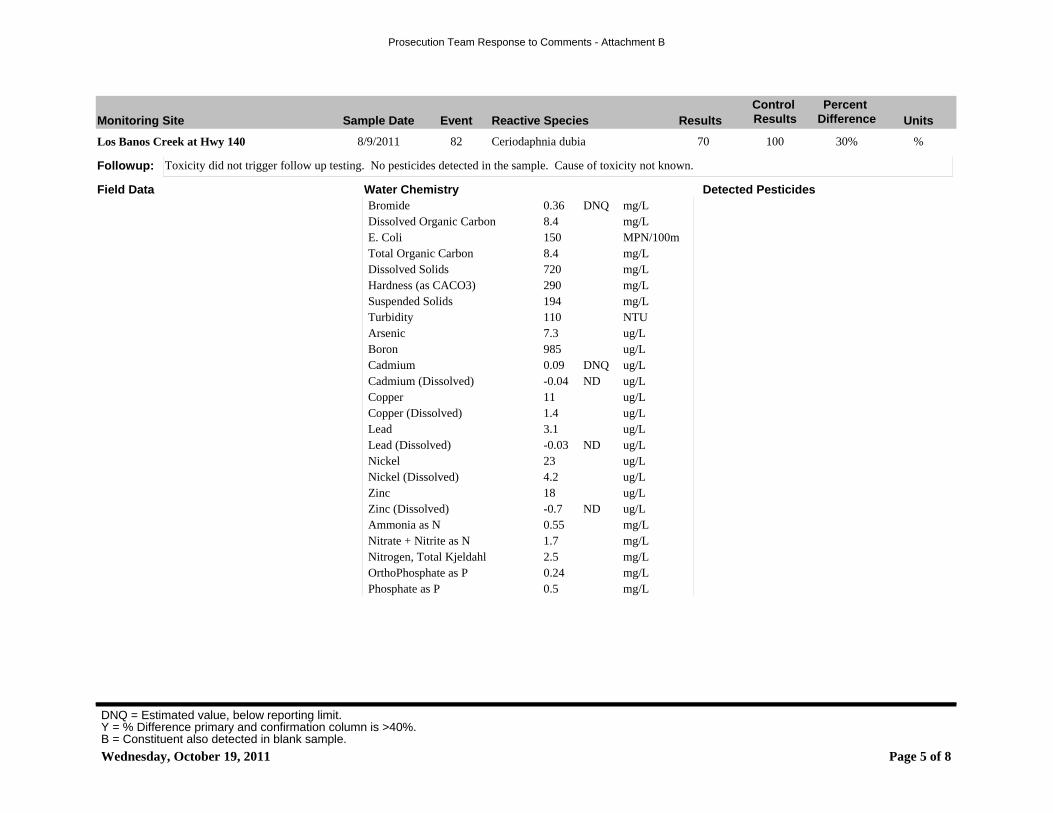
Reactive SpeciesSample Date ResultsControl Results UnitsMonitoring Site Event
Percent Difference
Ceriodaphnia dubia8/9/2011 %
Toxicity did not trigger follow up testing. No pesticides detected in the sample. Cause of toxicity not known.
Los Banos Creek at Hwy 140
Water Chemistry Detected Pesticides
82
Field Data
Followup:
30%70 100
Bromide 0.36 mg/LDNQDissolved Organic Carbon 8.4 mg/LE. Coli 150 MPN/100mTotal Organic Carbon 8.4 mg/LDissolved Solids 720 mg/LHardness (as CACO3) 290 mg/LSuspended Solids 194 mg/LTurbidity 110 NTUArsenic 7.3 ug/LBoron 985 ug/LCadmium 0.09 ug/LDNQCadmium (Dissolved) -0.04 ug/LNDCopper 11 ug/LCopper (Dissolved) 1.4 ug/LLead 3.1 ug/LLead (Dissolved) -0.03 ug/LNDNickel 23 ug/LNickel (Dissolved) 4.2 ug/LZinc 18 ug/LZinc (Dissolved) -0.7 ug/LNDAmmonia as N 0.55 mg/LNitrate + Nitrite as N 1.7 mg/LNitrogen, Total Kjeldahl 2.5 mg/LOrthoPhosphate as P 0.24 mg/LPhosphate as P 0.5 mg/L
Wednesday, October 19, 2011 Page 5 of 8
DNQ = Estimated value, below reporting limit.Y = % Difference primary and confirmation column is >40%.B = Constituent also detected in blank sample.
Prosecution Team Response to Comments - Attachment B
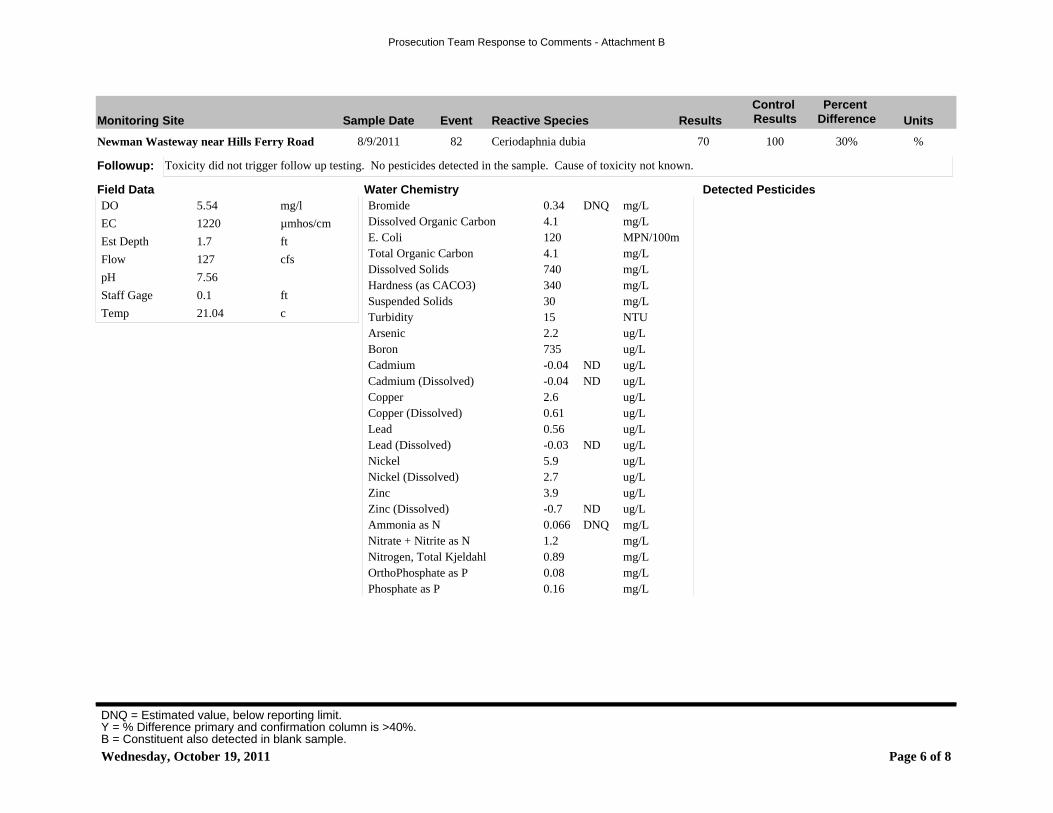
Reactive SpeciesSample Date ResultsControl Results UnitsMonitoring Site Event
Percent Difference
Ceriodaphnia dubia8/9/2011 %
Toxicity did not trigger follow up testing. No pesticides detected in the sample. Cause of toxicity not known.
Newman Wasteway near Hills Ferry Road
Water Chemistry Detected Pesticides
82
Field Data
Followup:
30%70 100
Bromide 0.34 mg/LDNQDissolved Organic Carbon 4.1 mg/LE. Coli 120 MPN/100mTotal Organic Carbon 4.1 mg/LDissolved Solids 740 mg/LHardness (as CACO3) 340 mg/LSuspended Solids 30 mg/LTurbidity 15 NTUArsenic 2.2 ug/LBoron 735 ug/LCadmium -0.04 ug/LNDCadmium (Dissolved) -0.04 ug/LNDCopper 2.6 ug/LCopper (Dissolved) 0.61 ug/LLead 0.56 ug/LLead (Dissolved) -0.03 ug/LNDNickel 5.9 ug/LNickel (Dissolved) 2.7 ug/LZinc 3.9 ug/LZinc (Dissolved) -0.7 ug/LNDAmmonia as N 0.066 mg/LDNQNitrate + Nitrite as N 1.2 mg/LNitrogen, Total Kjeldahl 0.89 mg/LOrthoPhosphate as P 0.08 mg/LPhosphate as P 0.16 mg/L
DO mg/l5.54
EC µmhos/cm1220
Est Depth ft1.7
Flow cfs127
pH 7.56
Staff Gage ft0.1
Temp c21.04
Wednesday, October 19, 2011 Page 6 of 8
DNQ = Estimated value, below reporting limit.Y = % Difference primary and confirmation column is >40%.B = Constituent also detected in blank sample.
Prosecution Team Response to Comments - Attachment B
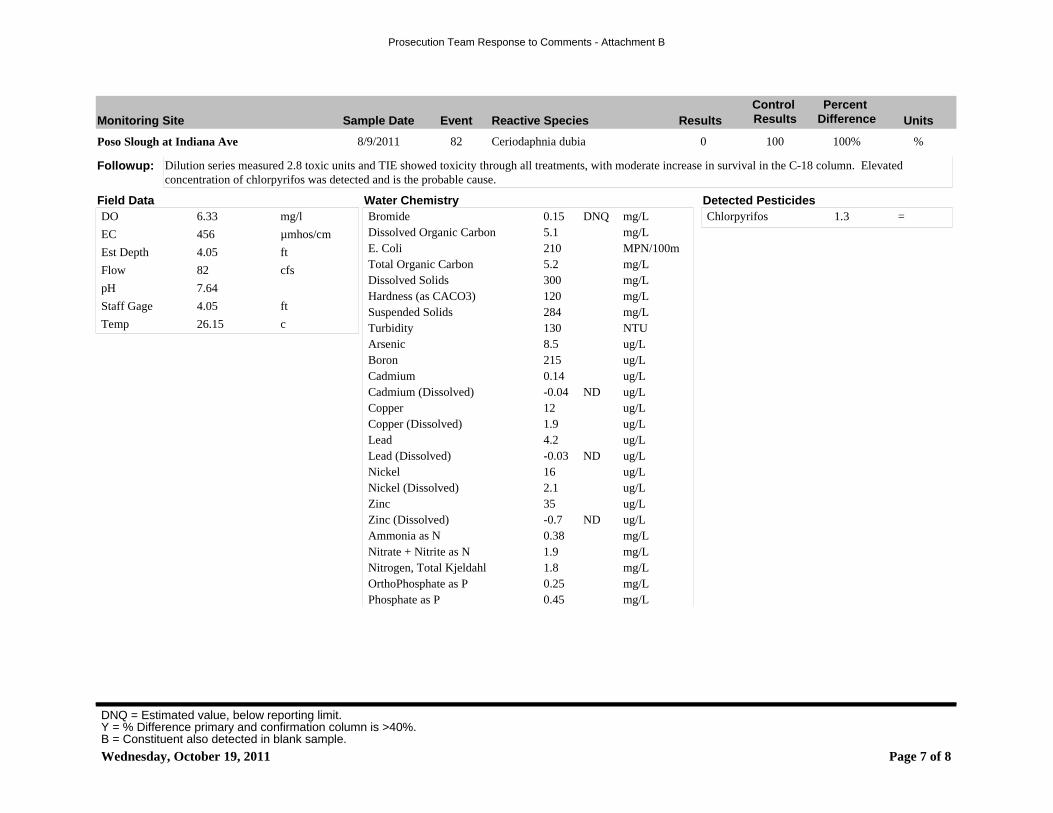
Reactive SpeciesSample Date ResultsControl Results UnitsMonitoring Site Event
Percent Difference
Ceriodaphnia dubia8/9/2011 %
Dilution series measured 2.8 toxic units and TIE showed toxicity through all treatments, with moderate increase in survival in the C-18 column. Elevated concentration of chlorpyrifos was detected and is the probable cause.
Poso Slough at Indiana Ave
Water Chemistry Detected Pesticides
82
Field Data
Followup:
100%0 100
Bromide 0.15 mg/LDNQDissolved Organic Carbon 5.1 mg/LE. Coli 210 MPN/100mTotal Organic Carbon 5.2 mg/LDissolved Solids 300 mg/LHardness (as CACO3) 120 mg/LSuspended Solids 284 mg/LTurbidity 130 NTUArsenic 8.5 ug/LBoron 215 ug/LCadmium 0.14 ug/LCadmium (Dissolved) -0.04 ug/LNDCopper 12 ug/LCopper (Dissolved) 1.9 ug/LLead 4.2 ug/LLead (Dissolved) -0.03 ug/LNDNickel 16 ug/LNickel (Dissolved) 2.1 ug/LZinc 35 ug/LZinc (Dissolved) -0.7 ug/LNDAmmonia as N 0.38 mg/LNitrate + Nitrite as N 1.9 mg/LNitrogen, Total Kjeldahl 1.8 mg/LOrthoPhosphate as P 0.25 mg/LPhosphate as P 0.45 mg/L
Chlorpyrifos 1.3 =DO mg/l6.33
EC µmhos/cm456
Est Depth ft4.05
Flow cfs82
pH 7.64
Staff Gage ft4.05
Temp c26.15
Wednesday, October 19, 2011 Page 7 of 8
DNQ = Estimated value, below reporting limit.Y = % Difference primary and confirmation column is >40%.B = Constituent also detected in blank sample.
Prosecution Team Response to Comments - Attachment B
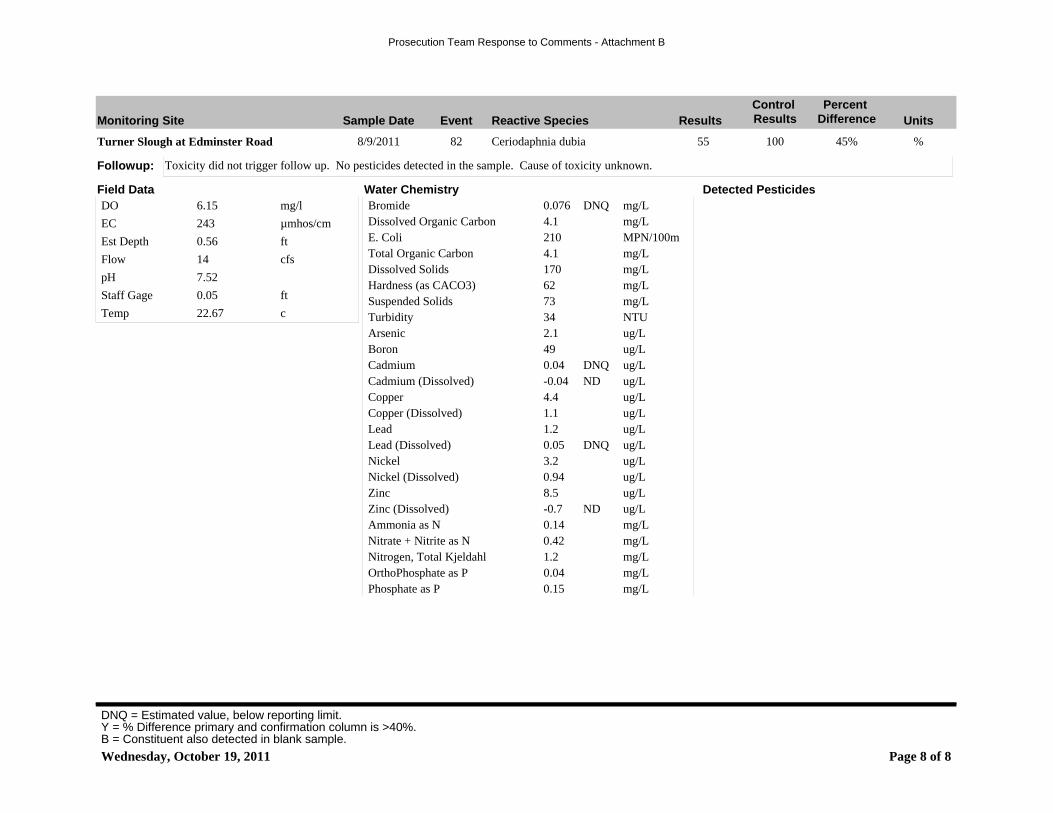
Reactive SpeciesSample Date ResultsControl Results UnitsMonitoring Site Event
Percent Difference
Ceriodaphnia dubia8/9/2011 %
Toxicity did not trigger follow up. No pesticides detected in the sample. Cause of toxicity unknown.
Turner Slough at Edminster Road
Water Chemistry Detected Pesticides
82
Field Data
Followup:
45%55 100
Bromide 0.076 mg/LDNQDissolved Organic Carbon 4.1 mg/LE. Coli 210 MPN/100mTotal Organic Carbon 4.1 mg/LDissolved Solids 170 mg/LHardness (as CACO3) 62 mg/LSuspended Solids 73 mg/LTurbidity 34 NTUArsenic 2.1 ug/LBoron 49 ug/LCadmium 0.04 ug/LDNQCadmium (Dissolved) -0.04 ug/LNDCopper 4.4 ug/LCopper (Dissolved) 1.1 ug/LLead 1.2 ug/LLead (Dissolved) 0.05 ug/LDNQNickel 3.2 ug/LNickel (Dissolved) 0.94 ug/LZinc 8.5 ug/LZinc (Dissolved) -0.7 ug/LNDAmmonia as N 0.14 mg/LNitrate + Nitrite as N 0.42 mg/LNitrogen, Total Kjeldahl 1.2 mg/LOrthoPhosphate as P 0.04 mg/LPhosphate as P 0.15 mg/L
DO mg/l6.15
EC µmhos/cm243
Est Depth ft0.56
Flow cfs14
pH 7.52
Staff Gage ft0.05
Temp c22.67
Wednesday, October 19, 2011 Page 8 of 8
DNQ = Estimated value, below reporting limit.Y = % Difference primary and confirmation column is >40%.B = Constituent also detected in blank sample.
Prosecution Team Response to Comments - Attachment B
Westside San Joaquin River Semi-Annual Report Watershed Coalition June 15, 2011
Attachment 3 Field Quality Control Sample Results
Prosecution Team Response to Comments - Attachment B
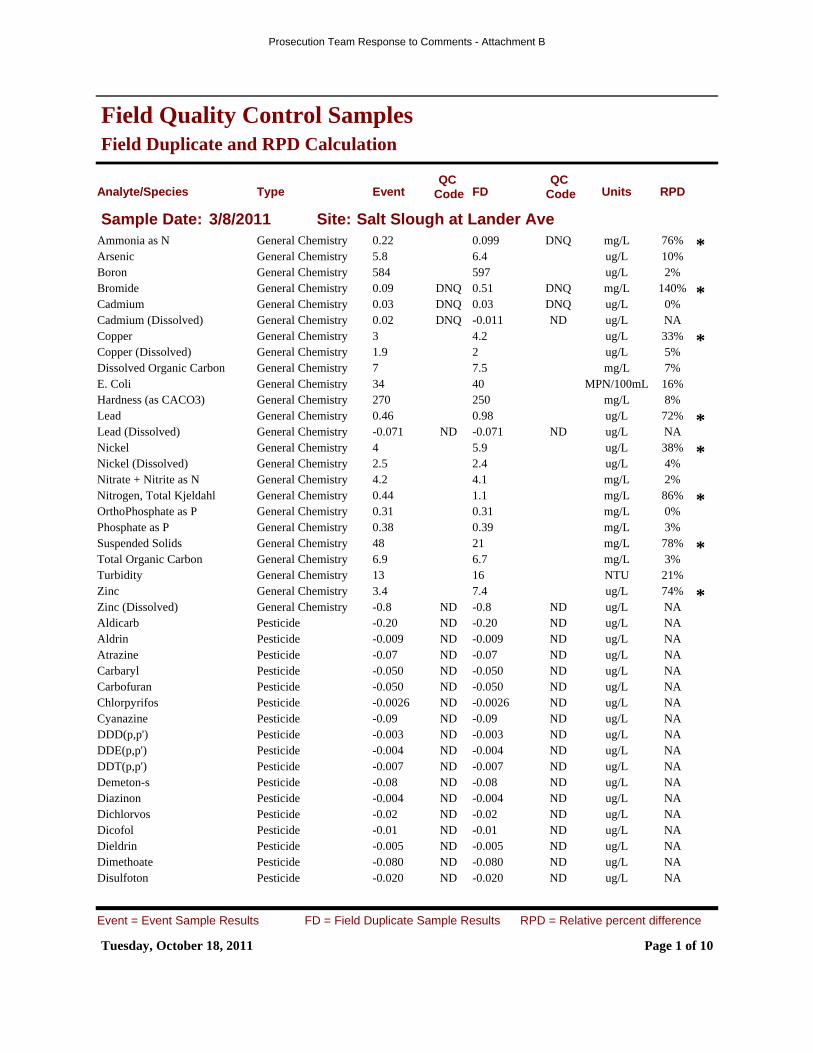
Field Duplicate and RPD Calculation
Field Quality Control Samples
Analyte/Species Units RPDFDEventTypeQC
CodeQC
Code
Sample Date: 3/8/2011 Site: Salt Slough at Lander AveAmmonia as N mg/L0.0990.22 76% *General Chemistry DNQArsenic ug/L6.45.8 10%General ChemistryBoron ug/L597584 2%General ChemistryBromide mg/L0.510.09 140% *General Chemistry DNQDNQCadmium ug/L0.030.03 0%General Chemistry DNQDNQCadmium (Dissolved) ug/L-0.0110.02 NAGeneral Chemistry NDDNQCopper ug/L4.23 33% *General ChemistryCopper (Dissolved) ug/L21.9 5%General ChemistryDissolved Organic Carbon mg/L7.57 7%General ChemistryE. Coli MPN/100mL4034 16%General ChemistryHardness (as CACO3) mg/L250270 8%General ChemistryLead ug/L0.980.46 72% *General ChemistryLead (Dissolved) ug/L-0.071-0.071 NAGeneral Chemistry NDNDNickel ug/L5.94 38% *General ChemistryNickel (Dissolved) ug/L2.42.5 4%General ChemistryNitrate + Nitrite as N mg/L4.14.2 2%General ChemistryNitrogen, Total Kjeldahl mg/L1.10.44 86% *General ChemistryOrthoPhosphate as P mg/L0.310.31 0%General ChemistryPhosphate as P mg/L0.390.38 3%General ChemistrySuspended Solids mg/L2148 78% *General ChemistryTotal Organic Carbon mg/L6.76.9 3%General ChemistryTurbidity NTU1613 21%General ChemistryZinc ug/L7.43.4 74% *General ChemistryZinc (Dissolved) ug/L-0.8-0.8 NAGeneral Chemistry NDNDAldicarb ug/L-0.20-0.20 NAPesticide NDNDAldrin ug/L-0.009-0.009 NAPesticide NDNDAtrazine ug/L-0.07-0.07 NAPesticide NDNDCarbaryl ug/L-0.050-0.050 NAPesticide NDNDCarbofuran ug/L-0.050-0.050 NAPesticide NDNDChlorpyrifos ug/L-0.0026-0.0026 NAPesticide NDNDCyanazine ug/L-0.09-0.09 NAPesticide NDNDDDD(p,p') ug/L-0.003-0.003 NAPesticide NDNDDDE(p,p') ug/L-0.004-0.004 NAPesticide NDNDDDT(p,p') ug/L-0.007-0.007 NAPesticide NDNDDemeton-s ug/L-0.08-0.08 NAPesticide NDNDDiazinon ug/L-0.004-0.004 NAPesticide NDNDDichlorvos ug/L-0.02-0.02 NAPesticide NDNDDicofol ug/L-0.01-0.01 NAPesticide NDNDDieldrin ug/L-0.005-0.005 NAPesticide NDNDDimethoate ug/L-0.080-0.080 NAPesticide NDNDDisulfoton ug/L-0.020-0.020 NAPesticide NDND
Tuesday, October 18, 2011 Page 1 of 10
Event = Event Sample Results FD = Field Duplicate Sample Results RPD = Relative percent difference
Prosecution Team Response to Comments - Attachment B
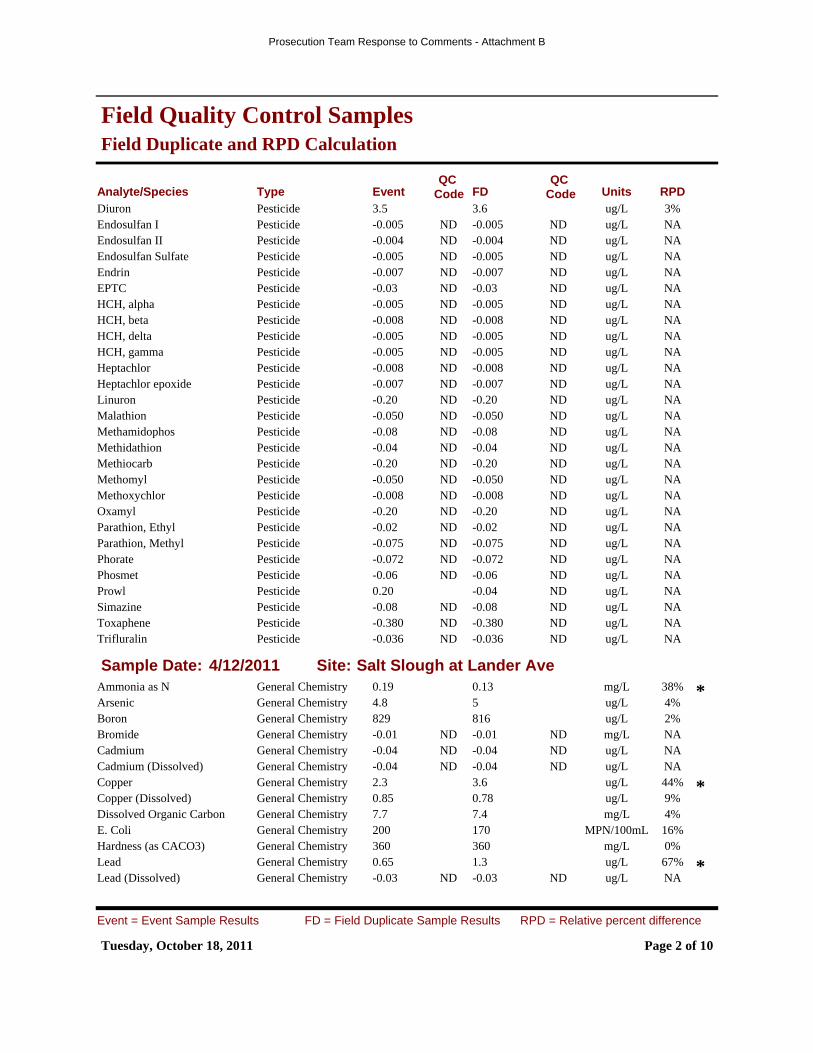
Field Duplicate and RPD Calculation
Field Quality Control Samples
Analyte/Species Units RPDFDEventTypeQC
CodeQC
CodeDiuron ug/L3.63.5 3%PesticideEndosulfan I ug/L-0.005-0.005 NAPesticide NDNDEndosulfan II ug/L-0.004-0.004 NAPesticide NDNDEndosulfan Sulfate ug/L-0.005-0.005 NAPesticide NDNDEndrin ug/L-0.007-0.007 NAPesticide NDNDEPTC ug/L-0.03-0.03 NAPesticide NDNDHCH, alpha ug/L-0.005-0.005 NAPesticide NDNDHCH, beta ug/L-0.008-0.008 NAPesticide NDNDHCH, delta ug/L-0.005-0.005 NAPesticide NDNDHCH, gamma ug/L-0.005-0.005 NAPesticide NDNDHeptachlor ug/L-0.008-0.008 NAPesticide NDNDHeptachlor epoxide ug/L-0.007-0.007 NAPesticide NDNDLinuron ug/L-0.20-0.20 NAPesticide NDNDMalathion ug/L-0.050-0.050 NAPesticide NDNDMethamidophos ug/L-0.08-0.08 NAPesticide NDNDMethidathion ug/L-0.04-0.04 NAPesticide NDNDMethiocarb ug/L-0.20-0.20 NAPesticide NDNDMethomyl ug/L-0.050-0.050 NAPesticide NDNDMethoxychlor ug/L-0.008-0.008 NAPesticide NDNDOxamyl ug/L-0.20-0.20 NAPesticide NDNDParathion, Ethyl ug/L-0.02-0.02 NAPesticide NDNDParathion, Methyl ug/L-0.075-0.075 NAPesticide NDNDPhorate ug/L-0.072-0.072 NAPesticide NDNDPhosmet ug/L-0.06-0.06 NAPesticide NDNDProwl ug/L-0.040.20 NAPesticide NDSimazine ug/L-0.08-0.08 NAPesticide NDNDToxaphene ug/L-0.380-0.380 NAPesticide NDNDTrifluralin ug/L-0.036-0.036 NAPesticide NDND
Sample Date: 4/12/2011 Site: Salt Slough at Lander AveAmmonia as N mg/L0.130.19 38% *General ChemistryArsenic ug/L54.8 4%General ChemistryBoron ug/L816829 2%General ChemistryBromide mg/L-0.01-0.01 NAGeneral Chemistry NDNDCadmium ug/L-0.04-0.04 NAGeneral Chemistry NDNDCadmium (Dissolved) ug/L-0.04-0.04 NAGeneral Chemistry NDNDCopper ug/L3.62.3 44% *General ChemistryCopper (Dissolved) ug/L0.780.85 9%General ChemistryDissolved Organic Carbon mg/L7.47.7 4%General ChemistryE. Coli MPN/100mL170200 16%General ChemistryHardness (as CACO3) mg/L360360 0%General ChemistryLead ug/L1.30.65 67% *General ChemistryLead (Dissolved) ug/L-0.03-0.03 NAGeneral Chemistry NDND
Tuesday, October 18, 2011 Page 2 of 10
Event = Event Sample Results FD = Field Duplicate Sample Results RPD = Relative percent difference
Prosecution Team Response to Comments - Attachment B
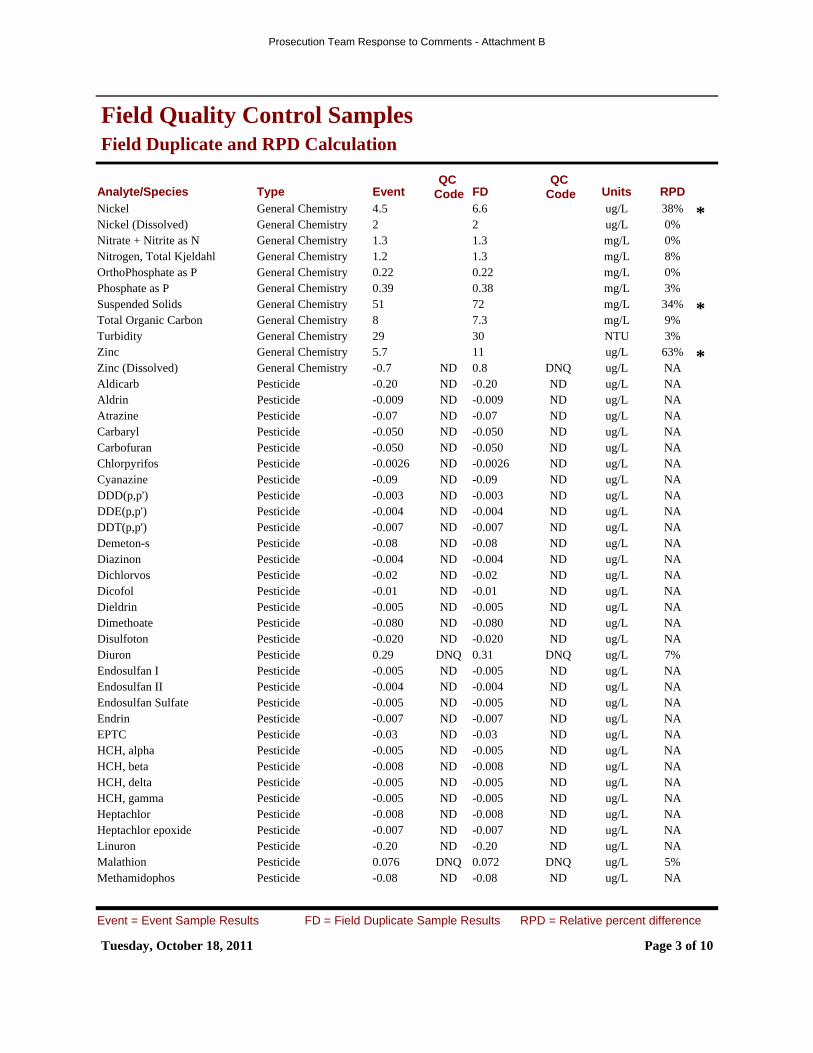
Field Duplicate and RPD Calculation
Field Quality Control Samples
Analyte/Species Units RPDFDEventTypeQC
CodeQC
CodeNickel ug/L6.64.5 38% *General ChemistryNickel (Dissolved) ug/L22 0%General ChemistryNitrate + Nitrite as N mg/L1.31.3 0%General ChemistryNitrogen, Total Kjeldahl mg/L1.31.2 8%General ChemistryOrthoPhosphate as P mg/L0.220.22 0%General ChemistryPhosphate as P mg/L0.380.39 3%General ChemistrySuspended Solids mg/L7251 34% *General ChemistryTotal Organic Carbon mg/L7.38 9%General ChemistryTurbidity NTU3029 3%General ChemistryZinc ug/L115.7 63% *General ChemistryZinc (Dissolved) ug/L0.8-0.7 NAGeneral Chemistry DNQNDAldicarb ug/L-0.20-0.20 NAPesticide NDNDAldrin ug/L-0.009-0.009 NAPesticide NDNDAtrazine ug/L-0.07-0.07 NAPesticide NDNDCarbaryl ug/L-0.050-0.050 NAPesticide NDNDCarbofuran ug/L-0.050-0.050 NAPesticide NDNDChlorpyrifos ug/L-0.0026-0.0026 NAPesticide NDNDCyanazine ug/L-0.09-0.09 NAPesticide NDNDDDD(p,p') ug/L-0.003-0.003 NAPesticide NDNDDDE(p,p') ug/L-0.004-0.004 NAPesticide NDNDDDT(p,p') ug/L-0.007-0.007 NAPesticide NDNDDemeton-s ug/L-0.08-0.08 NAPesticide NDNDDiazinon ug/L-0.004-0.004 NAPesticide NDNDDichlorvos ug/L-0.02-0.02 NAPesticide NDNDDicofol ug/L-0.01-0.01 NAPesticide NDNDDieldrin ug/L-0.005-0.005 NAPesticide NDNDDimethoate ug/L-0.080-0.080 NAPesticide NDNDDisulfoton ug/L-0.020-0.020 NAPesticide NDNDDiuron ug/L0.310.29 7%Pesticide DNQDNQEndosulfan I ug/L-0.005-0.005 NAPesticide NDNDEndosulfan II ug/L-0.004-0.004 NAPesticide NDNDEndosulfan Sulfate ug/L-0.005-0.005 NAPesticide NDNDEndrin ug/L-0.007-0.007 NAPesticide NDNDEPTC ug/L-0.03-0.03 NAPesticide NDNDHCH, alpha ug/L-0.005-0.005 NAPesticide NDNDHCH, beta ug/L-0.008-0.008 NAPesticide NDNDHCH, delta ug/L-0.005-0.005 NAPesticide NDNDHCH, gamma ug/L-0.005-0.005 NAPesticide NDNDHeptachlor ug/L-0.008-0.008 NAPesticide NDNDHeptachlor epoxide ug/L-0.007-0.007 NAPesticide NDNDLinuron ug/L-0.20-0.20 NAPesticide NDNDMalathion ug/L0.0720.076 5%Pesticide DNQDNQMethamidophos ug/L-0.08-0.08 NAPesticide NDND
Tuesday, October 18, 2011 Page 3 of 10
Event = Event Sample Results FD = Field Duplicate Sample Results RPD = Relative percent difference
Prosecution Team Response to Comments - Attachment B
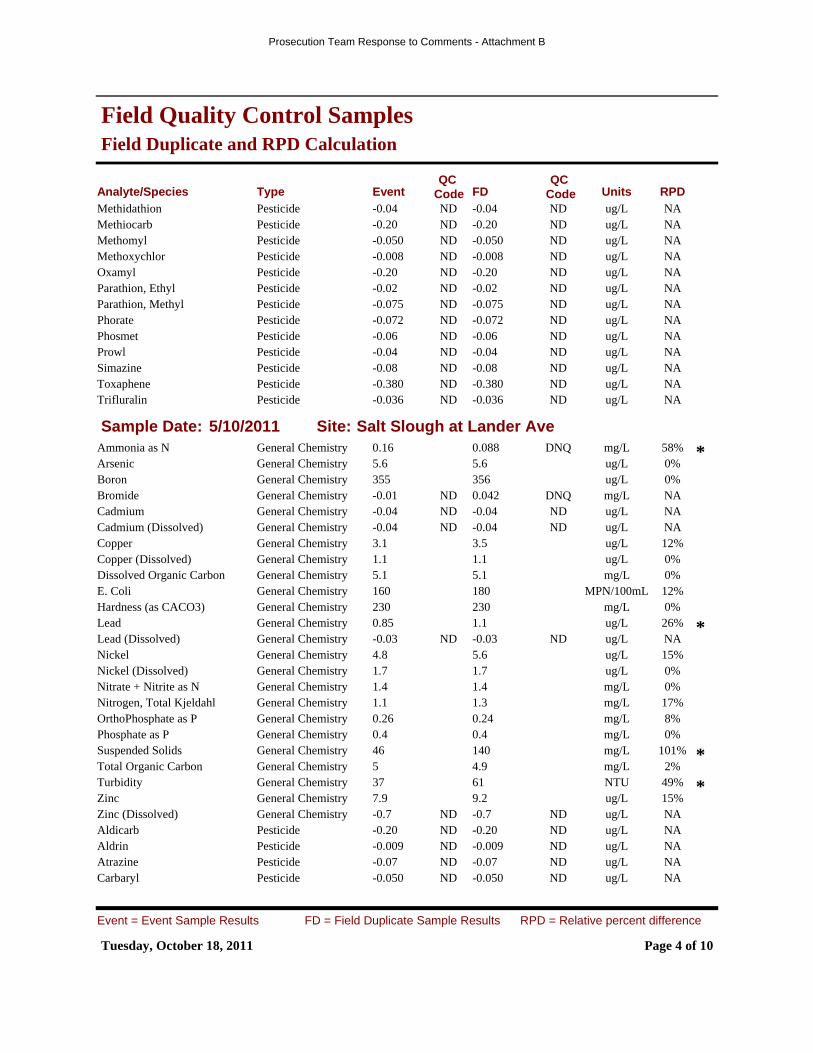
Field Duplicate and RPD Calculation
Field Quality Control Samples
Analyte/Species Units RPDFDEventTypeQC
CodeQC
CodeMethidathion ug/L-0.04-0.04 NAPesticide NDNDMethiocarb ug/L-0.20-0.20 NAPesticide NDNDMethomyl ug/L-0.050-0.050 NAPesticide NDNDMethoxychlor ug/L-0.008-0.008 NAPesticide NDNDOxamyl ug/L-0.20-0.20 NAPesticide NDNDParathion, Ethyl ug/L-0.02-0.02 NAPesticide NDNDParathion, Methyl ug/L-0.075-0.075 NAPesticide NDNDPhorate ug/L-0.072-0.072 NAPesticide NDNDPhosmet ug/L-0.06-0.06 NAPesticide NDNDProwl ug/L-0.04-0.04 NAPesticide NDNDSimazine ug/L-0.08-0.08 NAPesticide NDNDToxaphene ug/L-0.380-0.380 NAPesticide NDNDTrifluralin ug/L-0.036-0.036 NAPesticide NDND
Sample Date: 5/10/2011 Site: Salt Slough at Lander AveAmmonia as N mg/L0.0880.16 58% *General Chemistry DNQArsenic ug/L5.65.6 0%General ChemistryBoron ug/L356355 0%General ChemistryBromide mg/L0.042-0.01 NAGeneral Chemistry DNQNDCadmium ug/L-0.04-0.04 NAGeneral Chemistry NDNDCadmium (Dissolved) ug/L-0.04-0.04 NAGeneral Chemistry NDNDCopper ug/L3.53.1 12%General ChemistryCopper (Dissolved) ug/L1.11.1 0%General ChemistryDissolved Organic Carbon mg/L5.15.1 0%General ChemistryE. Coli MPN/100mL180160 12%General ChemistryHardness (as CACO3) mg/L230230 0%General ChemistryLead ug/L1.10.85 26% *General ChemistryLead (Dissolved) ug/L-0.03-0.03 NAGeneral Chemistry NDNDNickel ug/L5.64.8 15%General ChemistryNickel (Dissolved) ug/L1.71.7 0%General ChemistryNitrate + Nitrite as N mg/L1.41.4 0%General ChemistryNitrogen, Total Kjeldahl mg/L1.31.1 17%General ChemistryOrthoPhosphate as P mg/L0.240.26 8%General ChemistryPhosphate as P mg/L0.40.4 0%General ChemistrySuspended Solids mg/L14046 101% *General ChemistryTotal Organic Carbon mg/L4.95 2%General ChemistryTurbidity NTU6137 49% *General ChemistryZinc ug/L9.27.9 15%General ChemistryZinc (Dissolved) ug/L-0.7-0.7 NAGeneral Chemistry NDNDAldicarb ug/L-0.20-0.20 NAPesticide NDNDAldrin ug/L-0.009-0.009 NAPesticide NDNDAtrazine ug/L-0.07-0.07 NAPesticide NDNDCarbaryl ug/L-0.050-0.050 NAPesticide NDND
Tuesday, October 18, 2011 Page 4 of 10
Event = Event Sample Results FD = Field Duplicate Sample Results RPD = Relative percent difference
Prosecution Team Response to Comments - Attachment B
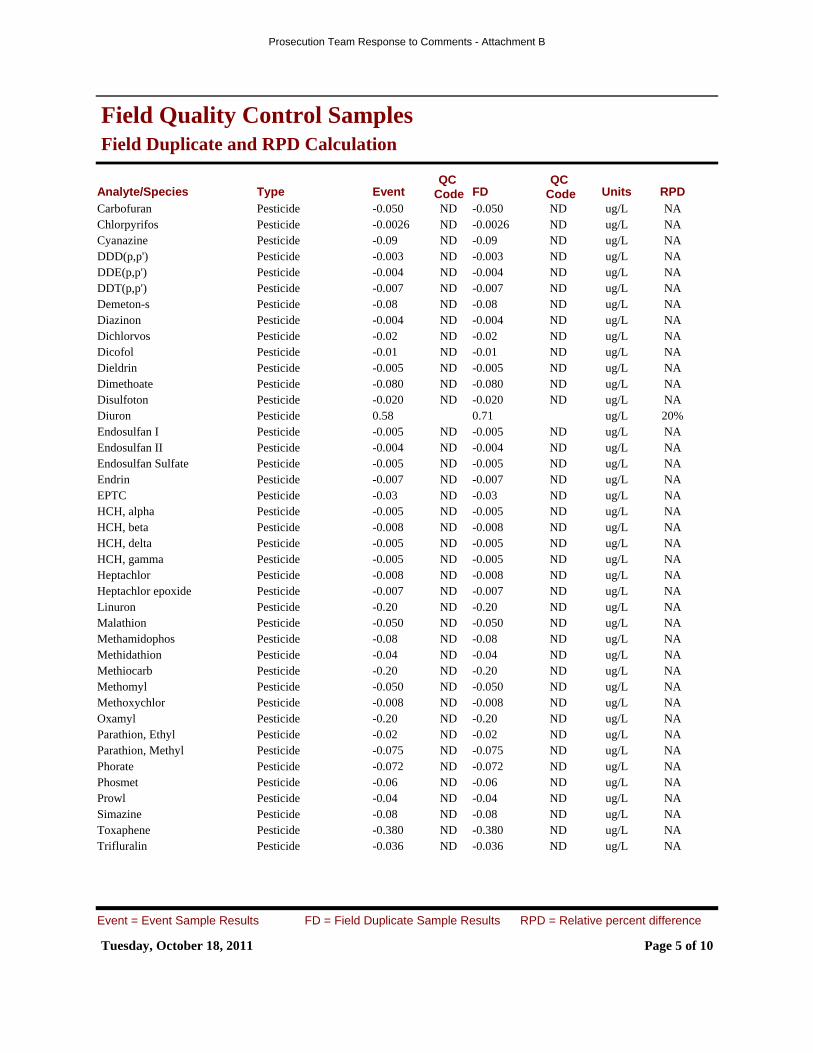
Field Duplicate and RPD Calculation
Field Quality Control Samples
Analyte/Species Units RPDFDEventTypeQC
CodeQC
CodeCarbofuran ug/L-0.050-0.050 NAPesticide NDNDChlorpyrifos ug/L-0.0026-0.0026 NAPesticide NDNDCyanazine ug/L-0.09-0.09 NAPesticide NDNDDDD(p,p') ug/L-0.003-0.003 NAPesticide NDNDDDE(p,p') ug/L-0.004-0.004 NAPesticide NDNDDDT(p,p') ug/L-0.007-0.007 NAPesticide NDNDDemeton-s ug/L-0.08-0.08 NAPesticide NDNDDiazinon ug/L-0.004-0.004 NAPesticide NDNDDichlorvos ug/L-0.02-0.02 NAPesticide NDNDDicofol ug/L-0.01-0.01 NAPesticide NDNDDieldrin ug/L-0.005-0.005 NAPesticide NDNDDimethoate ug/L-0.080-0.080 NAPesticide NDNDDisulfoton ug/L-0.020-0.020 NAPesticide NDNDDiuron ug/L0.710.58 20%PesticideEndosulfan I ug/L-0.005-0.005 NAPesticide NDNDEndosulfan II ug/L-0.004-0.004 NAPesticide NDNDEndosulfan Sulfate ug/L-0.005-0.005 NAPesticide NDNDEndrin ug/L-0.007-0.007 NAPesticide NDNDEPTC ug/L-0.03-0.03 NAPesticide NDNDHCH, alpha ug/L-0.005-0.005 NAPesticide NDNDHCH, beta ug/L-0.008-0.008 NAPesticide NDNDHCH, delta ug/L-0.005-0.005 NAPesticide NDNDHCH, gamma ug/L-0.005-0.005 NAPesticide NDNDHeptachlor ug/L-0.008-0.008 NAPesticide NDNDHeptachlor epoxide ug/L-0.007-0.007 NAPesticide NDNDLinuron ug/L-0.20-0.20 NAPesticide NDNDMalathion ug/L-0.050-0.050 NAPesticide NDNDMethamidophos ug/L-0.08-0.08 NAPesticide NDNDMethidathion ug/L-0.04-0.04 NAPesticide NDNDMethiocarb ug/L-0.20-0.20 NAPesticide NDNDMethomyl ug/L-0.050-0.050 NAPesticide NDNDMethoxychlor ug/L-0.008-0.008 NAPesticide NDNDOxamyl ug/L-0.20-0.20 NAPesticide NDNDParathion, Ethyl ug/L-0.02-0.02 NAPesticide NDNDParathion, Methyl ug/L-0.075-0.075 NAPesticide NDNDPhorate ug/L-0.072-0.072 NAPesticide NDNDPhosmet ug/L-0.06-0.06 NAPesticide NDNDProwl ug/L-0.04-0.04 NAPesticide NDNDSimazine ug/L-0.08-0.08 NAPesticide NDNDToxaphene ug/L-0.380-0.380 NAPesticide NDNDTrifluralin ug/L-0.036-0.036 NAPesticide NDND
Tuesday, October 18, 2011 Page 5 of 10
Event = Event Sample Results FD = Field Duplicate Sample Results RPD = Relative percent difference
Prosecution Team Response to Comments - Attachment B
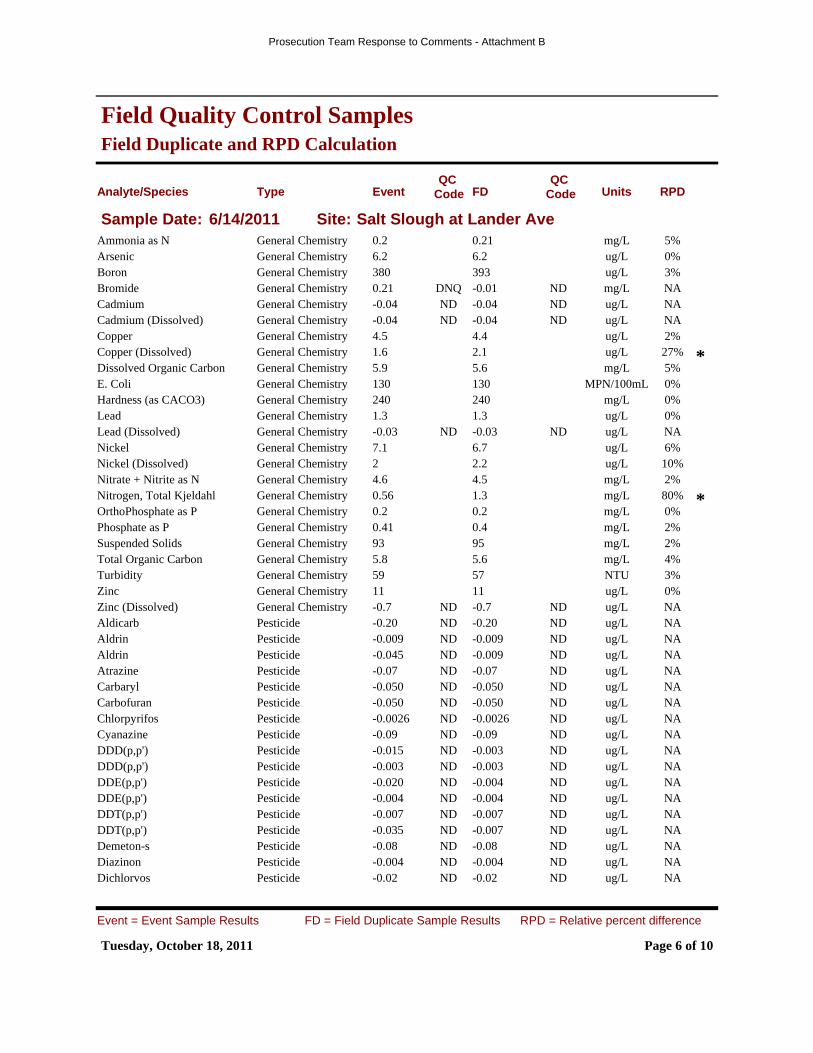
Field Duplicate and RPD Calculation
Field Quality Control Samples
Analyte/Species Units RPDFDEventTypeQC
CodeQC
Code
Sample Date: 6/14/2011 Site: Salt Slough at Lander AveAmmonia as N mg/L0.210.2 5%General ChemistryArsenic ug/L6.26.2 0%General ChemistryBoron ug/L393380 3%General ChemistryBromide mg/L-0.010.21 NAGeneral Chemistry NDDNQCadmium ug/L-0.04-0.04 NAGeneral Chemistry NDNDCadmium (Dissolved) ug/L-0.04-0.04 NAGeneral Chemistry NDNDCopper ug/L4.44.5 2%General ChemistryCopper (Dissolved) ug/L2.11.6 27% *General ChemistryDissolved Organic Carbon mg/L5.65.9 5%General ChemistryE. Coli MPN/100mL130130 0%General ChemistryHardness (as CACO3) mg/L240240 0%General ChemistryLead ug/L1.31.3 0%General ChemistryLead (Dissolved) ug/L-0.03-0.03 NAGeneral Chemistry NDNDNickel ug/L6.77.1 6%General ChemistryNickel (Dissolved) ug/L2.22 10%General ChemistryNitrate + Nitrite as N mg/L4.54.6 2%General ChemistryNitrogen, Total Kjeldahl mg/L1.30.56 80% *General ChemistryOrthoPhosphate as P mg/L0.20.2 0%General ChemistryPhosphate as P mg/L0.40.41 2%General ChemistrySuspended Solids mg/L9593 2%General ChemistryTotal Organic Carbon mg/L5.65.8 4%General ChemistryTurbidity NTU5759 3%General ChemistryZinc ug/L1111 0%General ChemistryZinc (Dissolved) ug/L-0.7-0.7 NAGeneral Chemistry NDNDAldicarb ug/L-0.20-0.20 NAPesticide NDNDAldrin ug/L-0.009-0.009 NAPesticide NDNDAldrin ug/L-0.009-0.045 NAPesticide NDNDAtrazine ug/L-0.07-0.07 NAPesticide NDNDCarbaryl ug/L-0.050-0.050 NAPesticide NDNDCarbofuran ug/L-0.050-0.050 NAPesticide NDNDChlorpyrifos ug/L-0.0026-0.0026 NAPesticide NDNDCyanazine ug/L-0.09-0.09 NAPesticide NDNDDDD(p,p') ug/L-0.003-0.015 NAPesticide NDNDDDD(p,p') ug/L-0.003-0.003 NAPesticide NDNDDDE(p,p') ug/L-0.004-0.020 NAPesticide NDNDDDE(p,p') ug/L-0.004-0.004 NAPesticide NDNDDDT(p,p') ug/L-0.007-0.007 NAPesticide NDNDDDT(p,p') ug/L-0.007-0.035 NAPesticide NDNDDemeton-s ug/L-0.08-0.08 NAPesticide NDNDDiazinon ug/L-0.004-0.004 NAPesticide NDNDDichlorvos ug/L-0.02-0.02 NAPesticide NDND
Tuesday, October 18, 2011 Page 6 of 10
Event = Event Sample Results FD = Field Duplicate Sample Results RPD = Relative percent difference
Prosecution Team Response to Comments - Attachment B
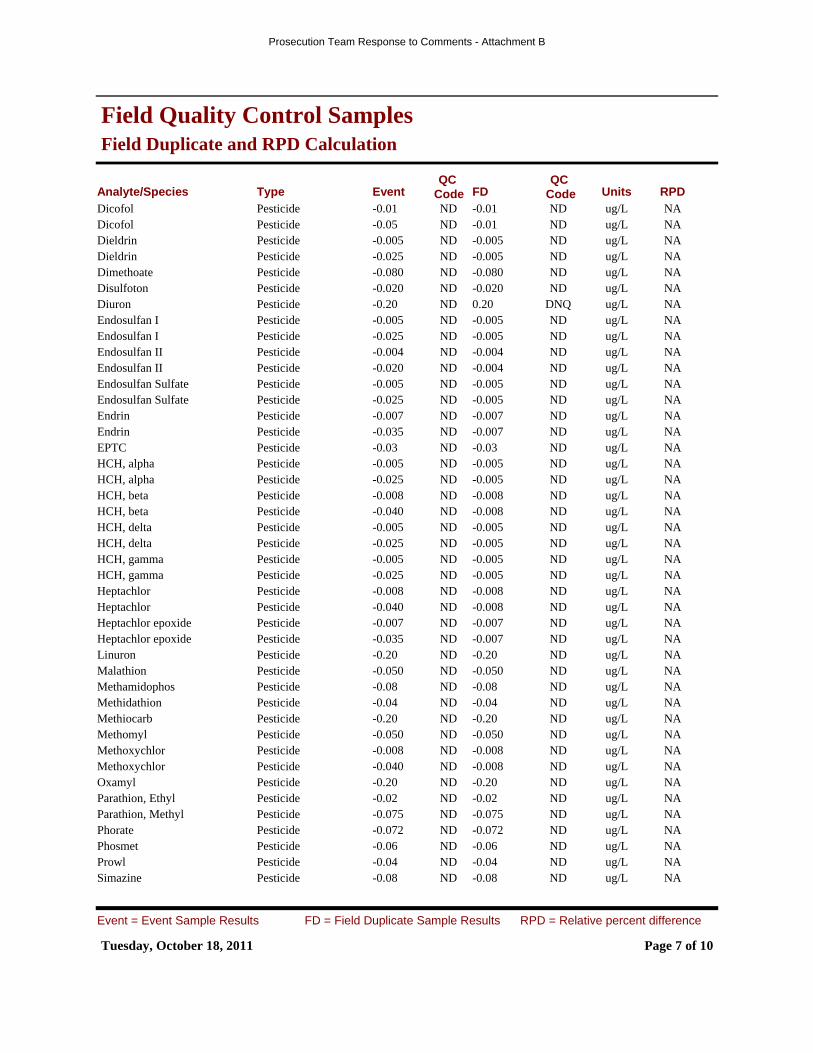
Field Duplicate and RPD Calculation
Field Quality Control Samples
Analyte/Species Units RPDFDEventTypeQC
CodeQC
CodeDicofol ug/L-0.01-0.01 NAPesticide NDNDDicofol ug/L-0.01-0.05 NAPesticide NDNDDieldrin ug/L-0.005-0.005 NAPesticide NDNDDieldrin ug/L-0.005-0.025 NAPesticide NDNDDimethoate ug/L-0.080-0.080 NAPesticide NDNDDisulfoton ug/L-0.020-0.020 NAPesticide NDNDDiuron ug/L0.20-0.20 NAPesticide DNQNDEndosulfan I ug/L-0.005-0.005 NAPesticide NDNDEndosulfan I ug/L-0.005-0.025 NAPesticide NDNDEndosulfan II ug/L-0.004-0.004 NAPesticide NDNDEndosulfan II ug/L-0.004-0.020 NAPesticide NDNDEndosulfan Sulfate ug/L-0.005-0.005 NAPesticide NDNDEndosulfan Sulfate ug/L-0.005-0.025 NAPesticide NDNDEndrin ug/L-0.007-0.007 NAPesticide NDNDEndrin ug/L-0.007-0.035 NAPesticide NDNDEPTC ug/L-0.03-0.03 NAPesticide NDNDHCH, alpha ug/L-0.005-0.005 NAPesticide NDNDHCH, alpha ug/L-0.005-0.025 NAPesticide NDNDHCH, beta ug/L-0.008-0.008 NAPesticide NDNDHCH, beta ug/L-0.008-0.040 NAPesticide NDNDHCH, delta ug/L-0.005-0.005 NAPesticide NDNDHCH, delta ug/L-0.005-0.025 NAPesticide NDNDHCH, gamma ug/L-0.005-0.005 NAPesticide NDNDHCH, gamma ug/L-0.005-0.025 NAPesticide NDNDHeptachlor ug/L-0.008-0.008 NAPesticide NDNDHeptachlor ug/L-0.008-0.040 NAPesticide NDNDHeptachlor epoxide ug/L-0.007-0.007 NAPesticide NDNDHeptachlor epoxide ug/L-0.007-0.035 NAPesticide NDNDLinuron ug/L-0.20-0.20 NAPesticide NDNDMalathion ug/L-0.050-0.050 NAPesticide NDNDMethamidophos ug/L-0.08-0.08 NAPesticide NDNDMethidathion ug/L-0.04-0.04 NAPesticide NDNDMethiocarb ug/L-0.20-0.20 NAPesticide NDNDMethomyl ug/L-0.050-0.050 NAPesticide NDNDMethoxychlor ug/L-0.008-0.008 NAPesticide NDNDMethoxychlor ug/L-0.008-0.040 NAPesticide NDNDOxamyl ug/L-0.20-0.20 NAPesticide NDNDParathion, Ethyl ug/L-0.02-0.02 NAPesticide NDNDParathion, Methyl ug/L-0.075-0.075 NAPesticide NDNDPhorate ug/L-0.072-0.072 NAPesticide NDNDPhosmet ug/L-0.06-0.06 NAPesticide NDNDProwl ug/L-0.04-0.04 NAPesticide NDNDSimazine ug/L-0.08-0.08 NAPesticide NDND
Tuesday, October 18, 2011 Page 7 of 10
Event = Event Sample Results FD = Field Duplicate Sample Results RPD = Relative percent difference
Prosecution Team Response to Comments - Attachment B
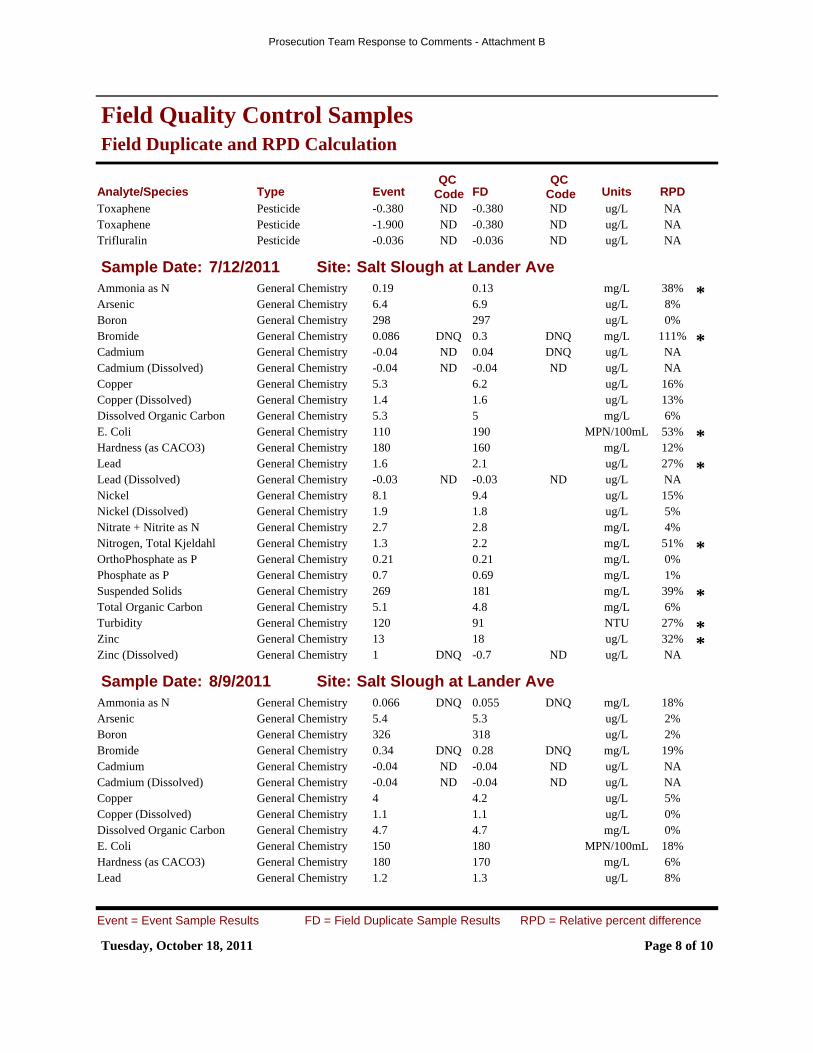
Field Duplicate and RPD Calculation
Field Quality Control Samples
Analyte/Species Units RPDFDEventTypeQC
CodeQC
CodeToxaphene ug/L-0.380-0.380 NAPesticide NDNDToxaphene ug/L-0.380-1.900 NAPesticide NDNDTrifluralin ug/L-0.036-0.036 NAPesticide NDND
Sample Date: 7/12/2011 Site: Salt Slough at Lander AveAmmonia as N mg/L0.130.19 38% *General ChemistryArsenic ug/L6.96.4 8%General ChemistryBoron ug/L297298 0%General ChemistryBromide mg/L0.30.086 111% *General Chemistry DNQDNQCadmium ug/L0.04-0.04 NAGeneral Chemistry DNQNDCadmium (Dissolved) ug/L-0.04-0.04 NAGeneral Chemistry NDNDCopper ug/L6.25.3 16%General ChemistryCopper (Dissolved) ug/L1.61.4 13%General ChemistryDissolved Organic Carbon mg/L55.3 6%General ChemistryE. Coli MPN/100mL190110 53% *General ChemistryHardness (as CACO3) mg/L160180 12%General ChemistryLead ug/L2.11.6 27% *General ChemistryLead (Dissolved) ug/L-0.03-0.03 NAGeneral Chemistry NDNDNickel ug/L9.48.1 15%General ChemistryNickel (Dissolved) ug/L1.81.9 5%General ChemistryNitrate + Nitrite as N mg/L2.82.7 4%General ChemistryNitrogen, Total Kjeldahl mg/L2.21.3 51% *General ChemistryOrthoPhosphate as P mg/L0.210.21 0%General ChemistryPhosphate as P mg/L0.690.7 1%General ChemistrySuspended Solids mg/L181269 39% *General ChemistryTotal Organic Carbon mg/L4.85.1 6%General ChemistryTurbidity NTU91120 27% *General ChemistryZinc ug/L1813 32% *General ChemistryZinc (Dissolved) ug/L-0.71 NAGeneral Chemistry NDDNQ
Sample Date: 8/9/2011 Site: Salt Slough at Lander AveAmmonia as N mg/L0.0550.066 18%General Chemistry DNQDNQArsenic ug/L5.35.4 2%General ChemistryBoron ug/L318326 2%General ChemistryBromide mg/L0.280.34 19%General Chemistry DNQDNQCadmium ug/L-0.04-0.04 NAGeneral Chemistry NDNDCadmium (Dissolved) ug/L-0.04-0.04 NAGeneral Chemistry NDNDCopper ug/L4.24 5%General ChemistryCopper (Dissolved) ug/L1.11.1 0%General ChemistryDissolved Organic Carbon mg/L4.74.7 0%General ChemistryE. Coli MPN/100mL180150 18%General ChemistryHardness (as CACO3) mg/L170180 6%General ChemistryLead ug/L1.31.2 8%General Chemistry
Tuesday, October 18, 2011 Page 8 of 10
Event = Event Sample Results FD = Field Duplicate Sample Results RPD = Relative percent difference
Prosecution Team Response to Comments - Attachment B
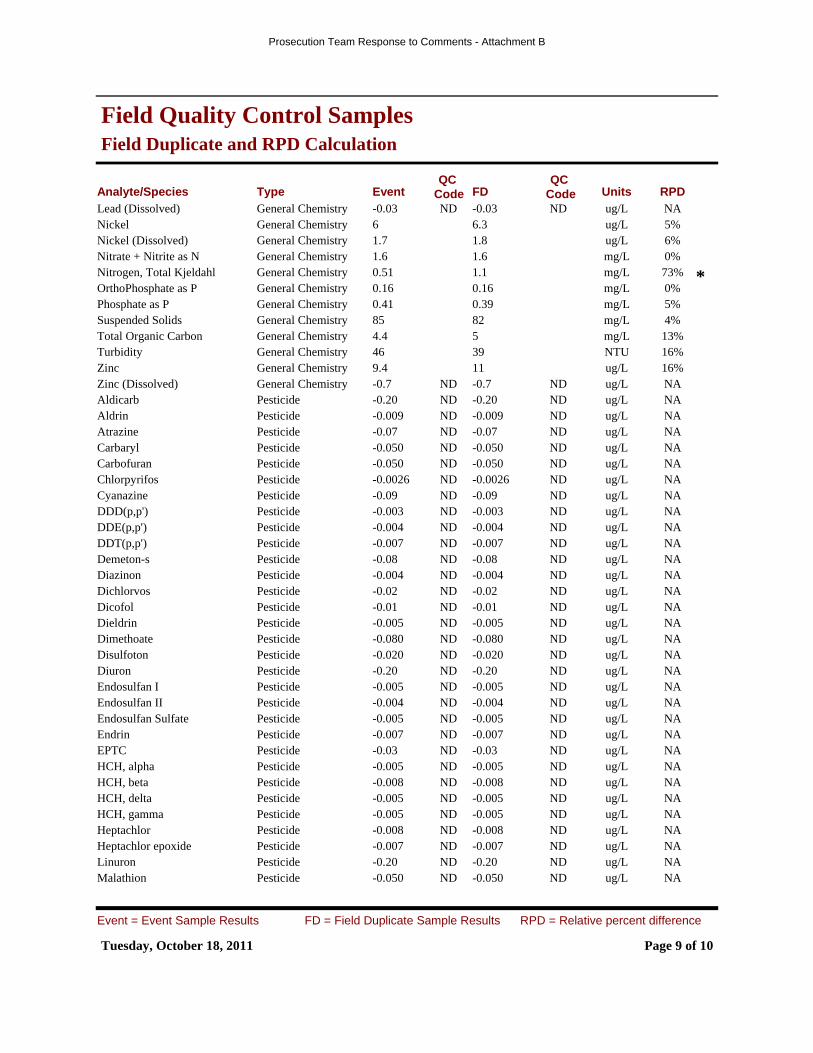
Field Duplicate and RPD Calculation
Field Quality Control Samples
Analyte/Species Units RPDFDEventTypeQC
CodeQC
CodeLead (Dissolved) ug/L-0.03-0.03 NAGeneral Chemistry NDNDNickel ug/L6.36 5%General ChemistryNickel (Dissolved) ug/L1.81.7 6%General ChemistryNitrate + Nitrite as N mg/L1.61.6 0%General ChemistryNitrogen, Total Kjeldahl mg/L1.10.51 73% *General ChemistryOrthoPhosphate as P mg/L0.160.16 0%General ChemistryPhosphate as P mg/L0.390.41 5%General ChemistrySuspended Solids mg/L8285 4%General ChemistryTotal Organic Carbon mg/L54.4 13%General ChemistryTurbidity NTU3946 16%General ChemistryZinc ug/L119.4 16%General ChemistryZinc (Dissolved) ug/L-0.7-0.7 NAGeneral Chemistry NDNDAldicarb ug/L-0.20-0.20 NAPesticide NDNDAldrin ug/L-0.009-0.009 NAPesticide NDNDAtrazine ug/L-0.07-0.07 NAPesticide NDNDCarbaryl ug/L-0.050-0.050 NAPesticide NDNDCarbofuran ug/L-0.050-0.050 NAPesticide NDNDChlorpyrifos ug/L-0.0026-0.0026 NAPesticide NDNDCyanazine ug/L-0.09-0.09 NAPesticide NDNDDDD(p,p') ug/L-0.003-0.003 NAPesticide NDNDDDE(p,p') ug/L-0.004-0.004 NAPesticide NDNDDDT(p,p') ug/L-0.007-0.007 NAPesticide NDNDDemeton-s ug/L-0.08-0.08 NAPesticide NDNDDiazinon ug/L-0.004-0.004 NAPesticide NDNDDichlorvos ug/L-0.02-0.02 NAPesticide NDNDDicofol ug/L-0.01-0.01 NAPesticide NDNDDieldrin ug/L-0.005-0.005 NAPesticide NDNDDimethoate ug/L-0.080-0.080 NAPesticide NDNDDisulfoton ug/L-0.020-0.020 NAPesticide NDNDDiuron ug/L-0.20-0.20 NAPesticide NDNDEndosulfan I ug/L-0.005-0.005 NAPesticide NDNDEndosulfan II ug/L-0.004-0.004 NAPesticide NDNDEndosulfan Sulfate ug/L-0.005-0.005 NAPesticide NDNDEndrin ug/L-0.007-0.007 NAPesticide NDNDEPTC ug/L-0.03-0.03 NAPesticide NDNDHCH, alpha ug/L-0.005-0.005 NAPesticide NDNDHCH, beta ug/L-0.008-0.008 NAPesticide NDNDHCH, delta ug/L-0.005-0.005 NAPesticide NDNDHCH, gamma ug/L-0.005-0.005 NAPesticide NDNDHeptachlor ug/L-0.008-0.008 NAPesticide NDNDHeptachlor epoxide ug/L-0.007-0.007 NAPesticide NDNDLinuron ug/L-0.20-0.20 NAPesticide NDNDMalathion ug/L-0.050-0.050 NAPesticide NDND
Tuesday, October 18, 2011 Page 9 of 10
Event = Event Sample Results FD = Field Duplicate Sample Results RPD = Relative percent difference
Prosecution Team Response to Comments - Attachment B

Field Duplicate and RPD Calculation
Field Quality Control Samples
Analyte/Species Units RPDFDEventTypeQC
CodeQC
CodeMethamidophos ug/L-0.08-0.08 NAPesticide NDNDMethidathion ug/L-0.04-0.04 NAPesticide NDNDMethiocarb ug/L-0.20-0.20 NAPesticide NDNDMethomyl ug/L0.160.14 13%Pesticide ==Methoxychlor ug/L-0.008-0.008 NAPesticide NDNDOxamyl ug/L-0.20-0.20 NAPesticide NDNDParathion, Ethyl ug/L-0.02-0.02 NAPesticide NDNDParathion, Methyl ug/L-0.075-0.075 NAPesticide NDNDPhorate ug/L-0.072-0.072 NAPesticide NDNDPhosmet ug/L-0.06-0.06 NAPesticide NDNDProwl ug/L-0.04-0.04 NAPesticide NDNDSimazine ug/L-0.08-0.08 NAPesticide NDNDToxaphene ug/L-0.380-0.380 NAPesticide NDNDTrifluralin ug/L-0.036-0.036 NAPesticide NDND
Tuesday, October 18, 2011 Page 10 of 10
Event = Event Sample Results FD = Field Duplicate Sample Results RPD = Relative percent difference
Prosecution Team Response to Comments - Attachment B
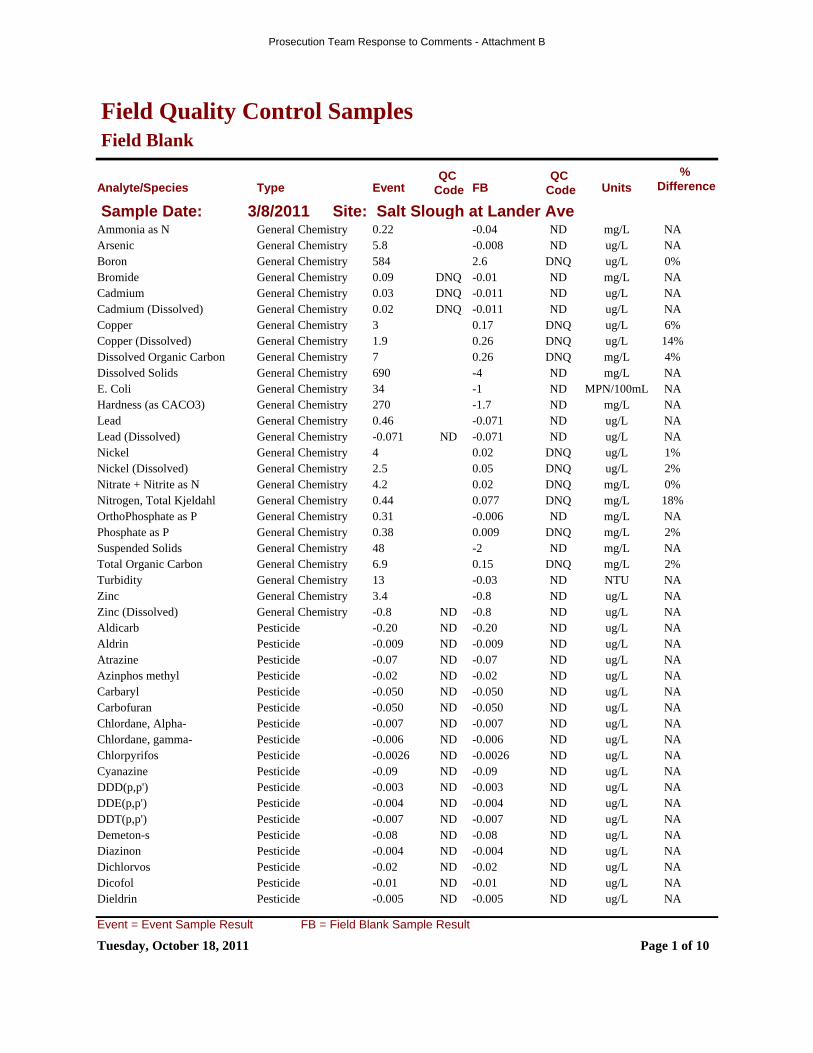
Field Blank
Field Quality Control Samples
Analyte/Species Units%
DifferenceFBEventTypeQC
CodeQC
Code
Sample Date: 3/8/2011 Site: Salt Slough at Lander AveAmmonia as N mg/L-0.040.22 NAGeneral Chemistry NDArsenic ug/L-0.0085.8 NAGeneral Chemistry NDBoron ug/L2.6584 0%General Chemistry DNQBromide mg/L-0.010.09 NAGeneral Chemistry NDDNQCadmium ug/L-0.0110.03 NAGeneral Chemistry NDDNQCadmium (Dissolved) ug/L-0.0110.02 NAGeneral Chemistry NDDNQCopper ug/L0.173 6%General Chemistry DNQCopper (Dissolved) ug/L0.261.9 14%General Chemistry DNQDissolved Organic Carbon mg/L0.267 4%General Chemistry DNQDissolved Solids mg/L-4690 NAGeneral Chemistry NDE. Coli MPN/100mL-134 NAGeneral Chemistry NDHardness (as CACO3) mg/L-1.7270 NAGeneral Chemistry NDLead ug/L-0.0710.46 NAGeneral Chemistry NDLead (Dissolved) ug/L-0.071-0.071 NAGeneral Chemistry NDNDNickel ug/L0.024 1%General Chemistry DNQNickel (Dissolved) ug/L0.052.5 2%General Chemistry DNQNitrate + Nitrite as N mg/L0.024.2 0%General Chemistry DNQNitrogen, Total Kjeldahl mg/L0.0770.44 18%General Chemistry DNQOrthoPhosphate as P mg/L-0.0060.31 NAGeneral Chemistry NDPhosphate as P mg/L0.0090.38 2%General Chemistry DNQSuspended Solids mg/L-248 NAGeneral Chemistry NDTotal Organic Carbon mg/L0.156.9 2%General Chemistry DNQTurbidity NTU-0.0313 NAGeneral Chemistry NDZinc ug/L-0.83.4 NAGeneral Chemistry NDZinc (Dissolved) ug/L-0.8-0.8 NAGeneral Chemistry NDNDAldicarb ug/L-0.20-0.20 NAPesticide NDNDAldrin ug/L-0.009-0.009 NAPesticide NDNDAtrazine ug/L-0.07-0.07 NAPesticide NDNDAzinphos methyl ug/L-0.02-0.02 NAPesticide NDNDCarbaryl ug/L-0.050-0.050 NAPesticide NDNDCarbofuran ug/L-0.050-0.050 NAPesticide NDNDChlordane, Alpha- ug/L-0.007-0.007 NAPesticide NDNDChlordane, gamma- ug/L-0.006-0.006 NAPesticide NDNDChlorpyrifos ug/L-0.0026-0.0026 NAPesticide NDNDCyanazine ug/L-0.09-0.09 NAPesticide NDNDDDD(p,p') ug/L-0.003-0.003 NAPesticide NDNDDDE(p,p') ug/L-0.004-0.004 NAPesticide NDNDDDT(p,p') ug/L-0.007-0.007 NAPesticide NDNDDemeton-s ug/L-0.08-0.08 NAPesticide NDNDDiazinon ug/L-0.004-0.004 NAPesticide NDNDDichlorvos ug/L-0.02-0.02 NAPesticide NDNDDicofol ug/L-0.01-0.01 NAPesticide NDNDDieldrin ug/L-0.005-0.005 NAPesticide NDND
Tuesday, October 18, 2011 Page 1 of 10
Event = Event Sample Result FB = Field Blank Sample Result
Prosecution Team Response to Comments - Attachment B

Field Blank
Field Quality Control Samples
Analyte/Species Units%
DifferenceFBEventTypeQC
CodeQC
CodeDimethoate ug/L-0.080-0.080 NAPesticide NDNDDisulfoton ug/L-0.020-0.020 NAPesticide NDNDDiuron ug/L-0.203.5 NAPesticide NDEndosulfan I ug/L-0.005-0.005 NAPesticide NDNDEndosulfan II ug/L-0.004-0.004 NAPesticide NDNDEndosulfan Sulfate ug/L-0.005-0.005 NAPesticide NDNDEndrin ug/L-0.007-0.007 NAPesticide NDNDEPTC ug/L-0.03-0.03 NAPesticide NDNDHCH, alpha ug/L-0.005-0.005 NAPesticide NDNDHCH, beta ug/L-0.008-0.008 NAPesticide NDNDHCH, delta ug/L-0.005-0.005 NAPesticide NDNDHCH, gamma ug/L-0.005-0.005 NAPesticide NDNDHeptachlor ug/L-0.008-0.008 NAPesticide NDNDHeptachlor epoxide ug/L-0.007-0.007 NAPesticide NDNDLinuron ug/L-0.20-0.20 NAPesticide NDNDMalathion ug/L-0.050-0.050 NAPesticide NDNDMethamidophos ug/L-0.08-0.08 NAPesticide NDNDMethidathion ug/L-0.04-0.04 NAPesticide NDNDMethiocarb ug/L-0.20-0.20 NAPesticide NDNDMethomyl ug/L-0.050-0.050 NAPesticide NDNDMethoxychlor ug/L-0.008-0.008 NAPesticide NDNDOxamyl ug/L-0.20-0.20 NAPesticide NDNDParathion, Ethyl ug/L-0.02-0.02 NAPesticide NDNDParathion, Methyl ug/L-0.075-0.075 NAPesticide NDNDPhorate ug/L-0.072-0.072 NAPesticide NDNDPhosmet ug/L-0.06-0.06 NAPesticide NDNDProwl ug/L-0.040.20 NAPesticide NDSimazine ug/L-0.08-0.08 NAPesticide NDNDToxaphene ug/L-0.380-0.380 NAPesticide NDNDTrifluralin ug/L-0.036-0.036 NAPesticide NDND
Sample Date: 4/12/2011 Site: Salt Slough at Lander AveAmmonia as N mg/L-0.040.19 NAGeneral Chemistry NDArsenic ug/L-0.024.8 NAGeneral Chemistry NDBoron ug/L2.1829 0%General Chemistry DNQBromide mg/L-0.01-0.01 NAGeneral Chemistry NDNDCadmium ug/L-0.04-0.04 NAGeneral Chemistry NDNDCadmium (Dissolved) ug/L-0.04-0.04 NAGeneral Chemistry NDNDCopper ug/L-0.072.3 NAGeneral Chemistry NDCopper (Dissolved) ug/L-0.070.85 NAGeneral Chemistry NDDissolved Organic Carbon mg/L0.287.7 4%General Chemistry DNQDissolved Solids mg/L-41000 NAGeneral Chemistry NDE. Coli MPN/100mL-1200 NAGeneral Chemistry NDHardness (as CACO3) mg/L-1.7360 NAGeneral Chemistry NDLead ug/L-0.030.65 NAGeneral Chemistry ND
Tuesday, October 18, 2011 Page 2 of 10
Event = Event Sample Result FB = Field Blank Sample Result
Prosecution Team Response to Comments - Attachment B
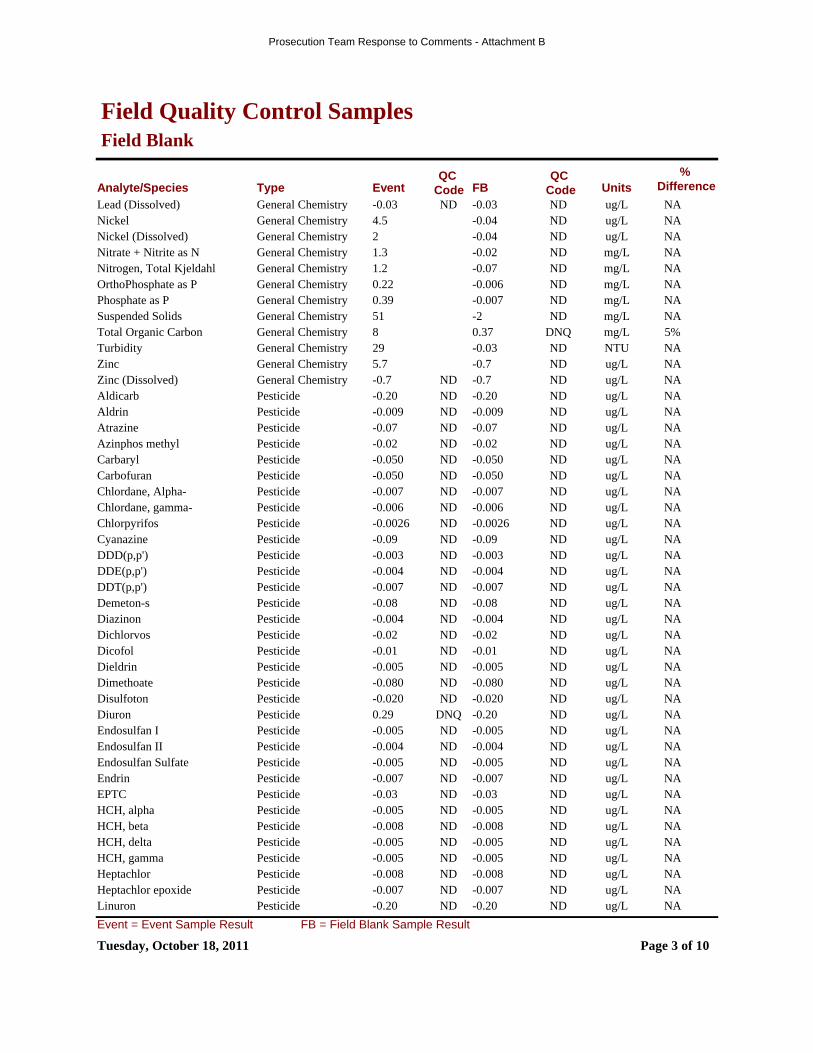
Field Blank
Field Quality Control Samples
Analyte/Species Units%
DifferenceFBEventTypeQC
CodeQC
CodeLead (Dissolved) ug/L-0.03-0.03 NAGeneral Chemistry NDNDNickel ug/L-0.044.5 NAGeneral Chemistry NDNickel (Dissolved) ug/L-0.042 NAGeneral Chemistry NDNitrate + Nitrite as N mg/L-0.021.3 NAGeneral Chemistry NDNitrogen, Total Kjeldahl mg/L-0.071.2 NAGeneral Chemistry NDOrthoPhosphate as P mg/L-0.0060.22 NAGeneral Chemistry NDPhosphate as P mg/L-0.0070.39 NAGeneral Chemistry NDSuspended Solids mg/L-251 NAGeneral Chemistry NDTotal Organic Carbon mg/L0.378 5%General Chemistry DNQTurbidity NTU-0.0329 NAGeneral Chemistry NDZinc ug/L-0.75.7 NAGeneral Chemistry NDZinc (Dissolved) ug/L-0.7-0.7 NAGeneral Chemistry NDNDAldicarb ug/L-0.20-0.20 NAPesticide NDNDAldrin ug/L-0.009-0.009 NAPesticide NDNDAtrazine ug/L-0.07-0.07 NAPesticide NDNDAzinphos methyl ug/L-0.02-0.02 NAPesticide NDNDCarbaryl ug/L-0.050-0.050 NAPesticide NDNDCarbofuran ug/L-0.050-0.050 NAPesticide NDNDChlordane, Alpha- ug/L-0.007-0.007 NAPesticide NDNDChlordane, gamma- ug/L-0.006-0.006 NAPesticide NDNDChlorpyrifos ug/L-0.0026-0.0026 NAPesticide NDNDCyanazine ug/L-0.09-0.09 NAPesticide NDNDDDD(p,p') ug/L-0.003-0.003 NAPesticide NDNDDDE(p,p') ug/L-0.004-0.004 NAPesticide NDNDDDT(p,p') ug/L-0.007-0.007 NAPesticide NDNDDemeton-s ug/L-0.08-0.08 NAPesticide NDNDDiazinon ug/L-0.004-0.004 NAPesticide NDNDDichlorvos ug/L-0.02-0.02 NAPesticide NDNDDicofol ug/L-0.01-0.01 NAPesticide NDNDDieldrin ug/L-0.005-0.005 NAPesticide NDNDDimethoate ug/L-0.080-0.080 NAPesticide NDNDDisulfoton ug/L-0.020-0.020 NAPesticide NDNDDiuron ug/L-0.200.29 NAPesticide NDDNQEndosulfan I ug/L-0.005-0.005 NAPesticide NDNDEndosulfan II ug/L-0.004-0.004 NAPesticide NDNDEndosulfan Sulfate ug/L-0.005-0.005 NAPesticide NDNDEndrin ug/L-0.007-0.007 NAPesticide NDNDEPTC ug/L-0.03-0.03 NAPesticide NDNDHCH, alpha ug/L-0.005-0.005 NAPesticide NDNDHCH, beta ug/L-0.008-0.008 NAPesticide NDNDHCH, delta ug/L-0.005-0.005 NAPesticide NDNDHCH, gamma ug/L-0.005-0.005 NAPesticide NDNDHeptachlor ug/L-0.008-0.008 NAPesticide NDNDHeptachlor epoxide ug/L-0.007-0.007 NAPesticide NDNDLinuron ug/L-0.20-0.20 NAPesticide NDND
Tuesday, October 18, 2011 Page 3 of 10
Event = Event Sample Result FB = Field Blank Sample Result
Prosecution Team Response to Comments - Attachment B
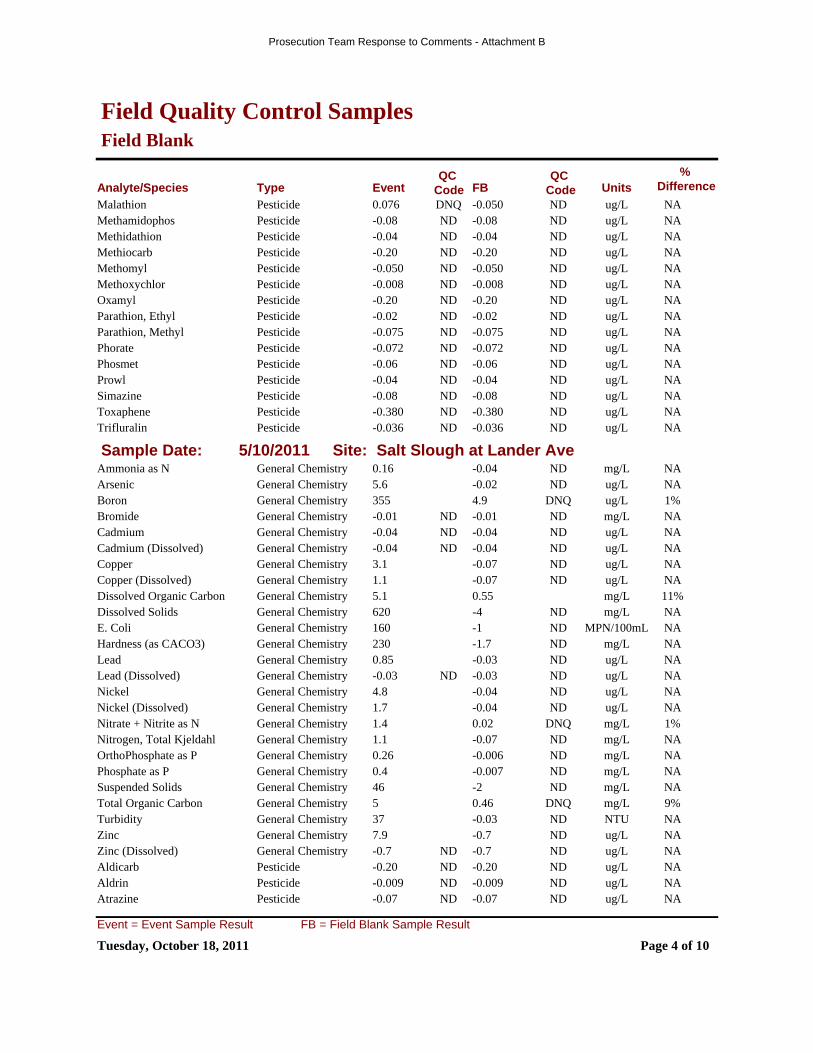
Field Blank
Field Quality Control Samples
Analyte/Species Units%
DifferenceFBEventTypeQC
CodeQC
CodeMalathion ug/L-0.0500.076 NAPesticide NDDNQMethamidophos ug/L-0.08-0.08 NAPesticide NDNDMethidathion ug/L-0.04-0.04 NAPesticide NDNDMethiocarb ug/L-0.20-0.20 NAPesticide NDNDMethomyl ug/L-0.050-0.050 NAPesticide NDNDMethoxychlor ug/L-0.008-0.008 NAPesticide NDNDOxamyl ug/L-0.20-0.20 NAPesticide NDNDParathion, Ethyl ug/L-0.02-0.02 NAPesticide NDNDParathion, Methyl ug/L-0.075-0.075 NAPesticide NDNDPhorate ug/L-0.072-0.072 NAPesticide NDNDPhosmet ug/L-0.06-0.06 NAPesticide NDNDProwl ug/L-0.04-0.04 NAPesticide NDNDSimazine ug/L-0.08-0.08 NAPesticide NDNDToxaphene ug/L-0.380-0.380 NAPesticide NDNDTrifluralin ug/L-0.036-0.036 NAPesticide NDND
Sample Date: 5/10/2011 Site: Salt Slough at Lander AveAmmonia as N mg/L-0.040.16 NAGeneral Chemistry NDArsenic ug/L-0.025.6 NAGeneral Chemistry NDBoron ug/L4.9355 1%General Chemistry DNQBromide mg/L-0.01-0.01 NAGeneral Chemistry NDNDCadmium ug/L-0.04-0.04 NAGeneral Chemistry NDNDCadmium (Dissolved) ug/L-0.04-0.04 NAGeneral Chemistry NDNDCopper ug/L-0.073.1 NAGeneral Chemistry NDCopper (Dissolved) ug/L-0.071.1 NAGeneral Chemistry NDDissolved Organic Carbon mg/L0.555.1 11%General ChemistryDissolved Solids mg/L-4620 NAGeneral Chemistry NDE. Coli MPN/100mL-1160 NAGeneral Chemistry NDHardness (as CACO3) mg/L-1.7230 NAGeneral Chemistry NDLead ug/L-0.030.85 NAGeneral Chemistry NDLead (Dissolved) ug/L-0.03-0.03 NAGeneral Chemistry NDNDNickel ug/L-0.044.8 NAGeneral Chemistry NDNickel (Dissolved) ug/L-0.041.7 NAGeneral Chemistry NDNitrate + Nitrite as N mg/L0.021.4 1%General Chemistry DNQNitrogen, Total Kjeldahl mg/L-0.071.1 NAGeneral Chemistry NDOrthoPhosphate as P mg/L-0.0060.26 NAGeneral Chemistry NDPhosphate as P mg/L-0.0070.4 NAGeneral Chemistry NDSuspended Solids mg/L-246 NAGeneral Chemistry NDTotal Organic Carbon mg/L0.465 9%General Chemistry DNQTurbidity NTU-0.0337 NAGeneral Chemistry NDZinc ug/L-0.77.9 NAGeneral Chemistry NDZinc (Dissolved) ug/L-0.7-0.7 NAGeneral Chemistry NDNDAldicarb ug/L-0.20-0.20 NAPesticide NDNDAldrin ug/L-0.009-0.009 NAPesticide NDNDAtrazine ug/L-0.07-0.07 NAPesticide NDND
Tuesday, October 18, 2011 Page 4 of 10
Event = Event Sample Result FB = Field Blank Sample Result
Prosecution Team Response to Comments - Attachment B

Field Blank
Field Quality Control Samples
Analyte/Species Units%
DifferenceFBEventTypeQC
CodeQC
CodeAzinphos methyl ug/L-0.02-0.02 NAPesticide NDNDCarbaryl ug/L-0.050-0.050 NAPesticide NDNDCarbofuran ug/L-0.050-0.050 NAPesticide NDNDChlordane, Alpha- ug/L-0.007-0.007 NAPesticide NDNDChlordane, gamma- ug/L-0.006-0.006 NAPesticide NDNDChlorpyrifos ug/L-0.0026-0.0026 NAPesticide NDNDCyanazine ug/L-0.09-0.09 NAPesticide NDNDDDD(p,p') ug/L-0.003-0.003 NAPesticide NDNDDDE(p,p') ug/L-0.004-0.004 NAPesticide NDNDDDT(p,p') ug/L-0.007-0.007 NAPesticide NDNDDemeton-s ug/L-0.08-0.08 NAPesticide NDNDDiazinon ug/L-0.004-0.004 NAPesticide NDNDDichlorvos ug/L-0.02-0.02 NAPesticide NDNDDicofol ug/L-0.01-0.01 NAPesticide NDNDDieldrin ug/L-0.005-0.005 NAPesticide NDNDDimethoate ug/L-0.080-0.080 NAPesticide NDNDDisulfoton ug/L-0.020-0.020 NAPesticide NDNDDiuron ug/L-0.200.58 NAPesticide NDEndosulfan I ug/L-0.005-0.005 NAPesticide NDNDEndosulfan II ug/L-0.004-0.004 NAPesticide NDNDEndosulfan Sulfate ug/L-0.005-0.005 NAPesticide NDNDEndrin ug/L-0.007-0.007 NAPesticide NDNDEPTC ug/L-0.03-0.03 NAPesticide NDNDHCH, alpha ug/L-0.005-0.005 NAPesticide NDNDHCH, beta ug/L-0.008-0.008 NAPesticide NDNDHCH, delta ug/L-0.005-0.005 NAPesticide NDNDHCH, gamma ug/L-0.005-0.005 NAPesticide NDNDHeptachlor ug/L-0.008-0.008 NAPesticide NDNDHeptachlor epoxide ug/L-0.007-0.007 NAPesticide NDNDLinuron ug/L-0.20-0.20 NAPesticide NDNDMalathion ug/L-0.050-0.050 NAPesticide NDNDMethamidophos ug/L-0.08-0.08 NAPesticide NDNDMethidathion ug/L-0.04-0.04 NAPesticide NDNDMethiocarb ug/L-0.20-0.20 NAPesticide NDNDMethomyl ug/L-0.050-0.050 NAPesticide NDNDMethoxychlor ug/L-0.008-0.008 NAPesticide NDNDOxamyl ug/L-0.20-0.20 NAPesticide NDNDParathion, Ethyl ug/L-0.02-0.02 NAPesticide NDNDParathion, Methyl ug/L-0.075-0.075 NAPesticide NDNDPhorate ug/L-0.072-0.072 NAPesticide NDNDPhosmet ug/L-0.06-0.06 NAPesticide NDNDProwl ug/L-0.04-0.04 NAPesticide NDNDSimazine ug/L-0.08-0.08 NAPesticide NDNDToxaphene ug/L-0.380-0.380 NAPesticide NDNDTrifluralin ug/L-0.036-0.036 NAPesticide NDND
Tuesday, October 18, 2011 Page 5 of 10
Event = Event Sample Result FB = Field Blank Sample Result
Prosecution Team Response to Comments - Attachment B
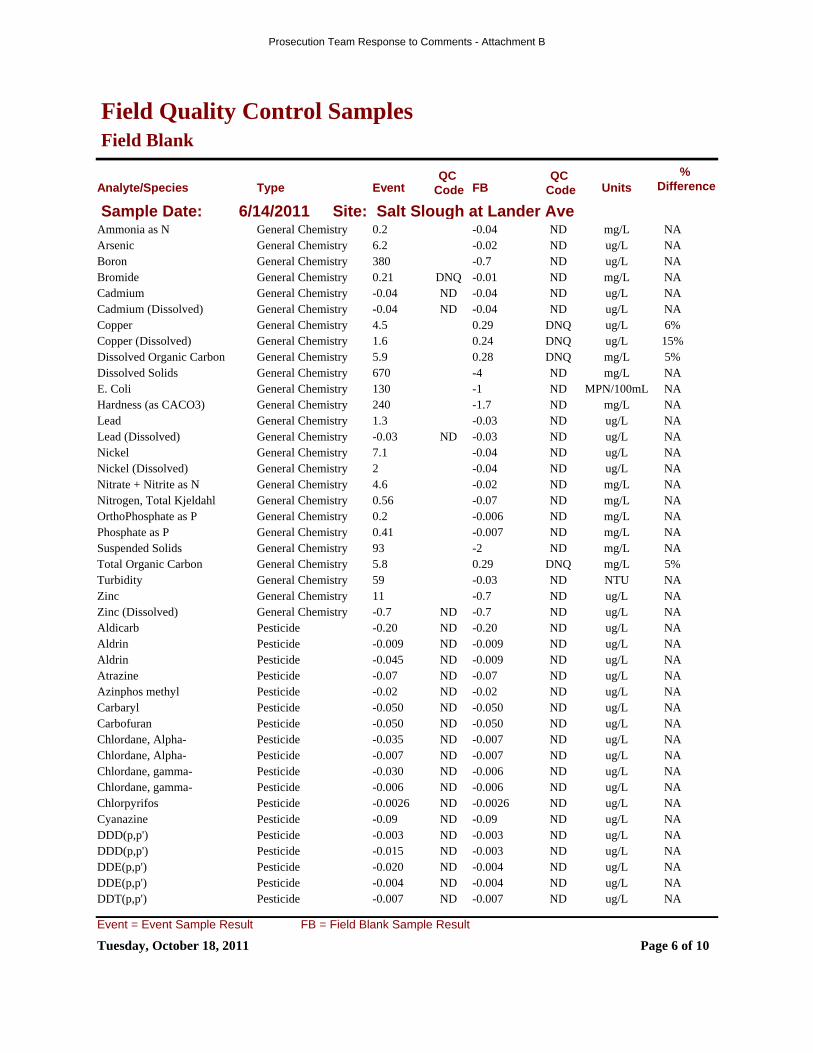
Field Blank
Field Quality Control Samples
Analyte/Species Units%
DifferenceFBEventTypeQC
CodeQC
Code
Sample Date: 6/14/2011 Site: Salt Slough at Lander AveAmmonia as N mg/L-0.040.2 NAGeneral Chemistry NDArsenic ug/L-0.026.2 NAGeneral Chemistry NDBoron ug/L-0.7380 NAGeneral Chemistry NDBromide mg/L-0.010.21 NAGeneral Chemistry NDDNQCadmium ug/L-0.04-0.04 NAGeneral Chemistry NDNDCadmium (Dissolved) ug/L-0.04-0.04 NAGeneral Chemistry NDNDCopper ug/L0.294.5 6%General Chemistry DNQCopper (Dissolved) ug/L0.241.6 15%General Chemistry DNQDissolved Organic Carbon mg/L0.285.9 5%General Chemistry DNQDissolved Solids mg/L-4670 NAGeneral Chemistry NDE. Coli MPN/100mL-1130 NAGeneral Chemistry NDHardness (as CACO3) mg/L-1.7240 NAGeneral Chemistry NDLead ug/L-0.031.3 NAGeneral Chemistry NDLead (Dissolved) ug/L-0.03-0.03 NAGeneral Chemistry NDNDNickel ug/L-0.047.1 NAGeneral Chemistry NDNickel (Dissolved) ug/L-0.042 NAGeneral Chemistry NDNitrate + Nitrite as N mg/L-0.024.6 NAGeneral Chemistry NDNitrogen, Total Kjeldahl mg/L-0.070.56 NAGeneral Chemistry NDOrthoPhosphate as P mg/L-0.0060.2 NAGeneral Chemistry NDPhosphate as P mg/L-0.0070.41 NAGeneral Chemistry NDSuspended Solids mg/L-293 NAGeneral Chemistry NDTotal Organic Carbon mg/L0.295.8 5%General Chemistry DNQTurbidity NTU-0.0359 NAGeneral Chemistry NDZinc ug/L-0.711 NAGeneral Chemistry NDZinc (Dissolved) ug/L-0.7-0.7 NAGeneral Chemistry NDNDAldicarb ug/L-0.20-0.20 NAPesticide NDNDAldrin ug/L-0.009-0.009 NAPesticide NDNDAldrin ug/L-0.009-0.045 NAPesticide NDNDAtrazine ug/L-0.07-0.07 NAPesticide NDNDAzinphos methyl ug/L-0.02-0.02 NAPesticide NDNDCarbaryl ug/L-0.050-0.050 NAPesticide NDNDCarbofuran ug/L-0.050-0.050 NAPesticide NDNDChlordane, Alpha- ug/L-0.007-0.035 NAPesticide NDNDChlordane, Alpha- ug/L-0.007-0.007 NAPesticide NDNDChlordane, gamma- ug/L-0.006-0.030 NAPesticide NDNDChlordane, gamma- ug/L-0.006-0.006 NAPesticide NDNDChlorpyrifos ug/L-0.0026-0.0026 NAPesticide NDNDCyanazine ug/L-0.09-0.09 NAPesticide NDNDDDD(p,p') ug/L-0.003-0.003 NAPesticide NDNDDDD(p,p') ug/L-0.003-0.015 NAPesticide NDNDDDE(p,p') ug/L-0.004-0.020 NAPesticide NDNDDDE(p,p') ug/L-0.004-0.004 NAPesticide NDNDDDT(p,p') ug/L-0.007-0.007 NAPesticide NDND
Tuesday, October 18, 2011 Page 6 of 10
Event = Event Sample Result FB = Field Blank Sample Result
Prosecution Team Response to Comments - Attachment B

Field Blank
Field Quality Control Samples
Analyte/Species Units%
DifferenceFBEventTypeQC
CodeQC
CodeDDT(p,p') ug/L-0.007-0.035 NAPesticide NDNDDemeton-s ug/L-0.08-0.08 NAPesticide NDNDDiazinon ug/L-0.004-0.004 NAPesticide NDNDDichlorvos ug/L-0.02-0.02 NAPesticide NDNDDicofol ug/L-0.01-0.01 NAPesticide NDNDDicofol ug/L-0.01-0.05 NAPesticide NDNDDieldrin ug/L-0.005-0.025 NAPesticide NDNDDieldrin ug/L-0.005-0.005 NAPesticide NDNDDimethoate ug/L-0.080-0.080 NAPesticide NDNDDisulfoton ug/L-0.020-0.020 NAPesticide NDNDDiuron ug/L-0.20-0.20 NAPesticide NDNDEndosulfan I ug/L-0.005-0.005 NAPesticide NDNDEndosulfan I ug/L-0.005-0.025 NAPesticide NDNDEndosulfan II ug/L-0.004-0.004 NAPesticide NDNDEndosulfan II ug/L-0.004-0.020 NAPesticide NDNDEndosulfan Sulfate ug/L-0.005-0.025 NAPesticide NDNDEndosulfan Sulfate ug/L-0.005-0.005 NAPesticide NDNDEndrin ug/L-0.007-0.035 NAPesticide NDNDEndrin ug/L-0.007-0.007 NAPesticide NDNDEPTC ug/L-0.03-0.03 NAPesticide NDNDHCH, alpha ug/L-0.005-0.005 NAPesticide NDNDHCH, alpha ug/L-0.005-0.025 NAPesticide NDNDHCH, beta ug/L-0.008-0.040 NAPesticide NDNDHCH, beta ug/L-0.008-0.008 NAPesticide NDNDHCH, delta ug/L-0.005-0.025 NAPesticide NDNDHCH, delta ug/L-0.005-0.005 NAPesticide NDNDHCH, gamma ug/L-0.005-0.025 NAPesticide NDNDHCH, gamma ug/L-0.005-0.005 NAPesticide NDNDHeptachlor ug/L-0.008-0.040 NAPesticide NDNDHeptachlor ug/L-0.008-0.008 NAPesticide NDNDHeptachlor epoxide ug/L-0.007-0.035 NAPesticide NDNDHeptachlor epoxide ug/L-0.007-0.007 NAPesticide NDNDLinuron ug/L-0.20-0.20 NAPesticide NDNDMalathion ug/L-0.050-0.050 NAPesticide NDNDMethamidophos ug/L-0.08-0.08 NAPesticide NDNDMethidathion ug/L-0.04-0.04 NAPesticide NDNDMethiocarb ug/L-0.20-0.20 NAPesticide NDNDMethomyl ug/L-0.050-0.050 NAPesticide NDNDMethoxychlor ug/L-0.008-0.008 NAPesticide NDNDMethoxychlor ug/L-0.008-0.040 NAPesticide NDNDOxamyl ug/L-0.20-0.20 NAPesticide NDNDParathion, Ethyl ug/L-0.02-0.02 NAPesticide NDNDParathion, Methyl ug/L-0.075-0.075 NAPesticide NDNDPhorate ug/L-0.072-0.072 NAPesticide NDNDPhosmet ug/L-0.06-0.06 NAPesticide NDND
Tuesday, October 18, 2011 Page 7 of 10
Event = Event Sample Result FB = Field Blank Sample Result
Prosecution Team Response to Comments - Attachment B
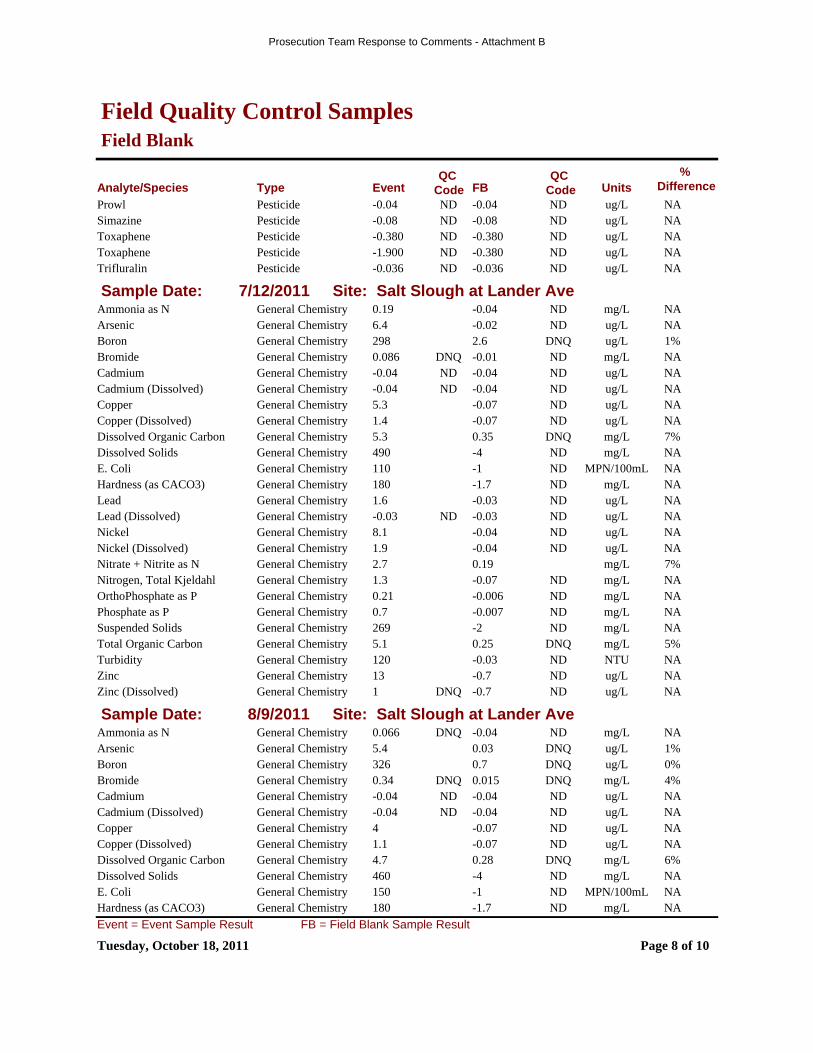
Field Blank
Field Quality Control Samples
Analyte/Species Units%
DifferenceFBEventTypeQC
CodeQC
CodeProwl ug/L-0.04-0.04 NAPesticide NDNDSimazine ug/L-0.08-0.08 NAPesticide NDNDToxaphene ug/L-0.380-0.380 NAPesticide NDNDToxaphene ug/L-0.380-1.900 NAPesticide NDNDTrifluralin ug/L-0.036-0.036 NAPesticide NDND
Sample Date: 7/12/2011 Site: Salt Slough at Lander AveAmmonia as N mg/L-0.040.19 NAGeneral Chemistry NDArsenic ug/L-0.026.4 NAGeneral Chemistry NDBoron ug/L2.6298 1%General Chemistry DNQBromide mg/L-0.010.086 NAGeneral Chemistry NDDNQCadmium ug/L-0.04-0.04 NAGeneral Chemistry NDNDCadmium (Dissolved) ug/L-0.04-0.04 NAGeneral Chemistry NDNDCopper ug/L-0.075.3 NAGeneral Chemistry NDCopper (Dissolved) ug/L-0.071.4 NAGeneral Chemistry NDDissolved Organic Carbon mg/L0.355.3 7%General Chemistry DNQDissolved Solids mg/L-4490 NAGeneral Chemistry NDE. Coli MPN/100mL-1110 NAGeneral Chemistry NDHardness (as CACO3) mg/L-1.7180 NAGeneral Chemistry NDLead ug/L-0.031.6 NAGeneral Chemistry NDLead (Dissolved) ug/L-0.03-0.03 NAGeneral Chemistry NDNDNickel ug/L-0.048.1 NAGeneral Chemistry NDNickel (Dissolved) ug/L-0.041.9 NAGeneral Chemistry NDNitrate + Nitrite as N mg/L0.192.7 7%General ChemistryNitrogen, Total Kjeldahl mg/L-0.071.3 NAGeneral Chemistry NDOrthoPhosphate as P mg/L-0.0060.21 NAGeneral Chemistry NDPhosphate as P mg/L-0.0070.7 NAGeneral Chemistry NDSuspended Solids mg/L-2269 NAGeneral Chemistry NDTotal Organic Carbon mg/L0.255.1 5%General Chemistry DNQTurbidity NTU-0.03120 NAGeneral Chemistry NDZinc ug/L-0.713 NAGeneral Chemistry NDZinc (Dissolved) ug/L-0.71 NAGeneral Chemistry NDDNQ
Sample Date: 8/9/2011 Site: Salt Slough at Lander AveAmmonia as N mg/L-0.040.066 NAGeneral Chemistry NDDNQArsenic ug/L0.035.4 1%General Chemistry DNQBoron ug/L0.7326 0%General Chemistry DNQBromide mg/L0.0150.34 4%General Chemistry DNQDNQCadmium ug/L-0.04-0.04 NAGeneral Chemistry NDNDCadmium (Dissolved) ug/L-0.04-0.04 NAGeneral Chemistry NDNDCopper ug/L-0.074 NAGeneral Chemistry NDCopper (Dissolved) ug/L-0.071.1 NAGeneral Chemistry NDDissolved Organic Carbon mg/L0.284.7 6%General Chemistry DNQDissolved Solids mg/L-4460 NAGeneral Chemistry NDE. Coli MPN/100mL-1150 NAGeneral Chemistry NDHardness (as CACO3) mg/L-1.7180 NAGeneral Chemistry ND
Tuesday, October 18, 2011 Page 8 of 10
Event = Event Sample Result FB = Field Blank Sample Result
Prosecution Team Response to Comments - Attachment B
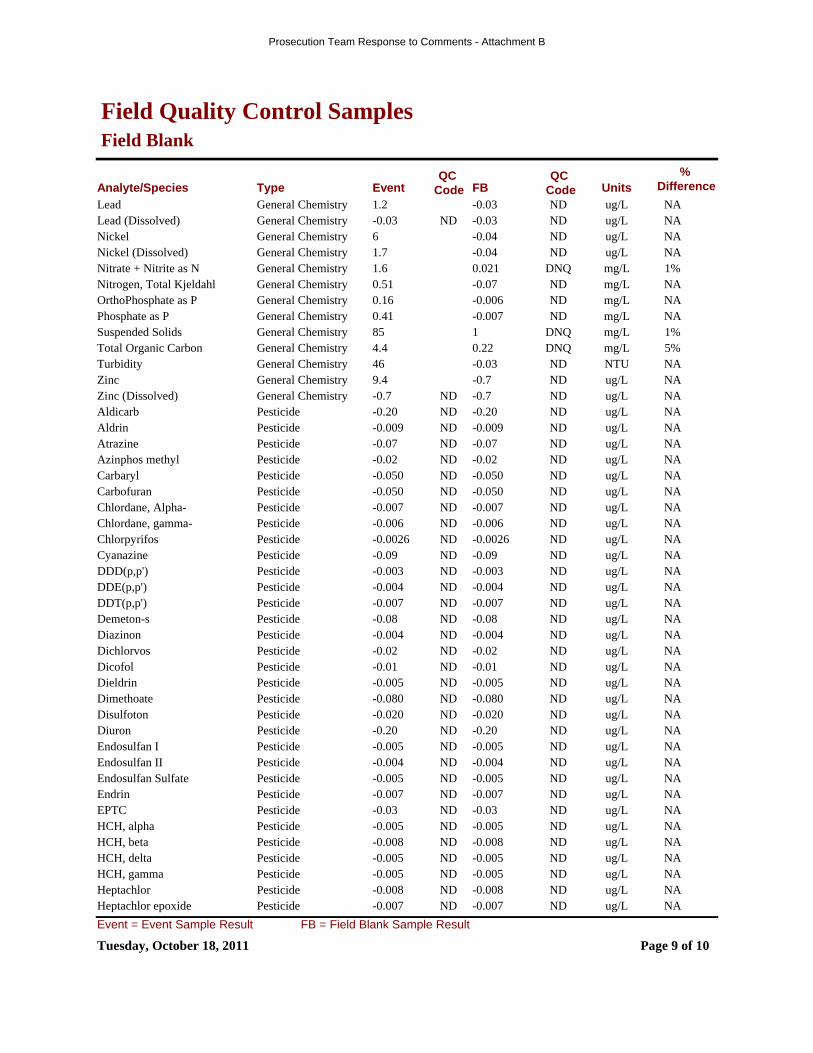
Field Blank
Field Quality Control Samples
Analyte/Species Units%
DifferenceFBEventTypeQC
CodeQC
CodeLead ug/L-0.031.2 NAGeneral Chemistry NDLead (Dissolved) ug/L-0.03-0.03 NAGeneral Chemistry NDNDNickel ug/L-0.046 NAGeneral Chemistry NDNickel (Dissolved) ug/L-0.041.7 NAGeneral Chemistry NDNitrate + Nitrite as N mg/L0.0211.6 1%General Chemistry DNQNitrogen, Total Kjeldahl mg/L-0.070.51 NAGeneral Chemistry NDOrthoPhosphate as P mg/L-0.0060.16 NAGeneral Chemistry NDPhosphate as P mg/L-0.0070.41 NAGeneral Chemistry NDSuspended Solids mg/L185 1%General Chemistry DNQTotal Organic Carbon mg/L0.224.4 5%General Chemistry DNQTurbidity NTU-0.0346 NAGeneral Chemistry NDZinc ug/L-0.79.4 NAGeneral Chemistry NDZinc (Dissolved) ug/L-0.7-0.7 NAGeneral Chemistry NDNDAldicarb ug/L-0.20-0.20 NAPesticide NDNDAldrin ug/L-0.009-0.009 NAPesticide NDNDAtrazine ug/L-0.07-0.07 NAPesticide NDNDAzinphos methyl ug/L-0.02-0.02 NAPesticide NDNDCarbaryl ug/L-0.050-0.050 NAPesticide NDNDCarbofuran ug/L-0.050-0.050 NAPesticide NDNDChlordane, Alpha- ug/L-0.007-0.007 NAPesticide NDNDChlordane, gamma- ug/L-0.006-0.006 NAPesticide NDNDChlorpyrifos ug/L-0.0026-0.0026 NAPesticide NDNDCyanazine ug/L-0.09-0.09 NAPesticide NDNDDDD(p,p') ug/L-0.003-0.003 NAPesticide NDNDDDE(p,p') ug/L-0.004-0.004 NAPesticide NDNDDDT(p,p') ug/L-0.007-0.007 NAPesticide NDNDDemeton-s ug/L-0.08-0.08 NAPesticide NDNDDiazinon ug/L-0.004-0.004 NAPesticide NDNDDichlorvos ug/L-0.02-0.02 NAPesticide NDNDDicofol ug/L-0.01-0.01 NAPesticide NDNDDieldrin ug/L-0.005-0.005 NAPesticide NDNDDimethoate ug/L-0.080-0.080 NAPesticide NDNDDisulfoton ug/L-0.020-0.020 NAPesticide NDNDDiuron ug/L-0.20-0.20 NAPesticide NDNDEndosulfan I ug/L-0.005-0.005 NAPesticide NDNDEndosulfan II ug/L-0.004-0.004 NAPesticide NDNDEndosulfan Sulfate ug/L-0.005-0.005 NAPesticide NDNDEndrin ug/L-0.007-0.007 NAPesticide NDNDEPTC ug/L-0.03-0.03 NAPesticide NDNDHCH, alpha ug/L-0.005-0.005 NAPesticide NDNDHCH, beta ug/L-0.008-0.008 NAPesticide NDNDHCH, delta ug/L-0.005-0.005 NAPesticide NDNDHCH, gamma ug/L-0.005-0.005 NAPesticide NDNDHeptachlor ug/L-0.008-0.008 NAPesticide NDNDHeptachlor epoxide ug/L-0.007-0.007 NAPesticide NDND
Tuesday, October 18, 2011 Page 9 of 10
Event = Event Sample Result FB = Field Blank Sample Result
Prosecution Team Response to Comments - Attachment B
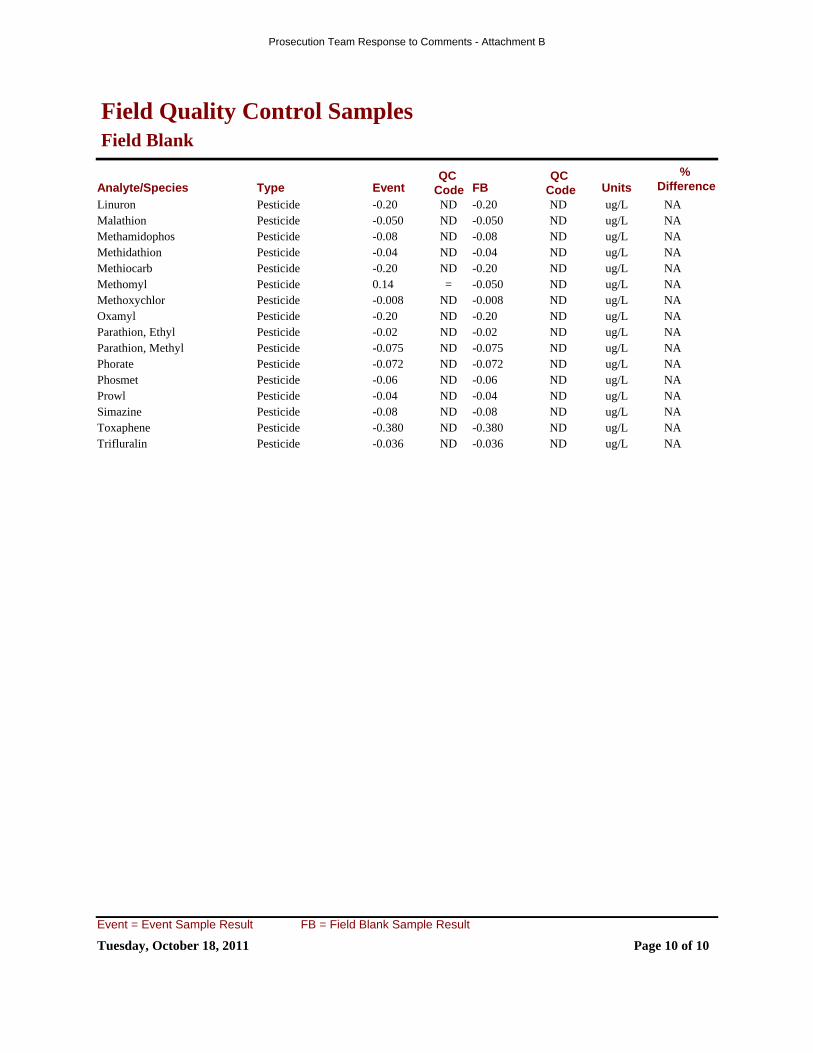
Field Blank
Field Quality Control Samples
Analyte/Species Units%
DifferenceFBEventTypeQC
CodeQC
CodeLinuron ug/L-0.20-0.20 NAPesticide NDNDMalathion ug/L-0.050-0.050 NAPesticide NDNDMethamidophos ug/L-0.08-0.08 NAPesticide NDNDMethidathion ug/L-0.04-0.04 NAPesticide NDNDMethiocarb ug/L-0.20-0.20 NAPesticide NDNDMethomyl ug/L-0.0500.14 NAPesticide ND=Methoxychlor ug/L-0.008-0.008 NAPesticide NDNDOxamyl ug/L-0.20-0.20 NAPesticide NDNDParathion, Ethyl ug/L-0.02-0.02 NAPesticide NDNDParathion, Methyl ug/L-0.075-0.075 NAPesticide NDNDPhorate ug/L-0.072-0.072 NAPesticide NDNDPhosmet ug/L-0.06-0.06 NAPesticide NDNDProwl ug/L-0.04-0.04 NAPesticide NDNDSimazine ug/L-0.08-0.08 NAPesticide NDNDToxaphene ug/L-0.380-0.380 NAPesticide NDNDTrifluralin ug/L-0.036-0.036 NAPesticide NDND
Tuesday, October 18, 2011 Page 10 of 10
Event = Event Sample Result FB = Field Blank Sample Result
Prosecution Team Response to Comments - Attachment B
Westside San Joaquin River Semi-Annual Report Watershed Coalition June 15, 2011
Attachment 4 Sediment Toxicity Follow-up Analyses
Prosecution Team Response to Comments - Attachment B

Sediment Toxicity Follow-up AnalysisHospital Creek at River Road
PesticideSample Event:
Results Units
Hyalella azteca 8.75 %
79 5/24/2011
Toxicity Results
Allethrin ug/kgND
Bifenthrin ug/kg2
Chlorpyrifos ug/kg4.1
Cyfluthrin, total ug/kgND
Cyhalothrin, lambda, total ug/kg0.85
Cypermethrin, total ug/kgND
Deltamethrin:Tralomethrin ug/kgND
Diazinon ug/kgND
Esfenvalerate:Fenvalerate ug/kg24.5
Fenpropathrin ug/kgND
Permethrin, total ug/kgND
Tau-Fluvalinate ug/kgND
Tetramethrin ug/kgND
Friday, October 14, Page 1 of 3
DNQ: Result is below the report limit and is estimated
Prosecution Team Response to Comments - Attachment B
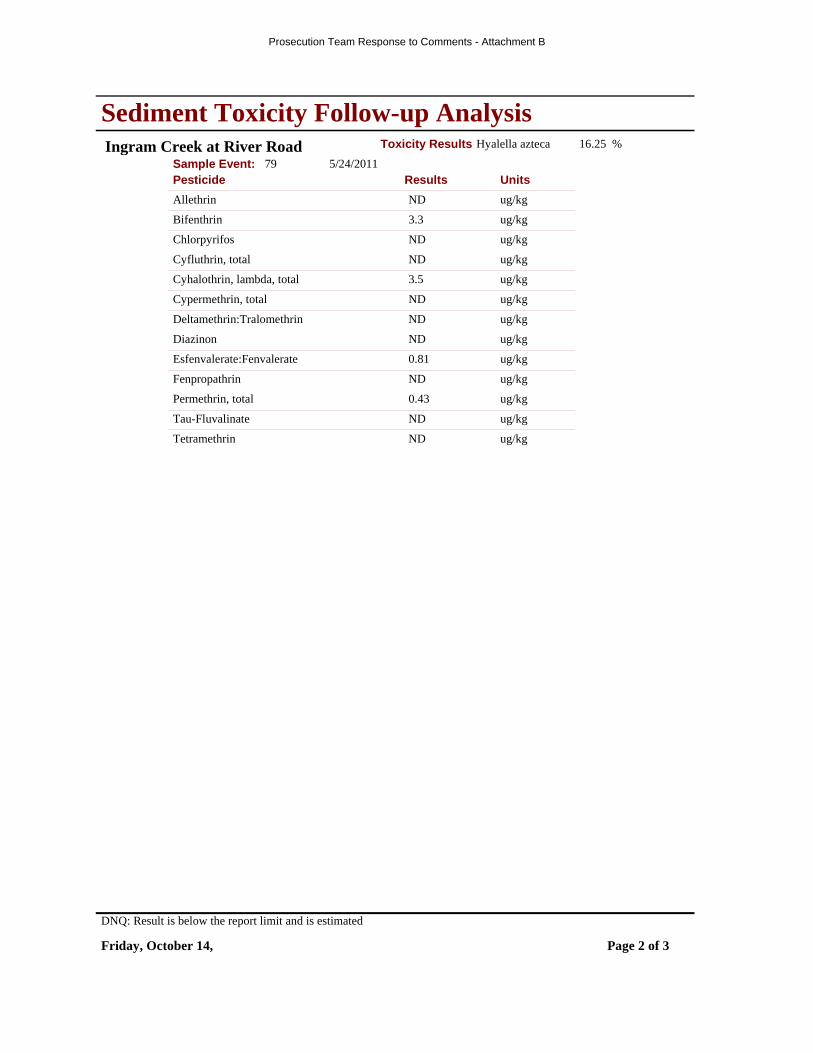
Sediment Toxicity Follow-up AnalysisIngram Creek at River Road
PesticideSample Event:
Results Units
Hyalella azteca 16.25 %
79 5/24/2011
Toxicity Results
Allethrin ug/kgND
Bifenthrin ug/kg3.3
Chlorpyrifos ug/kgND
Cyfluthrin, total ug/kgND
Cyhalothrin, lambda, total ug/kg3.5
Cypermethrin, total ug/kgND
Deltamethrin:Tralomethrin ug/kgND
Diazinon ug/kgND
Esfenvalerate:Fenvalerate ug/kg0.81
Fenpropathrin ug/kgND
Permethrin, total ug/kg0.43
Tau-Fluvalinate ug/kgND
Tetramethrin ug/kgND
Friday, October 14, Page 2 of 3
DNQ: Result is below the report limit and is estimated
Prosecution Team Response to Comments - Attachment B

Sediment Toxicity Follow-up AnalysisSalt Slough at Sand Dam
PesticideSample Event:
Results Units
Hyalella azteca 78.75 %
79 5/24/2011
Toxicity Results
Allethrin ug/kgND
Bifenthrin ug/kg3.2
Chlorpyrifos ug/kg2.2
Cyfluthrin, total ug/kg0.51
Cyhalothrin, lambda, total ug/kg3.2
Cypermethrin, total ug/kgND
Deltamethrin:Tralomethrin ug/kgND
Diazinon ug/kgND
Esfenvalerate:Fenvalerate ug/kgND
Fenpropathrin ug/kgND
Permethrin, total ug/kgND
Tau-Fluvalinate ug/kgND
Tetramethrin ug/kgND
Friday, October 14, Page 3 of 3
DNQ: Result is below the report limit and is estimated
Prosecution Team Response to Comments - Attachment B
Westside San Joaquin River Semi-Annual Report Watershed Coalition June 15, 2011
Attachment 5 Exceedance of Recommended Water Quality
Values
Prosecution Team Response to Comments - Attachment B

Westside San Joaquin River Watershed CoalitionNumber of Water Quality Value Exceedances for the period of 3/1/2011 to 8/31/2011
Constituent # of ExceedancesType # of Tests
Ceriodaphnia dubia 7Aquatic Toxicity 106Selenastrum capricornutum 1Aquatic Toxicity 106DO 14Field Data 138EC 54Field Data 138Flow 28Field Data 115pH 10Field Data 138Arsenic 3General Chemistry 103Boron 27General Chemistry 122E. Coli 40General Chemistry 121Total Dissolved Solids 53General Chemistry 122Aldrin 1Pesticide 107Chlorpyrifos 9Pesticide 124DDE(p,p') 35Pesticide 107DDT(p,p') 6Pesticide 107Diuron 5Pesticide 105Malathion 5Pesticide 124Toxaphene 2Pesticide 107Hyalella azteca 5Sediment Toxicity 14
Wednesday, October 19, 2011 Page 1 of 1
Prosecution Team Response to Comments - Attachment B
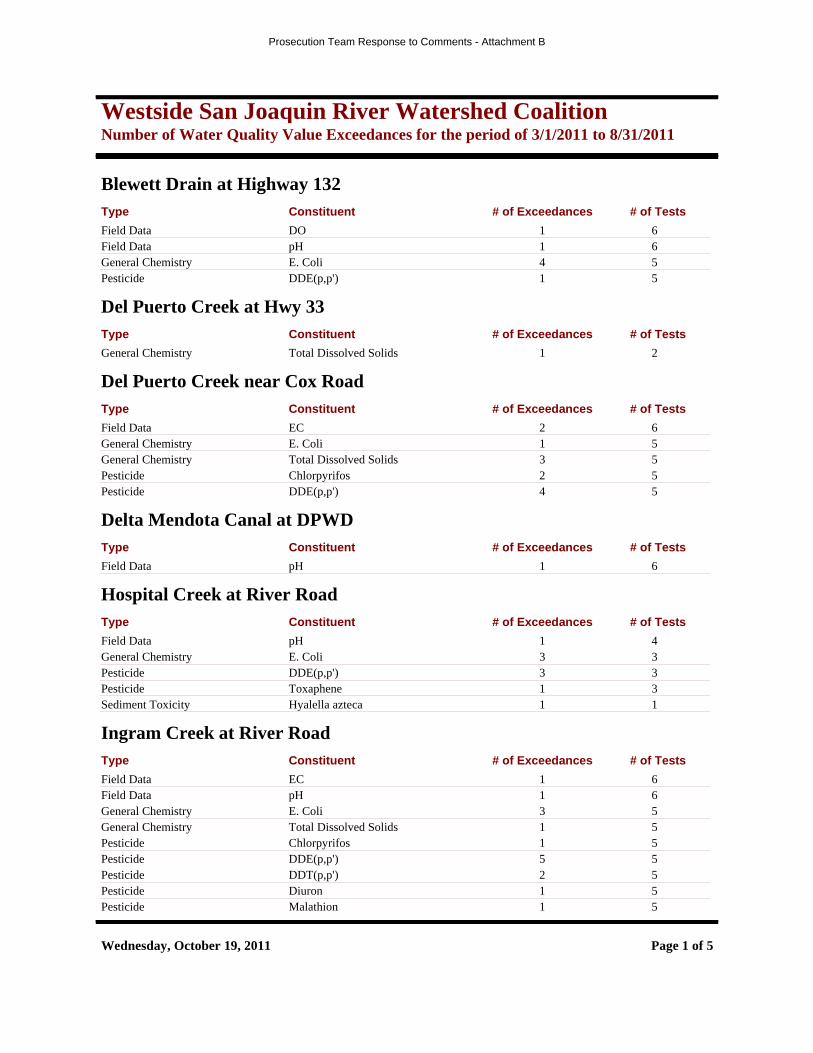
Westside San Joaquin River Watershed CoalitionNumber of Water Quality Value Exceedances for the period of 3/1/2011 to 8/31/2011
Blewett Drain at Highway 132Constituent # of ExceedancesType # of Tests
DOField Data 1 6pHField Data 1 6E. ColiGeneral Chemistry 4 5DDE(p,p')Pesticide 1 5
Del Puerto Creek at Hwy 33Constituent # of ExceedancesType # of Tests
Total Dissolved SolidsGeneral Chemistry 1 2
Del Puerto Creek near Cox RoadConstituent # of ExceedancesType # of Tests
ECField Data 2 6E. ColiGeneral Chemistry 1 5Total Dissolved SolidsGeneral Chemistry 3 5ChlorpyrifosPesticide 2 5DDE(p,p')Pesticide 4 5
Delta Mendota Canal at DPWDConstituent # of ExceedancesType # of Tests
pHField Data 1 6
Hospital Creek at River RoadConstituent # of ExceedancesType # of Tests
pHField Data 1 4E. ColiGeneral Chemistry 3 3DDE(p,p')Pesticide 3 3ToxaphenePesticide 1 3Hyalella aztecaSediment Toxicity 1 1
Ingram Creek at River RoadConstituent # of ExceedancesType # of Tests
ECField Data 1 6pHField Data 1 6E. ColiGeneral Chemistry 3 5Total Dissolved SolidsGeneral Chemistry 1 5ChlorpyrifosPesticide 1 5DDE(p,p')Pesticide 5 5DDT(p,p')Pesticide 2 5DiuronPesticide 1 5MalathionPesticide 1 5
Wednesday, October 19, 2011 Page 1 of 5
Prosecution Team Response to Comments - Attachment B

Westside San Joaquin River Watershed CoalitionNumber of Water Quality Value Exceedances for the period of 3/1/2011 to 8/31/2011
Hyalella aztecaSediment Toxicity 1 1
Little Panoche Creek at W. BoundaryConstituent # of ExceedancesType # of Tests
Ceriodaphnia dubiaAquatic Toxicity 1 1Selenastrum capricornutumAquatic Toxicity 1 1ECField Data 1 1pHField Data 1 1BoronGeneral Chemistry 1 1E. ColiGeneral Chemistry 1 1Total Dissolved SolidsGeneral Chemistry 1 1DDE(p,p')Pesticide 1 1
Los Banos Creek at China Camp RoadConstituent # of ExceedancesType # of Tests
DOField Data 2 7ECField Data 6 7pHField Data 1 7ArsenicGeneral Chemistry 1 6BoronGeneral Chemistry 6 6E. ColiGeneral Chemistry 2 6Total Dissolved SolidsGeneral Chemistry 6 6AldrinPesticide 1 6
Los Banos Creek at Hwy 140Constituent # of ExceedancesType # of Tests
Ceriodaphnia dubiaAquatic Toxicity 1 6DOField Data 1 6ECField Data 6 6ArsenicGeneral Chemistry 1 6BoronGeneral Chemistry 6 6E. ColiGeneral Chemistry 2 6Total Dissolved SolidsGeneral Chemistry 6 6
Marshall Road Drain near River RoadConstituent # of ExceedancesType # of Tests
ECField Data 1 5E. ColiGeneral Chemistry 2 5Total Dissolved SolidsGeneral Chemistry 2 5ChlorpyrifosPesticide 1 5DDE(p,p')Pesticide 4 5DDT(p,p')Pesticide 1 5MalathionPesticide 2 5
Wednesday, October 19, 2011 Page 2 of 5
Prosecution Team Response to Comments - Attachment B
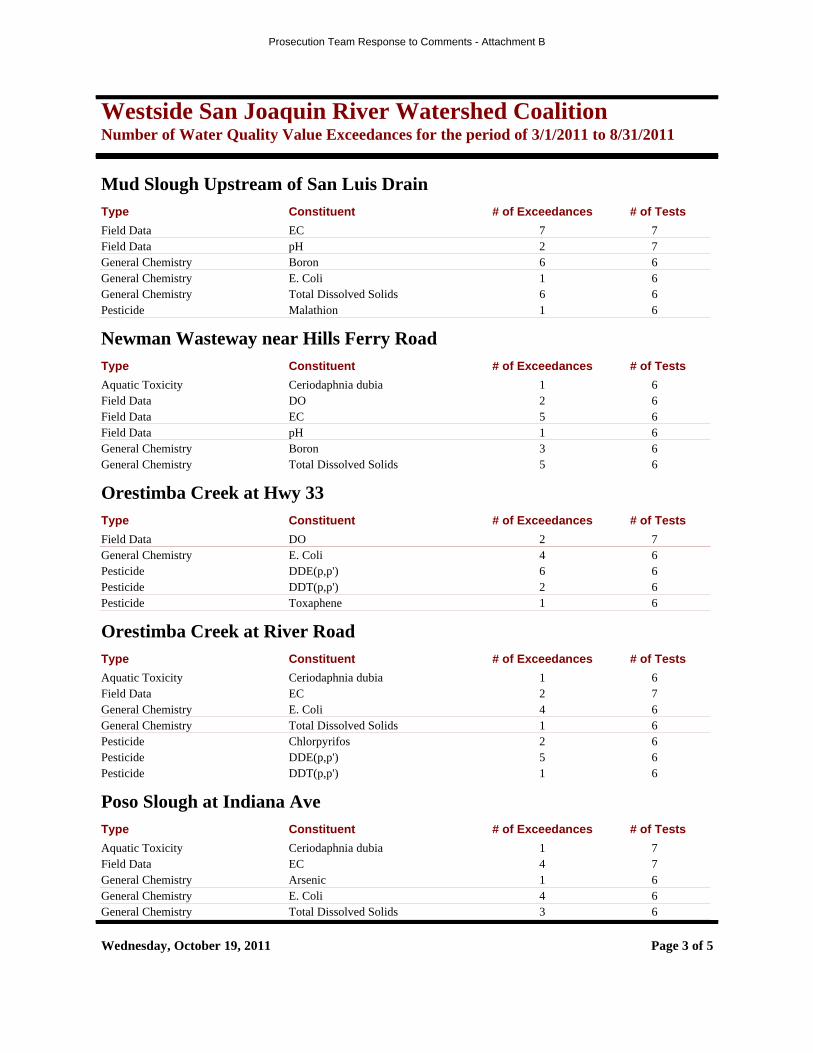
Westside San Joaquin River Watershed CoalitionNumber of Water Quality Value Exceedances for the period of 3/1/2011 to 8/31/2011
Mud Slough Upstream of San Luis DrainConstituent # of ExceedancesType # of Tests
ECField Data 7 7pHField Data 2 7BoronGeneral Chemistry 6 6E. ColiGeneral Chemistry 1 6Total Dissolved SolidsGeneral Chemistry 6 6MalathionPesticide 1 6
Newman Wasteway near Hills Ferry RoadConstituent # of ExceedancesType # of Tests
Ceriodaphnia dubiaAquatic Toxicity 1 6DOField Data 2 6ECField Data 5 6pHField Data 1 6BoronGeneral Chemistry 3 6Total Dissolved SolidsGeneral Chemistry 5 6
Orestimba Creek at Hwy 33Constituent # of ExceedancesType # of Tests
DOField Data 2 7E. ColiGeneral Chemistry 4 6DDE(p,p')Pesticide 6 6DDT(p,p')Pesticide 2 6ToxaphenePesticide 1 6
Orestimba Creek at River RoadConstituent # of ExceedancesType # of Tests
Ceriodaphnia dubiaAquatic Toxicity 1 6ECField Data 2 7E. ColiGeneral Chemistry 4 6Total Dissolved SolidsGeneral Chemistry 1 6ChlorpyrifosPesticide 2 6DDE(p,p')Pesticide 5 6DDT(p,p')Pesticide 1 6
Poso Slough at Indiana AveConstituent # of ExceedancesType # of Tests
Ceriodaphnia dubiaAquatic Toxicity 1 7ECField Data 4 7ArsenicGeneral Chemistry 1 6E. ColiGeneral Chemistry 4 6Total Dissolved SolidsGeneral Chemistry 3 6
Wednesday, October 19, 2011 Page 3 of 5
Prosecution Team Response to Comments - Attachment B
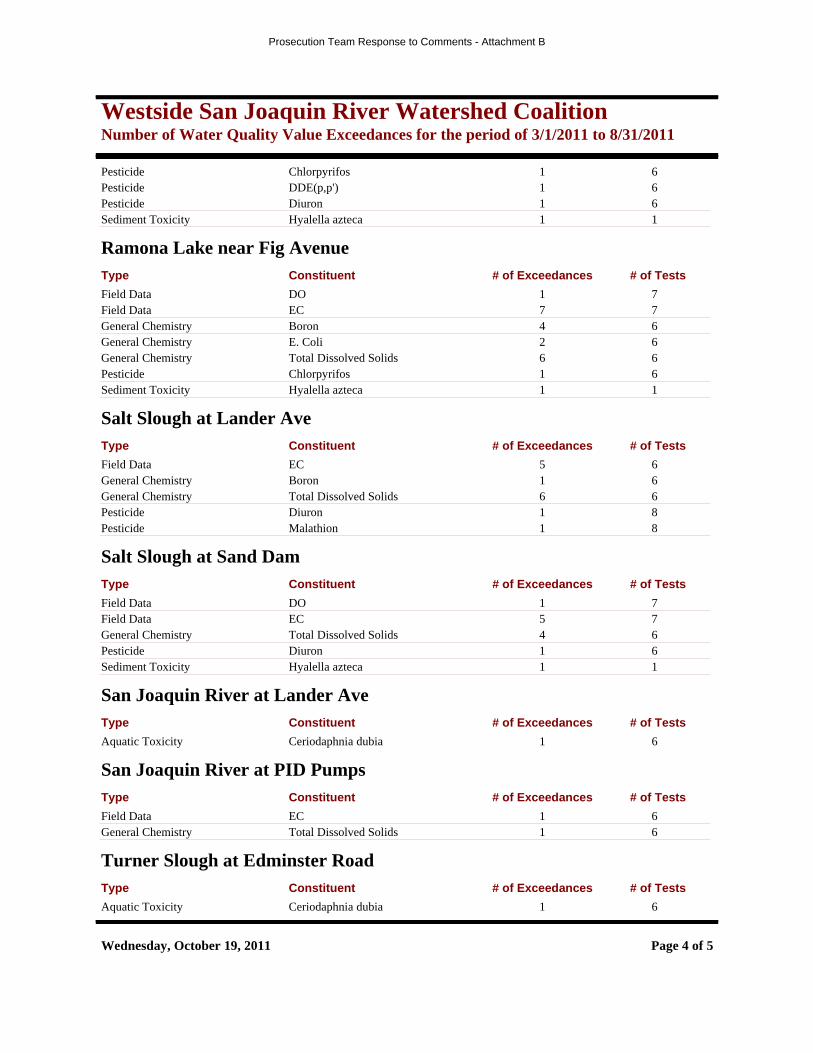
Westside San Joaquin River Watershed CoalitionNumber of Water Quality Value Exceedances for the period of 3/1/2011 to 8/31/2011
ChlorpyrifosPesticide 1 6DDE(p,p')Pesticide 1 6DiuronPesticide 1 6Hyalella aztecaSediment Toxicity 1 1
Ramona Lake near Fig AvenueConstituent # of ExceedancesType # of Tests
DOField Data 1 7ECField Data 7 7BoronGeneral Chemistry 4 6E. ColiGeneral Chemistry 2 6Total Dissolved SolidsGeneral Chemistry 6 6ChlorpyrifosPesticide 1 6Hyalella aztecaSediment Toxicity 1 1
Salt Slough at Lander AveConstituent # of ExceedancesType # of Tests
ECField Data 5 6BoronGeneral Chemistry 1 6Total Dissolved SolidsGeneral Chemistry 6 6DiuronPesticide 1 8MalathionPesticide 1 8
Salt Slough at Sand DamConstituent # of ExceedancesType # of Tests
DOField Data 1 7ECField Data 5 7Total Dissolved SolidsGeneral Chemistry 4 6DiuronPesticide 1 6Hyalella aztecaSediment Toxicity 1 1
San Joaquin River at Lander AveConstituent # of ExceedancesType # of Tests
Ceriodaphnia dubiaAquatic Toxicity 1 6
San Joaquin River at PID PumpsConstituent # of ExceedancesType # of Tests
ECField Data 1 6Total Dissolved SolidsGeneral Chemistry 1 6
Turner Slough at Edminster RoadConstituent # of ExceedancesType # of Tests
Ceriodaphnia dubiaAquatic Toxicity 1 6
Wednesday, October 19, 2011 Page 4 of 5
Prosecution Team Response to Comments - Attachment B

Westside San Joaquin River Watershed CoalitionNumber of Water Quality Value Exceedances for the period of 3/1/2011 to 8/31/2011
DOField Data 4 7ECField Data 1 7E. ColiGeneral Chemistry 2 6Total Dissolved SolidsGeneral Chemistry 1 6
Westley Wasteway near Cox RoadConstituent # of ExceedancesType # of Tests
pHField Data 1 7E. ColiGeneral Chemistry 5 6ChlorpyrifosPesticide 1 6DDE(p,p')Pesticide 5 6DiuronPesticide 1 5
Wednesday, October 19, 2011 Page 5 of 5
Prosecution Team Response to Comments - Attachment B
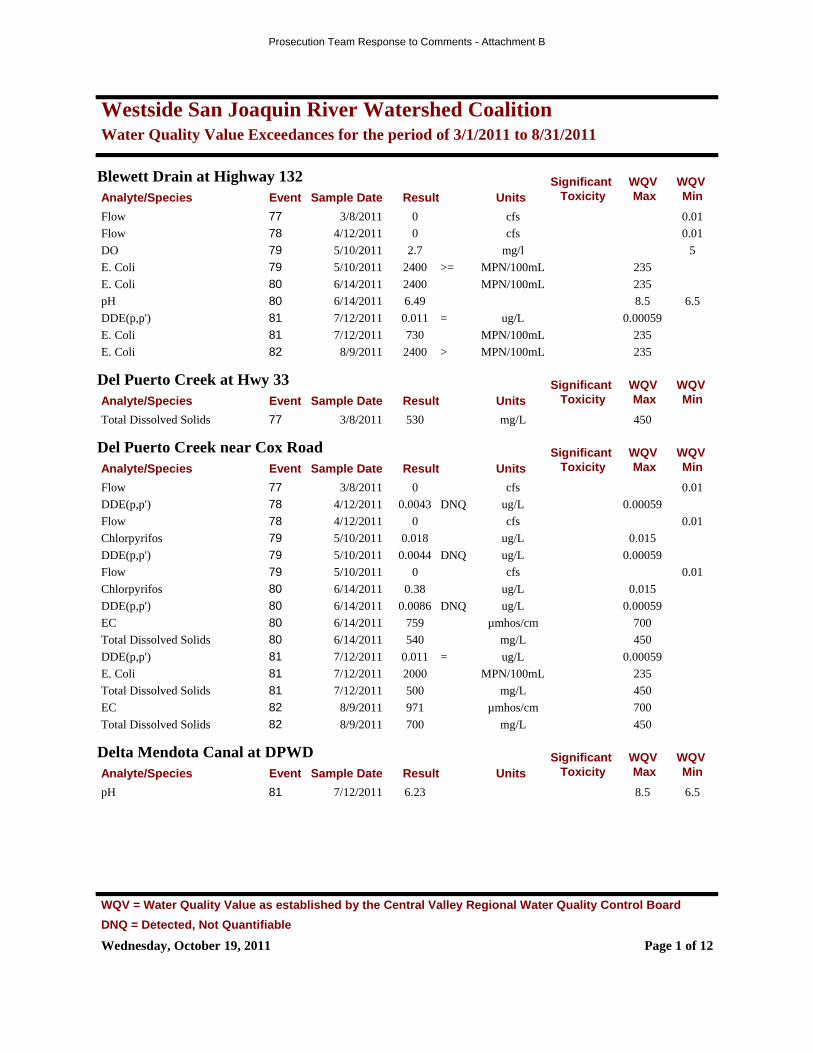
Westside San Joaquin River Watershed CoalitionWater Quality Value Exceedances for the period of 3/1/2011 to 8/31/2011
Blewett Drain at Highway 132Analyte/Species Result Units
Significant Toxicity
WQV Max
WQV MinSample DateEvent
Flow 0 cfs 0.013/8/201177
Flow 0 cfs 0.014/12/201178
DO 2.7 mg/l 55/10/201179
E. Coli 2400 MPN/100mL 2355/10/201179 >=
E. Coli 2400 MPN/100mL 2356/14/201180
pH 6.49 8.5 6.56/14/201180
DDE(p,p') 0.011 ug/L 0.000597/12/201181 =
E. Coli 730 MPN/100mL 2357/12/201181
E. Coli 2400 MPN/100mL 2358/9/201182 >
Del Puerto Creek at Hwy 33Analyte/Species Result Units
Significant Toxicity
WQV Max
WQV MinSample DateEvent
Total Dissolved Solids 530 mg/L 4503/8/201177
Del Puerto Creek near Cox RoadAnalyte/Species Result Units
Significant Toxicity
WQV Max
WQV MinSample DateEvent
Flow 0 cfs 0.013/8/201177
DDE(p,p') 0.0043 ug/L 0.000594/12/201178 DNQ
Flow 0 cfs 0.014/12/201178
Chlorpyrifos 0.018 ug/L 0.0155/10/201179
DDE(p,p') 0.0044 ug/L 0.000595/10/201179 DNQ
Flow 0 cfs 0.015/10/201179
Chlorpyrifos 0.38 ug/L 0.0156/14/201180
DDE(p,p') 0.0086 ug/L 0.000596/14/201180 DNQ
EC 759 µmhos/cm 7006/14/201180
Total Dissolved Solids 540 mg/L 4506/14/201180
DDE(p,p') 0.011 ug/L 0.000597/12/201181 =
E. Coli 2000 MPN/100mL 2357/12/201181
Total Dissolved Solids 500 mg/L 4507/12/201181
EC 971 µmhos/cm 7008/9/201182
Total Dissolved Solids 700 mg/L 4508/9/201182
Delta Mendota Canal at DPWDAnalyte/Species Result Units
Significant Toxicity
WQV Max
WQV MinSample DateEvent
pH 6.23 8.5 6.57/12/201181
Wednesday, October 19, 2011 Page 1 of 12
WQV = Water Quality Value as established by the Central Valley Regional Water Quality Control Board
DNQ = Detected, Not Quantifiable
Prosecution Team Response to Comments - Attachment B
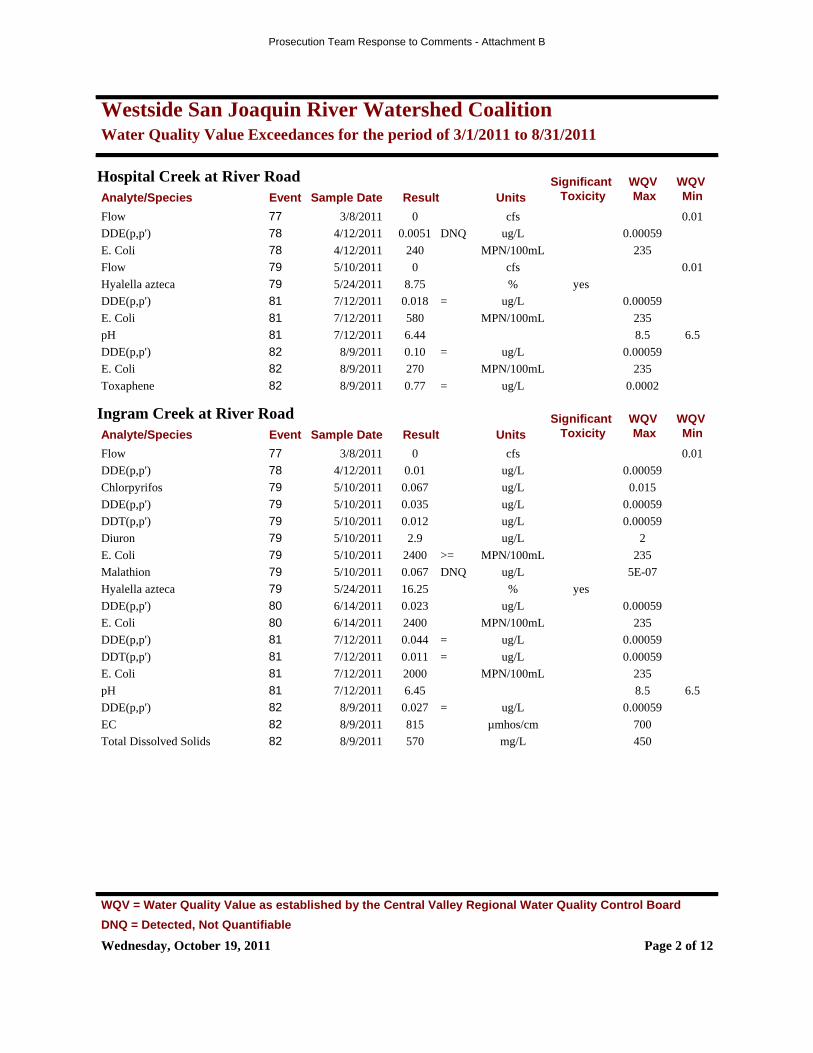
Westside San Joaquin River Watershed CoalitionWater Quality Value Exceedances for the period of 3/1/2011 to 8/31/2011
Hospital Creek at River RoadAnalyte/Species Result Units
Significant Toxicity
WQV Max
WQV MinSample DateEvent
Flow 0 cfs 0.013/8/201177
DDE(p,p') 0.0051 ug/L 0.000594/12/201178 DNQ
E. Coli 240 MPN/100mL 2354/12/201178
Flow 0 cfs 0.015/10/201179
Hyalella azteca 8.75 % yes5/24/201179
DDE(p,p') 0.018 ug/L 0.000597/12/201181 =
E. Coli 580 MPN/100mL 2357/12/201181
pH 6.44 8.5 6.57/12/201181
DDE(p,p') 0.10 ug/L 0.000598/9/201182 =
E. Coli 270 MPN/100mL 2358/9/201182
Toxaphene 0.77 ug/L 0.00028/9/201182 =
Ingram Creek at River RoadAnalyte/Species Result Units
Significant Toxicity
WQV Max
WQV MinSample DateEvent
Flow 0 cfs 0.013/8/201177
DDE(p,p') 0.01 ug/L 0.000594/12/201178
Chlorpyrifos 0.067 ug/L 0.0155/10/201179
DDE(p,p') 0.035 ug/L 0.000595/10/201179
DDT(p,p') 0.012 ug/L 0.000595/10/201179
Diuron 2.9 ug/L 25/10/201179
E. Coli 2400 MPN/100mL 2355/10/201179 >=
Malathion 0.067 ug/L 5E-075/10/201179 DNQ
Hyalella azteca 16.25 % yes5/24/201179
DDE(p,p') 0.023 ug/L 0.000596/14/201180
E. Coli 2400 MPN/100mL 2356/14/201180
DDE(p,p') 0.044 ug/L 0.000597/12/201181 =
DDT(p,p') 0.011 ug/L 0.000597/12/201181 =
E. Coli 2000 MPN/100mL 2357/12/201181
pH 6.45 8.5 6.57/12/201181
DDE(p,p') 0.027 ug/L 0.000598/9/201182 =
EC 815 µmhos/cm 7008/9/201182
Total Dissolved Solids 570 mg/L 4508/9/201182
Wednesday, October 19, 2011 Page 2 of 12
WQV = Water Quality Value as established by the Central Valley Regional Water Quality Control Board
DNQ = Detected, Not Quantifiable
Prosecution Team Response to Comments - Attachment B
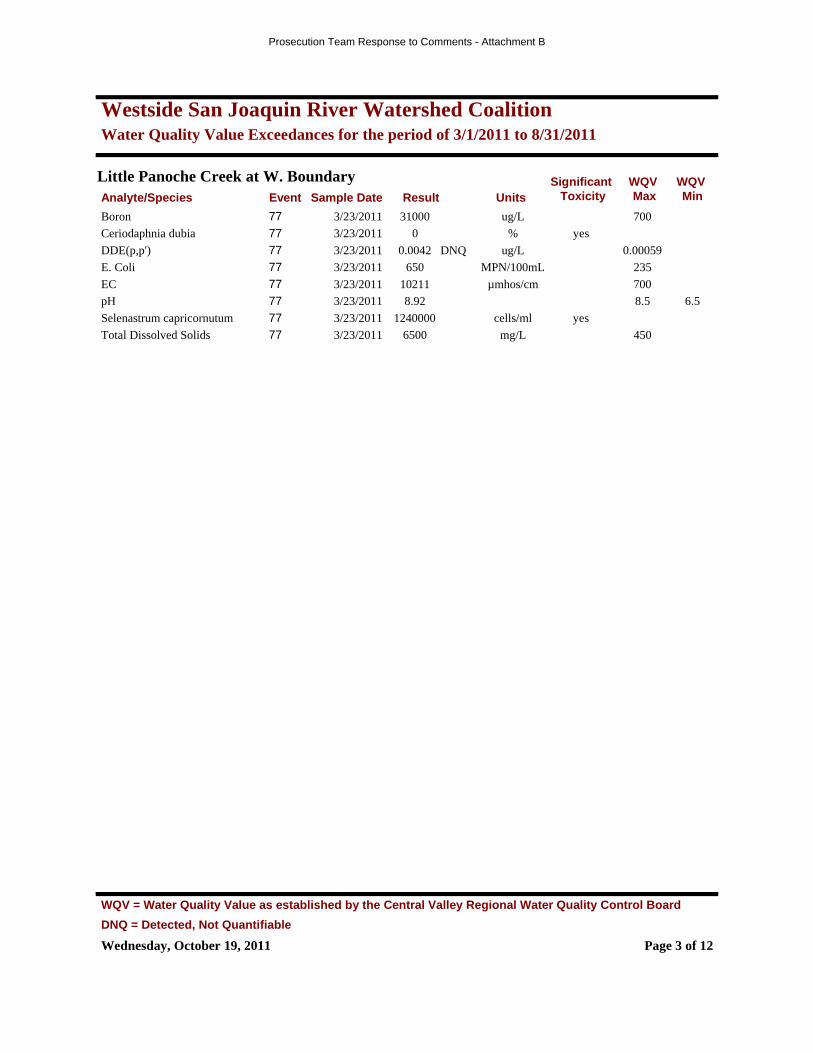
Westside San Joaquin River Watershed CoalitionWater Quality Value Exceedances for the period of 3/1/2011 to 8/31/2011
Little Panoche Creek at W. BoundaryAnalyte/Species Result Units
Significant Toxicity
WQV Max
WQV MinSample DateEvent
Boron 31000 ug/L 7003/23/201177
Ceriodaphnia dubia 0 % yes3/23/201177
DDE(p,p') 0.0042 ug/L 0.000593/23/201177 DNQ
E. Coli 650 MPN/100mL 2353/23/201177
EC 10211 µmhos/cm 7003/23/201177
pH 8.92 8.5 6.53/23/201177
Selenastrum capricornutum 1240000 cells/ml yes3/23/201177
Total Dissolved Solids 6500 mg/L 4503/23/201177
Wednesday, October 19, 2011 Page 3 of 12
WQV = Water Quality Value as established by the Central Valley Regional Water Quality Control Board
DNQ = Detected, Not Quantifiable
Prosecution Team Response to Comments - Attachment B

Westside San Joaquin River Watershed CoalitionWater Quality Value Exceedances for the period of 3/1/2011 to 8/31/2011
Los Banos Creek at China Camp RoadAnalyte/Species Result Units
Significant Toxicity
WQV Max
WQV MinSample DateEvent
Boron 1140 ug/L 7003/8/201177
EC 1426 µmhos/cm 7003/8/201177
Total Dissolved Solids 900 mg/L 4503/8/201177
Boron 1500 ug/L 7004/12/201178
EC 1782 µmhos/cm 7004/12/201178
Flow 0 cfs 0.014/12/201178
Total Dissolved Solids 1100 mg/L 4504/12/201178
Boron 1330 ug/L 7005/10/201179
DO 0.72 mg/l 55/10/201179
EC 2065 µmhos/cm 7005/10/201179
Flow 0 cfs 0.015/10/201179
Total Dissolved Solids 1200 mg/L 4505/10/201179
Boron 1440 ug/L 7006/14/201180
EC 1630 µmhos/cm 7006/14/201180
Flow 0 cfs 0.016/14/201180
Total Dissolved Solids 1000 mg/L 4506/14/201180
Aldrin 0.067 ug/L 0.000137/12/201181 =
Boron 1160 ug/L 7007/12/201181
DO 4.43 mg/l 57/12/201181
E. Coli 920 MPN/100mL 2357/12/201181
EC 1278 µmhos/cm 7007/12/201181
Flow 0 cfs 0.017/12/201181
Total Dissolved Solids 810 mg/L 4507/12/201181
Arsenic 11 ug/L 108/9/201182
Boron 1370 ug/L 7008/9/201182
E. Coli 920 MPN/100mL 2358/9/201182
EC 1467 µmhos/cm 7008/9/201182
Flow 0 cfs 0.018/9/201182
pH 8.56 8.5 6.58/9/201182
Total Dissolved Solids 920 mg/L 4508/9/201182
Wednesday, October 19, 2011 Page 4 of 12
WQV = Water Quality Value as established by the Central Valley Regional Water Quality Control Board
DNQ = Detected, Not Quantifiable
Prosecution Team Response to Comments - Attachment B
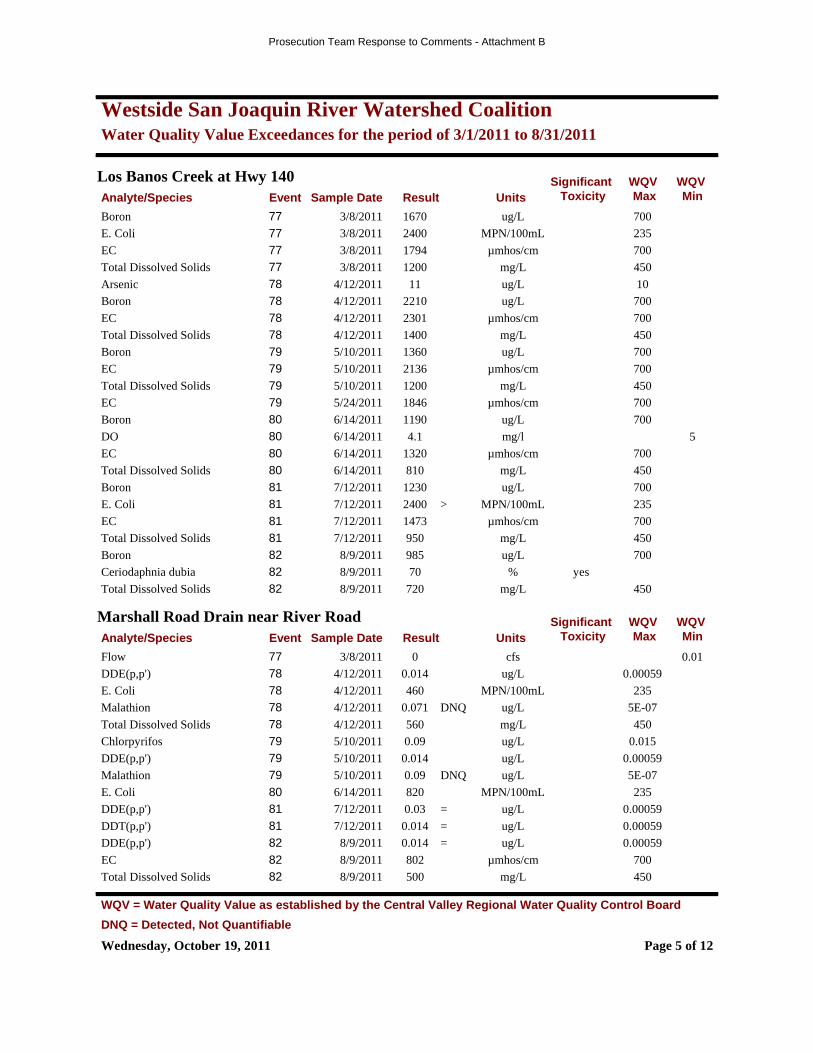
Westside San Joaquin River Watershed CoalitionWater Quality Value Exceedances for the period of 3/1/2011 to 8/31/2011
Los Banos Creek at Hwy 140Analyte/Species Result Units
Significant Toxicity
WQV Max
WQV MinSample DateEvent
Boron 1670 ug/L 7003/8/201177
E. Coli 2400 MPN/100mL 2353/8/201177
EC 1794 µmhos/cm 7003/8/201177
Total Dissolved Solids 1200 mg/L 4503/8/201177
Arsenic 11 ug/L 104/12/201178
Boron 2210 ug/L 7004/12/201178
EC 2301 µmhos/cm 7004/12/201178
Total Dissolved Solids 1400 mg/L 4504/12/201178
Boron 1360 ug/L 7005/10/201179
EC 2136 µmhos/cm 7005/10/201179
Total Dissolved Solids 1200 mg/L 4505/10/201179
EC 1846 µmhos/cm 7005/24/201179
Boron 1190 ug/L 7006/14/201180
DO 4.1 mg/l 56/14/201180
EC 1320 µmhos/cm 7006/14/201180
Total Dissolved Solids 810 mg/L 4506/14/201180
Boron 1230 ug/L 7007/12/201181
E. Coli 2400 MPN/100mL 2357/12/201181 >
EC 1473 µmhos/cm 7007/12/201181
Total Dissolved Solids 950 mg/L 4507/12/201181
Boron 985 ug/L 7008/9/201182
Ceriodaphnia dubia 70 % yes8/9/201182
Total Dissolved Solids 720 mg/L 4508/9/201182
Marshall Road Drain near River RoadAnalyte/Species Result Units
Significant Toxicity
WQV Max
WQV MinSample DateEvent
Flow 0 cfs 0.013/8/201177
DDE(p,p') 0.014 ug/L 0.000594/12/201178
E. Coli 460 MPN/100mL 2354/12/201178
Malathion 0.071 ug/L 5E-074/12/201178 DNQ
Total Dissolved Solids 560 mg/L 4504/12/201178
Chlorpyrifos 0.09 ug/L 0.0155/10/201179
DDE(p,p') 0.014 ug/L 0.000595/10/201179
Malathion 0.09 ug/L 5E-075/10/201179 DNQ
E. Coli 820 MPN/100mL 2356/14/201180
DDE(p,p') 0.03 ug/L 0.000597/12/201181 =
DDT(p,p') 0.014 ug/L 0.000597/12/201181 =
DDE(p,p') 0.014 ug/L 0.000598/9/201182 =
EC 802 µmhos/cm 7008/9/201182
Total Dissolved Solids 500 mg/L 4508/9/201182
Wednesday, October 19, 2011 Page 5 of 12
WQV = Water Quality Value as established by the Central Valley Regional Water Quality Control Board
DNQ = Detected, Not Quantifiable
Prosecution Team Response to Comments - Attachment B
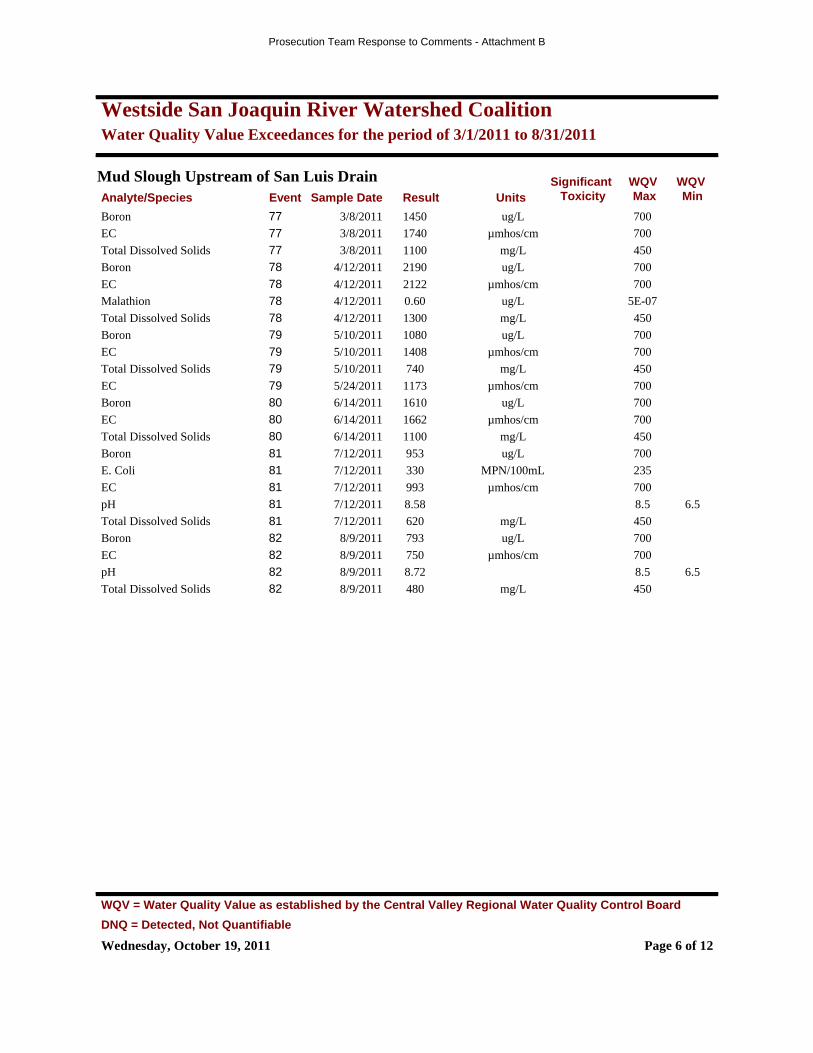
Westside San Joaquin River Watershed CoalitionWater Quality Value Exceedances for the period of 3/1/2011 to 8/31/2011
Mud Slough Upstream of San Luis DrainAnalyte/Species Result Units
Significant Toxicity
WQV Max
WQV MinSample DateEvent
Boron 1450 ug/L 7003/8/201177
EC 1740 µmhos/cm 7003/8/201177
Total Dissolved Solids 1100 mg/L 4503/8/201177
Boron 2190 ug/L 7004/12/201178
EC 2122 µmhos/cm 7004/12/201178
Malathion 0.60 ug/L 5E-074/12/201178
Total Dissolved Solids 1300 mg/L 4504/12/201178
Boron 1080 ug/L 7005/10/201179
EC 1408 µmhos/cm 7005/10/201179
Total Dissolved Solids 740 mg/L 4505/10/201179
EC 1173 µmhos/cm 7005/24/201179
Boron 1610 ug/L 7006/14/201180
EC 1662 µmhos/cm 7006/14/201180
Total Dissolved Solids 1100 mg/L 4506/14/201180
Boron 953 ug/L 7007/12/201181
E. Coli 330 MPN/100mL 2357/12/201181
EC 993 µmhos/cm 7007/12/201181
pH 8.58 8.5 6.57/12/201181
Total Dissolved Solids 620 mg/L 4507/12/201181
Boron 793 ug/L 7008/9/201182
EC 750 µmhos/cm 7008/9/201182
pH 8.72 8.5 6.58/9/201182
Total Dissolved Solids 480 mg/L 4508/9/201182
Wednesday, October 19, 2011 Page 6 of 12
WQV = Water Quality Value as established by the Central Valley Regional Water Quality Control Board
DNQ = Detected, Not Quantifiable
Prosecution Team Response to Comments - Attachment B
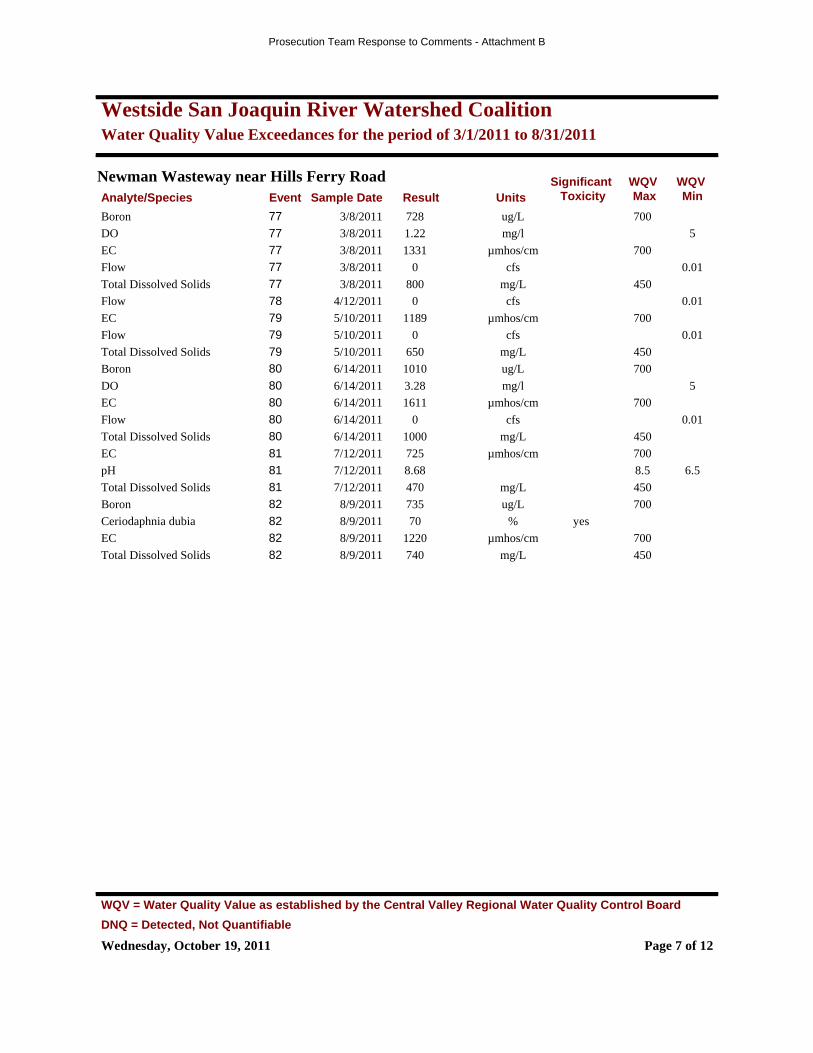
Westside San Joaquin River Watershed CoalitionWater Quality Value Exceedances for the period of 3/1/2011 to 8/31/2011
Newman Wasteway near Hills Ferry RoadAnalyte/Species Result Units
Significant Toxicity
WQV Max
WQV MinSample DateEvent
Boron 728 ug/L 7003/8/201177
DO 1.22 mg/l 53/8/201177
EC 1331 µmhos/cm 7003/8/201177
Flow 0 cfs 0.013/8/201177
Total Dissolved Solids 800 mg/L 4503/8/201177
Flow 0 cfs 0.014/12/201178
EC 1189 µmhos/cm 7005/10/201179
Flow 0 cfs 0.015/10/201179
Total Dissolved Solids 650 mg/L 4505/10/201179
Boron 1010 ug/L 7006/14/201180
DO 3.28 mg/l 56/14/201180
EC 1611 µmhos/cm 7006/14/201180
Flow 0 cfs 0.016/14/201180
Total Dissolved Solids 1000 mg/L 4506/14/201180
EC 725 µmhos/cm 7007/12/201181
pH 8.68 8.5 6.57/12/201181
Total Dissolved Solids 470 mg/L 4507/12/201181
Boron 735 ug/L 7008/9/201182
Ceriodaphnia dubia 70 % yes8/9/201182
EC 1220 µmhos/cm 7008/9/201182
Total Dissolved Solids 740 mg/L 4508/9/201182
Wednesday, October 19, 2011 Page 7 of 12
WQV = Water Quality Value as established by the Central Valley Regional Water Quality Control Board
DNQ = Detected, Not Quantifiable
Prosecution Team Response to Comments - Attachment B

Westside San Joaquin River Watershed CoalitionWater Quality Value Exceedances for the period of 3/1/2011 to 8/31/2011
Orestimba Creek at Hwy 33Analyte/Species Result Units
Significant Toxicity
WQV Max
WQV MinSample DateEvent
DDE(p,p') 0.0076 ug/L 0.000593/8/201177 DNQ
DDE(p,p') 0.0063 ug/L 0.000594/12/201178 DNQ
DDE(p,p') 0.021 ug/L 0.000595/10/201179
DO 2.1 mg/l 55/10/201179
E. Coli 580 MPN/100mL 2355/10/201179
Flow 0 cfs 0.015/10/201179
DDE(p,p') 0.015 ug/L 0.000596/14/201180
E. Coli 1000 MPN/100mL 2356/14/201180
DDE(p,p') 0.02 ug/L 0.000597/12/201181 =
DDT(p,p') 0.0093 ug/L 0.000597/12/201181 DNQ
E. Coli 490 MPN/100mL 2357/12/201181
DDE(p,p') 0.086 ug/L 0.000598/9/201182 =
DDT(p,p') 0.041 ug/L 0.000598/9/201182 =
DO 4.29 mg/l 58/9/201182
E. Coli 2400 MPN/100mL 2358/9/201182 >
Flow 0 cfs 0.018/9/201182
Toxaphene 0.50 ug/L 0.00028/9/201182 =
Orestimba Creek at River RoadAnalyte/Species Result Units
Significant Toxicity
WQV Max
WQV MinSample DateEvent
Ceriodaphnia dubia 80 % yes3/8/201177
DDE(p,p') 0.0053 ug/L 0.000593/8/201177 DNQ
E. Coli 460 MPN/100mL 2353/8/201177
Chlorpyrifos 0.068 ug/L 0.0154/12/201178
DDE(p,p') 0.0073 ug/L 0.000594/12/201178 DNQ
Chlorpyrifos 0.054 ug/L 0.0155/10/201179
DDE(p,p') 0.022 ug/L 0.000595/10/201179
E. Coli 390 MPN/100mL 2355/10/201179
EC 758 µmhos/cm 7005/24/201179
E. Coli 520 MPN/100mL 2356/14/201180
EC 752 µmhos/cm 7006/14/201180
Total Dissolved Solids 520 mg/L 4506/14/201180
DDE(p,p') 0.013 ug/L 0.000597/12/201181 =
E. Coli 1400 MPN/100mL 2357/12/201181
DDE(p,p') 0.024 ug/L 0.000598/9/201182 =
DDT(p,p') 0.0098 ug/L 0.000598/9/201182 DNQ
Wednesday, October 19, 2011 Page 8 of 12
WQV = Water Quality Value as established by the Central Valley Regional Water Quality Control Board
DNQ = Detected, Not Quantifiable
Prosecution Team Response to Comments - Attachment B

Westside San Joaquin River Watershed CoalitionWater Quality Value Exceedances for the period of 3/1/2011 to 8/31/2011
Poso Slough at Indiana AveAnalyte/Species Result Units
Significant Toxicity
WQV Max
WQV MinSample DateEvent
Diuron 3.8 ug/L 23/8/201177
EC 846 µmhos/cm 7003/8/201177
Total Dissolved Solids 540 mg/L 4503/8/201177
E. Coli 260 MPN/100mL 2354/12/201178
EC 1617 µmhos/cm 7004/12/201178
Total Dissolved Solids 1100 mg/L 4504/12/201178
E. Coli 2400 MPN/100mL 2355/10/201179 >=
EC 1051 µmhos/cm 7005/10/201179
Total Dissolved Solids 510 mg/L 4505/10/201179
EC 1021 µmhos/cm 7005/24/201179
Hyalella azteca 87.5 % yes5/24/201179
Arsenic 13 ug/L 106/14/201180
DDE(p,p') 0.0044 ug/L 0.000596/14/201180 DNQ
E. Coli 520 MPN/100mL 2356/14/201180
E. Coli 520 MPN/100mL 2357/12/201181
Ceriodaphnia dubia 0 % yes8/9/201182
Chlorpyrifos 1.3 ug/L 0.0158/9/201182 =
Wednesday, October 19, 2011 Page 9 of 12
WQV = Water Quality Value as established by the Central Valley Regional Water Quality Control Board
DNQ = Detected, Not Quantifiable
Prosecution Team Response to Comments - Attachment B
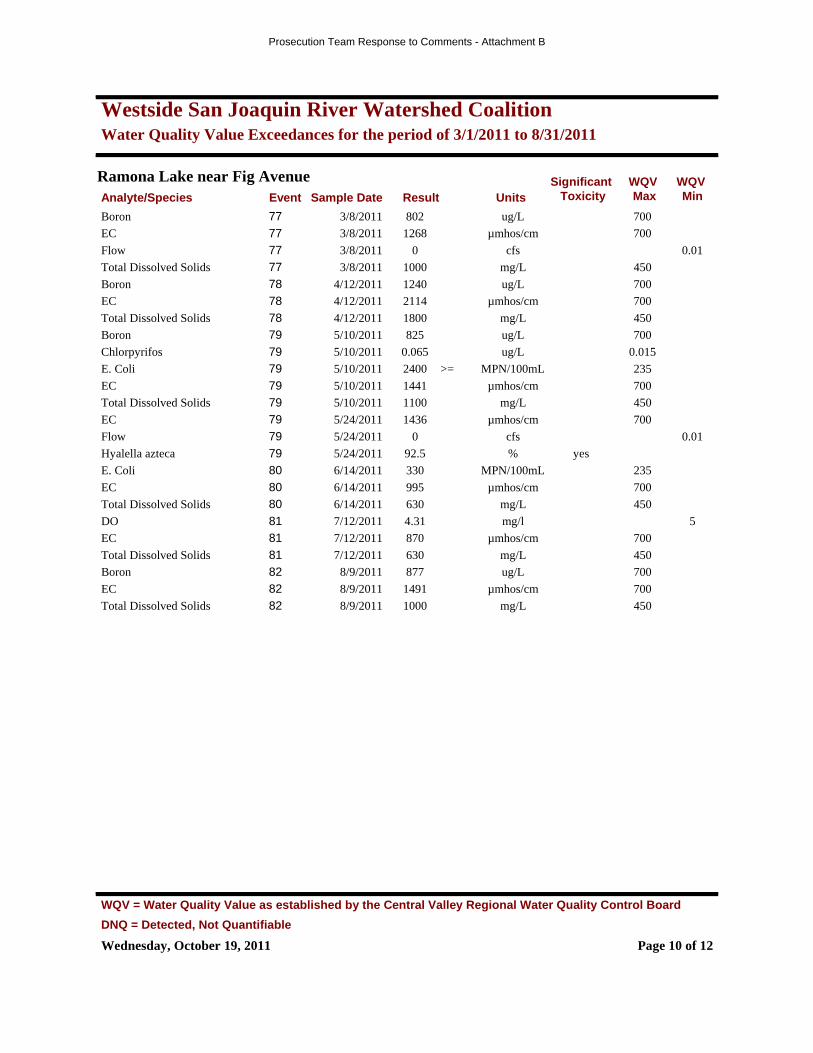
Westside San Joaquin River Watershed CoalitionWater Quality Value Exceedances for the period of 3/1/2011 to 8/31/2011
Ramona Lake near Fig AvenueAnalyte/Species Result Units
Significant Toxicity
WQV Max
WQV MinSample DateEvent
Boron 802 ug/L 7003/8/201177
EC 1268 µmhos/cm 7003/8/201177
Flow 0 cfs 0.013/8/201177
Total Dissolved Solids 1000 mg/L 4503/8/201177
Boron 1240 ug/L 7004/12/201178
EC 2114 µmhos/cm 7004/12/201178
Total Dissolved Solids 1800 mg/L 4504/12/201178
Boron 825 ug/L 7005/10/201179
Chlorpyrifos 0.065 ug/L 0.0155/10/201179
E. Coli 2400 MPN/100mL 2355/10/201179 >=
EC 1441 µmhos/cm 7005/10/201179
Total Dissolved Solids 1100 mg/L 4505/10/201179
EC 1436 µmhos/cm 7005/24/201179
Flow 0 cfs 0.015/24/201179
Hyalella azteca 92.5 % yes5/24/201179
E. Coli 330 MPN/100mL 2356/14/201180
EC 995 µmhos/cm 7006/14/201180
Total Dissolved Solids 630 mg/L 4506/14/201180
DO 4.31 mg/l 57/12/201181
EC 870 µmhos/cm 7007/12/201181
Total Dissolved Solids 630 mg/L 4507/12/201181
Boron 877 ug/L 7008/9/201182
EC 1491 µmhos/cm 7008/9/201182
Total Dissolved Solids 1000 mg/L 4508/9/201182
Wednesday, October 19, 2011 Page 10 of 12
WQV = Water Quality Value as established by the Central Valley Regional Water Quality Control Board
DNQ = Detected, Not Quantifiable
Prosecution Team Response to Comments - Attachment B
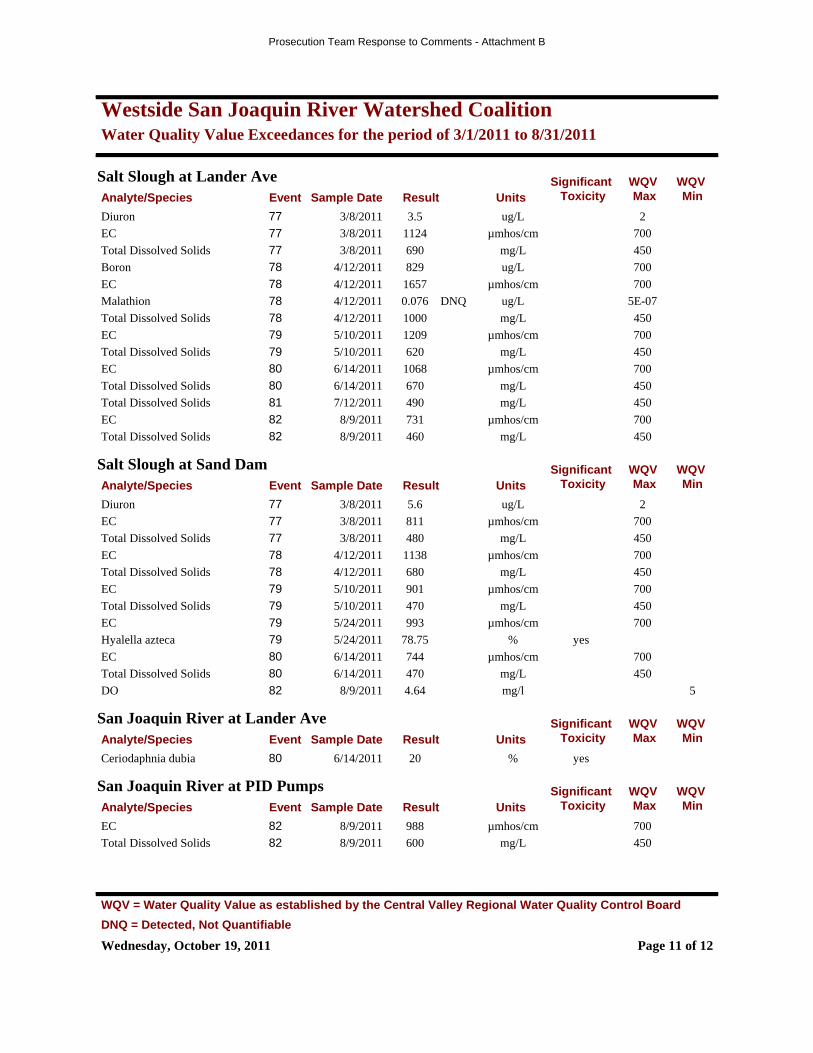
Westside San Joaquin River Watershed CoalitionWater Quality Value Exceedances for the period of 3/1/2011 to 8/31/2011
Salt Slough at Lander AveAnalyte/Species Result Units
Significant Toxicity
WQV Max
WQV MinSample DateEvent
Diuron 3.5 ug/L 23/8/201177
EC 1124 µmhos/cm 7003/8/201177
Total Dissolved Solids 690 mg/L 4503/8/201177
Boron 829 ug/L 7004/12/201178
EC 1657 µmhos/cm 7004/12/201178
Malathion 0.076 ug/L 5E-074/12/201178 DNQ
Total Dissolved Solids 1000 mg/L 4504/12/201178
EC 1209 µmhos/cm 7005/10/201179
Total Dissolved Solids 620 mg/L 4505/10/201179
EC 1068 µmhos/cm 7006/14/201180
Total Dissolved Solids 670 mg/L 4506/14/201180
Total Dissolved Solids 490 mg/L 4507/12/201181
EC 731 µmhos/cm 7008/9/201182
Total Dissolved Solids 460 mg/L 4508/9/201182
Salt Slough at Sand DamAnalyte/Species Result Units
Significant Toxicity
WQV Max
WQV MinSample DateEvent
Diuron 5.6 ug/L 23/8/201177
EC 811 µmhos/cm 7003/8/201177
Total Dissolved Solids 480 mg/L 4503/8/201177
EC 1138 µmhos/cm 7004/12/201178
Total Dissolved Solids 680 mg/L 4504/12/201178
EC 901 µmhos/cm 7005/10/201179
Total Dissolved Solids 470 mg/L 4505/10/201179
EC 993 µmhos/cm 7005/24/201179
Hyalella azteca 78.75 % yes5/24/201179
EC 744 µmhos/cm 7006/14/201180
Total Dissolved Solids 470 mg/L 4506/14/201180
DO 4.64 mg/l 58/9/201182
San Joaquin River at Lander AveAnalyte/Species Result Units
Significant Toxicity
WQV Max
WQV MinSample DateEvent
Ceriodaphnia dubia 20 % yes6/14/201180
San Joaquin River at PID PumpsAnalyte/Species Result Units
Significant Toxicity
WQV Max
WQV MinSample DateEvent
EC 988 µmhos/cm 7008/9/201182
Total Dissolved Solids 600 mg/L 4508/9/201182
Wednesday, October 19, 2011 Page 11 of 12
WQV = Water Quality Value as established by the Central Valley Regional Water Quality Control Board
DNQ = Detected, Not Quantifiable
Prosecution Team Response to Comments - Attachment B
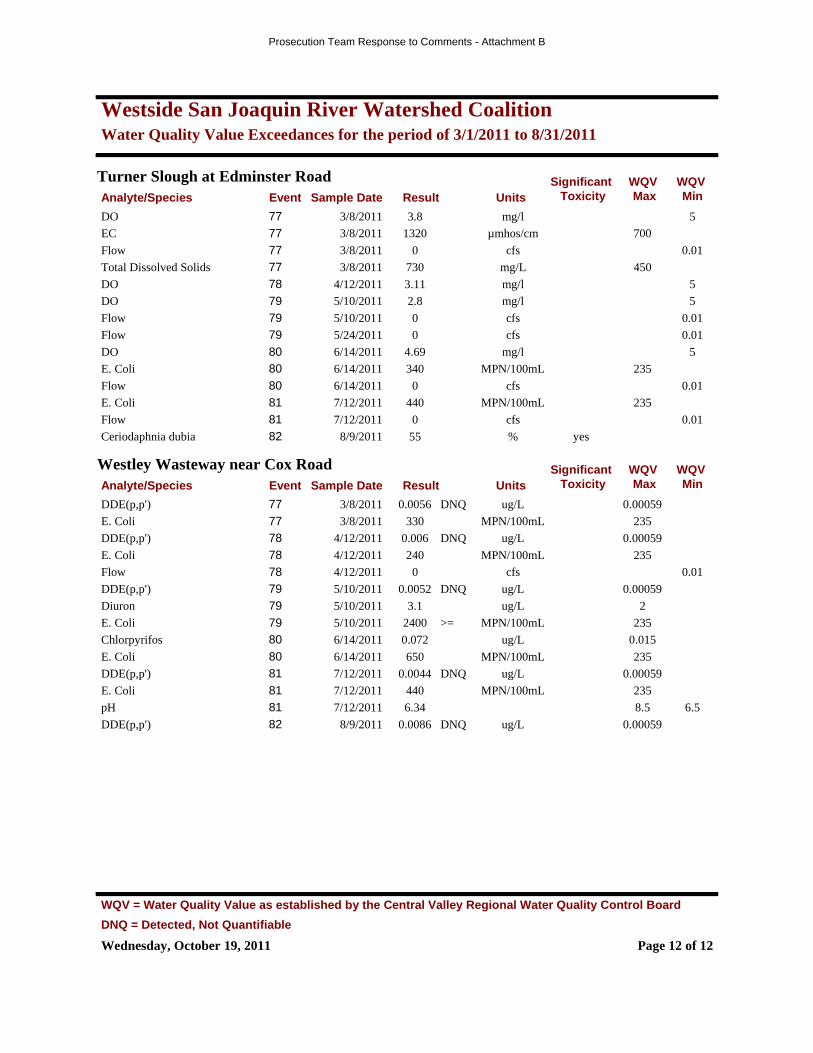
Westside San Joaquin River Watershed CoalitionWater Quality Value Exceedances for the period of 3/1/2011 to 8/31/2011
Turner Slough at Edminster RoadAnalyte/Species Result Units
Significant Toxicity
WQV Max
WQV MinSample DateEvent
DO 3.8 mg/l 53/8/201177
EC 1320 µmhos/cm 7003/8/201177
Flow 0 cfs 0.013/8/201177
Total Dissolved Solids 730 mg/L 4503/8/201177
DO 3.11 mg/l 54/12/201178
DO 2.8 mg/l 55/10/201179
Flow 0 cfs 0.015/10/201179
Flow 0 cfs 0.015/24/201179
DO 4.69 mg/l 56/14/201180
E. Coli 340 MPN/100mL 2356/14/201180
Flow 0 cfs 0.016/14/201180
E. Coli 440 MPN/100mL 2357/12/201181
Flow 0 cfs 0.017/12/201181
Ceriodaphnia dubia 55 % yes8/9/201182
Westley Wasteway near Cox RoadAnalyte/Species Result Units
Significant Toxicity
WQV Max
WQV MinSample DateEvent
DDE(p,p') 0.0056 ug/L 0.000593/8/201177 DNQ
E. Coli 330 MPN/100mL 2353/8/201177
DDE(p,p') 0.006 ug/L 0.000594/12/201178 DNQ
E. Coli 240 MPN/100mL 2354/12/201178
Flow 0 cfs 0.014/12/201178
DDE(p,p') 0.0052 ug/L 0.000595/10/201179 DNQ
Diuron 3.1 ug/L 25/10/201179
E. Coli 2400 MPN/100mL 2355/10/201179 >=
Chlorpyrifos 0.072 ug/L 0.0156/14/201180
E. Coli 650 MPN/100mL 2356/14/201180
DDE(p,p') 0.0044 ug/L 0.000597/12/201181 DNQ
E. Coli 440 MPN/100mL 2357/12/201181
pH 6.34 8.5 6.57/12/201181
DDE(p,p') 0.0086 ug/L 0.000598/9/201182 DNQ
Wednesday, October 19, 2011 Page 12 of 12
WQV = Water Quality Value as established by the Central Valley Regional Water Quality Control Board
DNQ = Detected, Not Quantifiable
Prosecution Team Response to Comments - Attachment B

Westside San Joaquin River Semi-Annual Report Watershed Coalition June 15, 2011
Attachment 6 Management Plan Activities
Prosecution Team Response to Comments - Attachment B
San Joaquin Valley Drainage Authority
Westside San Joaquin River Watershed Coalition
Hospital and Ingram Creek Focused Watershed Plan Westley Wasteway, Del Puerto Creek, and Orestimba Creek Focused Watershed Plan
Salt Slough Focused Watershed Plan (Draft)
Status Report November 30, 2011
Prepared by: Summers Engineering, Inc.
Consulting Engineers Hanford California
Prosecution Team Response to Comments - Attachment B
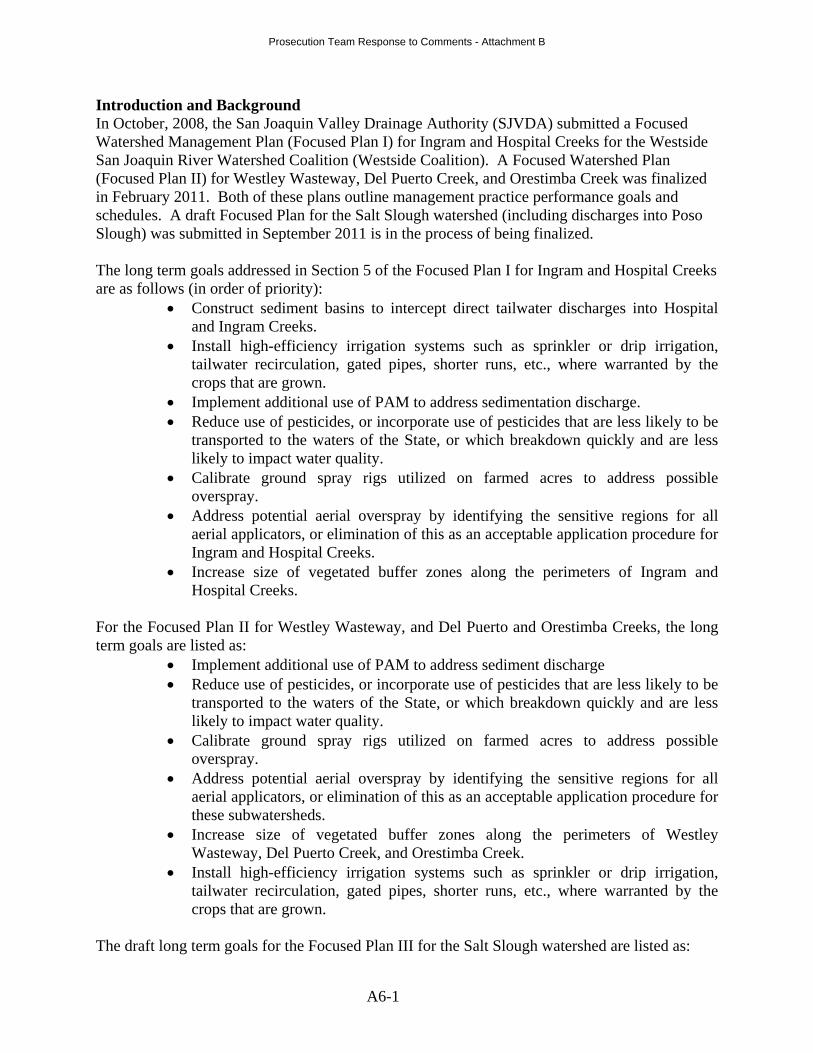
A6-1
Introduction and Background In October, 2008, the San Joaquin Valley Drainage Authority (SJVDA) submitted a Focused Watershed Management Plan (Focused Plan I) for Ingram and Hospital Creeks for the Westside San Joaquin River Watershed Coalition (Westside Coalition). A Focused Watershed Plan (Focused Plan II) for Westley Wasteway, Del Puerto Creek, and Orestimba Creek was finalized in February 2011. Both of these plans outline management practice performance goals and schedules. A draft Focused Plan for the Salt Slough watershed (including discharges into Poso Slough) was submitted in September 2011 is in the process of being finalized. The long term goals addressed in Section 5 of the Focused Plan I for Ingram and Hospital Creeks are as follows (in order of priority):
Construct sediment basins to intercept direct tailwater discharges into Hospital and Ingram Creeks.
Install high-efficiency irrigation systems such as sprinkler or drip irrigation, tailwater recirculation, gated pipes, shorter runs, etc., where warranted by the crops that are grown.
Implement additional use of PAM to address sedimentation discharge. Reduce use of pesticides, or incorporate use of pesticides that are less likely to be
transported to the waters of the State, or which breakdown quickly and are less likely to impact water quality.
Calibrate ground spray rigs utilized on farmed acres to address possible overspray.
Address potential aerial overspray by identifying the sensitive regions for all aerial applicators, or elimination of this as an acceptable application procedure for Ingram and Hospital Creeks.
Increase size of vegetated buffer zones along the perimeters of Ingram and Hospital Creeks.
For the Focused Plan II for Westley Wasteway, and Del Puerto and Orestimba Creeks, the long term goals are listed as:
Implement additional use of PAM to address sediment discharge Reduce use of pesticides, or incorporate use of pesticides that are less likely to be
transported to the waters of the State, or which breakdown quickly and are less likely to impact water quality.
Calibrate ground spray rigs utilized on farmed acres to address possible overspray.
Address potential aerial overspray by identifying the sensitive regions for all aerial applicators, or elimination of this as an acceptable application procedure for these subwatersheds.
Increase size of vegetated buffer zones along the perimeters of Westley Wasteway, Del Puerto Creek, and Orestimba Creek.
Install high-efficiency irrigation systems such as sprinkler or drip irrigation, tailwater recirculation, gated pipes, shorter runs, etc., where warranted by the crops that are grown.
The draft long term goals for the Focused Plan III for the Salt Slough watershed are listed as:
Prosecution Team Response to Comments - Attachment B
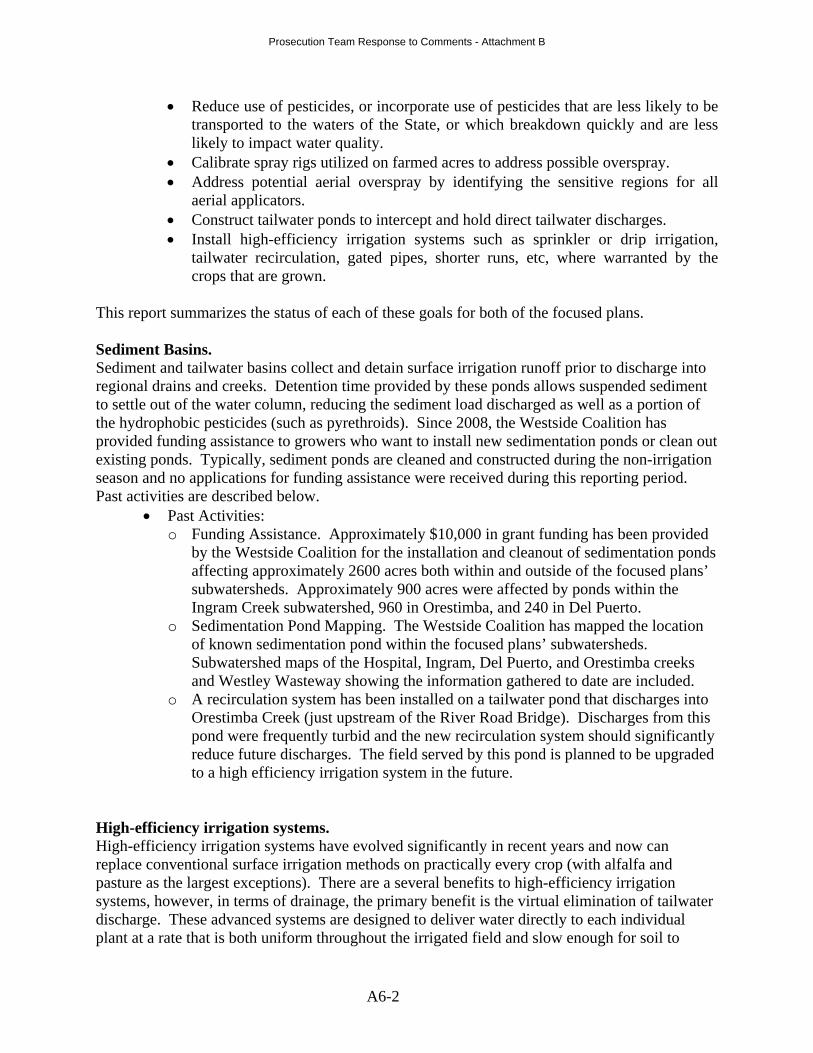
A6-2
Reduce use of pesticides, or incorporate use of pesticides that are less likely to be transported to the waters of the State, or which breakdown quickly and are less likely to impact water quality.
Calibrate spray rigs utilized on farmed acres to address possible overspray. Address potential aerial overspray by identifying the sensitive regions for all
aerial applicators. Construct tailwater ponds to intercept and hold direct tailwater discharges. Install high-efficiency irrigation systems such as sprinkler or drip irrigation,
tailwater recirculation, gated pipes, shorter runs, etc, where warranted by the crops that are grown.
This report summarizes the status of each of these goals for both of the focused plans. Sediment Basins. Sediment and tailwater basins collect and detain surface irrigation runoff prior to discharge into regional drains and creeks. Detention time provided by these ponds allows suspended sediment to settle out of the water column, reducing the sediment load discharged as well as a portion of the hydrophobic pesticides (such as pyrethroids). Since 2008, the Westside Coalition has provided funding assistance to growers who want to install new sedimentation ponds or clean out existing ponds. Typically, sediment ponds are cleaned and constructed during the non-irrigation season and no applications for funding assistance were received during this reporting period. Past activities are described below.
Past Activities: o Funding Assistance. Approximately $10,000 in grant funding has been provided
by the Westside Coalition for the installation and cleanout of sedimentation ponds affecting approximately 2600 acres both within and outside of the focused plans’ subwatersheds. Approximately 900 acres were affected by ponds within the Ingram Creek subwatershed, 960 in Orestimba, and 240 in Del Puerto.
o Sedimentation Pond Mapping. The Westside Coalition has mapped the location of known sedimentation pond within the focused plans’ subwatersheds. Subwatershed maps of the Hospital, Ingram, Del Puerto, and Orestimba creeks and Westley Wasteway showing the information gathered to date are included.
o A recirculation system has been installed on a tailwater pond that discharges into Orestimba Creek (just upstream of the River Road Bridge). Discharges from this pond were frequently turbid and the new recirculation system should significantly reduce future discharges. The field served by this pond is planned to be upgraded to a high efficiency irrigation system in the future.
High-efficiency irrigation systems. High-efficiency irrigation systems have evolved significantly in recent years and now can replace conventional surface irrigation methods on practically every crop (with alfalfa and pasture as the largest exceptions). There are a several benefits to high-efficiency irrigation systems, however, in terms of drainage, the primary benefit is the virtual elimination of tailwater discharge. These advanced systems are designed to deliver water directly to each individual plant at a rate that is both uniform throughout the irrigated field and slow enough for soil to
Prosecution Team Response to Comments - Attachment B

A6-3
absorb, resulting in almost no surface runoff. Additionally, these systems allow for the direct application of fertilizer and other chemicals through the drip hoses (a process called fertigation). High-efficiency irrigation systems require a significant financial investment on the part of the grower (generally $1,000 to $2,000 per acre). The acreage of high-efficiency irrigation systems continues to increase within the Westside Coalition. The Coalition is in the process of mapping the fields with these systems within the focused plans’ subwatersheds. Management Practice Surveys have provided some detail on the usage of high efficiency irrigation systems. Table A6-1 shows the acreage (and percent of irrigated acreage) of these irrigation systems by watershed, based on the most recent management practice surveys within each watershed.
Table A6-1: High Efficiency Irrigation Systems by Subwatershed. Subwatershed Acreage Percent of Irrigated
Acreage Hospital Creek 3515 68% Ingram Creek 927 17% Westley Wasteway 2891 63% Del Puerto Creek 3934 50% Orestimba Creek 5821 50%
Based on information provided by individual districts, the acreage of high efficiency irrigation systems has increased by approximately 6000 acres. Because this increase was reported on a district scale, the geographic distribution is not known. However, based on the location of these districts, the approximate breakdown between subwatershed can be estimated:
Hospital/Ingram: 600 acres Westley/Del Puerto/Orestimba: 1100 acres Salt Slough (including Poso Slough): 4200 acres
PAM Usage. PAM is a flocculating agent added to irrigation or drain water. When added to drain water with high suspended solids, PAM binds the suspended sediment materials together into larger particles which then settle out of the water column. When added to the irrigation water, PAM prevents the suspension of soil as the water travels down the furrow.
Prosecution Team Response to Comments - Attachment B
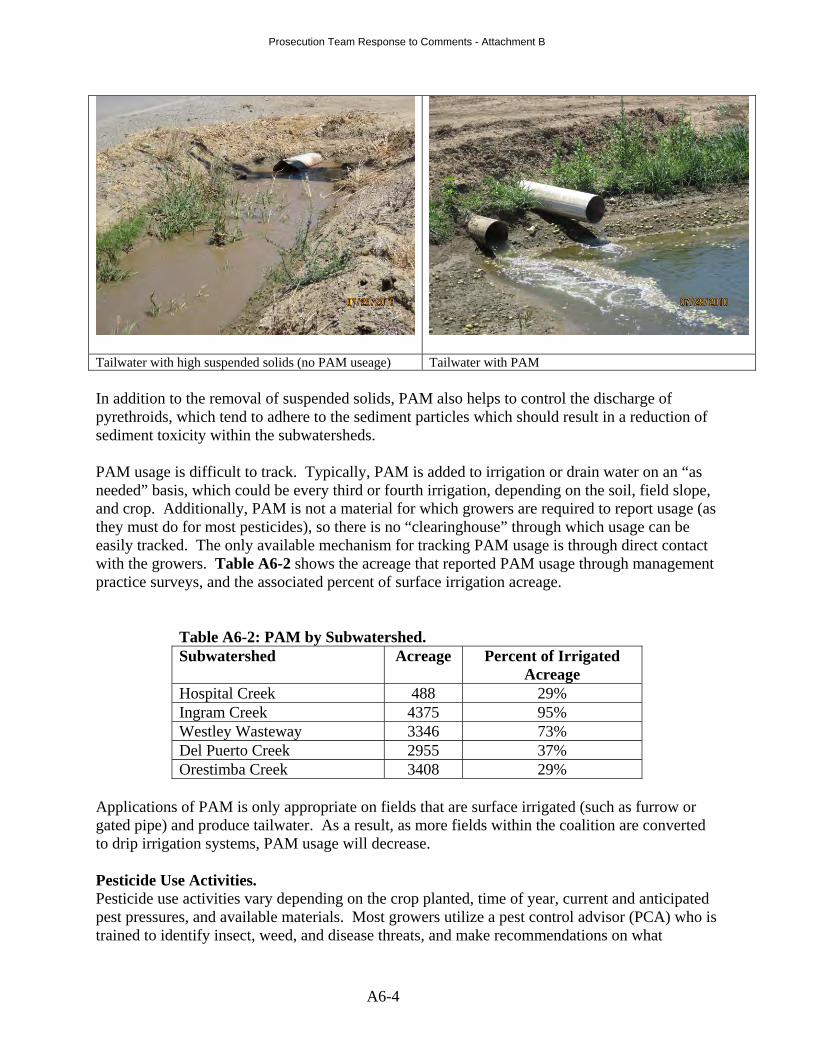
A6-4
Tailwater with high suspended solids (no PAM useage) Tailwater with PAM
In addition to the removal of suspended solids, PAM also helps to control the discharge of pyrethroids, which tend to adhere to the sediment particles which should result in a reduction of sediment toxicity within the subwatersheds. PAM usage is difficult to track. Typically, PAM is added to irrigation or drain water on an “as needed” basis, which could be every third or fourth irrigation, depending on the soil, field slope, and crop. Additionally, PAM is not a material for which growers are required to report usage (as they must do for most pesticides), so there is no “clearinghouse” through which usage can be easily tracked. The only available mechanism for tracking PAM usage is through direct contact with the growers. Table A6-2 shows the acreage that reported PAM usage through management practice surveys, and the associated percent of surface irrigation acreage.
Table A6-2: PAM by Subwatershed. Subwatershed Acreage Percent of Irrigated
Acreage Hospital Creek 488 29% Ingram Creek 4375 95% Westley Wasteway 3346 73% Del Puerto Creek 2955 37% Orestimba Creek 3408 29%
Applications of PAM is only appropriate on fields that are surface irrigated (such as furrow or gated pipe) and produce tailwater. As a result, as more fields within the coalition are converted to drip irrigation systems, PAM usage will decrease. Pesticide Use Activities. Pesticide use activities vary depending on the crop planted, time of year, current and anticipated pest pressures, and available materials. Most growers utilize a pest control advisor (PCA) who is trained to identify insect, weed, and disease threats, and make recommendations on what
Prosecution Team Response to Comments - Attachment B

A6-5
material(s) should be applied and what cultural practices should be implemented. It should be noted that pesticides are applied in reaction to actual pest pressures and the material selected to target specific pests. During the irrigation season, pesticide applications include herbicides and pesticides to control pest pressures. Applications can be made with conventional ground sprayers on booms, air-blast spray rigs, and aerial applications according to specific need of the field being treated. See Section 4 of the June 15, 2011 Semi-Annual Monitoring Report. During July of 2010, 12 exceedance of chlorpyrifos were measured throughout the Westside Coalition (see the November 2010 SAMR). Although none of these exceedances were associated with aquatic toxicity, the Westside Coalition is working aggressively to increase awareness and encourage growers to implement management practices to avoid future exceedances. These activities included a number meeting and workshops (addressed both to growers and PCAs) and a newsletter distributed throughout the coalition. In May of 2011, five chlorpyrifos exceedances were measured in the northerly region of the coalition, prompting additional outreach activities. A letter was circulated in June and July to coalition members to highlight the exceedances and individual “tailgate” visits were made with growers within the watersheds that measured exceedances in May. The tailgate visits included a discussion of the water quality issues and a review of the individual growers management practices. Over 140 parcels were reviewed during the tailgate visits. Pesticide Use Reports The Westside Coalition gathers data from pesticide use reports (PUR) on a quarterly basis from the Agricultural Commissioner’s office in Fresno, Merced, Madera, Stanislaus, and San Joaquin counties. This data is imported into a relational database for analysis. As a tool for general review and trend tracking, the PUR data can provide useful insight. This data will indicate which pesticides are being applied and on what crops. When compared to previous PUR data, pesticide use trends can be evaluated for increase/decrease in use, crop use trends, or time of year of application. As of the submittal date of this report, PUR data for Fresno, Merced, and Stanislaus counties was available through June 2011. Calibrate Ground Spray Rigs to Address Overspray In addition to stressing proper spray applications near waterways in group and individual grower meetings, the Westside Coalition has contracted with CURES to provide a trained sprayer calibration technician and a high-tech instrument for calibrating orchard sprayers for members operating near priority waterways. Members targeted for the calibrations are being identified using mapping of priority watersheds and identification of orchard crops adjacent to the waterways. The calibration instrument is composed of two separate devices: one device connects to each spray nozzle to measure nozzle output; the other device is a 12 foot tall simulated tree that collects spray as the sprayer is operated and measures the spray deposition pattern. The calibration instrument and technician will work to optimize sprayer efficiency with landowners and their sprayer operators who are located adjacent to priority watersheds. This will be accomplished through:
Prosecution Team Response to Comments - Attachment B
A6-6
Measuring the output of each nozzle and comparing the output to manufacturer’s specifications;
Identify and help the grower clean or replace worn or clogged nozzles as needed; Measure uniformity of discharge; Help customize the spray pattern based on the grower’s tree shape and size; Identify problems, if they exist, with pump capacity; Provide growers with a computer printout indicating total output, individual nozzle
output, uniformity across the spray boom and spray distribution on the tree canopy. Materials published by CURES with information on appropriate management practices for addressing spray drift in orchards will also be made available to growers participating in the sprayer calibrations. The chlorpyrifos exceedances measured in May caused the Westside Coalition to focus it’s efforts on an aggressive outreach campaign and sprayer calibration appointments were postponed to the non-irrigation season. Address Potential Aerial Overspray and Identify Sensitive Regions In May of 2009, the Westside Coalition circulated a subwatershed map of Ingram and Hospital Creeks along with a memo to aerial applicators, PCAs, and growers. The memo discussed the pesticide water quality issues for both creeks. Some feedback from aerial applicators was received in response to the memo. The feedback included some of the management practices both aerial and ground applicators should implement to reduce drift. Similar maps and information for Westley Wasteway, Del Puerto Creek, and Orestimba Creek have been developed and are being circulated. Vegetated Buffer Zones along Creek Perimeters. Vegetated buffer zones are intended to provide unfarmed space between the edge of a field and the creek. Conceptually, the buffer zone would reduce the amount of pesticides drifting into the creeks. The Westside Coalition is in the process of identifying buffer zones along the focused plans’ targeted water ways. Ingram Creek. Along most of its length, a field road (approximately 20 feet wide) separated the farmed fields from Ingram Creek but there are no apparent vegetated buffers. Hospital Creek. Hospital Creek transitions from an open channel into a buried pipe a Highway 33, and remains a buried pipe until River Road. For this portion of the creek, a vegetated buffer is not an applicable management practice. There were no vegetated buffers encountered upstream of Highway 33, however a significant buffer exists on the north side of Hospital Creek approximately 0.6 miles downstream of River Road. Westley Wasteway. There is an un-farmed buffer zone approximately 75 feet wide on the north side of the Westley Wasteway for its entire length and is covered by native vegetation. This zone is created by a high-voltage transmission line the parallels the alignment. The south side of the wasteway is border by an un-farmed zone that ranges from 50 feet to 150 feet.
Prosecution Team Response to Comments - Attachment B
A6-7
Del Puerto Creek. An aerial reconnaissance of Del Puerto Creek (via Google Earth) indicates that the creek has several segments bounded by vegetated buffers or other unfarmed zones. The Westside Coalition is in the process of mapping these buffers and will provided updated maps when they are available. Orestimba Creek. An aerial reconnaissance of Orestimba Creek (via Google Earth) indicates that the creek has several segments bounded by vegetated buffers or other unfarmed zones. The Westside Coalition is in the process of mapping these buffers and will provided updated maps when they are available. Management Practice Surveys. Management practice surveys (surveys) were circulated throughout the Ingram and Hospital Creek subwatersheds (Focused Plan I Surveys) in 2009 and in the Focused Plan II subwatersheds during the summer of 2010. The Focused Plan I surveys were completed and submitted by 100% of the growers within these subwatersheds and the results were reported to the Regional Board on October 5, 2009 and in the November 2009 SAMR. Surveys for the Focused Plan II subwatersheds began circulation in the Fall of 2010, the last of which were received in June of 2011 (more than 500 parcels were surveyed). In total, these surveys represent management and cultural practices on more than 44,000 acres. The Focused Plan III surveys are in the process of being circulated. The surveys provided a detailed snapshot of the activities growers were implementing at the time of the survey. The ability to correlate management practice changes to water quality changes will be dependant upon the specific management activities implemented and their breadth of implementation. For example, increases in the acreage of high efficiency irrigation systems would be expected to result in an overall decrease in runoff and increased use of PAM would be expected to result in an improvement in turbidity and reduction in sediment discharge, as well as possibly an improvement in sediment toxicity. In contrast, an increase in high efficiency irrigation systems may result in a reduction in PAM usage since these two practices are exclusive of each other. It should be noted that a variety of management practices with overlapping impacts are likely to be implemented in any give subwatershed. This reality will complicate the evaluation of management practice implementation and make it virtually impossible to correlate any single practice with a given change in water quality. The Westside Coalition intends to correlate water quality improvements to implemented management practices as a group. A summary of the survey results for the Focused Plan 2 watersheds are provided in Table A6-3. These were originally presented in the June 2011 SAMR.
Prosecution Team Response to Comments - Attachment B
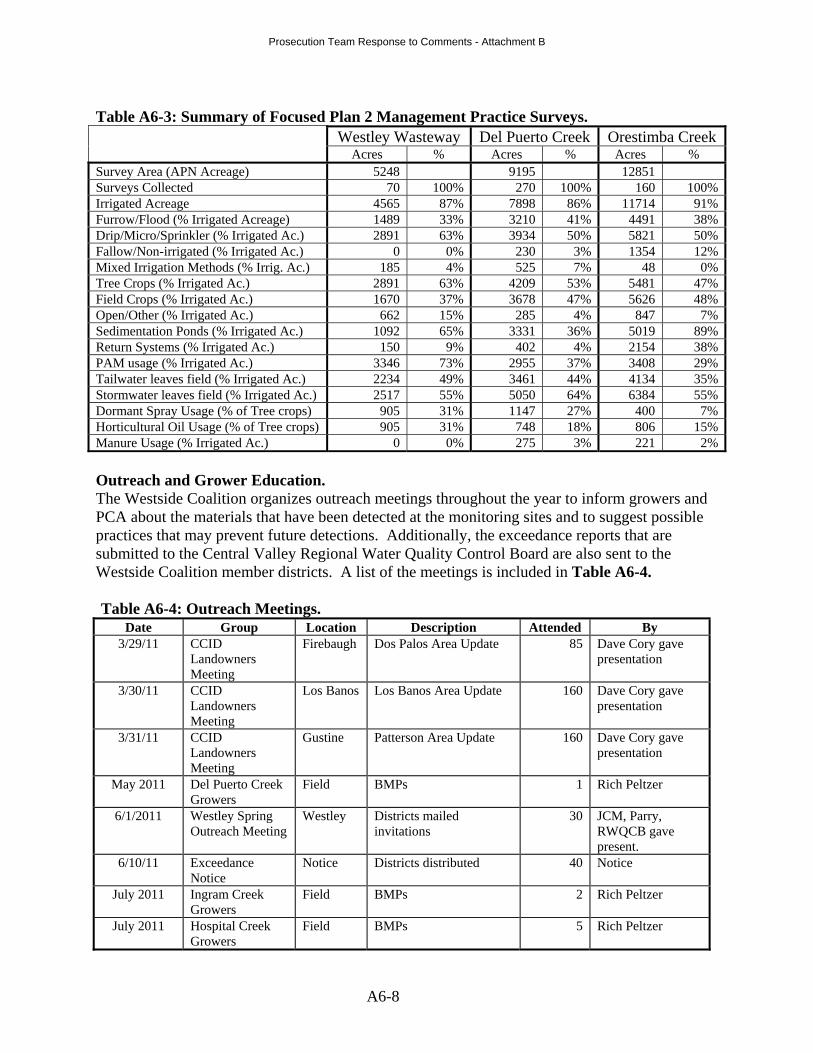
A6-8
Outreach and Grower Education. The Westside Coalition organizes outreach meetings throughout the year to inform growers and PCA about the materials that have been detected at the monitoring sites and to suggest possible practices that may prevent future detections. Additionally, the exceedance reports that are submitted to the Central Valley Regional Water Quality Control Board are also sent to the Westside Coalition member districts. A list of the meetings is included in Table A6-4. Table A6-4: Outreach Meetings.
Date Group Location Description Attended By 3/29/11 CCID
Landowners Meeting
Firebaugh Dos Palos Area Update 85 Dave Cory gave presentation
3/30/11 CCID Landowners Meeting
Los Banos Los Banos Area Update 160 Dave Cory gave presentation
3/31/11 CCID Landowners Meeting
Gustine Patterson Area Update 160 Dave Cory gave presentation
May 2011 Del Puerto Creek Growers
Field BMPs 1 Rich Peltzer
6/1/2011 Westley Spring Outreach Meeting
Westley Districts mailed invitations
30 JCM, Parry, RWQCB gave present.
6/10/11 Exceedance Notice
Notice Districts distributed 40 Notice
July 2011 Ingram Creek Growers
Field BMPs 2 Rich Peltzer
July 2011 Hospital Creek Growers
Field BMPs 5 Rich Peltzer
Table A6-3: Summary of Focused Plan 2 Management Practice Surveys. Westley Wasteway Del Puerto Creek Orestimba Creek Acres % Acres % Acres % Survey Area (APN Acreage) 5248 9195 12851 Surveys Collected 70 100% 270 100% 160 100%Irrigated Acreage 4565 87% 7898 86% 11714 91%Furrow/Flood (% Irrigated Acreage) 1489 33% 3210 41% 4491 38%Drip/Micro/Sprinkler (% Irrigated Ac.) 2891 63% 3934 50% 5821 50%Fallow/Non-irrigated (% Irrigated Ac.) 0 0% 230 3% 1354 12%Mixed Irrigation Methods (% Irrig. Ac.) 185 4% 525 7% 48 0%Tree Crops (% Irrigated Ac.) 2891 63% 4209 53% 5481 47%Field Crops (% Irrigated Ac.) 1670 37% 3678 47% 5626 48%Open/Other (% Irrigated Ac.) 662 15% 285 4% 847 7%Sedimentation Ponds (% Irrigated Ac.) 1092 65% 3331 36% 5019 89%Return Systems (% Irrigated Ac.) 150 9% 402 4% 2154 38%PAM usage (% Irrigated Ac.) 3346 73% 2955 37% 3408 29%Tailwater leaves field (% Irrigated Ac.) 2234 49% 3461 44% 4134 35%Stormwater leaves field (% Irrigated Ac.) 2517 55% 5050 64% 6384 55%Dormant Spray Usage (% of Tree crops) 905 31% 1147 27% 400 7%Horticultural Oil Usage (% of Tree crops) 905 31% 748 18% 806 15%Manure Usage (% Irrigated Ac.) 0 0% 275 3% 221 2%
Prosecution Team Response to Comments - Attachment B

A6-9
Table A6-4: Outreach Meetings (Continued).
Date Group Location Description Attended By 7/18/11 Certified Letter to
northerly watersheds
Letter Chlorpyrifos exceedances 80 Letter
7/20/11 Patterson Westside Farms
Field Discussion of Chlorpyrifos exceedances
1 Rich Peltzer
7/20/11 Crowe Farms Field Discussion of Chlorpyrifos exceedances
1 Rich Peltzer
August 2011 Hospital Creek Growers
Field BMPs 5 Rich Peltzer
August 2011 Ingram Creek Growers
Field BMPs 2 Rich Peltzer
August 2011 Marshall Road Drain Growers
Field BMPs 16 Rich Peltzer
August 2011 Orestimba Creek Growers
Field BMPs 5 Rich Peltzer
August 2011 Del Puerto Creek Growers
Field BMPs 11 Rich Peltzer
August 2011 Ramona Lake Growers
Field BMPs 4 Rich Peltzer
8/8/2011 Orestimba Creek Watershed
Field Sediment Exceedances 6 Rich Peltzer
8/10/2011 Salt Slough Outreach Meeting
Dos Palos SLCC and CCID sent invitations
25 JCM, Rich Peltzer gave present.
8/23/2011 Ingram/Hospital Creek Watersheds
Field Discussion of Chlorpyrifos exceedances
5 Rich Peltzer
The Coalition began conducting individual meetings with growers in March of 2010. These meetings targeted parcels adjacent to the creeks and major drains in the Focused Plan watersheds with the intent of increasing awareness of the water quality concerns related to agricultural practices. The individual contacts also help to gain parcel-specific information in regards to agricultural discharges and management practices currently implemented on the properties adjacent to the priority watersheds. In the individual grower visits the Coalition offer resources (i.e. management practice handbooks, information to obtain NRCS-EQIP funds) to aid them in implementing additional management practices if it is determined that additional practices are needed. This determination is made after the discussion and a review of the property by a Coalition representative. Overview of decision tree for adopting management practices
1. Management practice surveys mailed to landowners 2. Landowners reporting irrigation drainage are contacted for follow-up visits 3. Individual meeting held to discuss current/potential practices 4. Options reviewed with landowner 5. Landowner makes decision on implementing practice
Prosecution Team Response to Comments - Attachment B
A6-10
Overview of Outreach Procedure resulting from Pesticide Exceedances. Pesticide results are typically available to the Westside Coalition approximately 6 weeks after the sample collection. Upon receipt of this data, it is imported into the Coalition’s database and reviewed for exceedances. When a pesticide detection is determined to have exceeded the recommended water quality value, the Westside Coalition begins a review procedure.
1. Determine the material, time of year, and subwatershed in which the material was applied.
2. Identify the crops that are registered for the subject material. 3. Review the subwatershed for the identified crops.
These steps can usually be performed within a week of the exceedance determination and will generally reduce the pool of growers who are likely to have contributed to the exceedance. With that information, the Coalition can target outreach efforts directly to those growers. Grant Program Outreach. Information on grant funding availability has been communicated to landowners and operators through direct mailings, grower group meetings and individual contacts with landowners. A letter was sent in April 2011 to landowners with property along the Westside Coalitions priority watersheds (Ingram, Hospital, Orestimba and Del Puerto Creeks) regarding availability of Proposition 84 grant funds, a program managed by CURES and funded by the State Water Resources Control Board. The letters were mailed or hand delivered by irrigation districts encompassing the four watersheds. The Proposition 84 program provides funding for projects in the Central Valley. Outreach by CURES was focused on landowners with fields along waterways with management plans in place by the local watershed coalition and located in the northern San Joaquin Valley, San Joaquin County/Sacramento Rivers Delta and southern Sacramento Valley. Applications were accepted until the July 1, 2011 deadline. Of the 41 applications received by CURES, 12 were submitted by members of the Westside Coalitions and had irrigation drainage into one of the following waterways: Hospital Creek, Ingram Creek, Orestimba Creek or the San Joaquin River. The payment rate is 50% of the total cost of the project and is paid at project completion (reimbursement of expenses). Several projects are in combination with NRCS funding. Priority for the funding was be given to fields located in watersheds with existing Management Plans (those listed above) that have frequent irrigation or storm water drainage. The projects selected for funding are for installing drip or micro sprinkler irrigation systems in row crops or orchards. Most project construction is expected to be completed in winter 2011 or spring 2012.
Prosecution Team Response to Comments - Attachment B

Westside San Joaquin River Semi-Annual Report Watershed Coalition June 15, 2011
Exceedance Tally
Prosecution Team Response to Comments - Attachment B
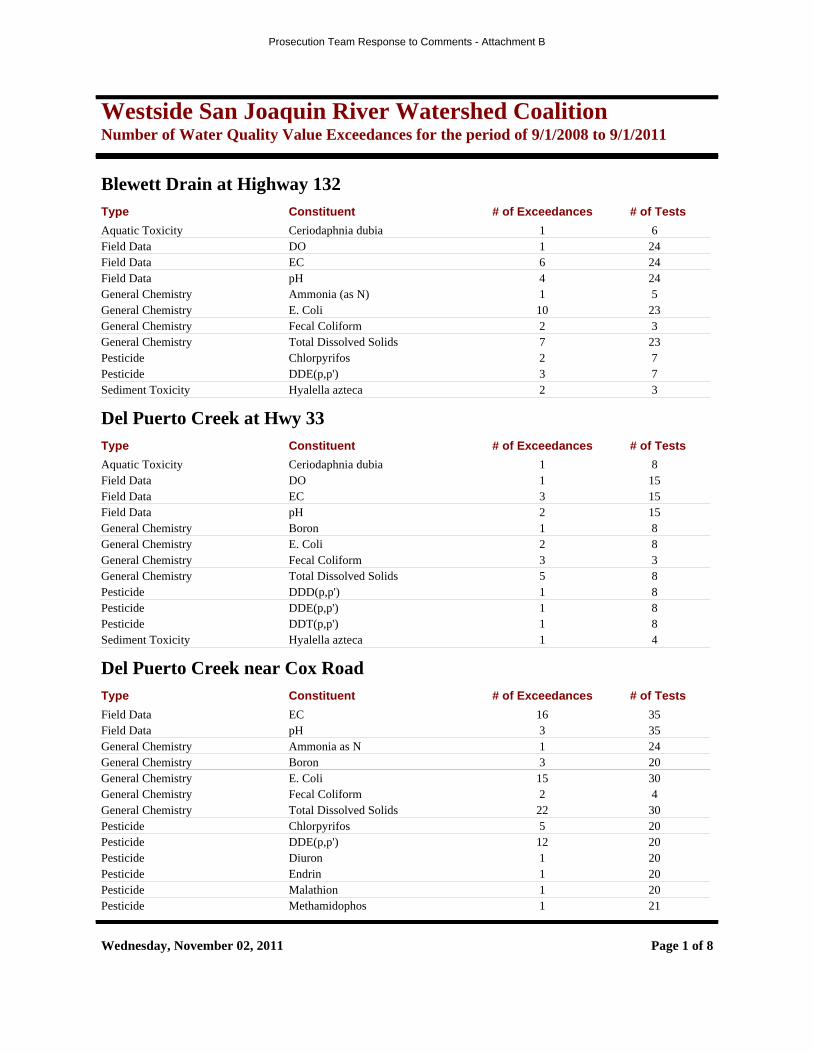
Westside San Joaquin River Watershed CoalitionNumber of Water Quality Value Exceedances for the period of 9/1/2008 to 9/1/2011
Blewett Drain at Highway 132Constituent # of ExceedancesType # of Tests
Ceriodaphnia dubiaAquatic Toxicity 1 6DOField Data 1 24ECField Data 6 24pHField Data 4 24Ammonia (as N)General Chemistry 1 5E. ColiGeneral Chemistry 10 23Fecal ColiformGeneral Chemistry 2 3Total Dissolved SolidsGeneral Chemistry 7 23ChlorpyrifosPesticide 2 7DDE(p,p')Pesticide 3 7Hyalella aztecaSediment Toxicity 2 3
Del Puerto Creek at Hwy 33Constituent # of ExceedancesType # of Tests
Ceriodaphnia dubiaAquatic Toxicity 1 8DOField Data 1 15ECField Data 3 15pHField Data 2 15BoronGeneral Chemistry 1 8E. ColiGeneral Chemistry 2 8Fecal ColiformGeneral Chemistry 3 3Total Dissolved SolidsGeneral Chemistry 5 8DDD(p,p')Pesticide 1 8DDE(p,p')Pesticide 1 8DDT(p,p')Pesticide 1 8Hyalella aztecaSediment Toxicity 1 4
Del Puerto Creek near Cox RoadConstituent # of ExceedancesType # of Tests
ECField Data 16 35pHField Data 3 35Ammonia as NGeneral Chemistry 1 24BoronGeneral Chemistry 3 20E. ColiGeneral Chemistry 15 30Fecal ColiformGeneral Chemistry 2 4Total Dissolved SolidsGeneral Chemistry 22 30ChlorpyrifosPesticide 5 20DDE(p,p')Pesticide 12 20DiuronPesticide 1 20EndrinPesticide 1 20MalathionPesticide 1 20MethamidophosPesticide 1 21
Wednesday, November 02, 2011 Page 1 of 8
Prosecution Team Response to Comments - Attachment B
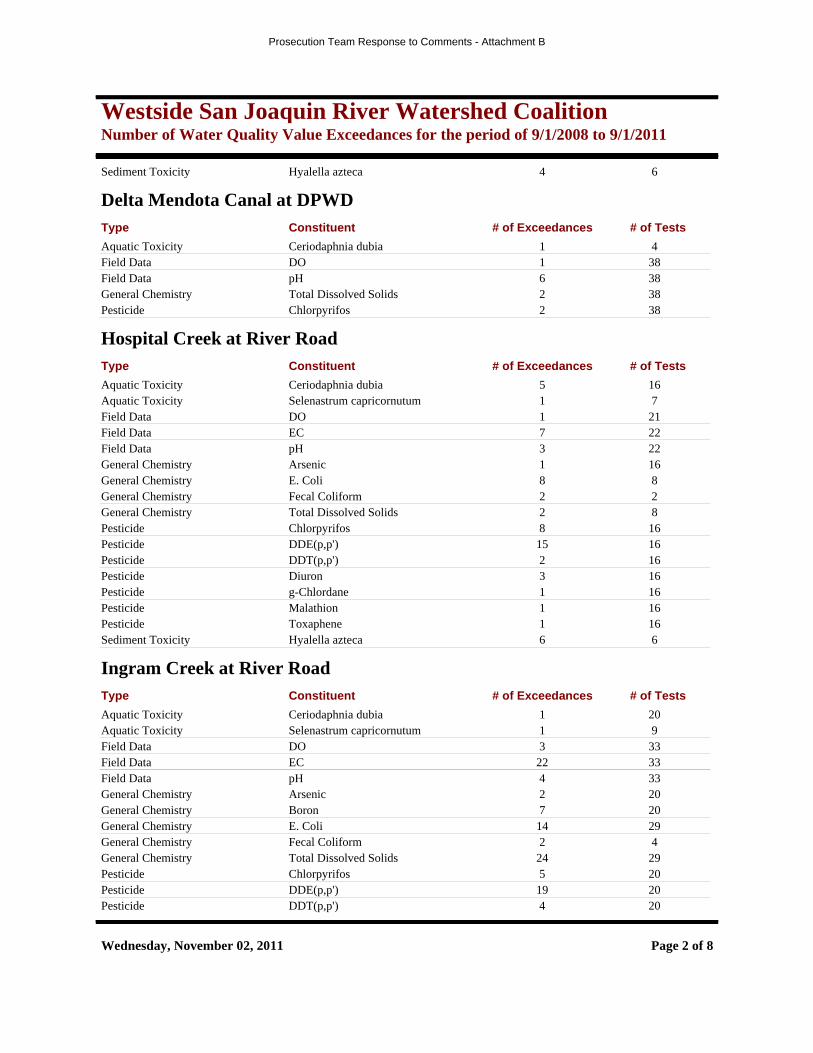
Westside San Joaquin River Watershed CoalitionNumber of Water Quality Value Exceedances for the period of 9/1/2008 to 9/1/2011
Hyalella aztecaSediment Toxicity 4 6
Delta Mendota Canal at DPWDConstituent # of ExceedancesType # of Tests
Ceriodaphnia dubiaAquatic Toxicity 1 4DOField Data 1 38pHField Data 6 38Total Dissolved SolidsGeneral Chemistry 2 38ChlorpyrifosPesticide 2 38
Hospital Creek at River RoadConstituent # of ExceedancesType # of Tests
Ceriodaphnia dubiaAquatic Toxicity 5 16Selenastrum capricornutumAquatic Toxicity 1 7DOField Data 1 21ECField Data 7 22pHField Data 3 22ArsenicGeneral Chemistry 1 16E. ColiGeneral Chemistry 8 8Fecal ColiformGeneral Chemistry 2 2Total Dissolved SolidsGeneral Chemistry 2 8ChlorpyrifosPesticide 8 16DDE(p,p')Pesticide 15 16DDT(p,p')Pesticide 2 16DiuronPesticide 3 16g-ChlordanePesticide 1 16MalathionPesticide 1 16ToxaphenePesticide 1 16Hyalella aztecaSediment Toxicity 6 6
Ingram Creek at River RoadConstituent # of ExceedancesType # of Tests
Ceriodaphnia dubiaAquatic Toxicity 1 20Selenastrum capricornutumAquatic Toxicity 1 9DOField Data 3 33ECField Data 22 33pHField Data 4 33ArsenicGeneral Chemistry 2 20BoronGeneral Chemistry 7 20E. ColiGeneral Chemistry 14 29Fecal ColiformGeneral Chemistry 2 4Total Dissolved SolidsGeneral Chemistry 24 29ChlorpyrifosPesticide 5 20DDE(p,p')Pesticide 19 20DDT(p,p')Pesticide 4 20
Wednesday, November 02, 2011 Page 2 of 8
Prosecution Team Response to Comments - Attachment B
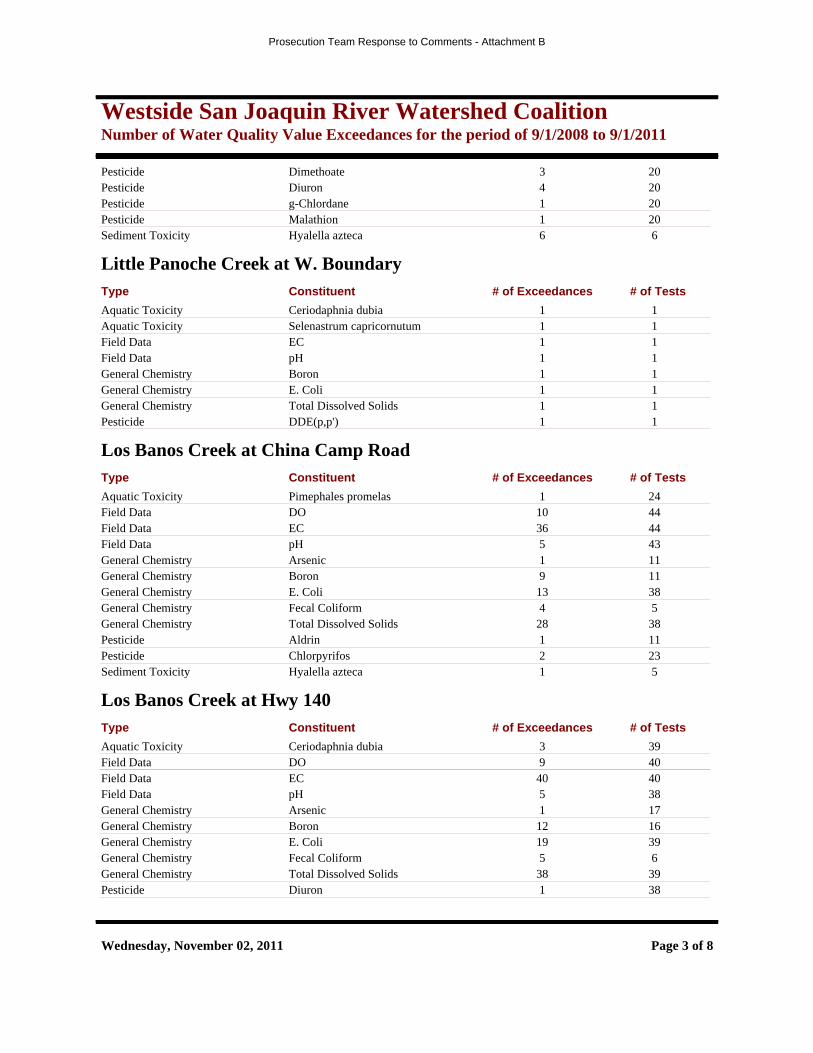
Westside San Joaquin River Watershed CoalitionNumber of Water Quality Value Exceedances for the period of 9/1/2008 to 9/1/2011
DimethoatePesticide 3 20DiuronPesticide 4 20g-ChlordanePesticide 1 20MalathionPesticide 1 20Hyalella aztecaSediment Toxicity 6 6
Little Panoche Creek at W. BoundaryConstituent # of ExceedancesType # of Tests
Ceriodaphnia dubiaAquatic Toxicity 1 1Selenastrum capricornutumAquatic Toxicity 1 1ECField Data 1 1pHField Data 1 1BoronGeneral Chemistry 1 1E. ColiGeneral Chemistry 1 1Total Dissolved SolidsGeneral Chemistry 1 1DDE(p,p')Pesticide 1 1
Los Banos Creek at China Camp RoadConstituent # of ExceedancesType # of Tests
Pimephales promelasAquatic Toxicity 1 24DOField Data 10 44ECField Data 36 44pHField Data 5 43ArsenicGeneral Chemistry 1 11BoronGeneral Chemistry 9 11E. ColiGeneral Chemistry 13 38Fecal ColiformGeneral Chemistry 4 5Total Dissolved SolidsGeneral Chemistry 28 38AldrinPesticide 1 11ChlorpyrifosPesticide 2 23Hyalella aztecaSediment Toxicity 1 5
Los Banos Creek at Hwy 140Constituent # of ExceedancesType # of Tests
Ceriodaphnia dubiaAquatic Toxicity 3 39DOField Data 9 40ECField Data 40 40pHField Data 5 38ArsenicGeneral Chemistry 1 17BoronGeneral Chemistry 12 16E. ColiGeneral Chemistry 19 39Fecal ColiformGeneral Chemistry 5 6Total Dissolved SolidsGeneral Chemistry 38 39DiuronPesticide 1 38
Wednesday, November 02, 2011 Page 3 of 8
Prosecution Team Response to Comments - Attachment B
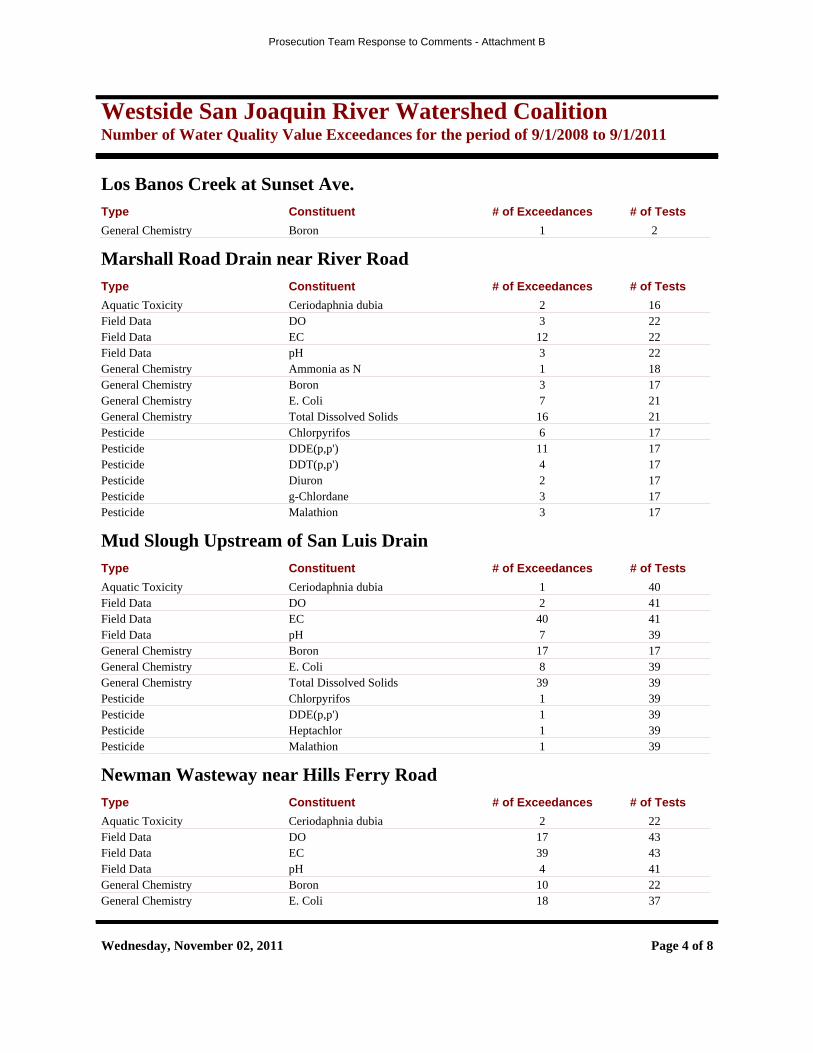
Westside San Joaquin River Watershed CoalitionNumber of Water Quality Value Exceedances for the period of 9/1/2008 to 9/1/2011
Los Banos Creek at Sunset Ave.Constituent # of ExceedancesType # of Tests
BoronGeneral Chemistry 1 2
Marshall Road Drain near River RoadConstituent # of ExceedancesType # of Tests
Ceriodaphnia dubiaAquatic Toxicity 2 16DOField Data 3 22ECField Data 12 22pHField Data 3 22Ammonia as NGeneral Chemistry 1 18BoronGeneral Chemistry 3 17E. ColiGeneral Chemistry 7 21Total Dissolved SolidsGeneral Chemistry 16 21ChlorpyrifosPesticide 6 17DDE(p,p')Pesticide 11 17DDT(p,p')Pesticide 4 17DiuronPesticide 2 17g-ChlordanePesticide 3 17MalathionPesticide 3 17
Mud Slough Upstream of San Luis DrainConstituent # of ExceedancesType # of Tests
Ceriodaphnia dubiaAquatic Toxicity 1 40DOField Data 2 41ECField Data 40 41pHField Data 7 39BoronGeneral Chemistry 17 17E. ColiGeneral Chemistry 8 39Total Dissolved SolidsGeneral Chemistry 39 39ChlorpyrifosPesticide 1 39DDE(p,p')Pesticide 1 39HeptachlorPesticide 1 39MalathionPesticide 1 39
Newman Wasteway near Hills Ferry RoadConstituent # of ExceedancesType # of Tests
Ceriodaphnia dubiaAquatic Toxicity 2 22DOField Data 17 43ECField Data 39 43pHField Data 4 41BoronGeneral Chemistry 10 22E. ColiGeneral Chemistry 18 37
Wednesday, November 02, 2011 Page 4 of 8
Prosecution Team Response to Comments - Attachment B
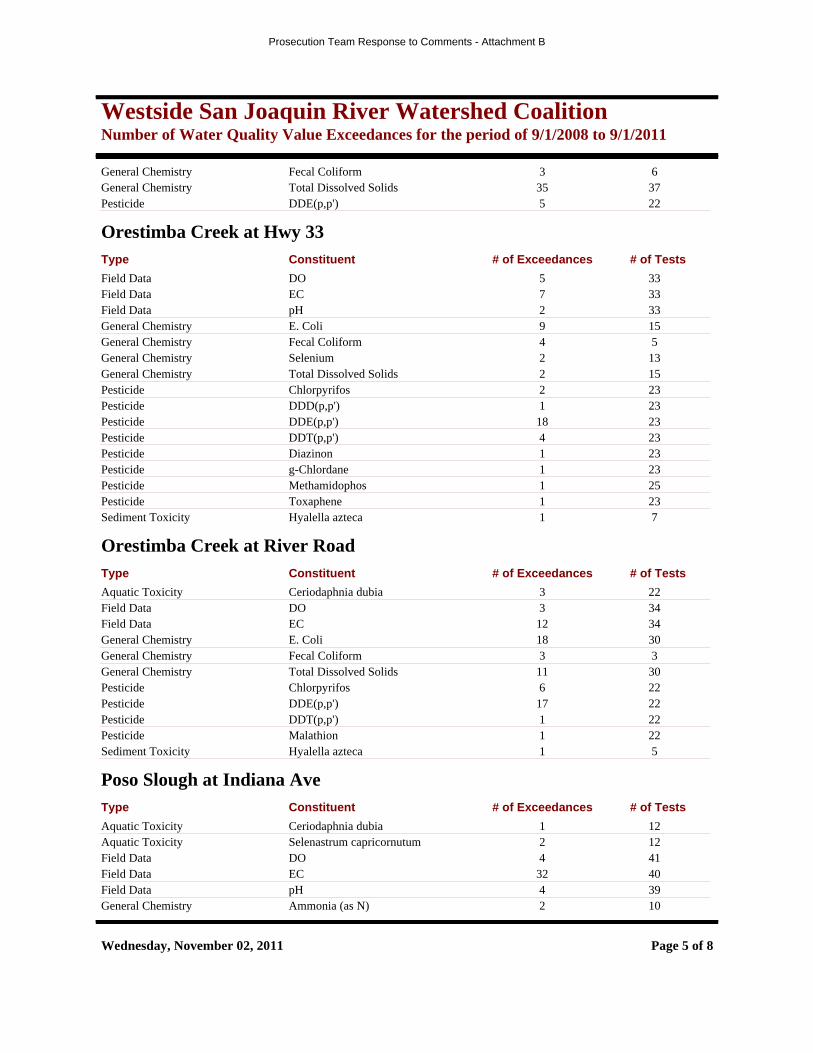
Westside San Joaquin River Watershed CoalitionNumber of Water Quality Value Exceedances for the period of 9/1/2008 to 9/1/2011
Fecal ColiformGeneral Chemistry 3 6Total Dissolved SolidsGeneral Chemistry 35 37DDE(p,p')Pesticide 5 22
Orestimba Creek at Hwy 33Constituent # of ExceedancesType # of Tests
DOField Data 5 33ECField Data 7 33pHField Data 2 33E. ColiGeneral Chemistry 9 15Fecal ColiformGeneral Chemistry 4 5SeleniumGeneral Chemistry 2 13Total Dissolved SolidsGeneral Chemistry 2 15ChlorpyrifosPesticide 2 23DDD(p,p')Pesticide 1 23DDE(p,p')Pesticide 18 23DDT(p,p')Pesticide 4 23DiazinonPesticide 1 23g-ChlordanePesticide 1 23MethamidophosPesticide 1 25ToxaphenePesticide 1 23Hyalella aztecaSediment Toxicity 1 7
Orestimba Creek at River RoadConstituent # of ExceedancesType # of Tests
Ceriodaphnia dubiaAquatic Toxicity 3 22DOField Data 3 34ECField Data 12 34E. ColiGeneral Chemistry 18 30Fecal ColiformGeneral Chemistry 3 3Total Dissolved SolidsGeneral Chemistry 11 30ChlorpyrifosPesticide 6 22DDE(p,p')Pesticide 17 22DDT(p,p')Pesticide 1 22MalathionPesticide 1 22Hyalella aztecaSediment Toxicity 1 5
Poso Slough at Indiana AveConstituent # of ExceedancesType # of Tests
Ceriodaphnia dubiaAquatic Toxicity 1 12Selenastrum capricornutumAquatic Toxicity 2 12DOField Data 4 41ECField Data 32 40pHField Data 4 39Ammonia (as N)General Chemistry 2 10
Wednesday, November 02, 2011 Page 5 of 8
Prosecution Team Response to Comments - Attachment B
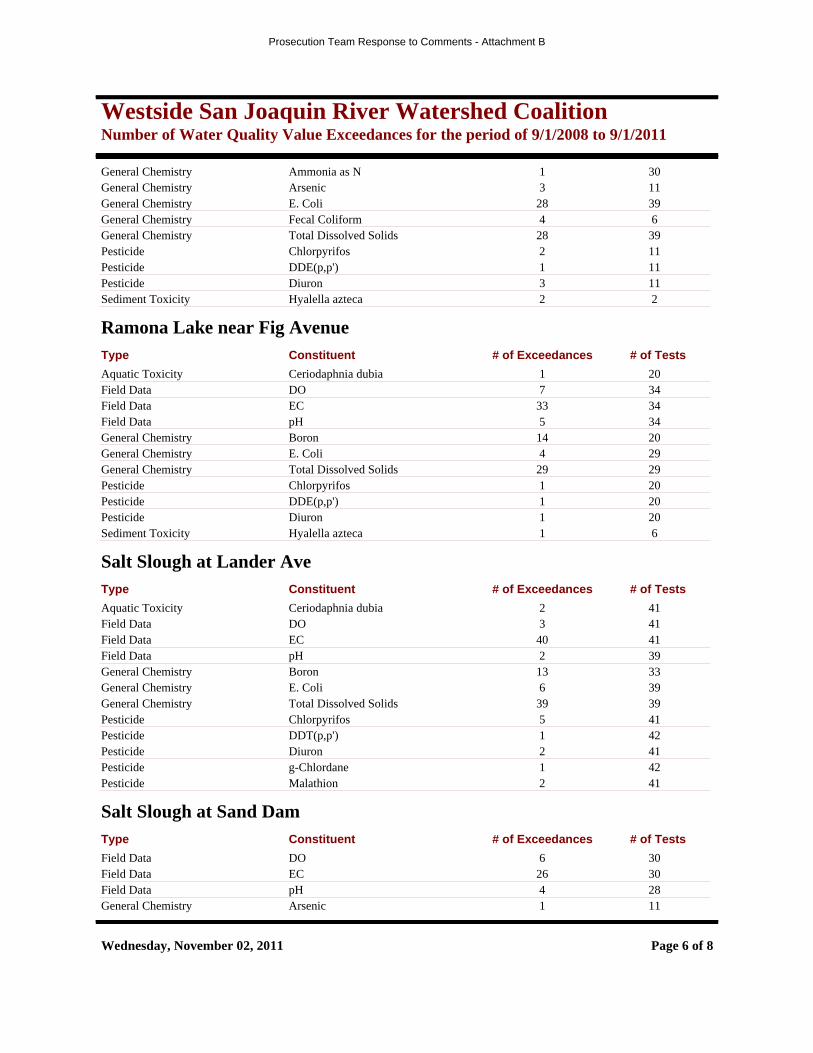
Westside San Joaquin River Watershed CoalitionNumber of Water Quality Value Exceedances for the period of 9/1/2008 to 9/1/2011
Ammonia as NGeneral Chemistry 1 30ArsenicGeneral Chemistry 3 11E. ColiGeneral Chemistry 28 39Fecal ColiformGeneral Chemistry 4 6Total Dissolved SolidsGeneral Chemistry 28 39ChlorpyrifosPesticide 2 11DDE(p,p')Pesticide 1 11DiuronPesticide 3 11Hyalella aztecaSediment Toxicity 2 2
Ramona Lake near Fig AvenueConstituent # of ExceedancesType # of Tests
Ceriodaphnia dubiaAquatic Toxicity 1 20DOField Data 7 34ECField Data 33 34pHField Data 5 34BoronGeneral Chemistry 14 20E. ColiGeneral Chemistry 4 29Total Dissolved SolidsGeneral Chemistry 29 29ChlorpyrifosPesticide 1 20DDE(p,p')Pesticide 1 20DiuronPesticide 1 20Hyalella aztecaSediment Toxicity 1 6
Salt Slough at Lander AveConstituent # of ExceedancesType # of Tests
Ceriodaphnia dubiaAquatic Toxicity 2 41DOField Data 3 41ECField Data 40 41pHField Data 2 39BoronGeneral Chemistry 13 33E. ColiGeneral Chemistry 6 39Total Dissolved SolidsGeneral Chemistry 39 39ChlorpyrifosPesticide 5 41DDT(p,p')Pesticide 1 42DiuronPesticide 2 41g-ChlordanePesticide 1 42MalathionPesticide 2 41
Salt Slough at Sand DamConstituent # of ExceedancesType # of Tests
DOField Data 6 30ECField Data 26 30pHField Data 4 28ArsenicGeneral Chemistry 1 11
Wednesday, November 02, 2011 Page 6 of 8
Prosecution Team Response to Comments - Attachment B
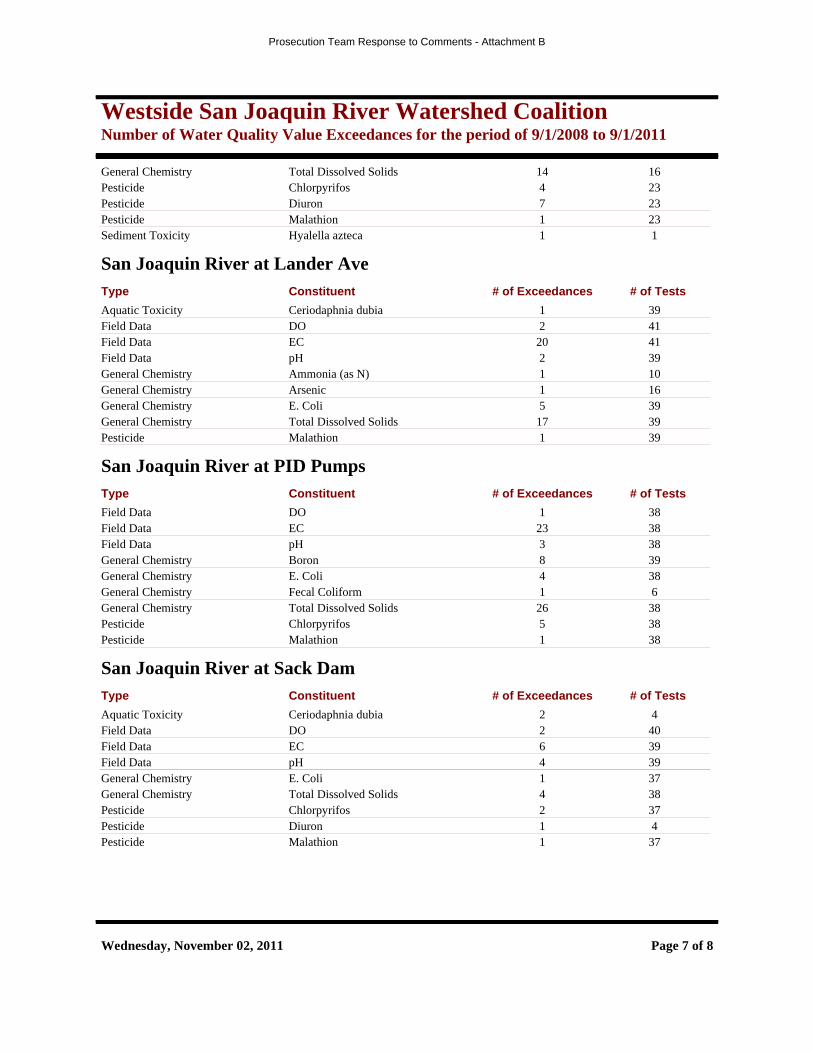
Westside San Joaquin River Watershed CoalitionNumber of Water Quality Value Exceedances for the period of 9/1/2008 to 9/1/2011
Total Dissolved SolidsGeneral Chemistry 14 16ChlorpyrifosPesticide 4 23DiuronPesticide 7 23MalathionPesticide 1 23Hyalella aztecaSediment Toxicity 1 1
San Joaquin River at Lander AveConstituent # of ExceedancesType # of Tests
Ceriodaphnia dubiaAquatic Toxicity 1 39DOField Data 2 41ECField Data 20 41pHField Data 2 39Ammonia (as N)General Chemistry 1 10ArsenicGeneral Chemistry 1 16E. ColiGeneral Chemistry 5 39Total Dissolved SolidsGeneral Chemistry 17 39MalathionPesticide 1 39
San Joaquin River at PID PumpsConstituent # of ExceedancesType # of Tests
DOField Data 1 38ECField Data 23 38pHField Data 3 38BoronGeneral Chemistry 8 39E. ColiGeneral Chemistry 4 38Fecal ColiformGeneral Chemistry 1 6Total Dissolved SolidsGeneral Chemistry 26 38ChlorpyrifosPesticide 5 38MalathionPesticide 1 38
San Joaquin River at Sack DamConstituent # of ExceedancesType # of Tests
Ceriodaphnia dubiaAquatic Toxicity 2 4DOField Data 2 40ECField Data 6 39pHField Data 4 39E. ColiGeneral Chemistry 1 37Total Dissolved SolidsGeneral Chemistry 4 38ChlorpyrifosPesticide 2 37DiuronPesticide 1 4MalathionPesticide 1 37
Wednesday, November 02, 2011 Page 7 of 8
Prosecution Team Response to Comments - Attachment B

Westside San Joaquin River Watershed CoalitionNumber of Water Quality Value Exceedances for the period of 9/1/2008 to 9/1/2011
Turner Slough at Edminster RoadConstituent # of ExceedancesType # of Tests
Ceriodaphnia dubiaAquatic Toxicity 3 21DOField Data 12 31ECField Data 14 31pHField Data 1 29Ammonia as NGeneral Chemistry 1 26E. ColiGeneral Chemistry 16 30Total Dissolved SolidsGeneral Chemistry 13 30
Westley Wasteway near Cox RoadConstituent # of ExceedancesType # of Tests
Selenastrum capricornutumAquatic Toxicity 2 15ECField Data 8 27pHField Data 2 27BoronGeneral Chemistry 1 15E. ColiGeneral Chemistry 13 23Fecal ColiformGeneral Chemistry 1 2Total Dissolved SolidsGeneral Chemistry 9 23a-ChlordanePesticide 1 15ChlorpyrifosPesticide 2 15DDE(p,p')Pesticide 13 15DDT(p,p')Pesticide 1 15DiuronPesticide 3 14Hyalella aztecaSediment Toxicity 3 5
Wednesday, November 02, 2011 Page 8 of 8
Prosecution Team Response to Comments - Attachment B

Westside San Joaquin River Semi-Annual Report Watershed Coalition June 15, 2011
Subwatershed Maps
Prosecution Team Response to Comments - Attachment B
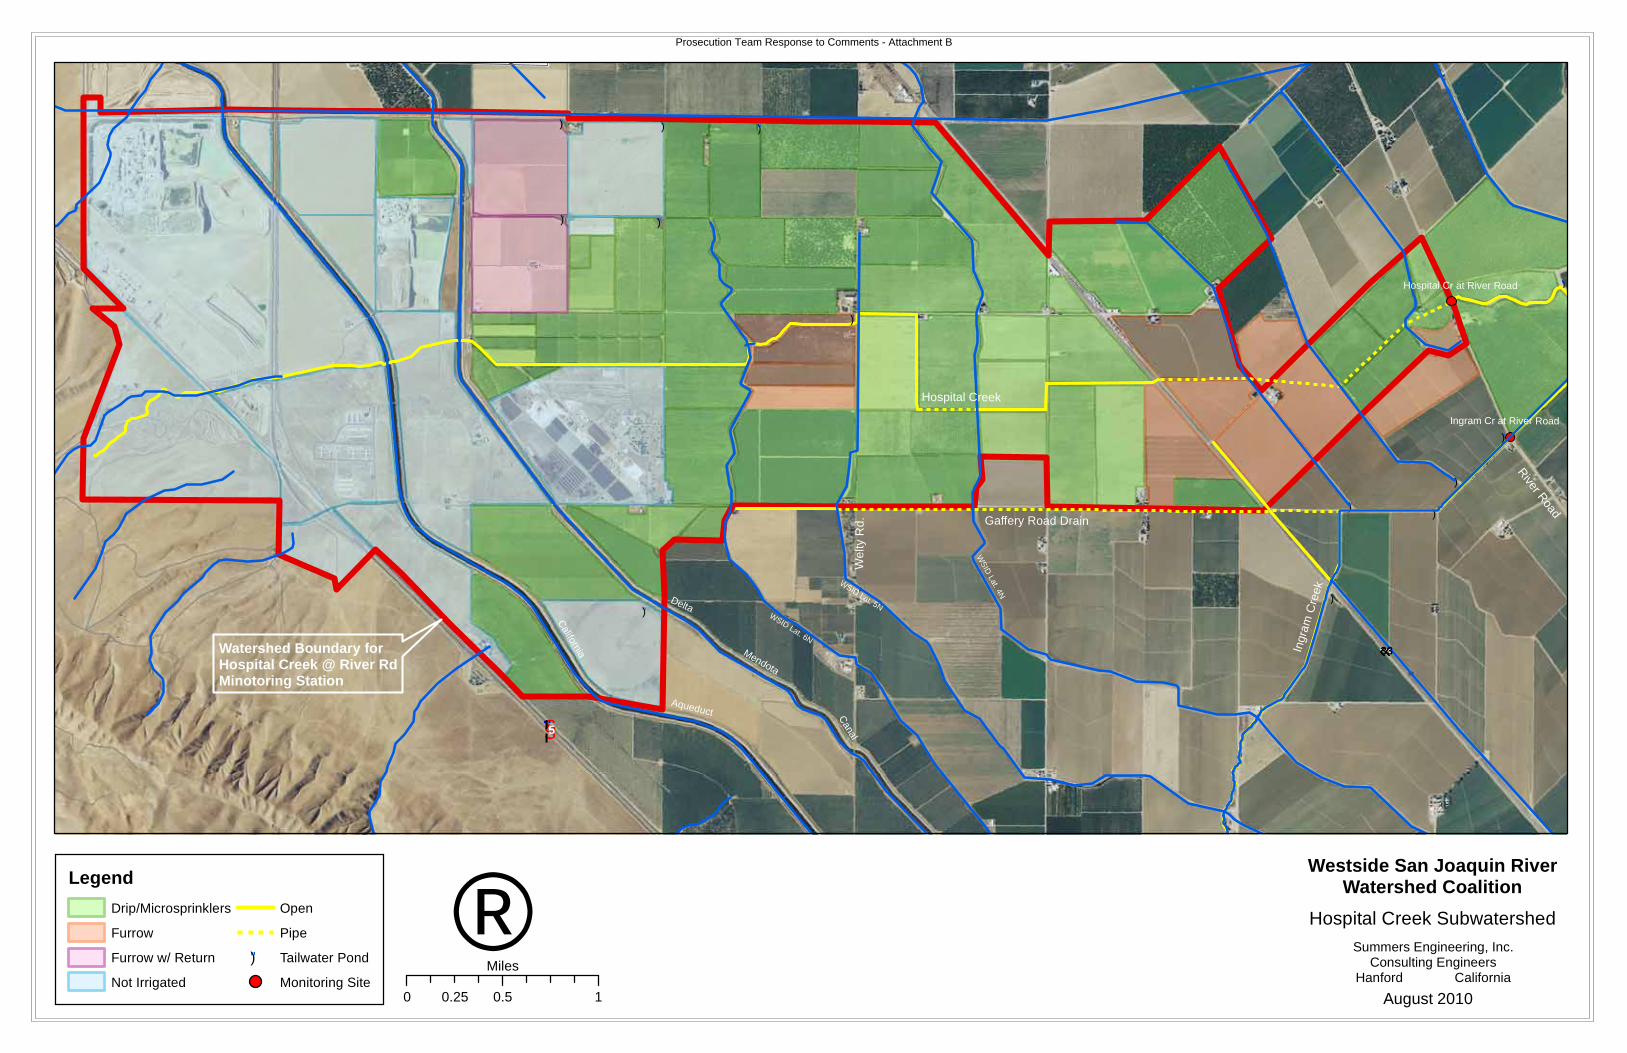
")
")")
")
")
")
")
")
")
")
")
")
")
River R
oad
We
lty R
d.
¬«33
Delta
Mendota
Canal
California
Aqueduct
§̈¦5
Ingr
am C
reek
WSID Lat. 6N
WSID Lat. 5N
WS
ID Lat. 4N
Gaffery Road Drain
Hospital Creek
Hospital Cr at River Road
Ingram Cr at River Road
Watershed Boundary forHospital Creek @ River RdMinotoring Station
®0 0.5 10.25
Miles
Legend
Drip/Microsprinklers
Furrow
Furrow w/ Return
Not Irrigated
Open
Pipe
") Tailwater Pond
Monitoring Site
Westside San Joaquin RiverWatershed Coalition
Hospital Creek Subwatershed
Summers Engineering, Inc.Consulting Engineers
Hanford California
August 2010
Prosecution Team Response to Comments - Attachment B
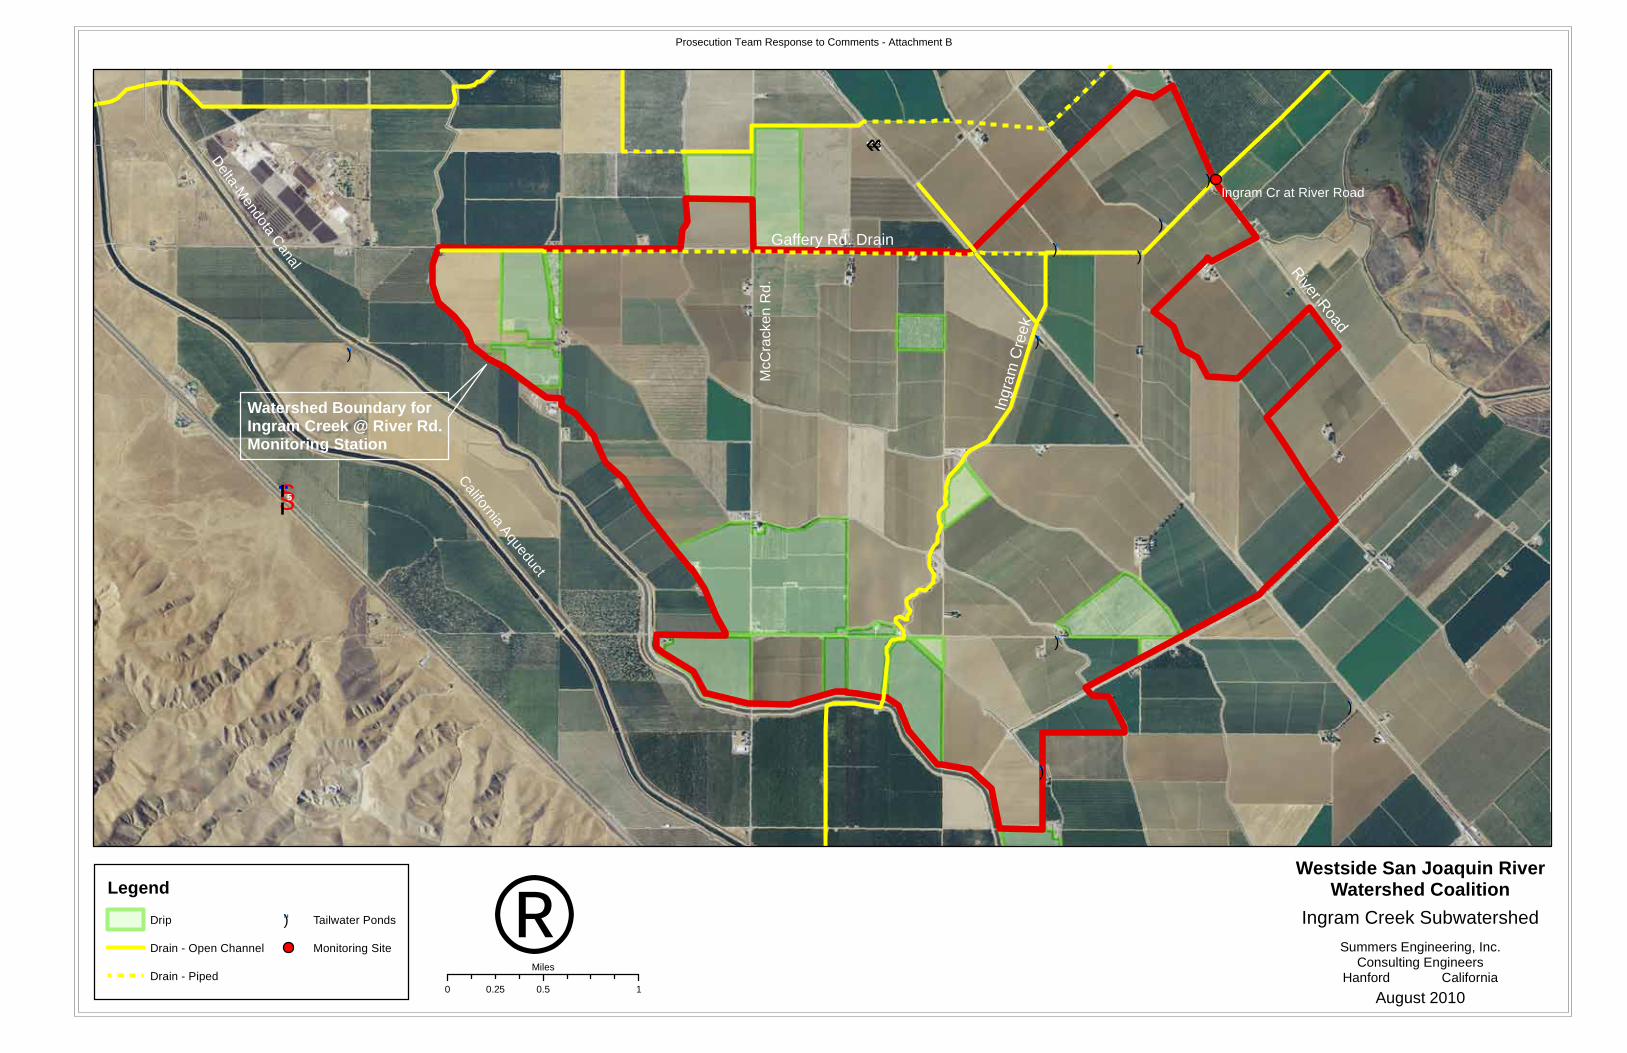
")
")")
")
")
")
")
")
")
§̈¦5
¬«33
Ingr
am C
reek
Gaffery Rd. Drain
River Road
California Aqueduct
Delta-M
endota Canal
Watershed Boundary forIngram Creek @ River Rd.Monitoring Station
Ingram Cr at River Road
Legend
Drip
Drain - Open Channel
Drain - Piped
") Tailwater Ponds
Monitoring Site
0 0.5 10.25
Miles
McC
rack
en
Rd
.
®Westside San Joaquin River
Watershed Coalition
Ingram Creek Subwatershed
Summers Engineering, Inc.Consulting Engineers
Hanford California
August 2010
Prosecution Team Response to Comments - Attachment B

")
")
")
")
")
Westley W
asteway
Del Puerto Cr at Hwy 33
Del Puerto Cr near Cox Road
Westley Wasteway near Cox Road
®0 0.5 10.25
Miles
Legend
Drip
Furrow
") Tailwater Pond
Drain - Open
Drain - Piped
Monitoring Site
Westside San Joaquin RiverWatershed Coalition
Westley Wasteway Subwatershed
Summers Engineering, Inc.Consulting Engineers
Hanford California
August 2010
Prosecution Team Response to Comments - Attachment B
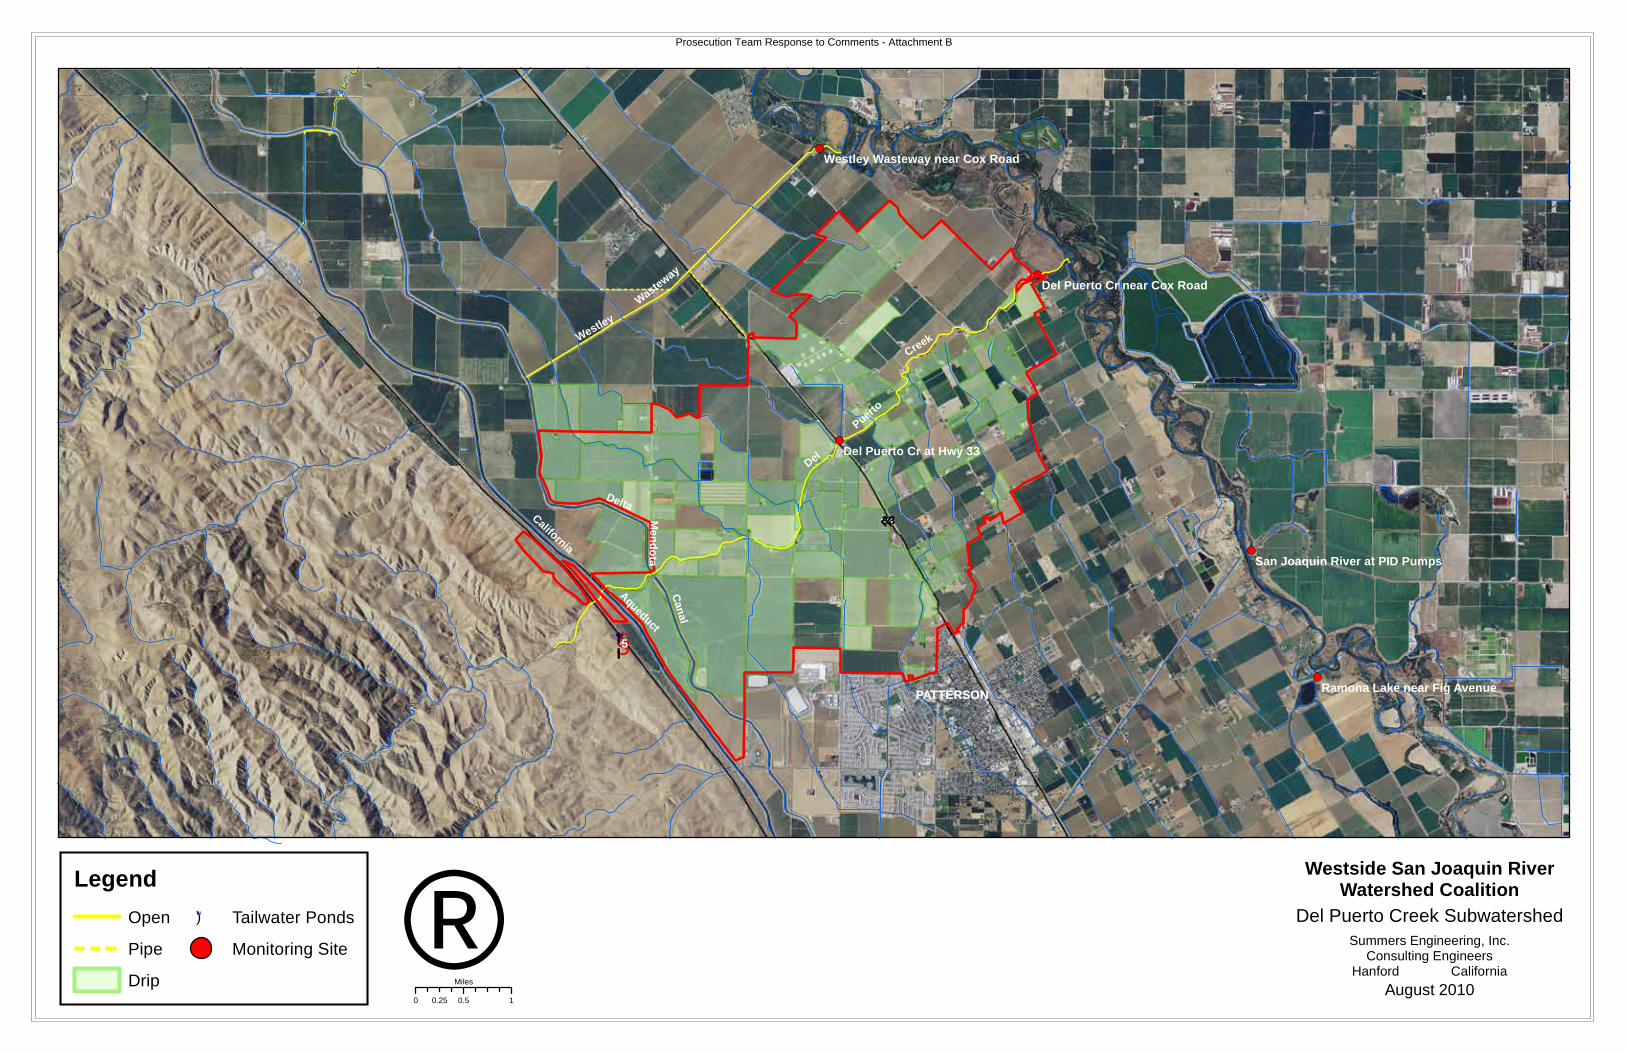
")
")
")
")
")
California
Aqueduct
Delta
Me
nd
ota
Can
al
¬«33
§̈¦5
Del
Puerto
CreekWestley
Wasteway
PATTERSON
Del Puerto Cr at Hwy 33
Ramona Lake near Fig Avenue
Del Puerto Cr near Cox Road
San Joaquin River at PID Pumps
Westley Wasteway near Cox Road
0 1 20.5
MilesLegend
Open
Pipe
Drip
") Tailwater Ponds
Monitoring Site ®0 0.5 10.25
Miles
Westside San Joaquin RiverWatershed Coalition
Del Puerto Creek SubwatershedSummers Engineering, Inc.
Consulting EngineersHanford California
August 2010
Prosecution Team Response to Comments - Attachment B
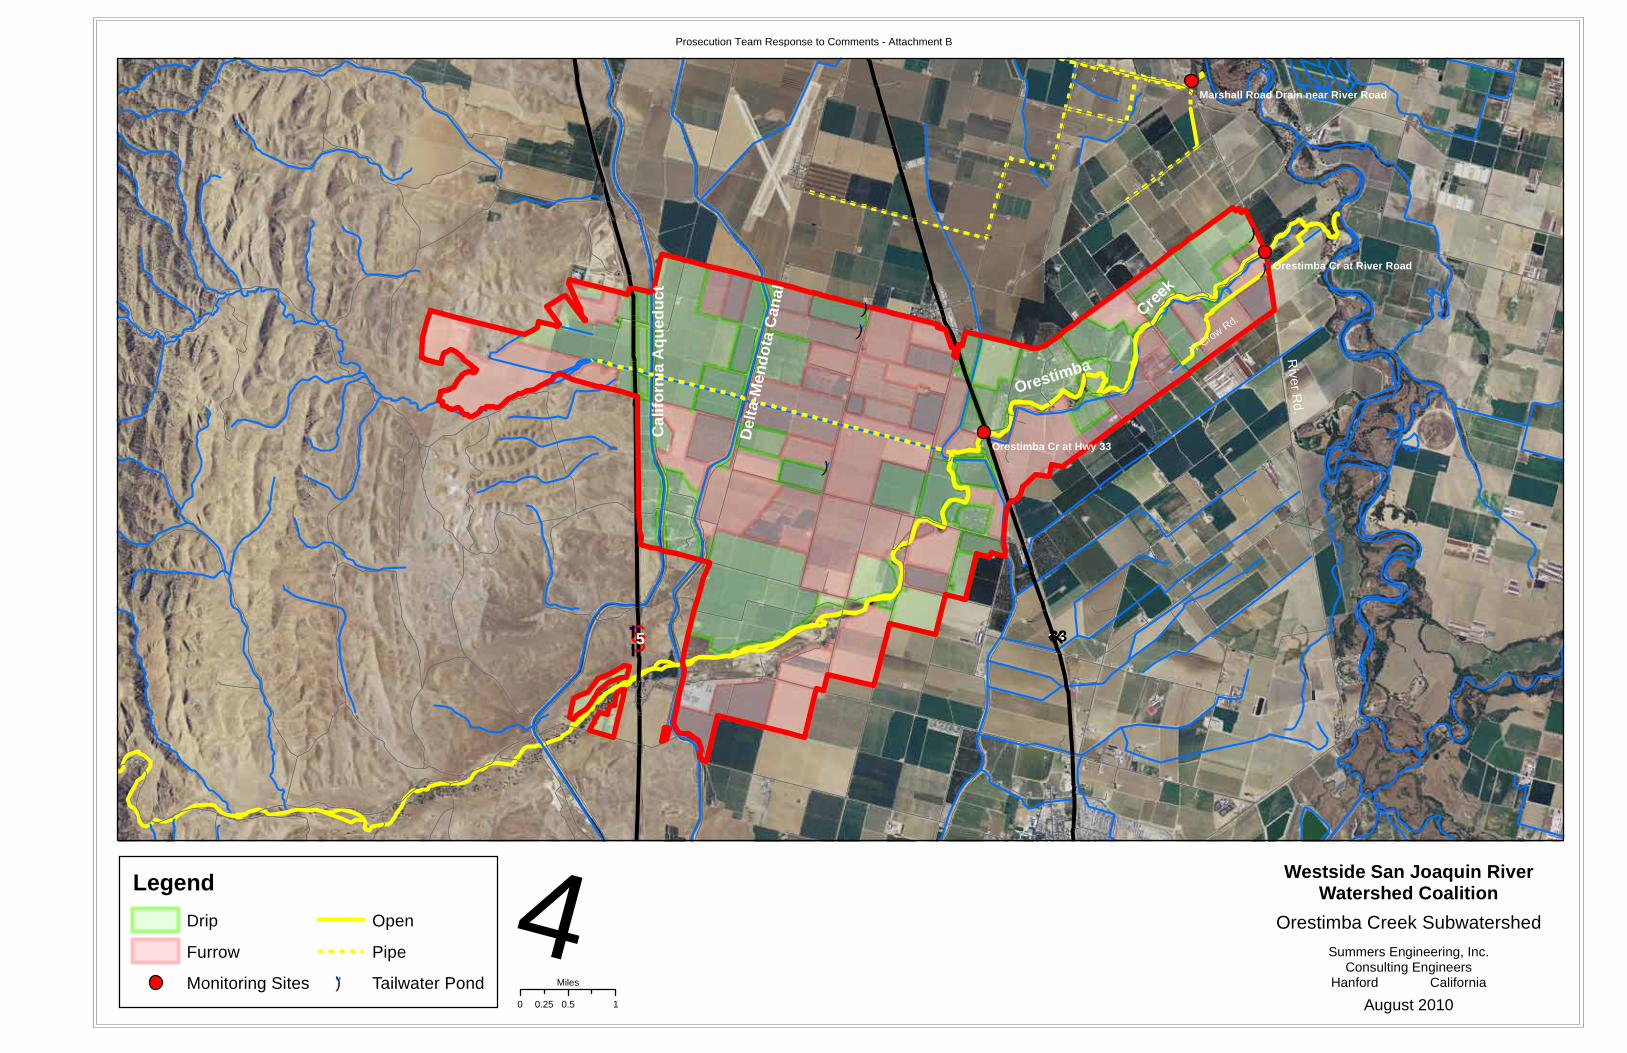
")
")
")
")
")
Rive
r Rd.
¬«33§̈¦5C
ali
for n
ia A
qu
edu
ct
Del
ta-M
end
ota
Can
al
Creek
Orestimba
Orestimba Cr at Hwy 33
Orestimba Cr at River Road
Marshall Road Drain near River Road
40 0.5 10.25
Miles
Legend
Drip
Furrow
Monitoring Sites
Open
Pipe
") Tailwater Pond
JT C
row Rd.
Westside San Joaquin RiverWatershed Coalition
Orestimba Creek Subwatershed
Summers Engineering, Inc.Consulting Engineers
Hanford California
August 2010
Prosecution Team Response to Comments - Attachment B
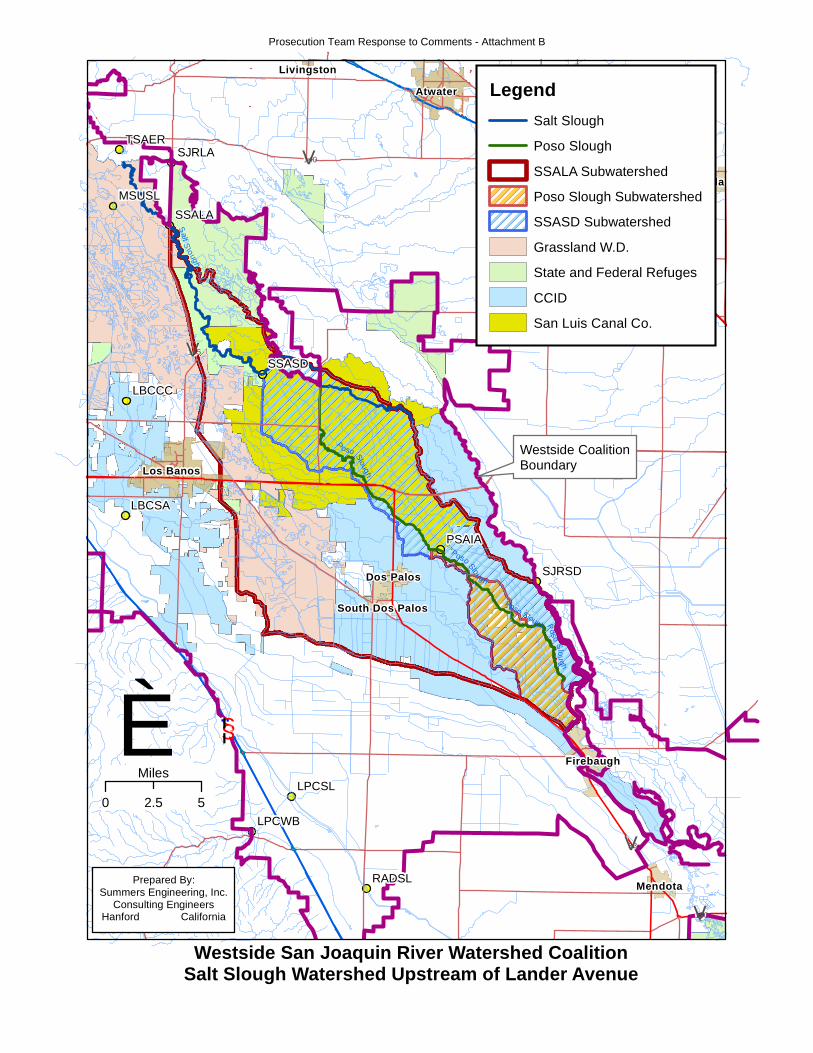
LBCSA
LPCWB
LPCSL
RADSL
PSAIA
TSAER
LBCCC
SSASD
SSALA
MSUSL
SJRLA
SJRSD
Sa
lt Slough
P
oso Slough
Poso Slough
Poso Slough
Poso S
lou
gh
§̈¦5
Merced
Los Banos
Atwater
Firebaugh
Mendota
Dos Palos
Planada
South Dos Palos
Livingston
UV165
UV140
UV33
UV59
UV180
UV140
0 52.5
Miles
È
Legend
Salt Slough
Poso Slough
SSALA Subwatershed
Poso Slough Subwatershed
SSASD Subwatershed
Grassland W.D.
State and Federal Refuges
CCID
San Luis Canal Co.
Westside CoalitionBoundary
Westside San Joaquin River Watershed CoalitionSalt Slough Watershed Upstream of Lander Avenue
Prepared By:Summers Engineering, Inc.
Consulting EngineersHanford California
Prosecution Team Response to Comments - Attachment B
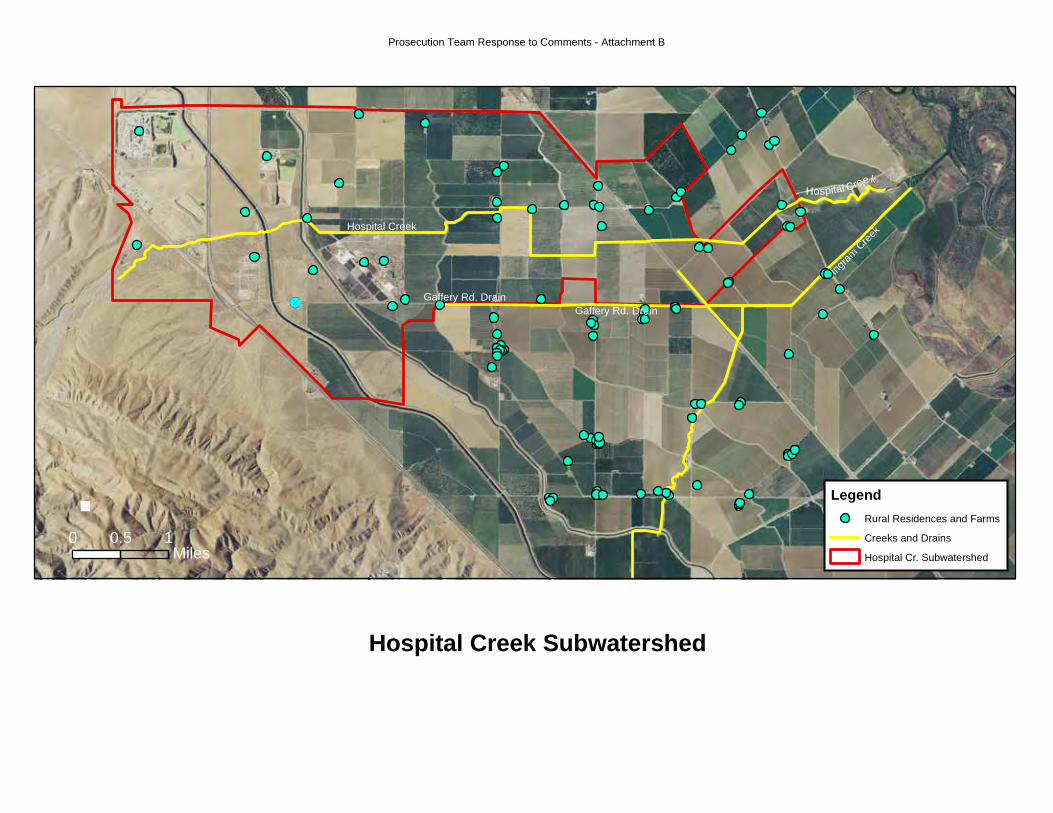
Hospital Creek
Ingr
am C
reek
Gaffery Rd. Drain
Hospital Creek
Gaffery Rd. Drain
Hospital Creek Subwatershed
0 10.5Miles
. Legend
Rural Residences and Farms
Creeks and Drains
Hospital Cr. Subwatershed
Prosecution Team Response to Comments - Attachment B
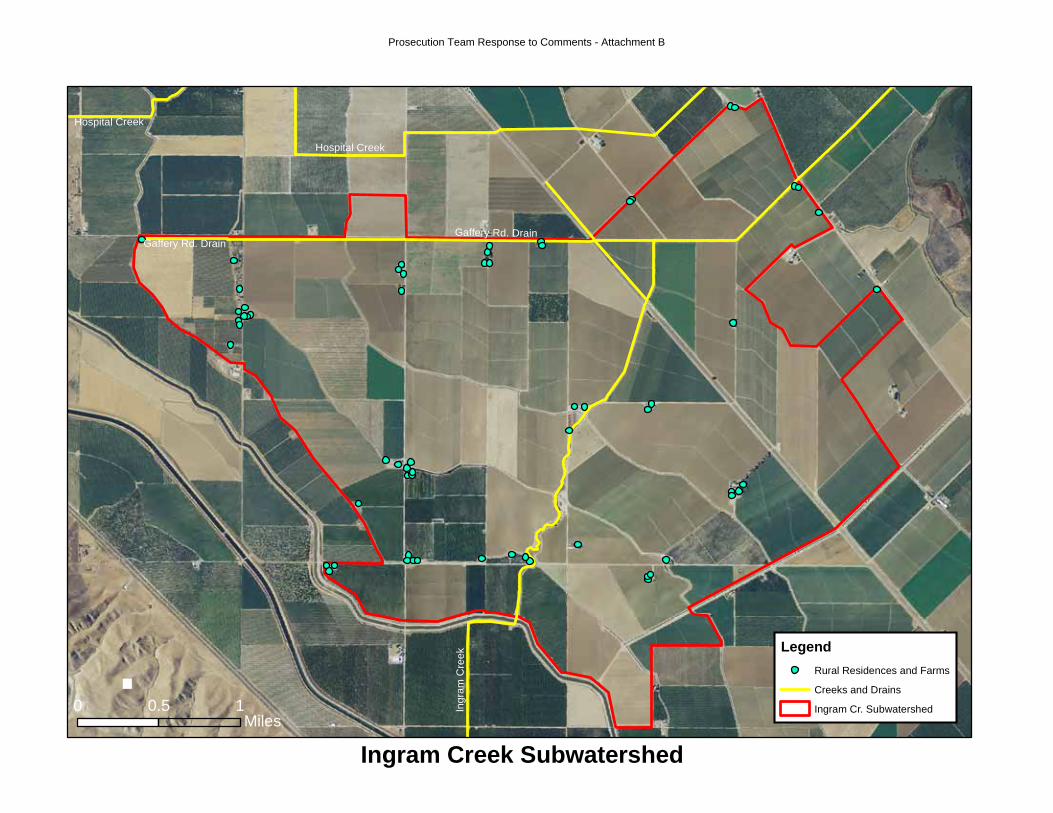
Ing
ram
Cre
ek
Hospital Creek
Gaffery Rd. Drain
Hospital Creek
Gaffery Rd. Drain
Ingram Creek Subwatershed
0 10.5Miles
. Legend
Rural Residences and Farms
Creeks and Drains
Ingram Cr. Subwatershed
Prosecution Team Response to Comments - Attachment B
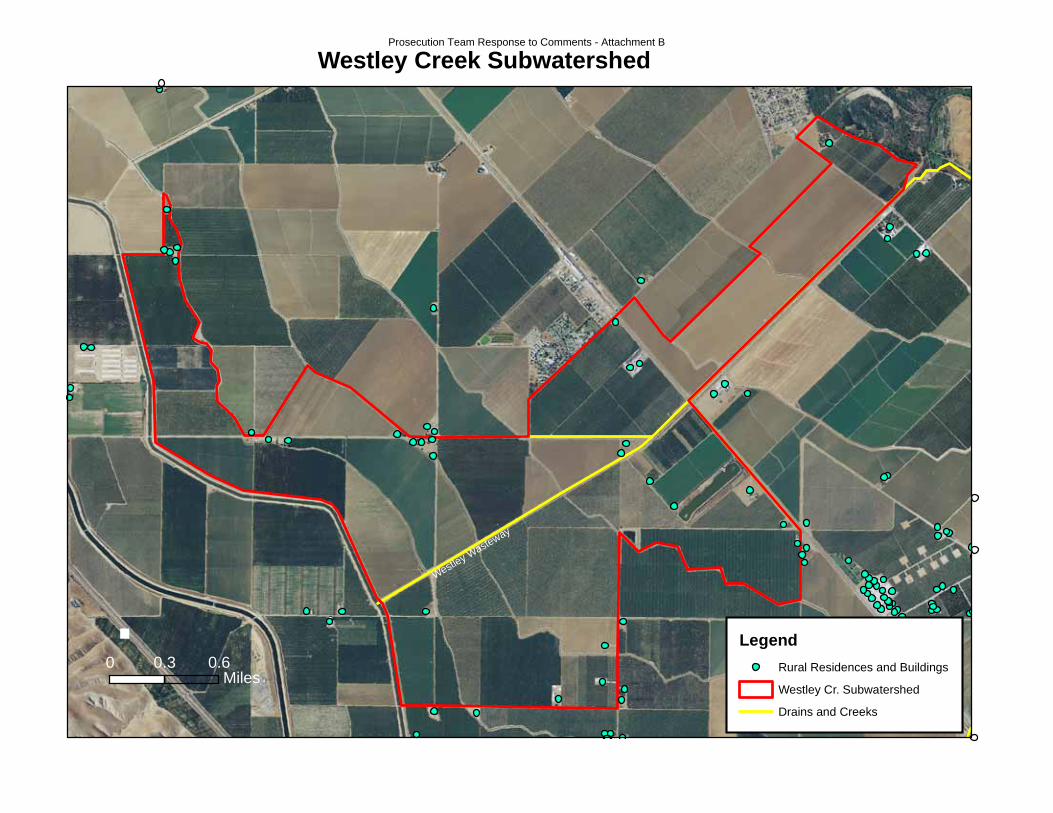
Westley Wasteway
Westley Creek Subwatershed
0 0.60.3Miles
. Legend
Rural Residences and Buildings
Westley Cr. Subwatershed
Drains and Creeks
Prosecution Team Response to Comments - Attachment B
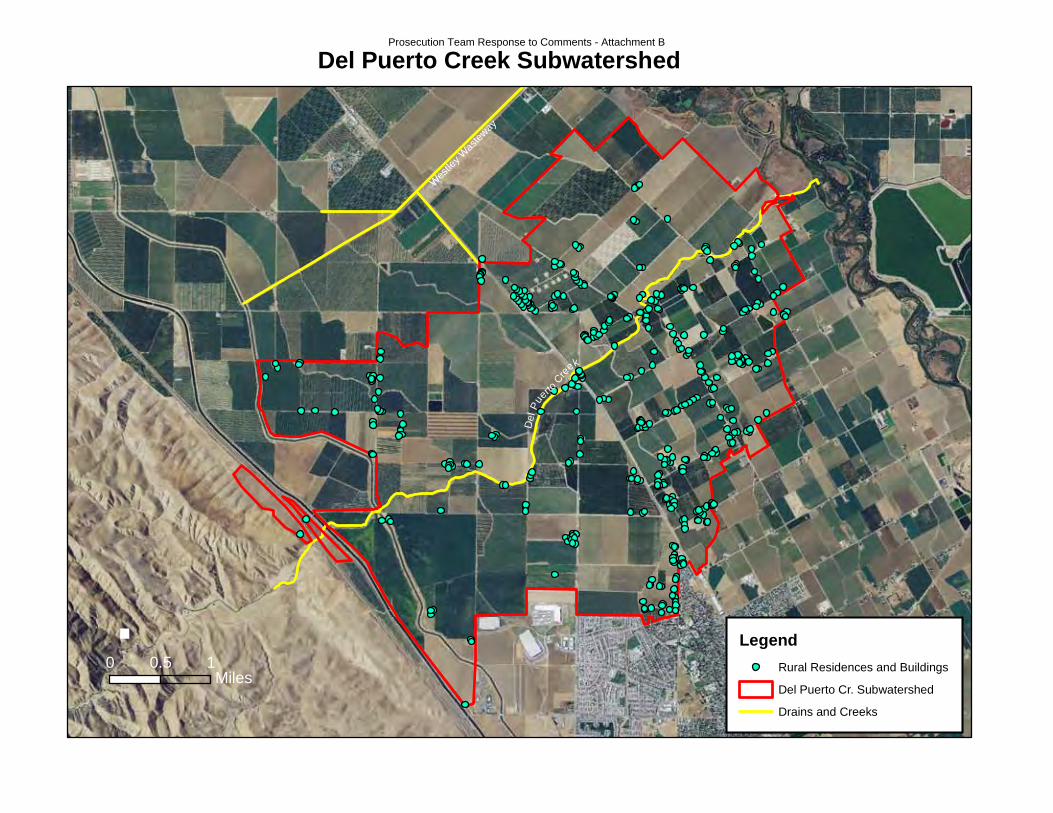
Del
Pue
rto C
re
ek
Wes
tley W
aste
way
Del Puerto Creek Subwatershed
0 10.5Miles
. Legend
Rural Residences and Buildings
Del Puerto Cr. Subwatershed
Drains and Creeks
Prosecution Team Response to Comments - Attachment B
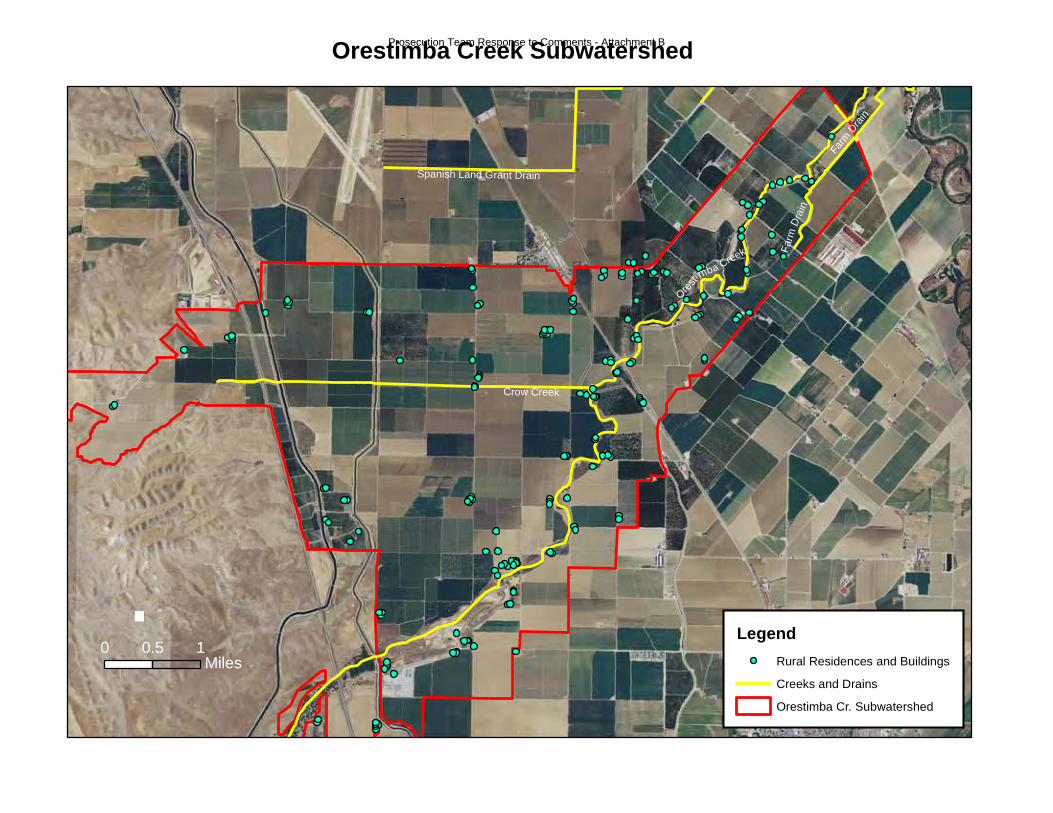
Ore
st
imba Creek
Crow Creek
Spanish Land Grant Drain
Farm
Dra
in
Far
m D
rain
Orestimba Creek Subwatershed
0 10.5Miles
.Legend
Rural Residences and Buildings
Creeks and Drains
Orestimba Cr. Subwatershed
Prosecution Team Response to Comments - Attachment B

Westside San Joaquin River Semi-Annual Report Watershed Coalition June 15, 2011
Outreach Handouts
Prosecution Team Response to Comments - Attachment B

Prosecution Team Response to Comments - Attachment B
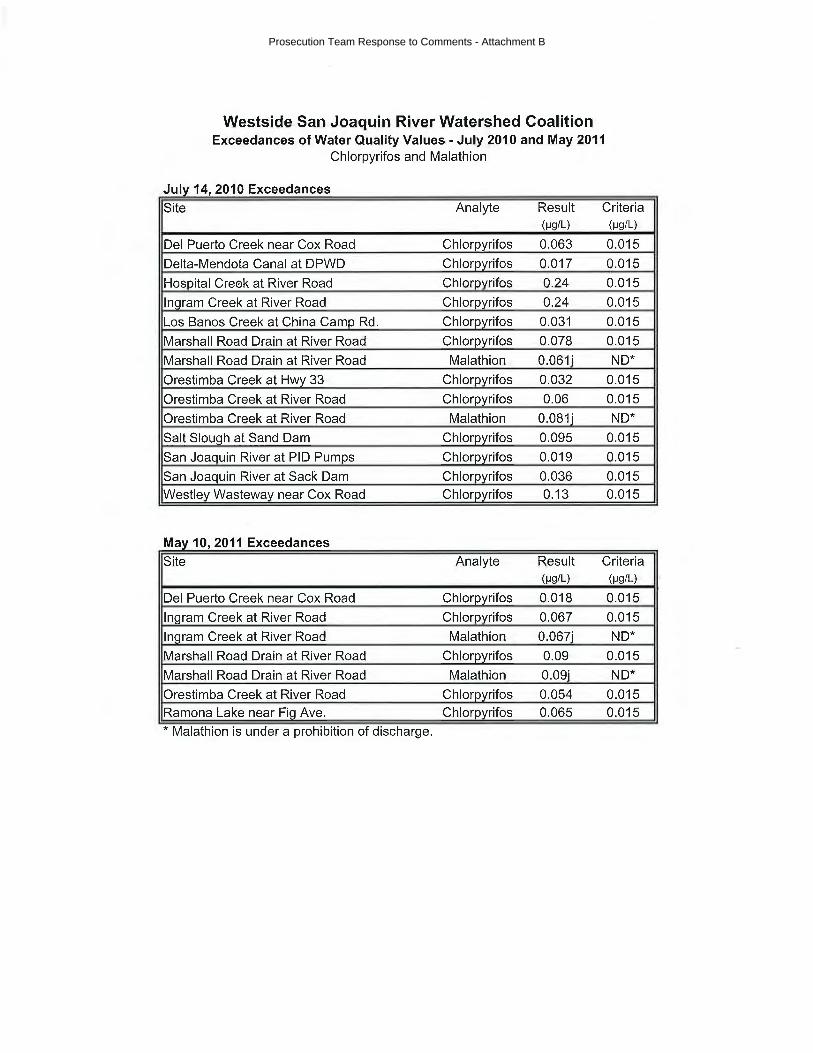
Prosecution Team Response to Comments - Attachment B
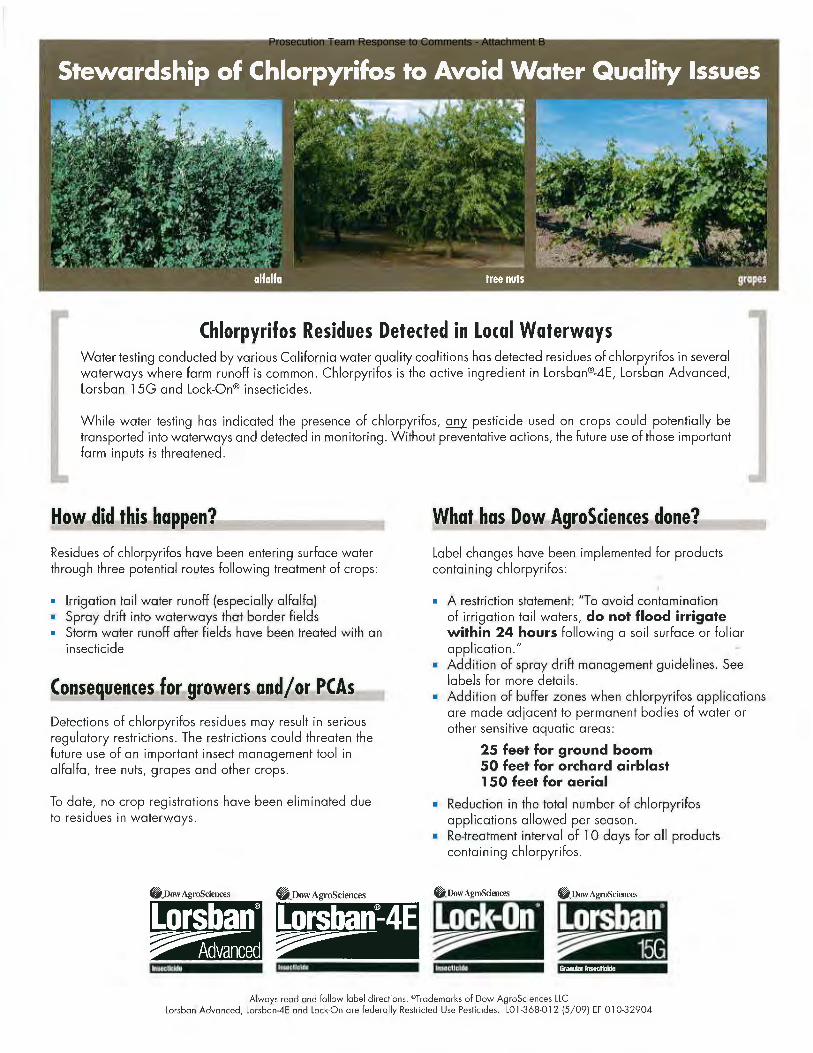
Prosecution Team Response to Comments - Attachment B
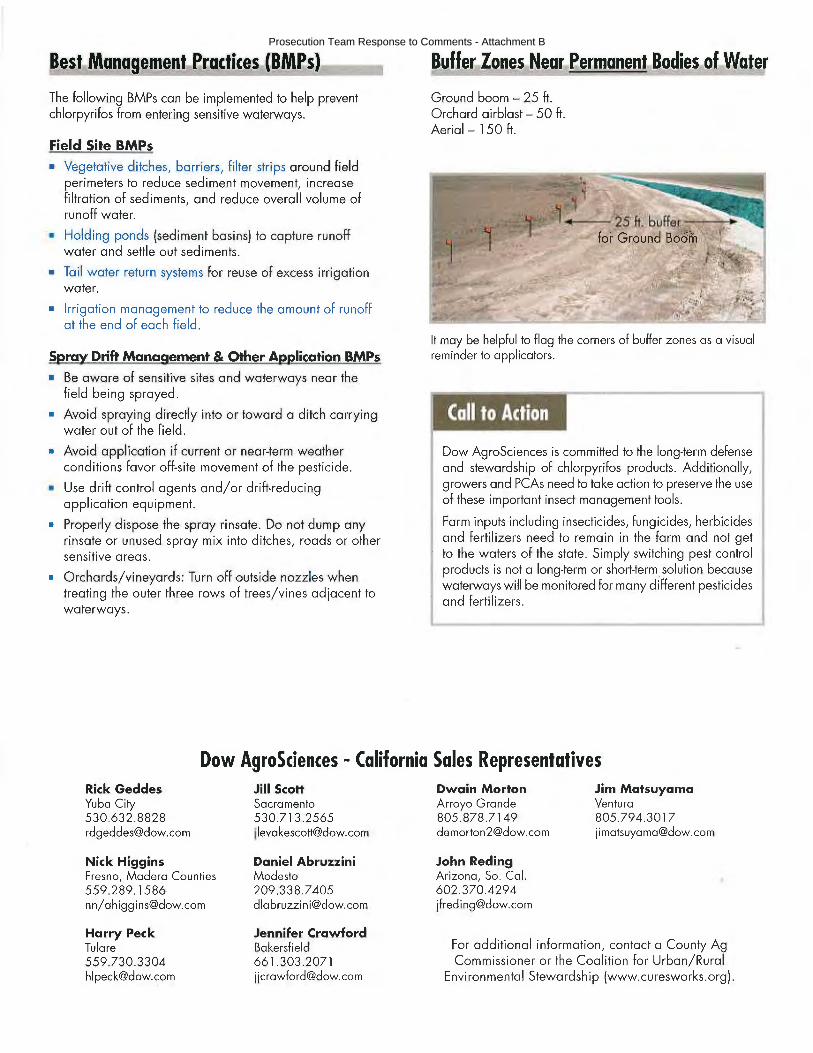
Prosecution Team Response to Comments - Attachment B
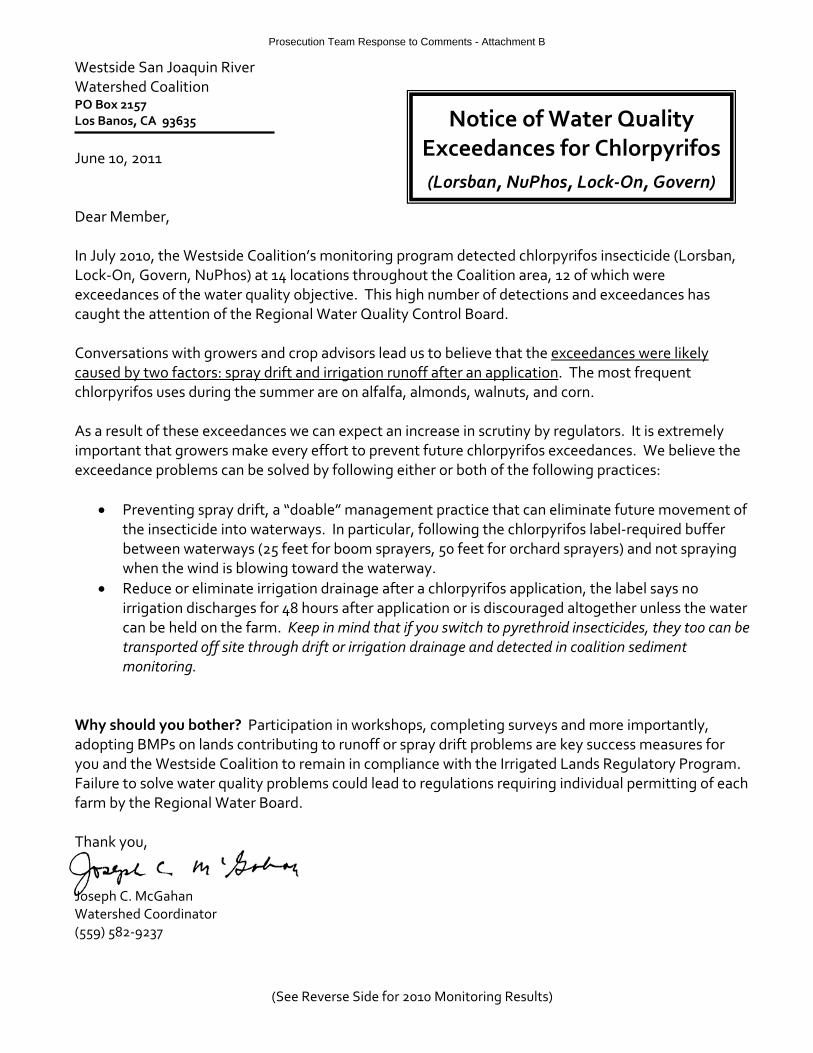
(See Reverse Side for 2010 Monitoring Results)
Westside San Joaquin River Watershed Coalition PO Box 2157 Los Banos, CA 93635 June 10, 2011 Dear Member, In July 2010, the Westside Coalition’s monitoring program detected chlorpyrifos insecticide (Lorsban, Lock‐On, Govern, NuPhos) at 14 locations throughout the Coalition area, 12 of which were exceedances of the water quality objective. This high number of detections and exceedances has caught the attention of the Regional Water Quality Control Board. Conversations with growers and crop advisors lead us to believe that the exceedances were likely caused by two factors: spray drift and irrigation runoff after an application. The most frequent chlorpyrifos uses during the summer are on alfalfa, almonds, walnuts, and corn. As a result of these exceedances we can expect an increase in scrutiny by regulators. It is extremely important that growers make every effort to prevent future chlorpyrifos exceedances. We believe the exceedance problems can be solved by following either or both of the following practices:
Preventing spray drift, a “doable” management practice that can eliminate future movement of the insecticide into waterways. In particular, following the chlorpyrifos label‐required buffer between waterways (25 feet for boom sprayers, 50 feet for orchard sprayers) and not spraying when the wind is blowing toward the waterway.
Reduce or eliminate irrigation drainage after a chlorpyrifos application, the label says no irrigation discharges for 48 hours after application or is discouraged altogether unless the water can be held on the farm. Keep in mind that if you switch to pyrethroid insecticides, they too can be transported off site through drift or irrigation drainage and detected in coalition sediment monitoring.
Why should you bother? Participation in workshops, completing surveys and more importantly, adopting BMPs on lands contributing to runoff or spray drift problems are key success measures for you and the Westside Coalition to remain in compliance with the Irrigated Lands Regulatory Program. Failure to solve water quality problems could lead to regulations requiring individual permitting of each farm by the Regional Water Board. Thank you, Joseph C. McGahan Watershed Coordinator (559) 582‐9237
Notice of Water Quality Exceedances for Chlorpyrifos
(Lorsban, NuPhos, Lock‐On, Govern)
Prosecution Team Response to Comments - Attachment B

Westside San Joaquin River Watershed CoalitionPesticide Water Quality Value Exceedances for the period of 3/1/2010 to 9/1/2010
Del Puerto Creek near Cox RoadAnalyte/Species Result Units
WQV MaxSample DateEvent
Chlorpyrifos 0.018 µg/L 0.0155/11/201067
Chlorpyrifos 0.063 ug/L 0.0157/14/201069
Hospital Creek at River RoadAnalyte/Species Result Units
WQV MaxSample DateEvent
Chlorpyrifos 0.045 µg/L 0.0155/11/201067
Chlorpyrifos 0.24 ug/L 0.0157/14/201069
Ingram Creek at River RoadAnalyte/Species Result Units
WQV MaxSample DateEvent
Chlorpyrifos 0.022 µg/L 0.0155/11/201067
Chlorpyrifos 0.24 ug/L 0.0157/14/201069
Los Banos Creek at China Camp RoadAnalyte/Species Result Units
WQV MaxSample DateEvent
Chlorpyrifos 0.031 ug/L 0.0157/14/201069
Marshall Road Drain near River RoadAnalyte/Species Result Units
WQV MaxSample DateEvent
Chlorpyrifos 0.53 µg/L 0.0155/11/201067
Chlorpyrifos 0.054 µg/L 0.0156/8/201068
Chlorpyrifos 0.078 ug/L 0.0157/14/201069
Orestimba Creek at Hwy 33Analyte/Species Result Units
WQV MaxSample DateEvent
Chlorpyrifos 0.079 µg/L 0.0156/8/201068
Chlorpyrifos 0.032 ug/L 0.0157/14/201069
Orestimba Creek at River RoadAnalyte/Species Result Units
WQV MaxSample DateEvent
Chlorpyrifos 0.20 µg/L 0.0156/8/201068
Chlorpyrifos 0.06 ug/L 0.0157/14/201069
Salt Slough at Sand DamAnalyte/Species Result Units
WQV MaxSample DateEvent
Chlorpyrifos 0.095 ug/L 0.0157/14/201069
Chlorpyrifos 0.038 ug/L 0.0158/10/201070
Westley Wasteway near Cox RoadAnalyte/Species Result Units
WQV MaxSample DateEvent
Chlorpyrifos 0.13 ug/L 0.0157/14/201069
Friday, June 10, 2011 Page 1 of 1
WQV = Water Quality Value as established by the Central Valley Regional Water Quality Control Board DNQ = Detected, Not Quantifiable
Prosecution Team Response to Comments - Attachment B
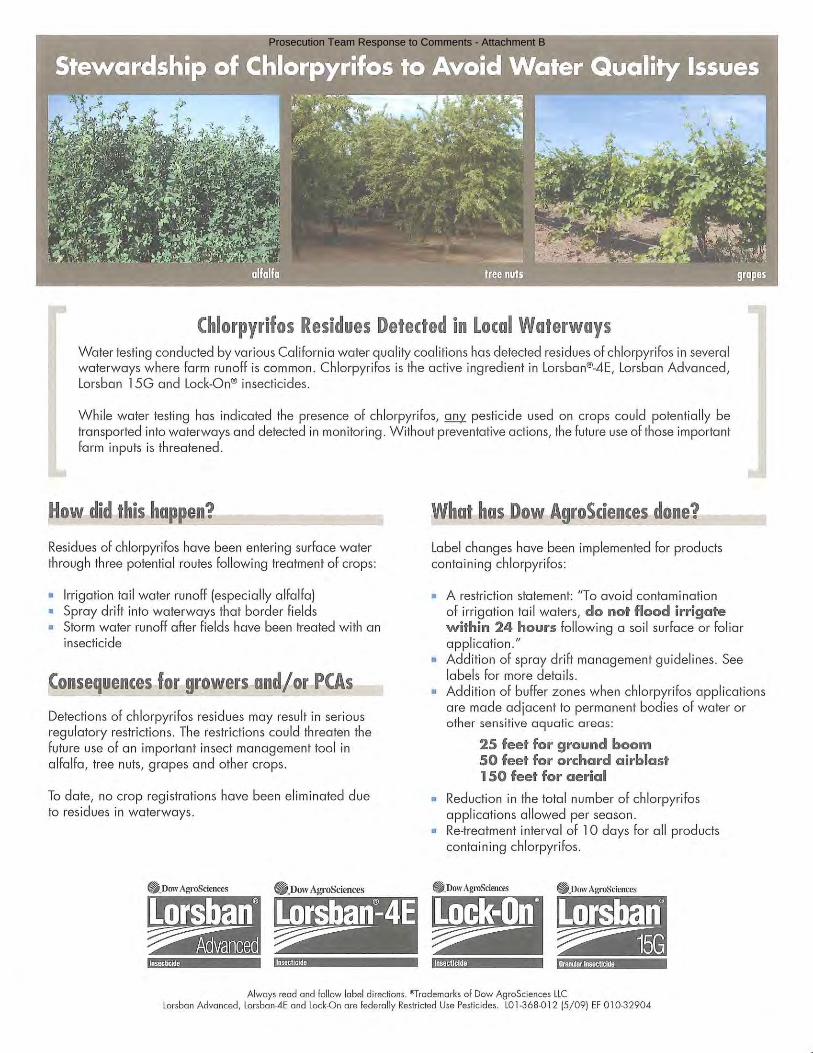
Prosecution Team Response to Comments - Attachment B
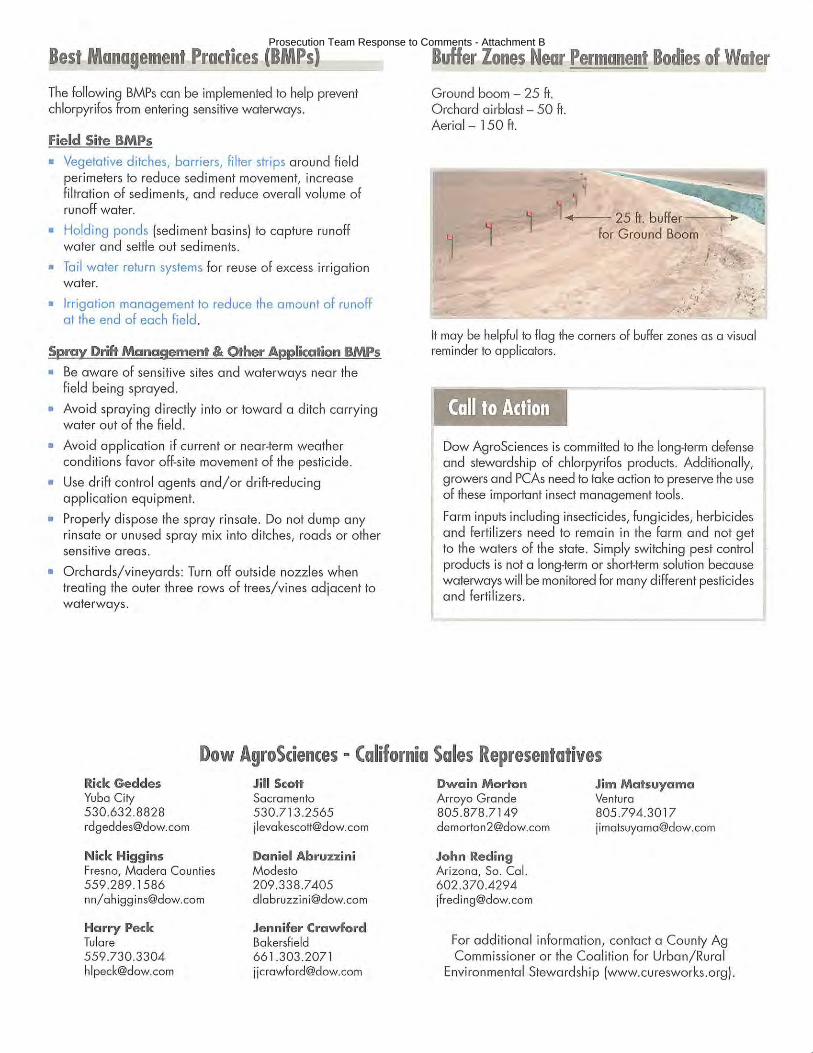
Prosecution Team Response to Comments - Attachment B

Westside San Joaquin River Semi-Annual Report Watershed Coalition June 15, 2011
Appendix A
Chain of Custody Sheets and Data Summary
Prosecution Team Response to Comments - Attachment B
Westside San Joaquin River Semi-Annual Report Watershed Coalition June 15, 2011
Appendix A Definitions
Sample Type: E: Event sample FD: Field duplicate sample FB: Field blank sample. Result Flags: ND: Not Detected. DNQ: Estimated result, detected below Reporting Limit. Note: Pesticides with results indicating “Non-Detect” are not reported in this summary. See Table 7 for a list of analytes. See Appendix C for the laboratory data reports.
Prosecution Team Response to Comments - Attachment B

Westside San Joaquin River Semi-Annual Report Watershed Coalition June 15, 2011
Appendix A Chain of Custody Sheets
Prosecution Team Response to Comments - Attachment B
Westside San Joaquin River Semi-Annual Report Watershed Coalition June 15, 2011
Appendix A Sediment and Aquatic Toxicity Results
Prosecution Team Response to Comments - Attachment B

Westside San Joaquin River Semi-Annual Report Watershed Coalition June 15, 2011
Appendix A Data Summary
Prosecution Team Response to Comments - Attachment B

Westside San Joaquin River Semi-Annual Report Watershed Coalition June 15, 2011
Appendix B Communication Reports
Organized by Event Date
Prosecution Team Response to Comments - Attachment B

Westside San Joaquin River Semi-Annual Report Watershed Coalition June 15, 2011
Appendix C Laboratory Data Reports and EDDs
Field Data Sheets CalTest General Physical, Drinking Water Data, Nutrient Data, Metals Data
APPL Pesticide Analyses Pacific Ecorisk Toxicity Reports Electronic Data Deliverable Files
Prosecution Team Response to Comments - Attachment B

Westside San Joaquin River Semi-Annual Report Watershed Coalition June 15, 2011
Appendix D Laboratory Quality Assurance Review
Prosecution Team Response to Comments - Attachment B

Westside San Joaquin River Semi-Annual Report Watershed Coalition June 15, 2011
Appendix E
Sampling Event Photos
Prosecution Team Response to Comments - Attachment B