west bay final report - university of texas at · pdf filesecondary bays of drum, christmas,...
TRANSCRIPT

Changes in Bay Shoreline Position, West Bay System, Texas
James C. Gibeaut, Rachel Waldinger, Tiffany Hepner, Thomas A. Tremblay, William A. White With assistance from Liying Xu
A Report of the Texas Coastal Coordination Council pursuant to National Oceanic and Atmospheric Administration Award No. NA07OZ0134
GLO Contract Number 02-225R
Bureau of Economic Geology Scott W. Tinker, Director
John A. and Katherine G. Jackson School of Geosciences The University of Texas at Austin
Austin, Texas 78713-8924
June 2003
Contents Introduction..........................................................................................................................1 Previous Work .....................................................................................................................2 Methods................................................................................................................................2
Historical Shoreline Mapping ........................................................................................2 Geographic Information System (GIS)..........................................................................4 Calculation of Average Annual Rate of Shoreline Change ...........................................4 Shoreline Types .............................................................................................................5 Beach Profiles ................................................................................................................5
Results..................................................................................................................................6
Discussion and Conclusions ..............................................................................................14
References..........................................................................................................................14 Appendix A: Vertical aerial photographs used for shoreline mapping.............................16 Appendix B: Beach profiles..............................................................................................17

1
Introduction
This report presents long-term rates of shoreline change along the bay shorelines of the
West Bay system of the Galveston Bay system (Fig. 1). In addition to West Bay, the smaller
secondary bays of Drum, Christmas, Bastrop, Chocolate, Jones, and Halls Lake are included in
this report. The successive positions of historical shorelines are combined in a linear regression
model that provides the average annual rate of shoreline change. Based on previous years,
therefore, these rates indicate how the shoreline is expected to advance seaward or retreat
landward during the next several decades, making this information useful for coastal planning.
The Bureau of Economic Geology is currently updating shoreline change rates for most of the
Texas coast under the Texas Shoreline Change Project. All data, including what is presented in
this report, are being placed in a web-based Geographic Information System (ArcIMS) on the
Bureau’s Texas Shoreline Change Project web site (http://www.beg.utexas.edu/coastal/intro.htm.
The public can use this web site to create custom maps and download data.
Gulf of Mexico#
West Bay System
GalvestonBay
#
East Bay
9 0 9 Miles
N
Figure 1. Location of West Bay System study area.

2
Previous Work
Scientists at the Bureau of Economic Geology have been mapping historical shorelines
and determining shoreline change rates since the early 1970’s. Paine and Morton (1986)
determined historical rates of shoreline change by comparing shorelines from topographic
surveys conducted by the U. S. Coast Survey from 1850 to 1852 and aerial photography from
1930 and 1982. The 1930 and 1982 shorelines originally mapped by Paine and Morton (1986)
were digitized and used in this report. Paine and Morton’s work covered the entire Galveston
Bay System including Trinity, Galveston, West, and East Bays. They determined shoreline
change from the 1850’s to 1930, from 1930 to 1982, and from the 1850’s to 1982. Lengths of
retreating, stable, and advancing shorelines were determined and average rates of shoreline
change were calculated at transect locations spaced 4,000 to 5,000 ft alongshore. This report
differs from the previous work in several significant ways: (1) only West Bay and it’s secondary
bays are included; (2) the 1850’s shorelines are not used because of accuracy concerns and the
desire to measure the effects of more recent processes on shoreline change; (3) average annual
rates of change are computed by a linear regression of shoreline positions from 1930, 1956,
1982, and 1995; (4) rates are determined at transects spaced 25 m (82 ft) alongshore; and (5)
rates are matched with detailed information on shoreline type.
Methods
Historical Shoreline Mapping
The rate of shoreline change is determined by comparing the positions of historical
shorelines. Shorelines from 1930, 1956, 1982, and 1995 (Appendix A) were mapped using
vertical aerial photographs. The 1930 and 1982 shorelines were mapped by Paine and Morton
(1986) using an optical technique. This technique is a two-step process. First, the shoreline
feature is identified and traced on the photograph; second, the shoreline is transferred to a
common base map using a Saltzman projector to adjust the scale of the photograph to match the
base maps. The base maps were U.S. Geological Survey, 1:24,000-scale, 7.5 minute, topographic
quadrangle maps. Paine and Morton made linear measurements between shorelines on the
hardcopy base maps. For this study, however, we digitized the lines on the original base maps
and integrated them into a Geographic Information System (GIS).

3
The 1956 and 1995 shorelines were also mapped from aerial photography, but digital
methods were used to rectify the photographs to a common base map. The 1995 photographs
were obtained as color infrared digital orthophoto quarter quadrangles (DOQQ) from the Texas
Natural Resources Information System and served as base maps to which the 1956 photographs
were registered. The DOQQ’s are created by using camera and flight information, digital
elevation models, and ground control points. The film is scanned with 24-bit color and 1-meter
spatial resolution. They meet National Map Accuracy Standards for 1:12,000-scale maps (i.e., 90
percent of well-defined test points must fall within 10 m (32.8 ft) of their real location), but our
field tests have shown them to be accurate to within 5 m (16.4 ft).
The 1956 photographs are 1:24,000-scale mosaics scanned at 1,000 dots per inch and
imported into Earth Resource Mapping’s ER Mapper software, version 6.2, for rectification.
Rectification involved the establishment of ground control points that linked each image to its
corresponding aerial coverage on a DOQQ. Points were chosen on the image that matched points
on the DOQQ. Road intersections and other cultural features are preferred as reference points
rather than natural features. However, in many cases cultural features are lacking and features
such as trees, shrubs, and the edges of water bodies were used. Where possible, points were
evenly spaced across the image, with special emphasis on the edges of the image, and on areas
near the shoreline. The number of ground control points used for each photomosaic varied
depending on how distorted it was and on the availability of suitable reference features. The
average range was approximately 80 to 100 points per photo mosaic.
Once all the ground control points are established for a photograph, the image is rectified
using ER Mapper’s implementation of Delaunay Triangulation. Once the rectification is
complete, the image is made semitransparent and overlain on the DOQQ. In some areas a
"double image" occurs, indicating that either more ground control points are needed, or one or
more existing ground control points have been placed incorrectly. In these cases, images were
reprocessed to correct any remaining distortion. The rectified 1956 photographs and the1995
DOQQ’s were imported into ArcView GIS software and the shoreline was digitized at a scale of
1:3,000.

4
The shoreline features used in the 1930 and 1982 photographs was the land-water
boundary (water line) (Paine and Morton, 1986). For the 1956 and 1995 shorelines we used the
boundary between wet and dry sediment (wet/dry line) if it was evident. This boundary
represents the upper reach of the wave swash during the preceding high tide and is less
susceptible to daily changes in bay water levels, which are not related to shoreline changes, than
the water line. Often, however, the wet/dry line is not distinct from the water line, and the
mapped shoreline may follow the visible water line or the scarp of an erosional shoreline. Where
there is no beach, the shore and vegetation lines will coincide, and because of tidal and
meteorological changes in water levels and gently sloping bay margins, the vegetation line in
places is more closely related to average water level than the wet/dry line. Because of the low
tide range (~0.15 m), the differences in shoreline positions based on various shoreline features is
small within the context of computing shoreline change rates over a period of 65 years.
Geographic Information System (GIS)
All shoreline data were compiled into ArcView GIS software. Shorelines that were
transferred onto hardcopy base maps from the historical photographs were digitized. Once in the
GIS, the shorelines were compared against each other for consistency. They were also overlain
on the 1995 DOQQ’s to help determine proper registration. The historical shorelines are
available for viewing and download on the Texas Shoreline Change Project Web site
(http://www.beg.utexas.edu/coastal/intro.htm).
Calculation of Average Annual Rate of Shoreline Change
Shoreline data were processed by the Shoreline Shape and Projection Program (SSAPP)
developed by the Bureau of Economic Geology. SSAPP automatically draws a segmented
baseline that follows the trend of the historical shorelines. Transects that intersect the shorelines
are constructed perpendicular to this baseline. Distances between the shoreline positions along
each transect are determined, and in this study, a linear regression model was used to calculate
the average annual rate of shoreline change. The baseline segment length varied between 50 and
400 m so that shoreline curvature could be adequately followed. Transect spacing was 25 m.
Shoreline change rates were computed for only those transects where all four historical
shorelines (1930, 1956, 1982, and 1995) are available. A GIS point file was generated with

5
shoreline change rates and shoreline types (see below) as attributes. This point file may be
viewed and downloaded at the Texas Shoreline Change Project Web site
(http://www.beg.utexas.edu/coastal/intro.htm).
Shoreline Types
Shoreline types were mapped by Morton and White (1995) for the purpose of oil spill
response and contingency planning. The digital shoreline was derived from U.S. Geological
Survey 7.5 minute quadrangle maps and was classified under the Environmental Sensitivity
Index (ESI) system developed by Research Planning, Inc. The ESI system ranks shoreline types
in relation to their sensitivity to damage by oil spills and difficulty in removing oil. The shoreline
was classified using vertical and oblique photography and low-altitude oblique video. The
classification is a detailed characterization of shoreline types and includes all types occurring in
the West Bay system. The shoreline change rate point file was coded with the shoreline type
attribute of the polygon file from the ESI mapping. An automated routine and manual editing
was used to accomplish this. Some shorelines have undergone significant modification through
dredging, dredge spoil disposal, filling for land development, and emplacement of erosion
control structures. A shoreline modification attribute, therefore, was added to the shoreline
change rate point file so that statistics and causes of shoreline change could be determined
separately for natural and unnatural shoreline settings.
Beach Profiles
On January 30 and 31, 2002, topographic ground-survey transects were conducted at 5
locations (Fig. 2) along the bay sides of Galveston and Follets Islands. The transects are oriented
perpendicular to the shoreline and extend from upland environments to approximately 2 ft (0.61
m) water depths. Two of the transects (WST-04 and BEG-12) span the entire barrier island from
the Gulf to the bay. Transects, or “beach profiles,” provide data for checking the accuracy of
shorelines mapped from photography. They also provide data on the geomorphology and
sediment and vegetation characteristics. The ground surveys can also be repeated frequently to
detect short-term shoreline changes.

6
Transect locations were selected based on shoreline types, energy level, rate of historical
change, and accessibility. At each location, an existing feature was used as a datum point, or if
that was not possible, a temporary marker consisting of a steel pipe with a piece of flat stock
welded on the end was buried with about 30 cm of the pipe above ground. The datum point of
each profile was surveyed using precise differential Global Positioning System (GPS)
techniques. Geodetic Trimble 4000ssi GPS receivers were used to collect GPS data at each
profile. The Galveston CORS (Continuously Operating Reference Station) site (GAL1) served as
the reference station. GPS data were post-processed using phase differencing techniques to
provide positions of the datum markers accurate to within a few centimeters. All survey data are
provided in the NAD83 datum. Vertical measurements are expressed as heights above the
reference ellipsoid (HAE). Using the Geoid99 model, HAE heights were converted to
orthometric heights relative to NAVD 88, which approximates mean sea level. A local mean sea
level correction was than applied to the orthometric height based upon vertical information from
the bayside Pier 21 tide gauge in Galveston.
Beach profiles were measured using a Sokkia Set 5W Electronic Total Station and a
reflecting prism. Vegetation, sediment type, and geomorphic features were noted along each
transect line. Navigation back to the marker locations will be possible using real-time differential
GPS. Data tables and graphs are provided in Appendix B.
Results
Figure 2 is a map showing the distribution of the rate of shoreline change in the West Bay
system. A total of 6,490 transects were measured spaced 82 ft (25 m) alongshore for a total
measured shoreline length of 100.8 miles. Shoreline length is actually longer than this because
not all shoreline segments were measured. The map shows that the smaller, low-energy bays
have overall lower rates of retreat than in West Bay. The effects of dredging on retreat and spoil
disposal on advance are also apparent.

7
4 0 4 Miles
N
Average Annual Shoreline Rate of Change1930 to 1995
Rate of Change (ft/yr)
-44.9 - -33.4#
-33.4 - -23.4#
-23.4 - -17.5#
-17.5 - -13.7#
-13.7 - -11.3#
-11.3 - -9.7#
-9.7 - -8.5#
-8.5 - -7.5#
-7.5 - -6.7#
-6.7 - -5.9#
-5.9 - -5.2#
-5.2 - -4.5#
-4.5 - -3.9#
-3.9 - -3.4#
-3.4 - -2.8#
-2.8 - -2.3#
-2.3 - -1.8#
-1.8 - -1.4#
-1.4 - -0.9#
-0.9 - -0.5#
-0.5 - -0.1#
-0.1 - 0.4#
0.4 - 1.2#
1.2 - 2.1#
2.1 - 3.2#
3.2 - 4.7#
4.7 - 6.6#
6.6 - 8.9#
8.9 - 12.9#
12.9 - 18.9#
negative= retreat; positive= advance
West Bay
Christmas B
ay
BastropBay
San Luis Pass
West Bay
Gulf of Mexico
####################################################
############################ ###################
#############################################
###########################################################################################################
############################################################################
############################################################################################################################################################################################################################################################################################################################
###########################################################################################################################################
###########################################
####################################################################################################################################################################################################################
############################################################################################################################################
#####################################################
#############################################################################
######################################################################################################################
##################################################
################################################################################################################################################################################################################################################################################## ###############################
################################################################################################################################################################################################################################
####################################################################################################################################################################################################################################
###############
#######################################
##########################################################################################################
########################################################################################
######################################
#######################################################################################################
##############################
################################################################################################################
#######################
################################################################################################
###################################################################
##########################################################################################
##################################################
##########################################################################################################################################################
#####################################################################################################################################################################################################################################################
##########################################################################################################################
#######################################
###################################################################################################################################################################
##############################################
#######################################################################################################################################################
##########################################################################################
###
################################################################################################################################################################################
#####################################################################################################
######################################################################################################################################################################################################################################################################################################
######################################################################################################################################################################################################################################################
###########################
#####################################################################################################################################################################################################################################################################################################################################################################################################################################################
########################################
##########################################################
###############################################################################################################################################################
##################################################################################################################################################
#####################################################################################################################################################################################################################################################
######################################
#########################################################################################################
###########################################################################################
##########################################
################################################################
#######################################################################################################################
#
DrumBay
# FolletsIsland
Galvesto
n Island
Chocolate
Bay #
Halls Lake
dredged
spoil
spoil
spoil
fill
fill and riprap
walls and riprap
walls
Galveston IslandState Park
walls
#
Intracoastal Waterway
spoil
#
Intracoastal Waterway
#
JamaicaBeach
JonesBay
#
WST04
# BEG12
#
WST02
#
WST01
#
WST03
# WST01 - beach profile location
Figure 2. Shoreline change map of the West Bay system.

8
Figure 3 is a series of pie charts showing statistics for each bay and natural versus
unnatural shorelines. Shorelines are classified as retreating if the change rate, as determined by
the slope of a linear regression line through the 1930, 1956, 1982, and 1995 shoreline positions,
is less than -2 ft/yr (-0.61 m/yr). Advancing shorelines have rates greater than 2 ft/yr (0.61 m/yr)
and stable shorelines have rates between -2 and 2 ft/yr (±0.61 m/yr). The selection of ±2 ft/yr
(±0.61 m/yr) as the interval for stable shorelines is based on a conservative estimate of the
mapping accuracy of the shoreline positions and the limitations of quantifying a continuously
varying geologic process with 4 data points over 65 years time. The shoreline positions in this
study need to be accurate to within approximately 50 ft (15.2 m) to reliably measure change with
an accuracy of 2 ft/yr (0.61 m/yr). Comparisons of shorelines and DOQQ’s show that the
shoreline positions are accurate to within 50 ft (15.2 m). Furthermore, natural geologic processes
that cause relatively high-frequency shoreline shifts in the West Bay system are expected to be
much less than 2 ft/yr, thus inadvertently sampling a shoreline shifted by a short-term process is
not problematic.
Overall, 87 % of the shoreline is considered natural and not directly affected by
anthropogenic activities. Half of these natural shorelines are retreating with the greatest
percentage of retreat occurring in West and Jones Bays (Figs. 2, 3). Drum Bay and Halls Lake,
which is actually a bay, are sheltered from waves and have only 5 and 15 %, respectively, of
their shorelines naturally retreating. The moderately exposed bays of Christmas, Chocolate, and
Bastrop have 28 to 40 % of their shorelines naturally retreating. West and Jones Bays are
relatively exposed to wave activity with much of their shorelines facing long fetches. These bays
have the highest percentages of naturally retreating shoreline with West Bay at 57 % and Jones
Bay at 69 %. Table 1 list natural shoreline change rates by bays and shoreline type.

9
1%1%5%
88%
6%Drum Bay
40%
60%
Bastrop Bay
1%4%
6%
28%
59%
2%Christmas Bay
34%
63%
3% Chocolate Bay
15%
77%
8%Halls Lake
14%
5%
69%
11%Jones Bay
8%
7%
7%
57%
20%
1%West Bay4% 5%
4%
43%
42%
2% All Bays
Retreat - Unnatural
Stable - Unnatural
Advance - Unnatural
Retreat - Natural
Stable - Natural
Advance - Natural
Figure 3. Rate of shoreline change according to bay and naturalness of shoreline. Stable shorelines are classified as having change rates equal to or less than 2 ft/yr. Retreating and advancing shorelines have change rates of more than 2 ft/yr.

10
Table 1. Shoreline change rates by bay and shoreline type for natural shorelines.Scarps and Steep Slopes in Clay - Natural Shorelines Only
Location length (mi) % of bay length length (mi) % of type length (mi) % of type length (mi) % of type mean std. dev. min. max.Drum Bay 0.00 0.0 0.00 0.0 0.00 0.0 0.00 0.0Bastrop
Bay 0.42 5.4 0.00 0.0 0.43 100.0 0.00 0.0 -1.1 0.6 -1.9 0.4Christmas
Bay 1.60 13.3 0.80 49.5 0.82 50.5 0.00 0.0 -2.3 0.9 -4.7 -0.6Chocolate
Bay 2.14 14.2 0.65 29.7 1.53 70.3 0.00 0.0 -1.8 1.6 -7.1 1.7Halls Lake 0.00 0.0 0.00 0.0 0.00 0.0 0.00 0.0Jones Bay 0.37 9.3 0.17 45.8 0.21 54.2 0.00 0.0 -2 0.4 -3 -1.4West Bay 1.21 2.4 0.71 57.7 0.50 41.0 0.02 1.3 -2.4 2.5 -6.6 2.2All Bays 5.75 5.7 2.33 40.0 3.49 59.7 0.02 0.3 -2 1.6 -7.1 2.2
Fine-Grained Sand Scarps, Steep Slopes, and Beaches - Natural Shorelines Only
Location length (mi) % of bay length length (mi) % of type length (mi) % of type length (mi) % of type mean std. dev. min. max.Drum Bay 0.00 0.0 0.00 0.0 0.00 0.0 0.00 0.0Bastrop
Bay 0.00 0.0 0.00 0.0 0.00 0.0 0.00 0.0Christmas
Bay 0.00 0.0 0.00 0.0 0.00 0.0 0.00 0.0Chocolate
Bay 1.86 12.3 0.84 44.2 0.93 49.2 0.13 6.7 -2.1 2.3 -7.8 5.2Halls Lake 0.00 0.0 0.00 0.0 0.00 0.0 0.00 0.0Jones Bay 0.00 0.0 0.00 0.0 0.00 0.0 0.00 0.0West Bay 3.18 6.4 2.15 66.3 1.04 32.2 0.05 1.5 -4.3 3.9 -19 2.9All Bays 5.05 5.0 2.98 58.2 1.97 38.5 0.17 3.4 -3.5 3.5 -19 5.2
Mixed Sand and Gravel (Shells) Beaches - Natural Shorelines Only
Location length (mi) % of bay length length (mi) % of type length (mi) % of type length (mi) % of type mean std. dev. min. max.Drum Bay 0.00 0.0 0.00 0.0 0.00 0.0 0.00 0.0Bastrop
Bay 0.00 0.0 0.00 0.0 0.00 0.0 0.00 0.0Christmas
Bay 0.00 0.0 0.00 0.0 0.00 0.0 0.00 0.0Chocolate
Bay 0.20 1.3 0.09 46.2 0.11 53.8 0.00 0.0 -2.7 2.2 -5.5 -0.1Halls Lake 0.00 0.0 0.00 0.0 0.00 0.0 0.00 0.0Jones Bay 0.23 5.8 0.06 26.7 0.17 73.3 0.00 0.0 -1.4 0.8 -2.6 0.1West Bay 3.01 6.0 2.48 80.9 0.58 19.1 0.00 0.0 -4.1 2.5 -16 1.2All Bays 3.45 3.4 2.63 75.2 0.87 24.8 0.00 0.0 -3.8 2.5 -16 1.2
Gravel Beaches (Shell) - Natural Shorelines Only
Location length (mi) % of bay length length (mi) % of type length (mi) % of type length (mi) % of type mean std. dev. min. max.Drum Bay 0.05 0.5 0.00 0.0 0.05 100.0 0.00 0.0 -0.2 0.2 -0.4 0.1Bastrop
Bay 0.11 1.4 0.03 28.6 0.08 71.4 0.00 0.0 -1 1.1 -2.2 0.6Christmas
Bay 1.15 9.5 0.63 54.1 0.54 45.9 0.00 0.0 -1.8 1 -3.3 0.2Chocolate
Bay 0.02 0.1 0.00 0.0 0.02 100.0 0.00 0.0 -1.9 0 -1.9 -1.9Halls Lake 0.00 0.0 0.00 0.0 0.00 0.0 0.00 0.0Jones Bay 0.03 0.8 0.00 0.0 0.03 100.0 0.00 0.0 -0.2 0.2 -0.3 -0.1West Bay 0.68 1.4 0.19 27.3 0.32 45.5 0.19 27.3 -0.4 3.4 -9.1 4All Bays 2.03 2.0 0.85 41.2 1.03 49.6 0.19 9.2 -1.2 2.2 -9.1 4
retreating stable advancing
retreating stable advancing
retreating stable advancing
retreating stable advancing

11
Table 1. ContinuedExposed Tidal Flats - Natural Shorelines Only
Location length (mi) % of bay length length (mi) % of type length (mi) % of type length (mi) % of type mean std. dev. min. max.Drum Bay 0.53 5.7 0.00 0.0 0.43 79.4 0.11 20.6 0.3 1.9 -2 4.3Bastrop
Bay 0.00 0.0 0.00 0.0 0.00 0.0 0.00 0.0Christmas
Bay 0.00 0.0 0.00 0.0 0.00 0.0 0.00 0.0Chocolate
Bay 0.00 0.0 0.00 0.0 0.00 0.0 0.00 0.0Halls Lake 0.00 0.0 0.00 0.0 0.00 0.0 0.00 0.0Jones Bay 0.00 0.0 0.00 0.0 0.00 0.0 0.00 0.0West Bay 1.21 2.4 1.23 100.0 0.00 0.0 0.00 0.0 -5.8 2.9 -13 -2.2All Bays 1.74 1.7 1.23 69.6 0.43 24.1 0.11 6.3 -3.9 3.8 -13 4.3
Sheltered Scarps - Natural Shorelines Only
Location length (mi) % of bay length length (mi) % of type length (mi) % of type length (mi) % of type mean std. dev. min. max.Drum Bay 0.00 0.0 0.00 0.0 0.00 0.0 0.00 0.0Bastrop
Bay 0.00 0.0 0.00 0.0 0.00 0.0 0.00 0.0Christmas
Bay 0.00 0.0 0.00 0.0 0.00 0.0 0.00 0.0Chocolate
Bay 0.42 2.8 0.02 3.7 0.41 96.3 0.00 0.0 -0.6 1 -2.3 1.3Halls Lake 0.00 0.0 0.00 0.0 0.00 0.0 0.00 0.0Jones Bay 0.00 0.0 0.00 0.0 0.00 0.0 0.00 0.0West Bay 0.16 0.3 0.02 10.0 0.14 90.0 0.00 0.0 -0.9 0.9 -3.4 -0.5All Bays 0.57 0.6 0.03 5.4 0.55 94.6 0.00 0.0 -0.7 0.9 -3.4 1.3
Salt and Brackish Water Marshes - Natural Shorelines Only
Location length (mi) % of bay length length (mi) % of type length (mi) % of type length (mi) % of type mean std. dev. min. max.Drum Bay 8.54 92.3 0.43 4.9 7.81 90.0 0.44 5.1 -0.4 1.3 -7.9 5.9Bastrop
Bay 7.22 93.2 3.15 43.0 4.18 57.0 0.00 0.0 -1.9 1.6 -7.3 1.3Christmas
Bay 8.05 66.8 2.03 24.9 5.84 71.4 0.30 3.7 -1.1 1.9 -4.7 10.8Chocolate
Bay 10.49 69.3 3.68 34.5 6.66 62.5 0.32 3.0 -1.9 3.1 -9.8 18.9Halls Lake 2.75 100.0 0.41 14.7 2.16 77.4 0.22 7.9 -0.5 1.4 -4.3 3.4Jones Bay 2.58 64.6 2.57 98.2 0.05 1.8 0.00 0.0 -4.1 1.2 -9.1 -1.4West Bay 29.20 58.5 21.80 73.5 7.62 25.7 0.24 0.8 -5.6 6 -45 3.6All Bays 68.83 68.3 34.07 48.7 34.31 49.1 1.51 2.2 -3.2 4.7 -45 18.9
retreating stable advancing
retreating stable advancing
retreating stable advancing
12
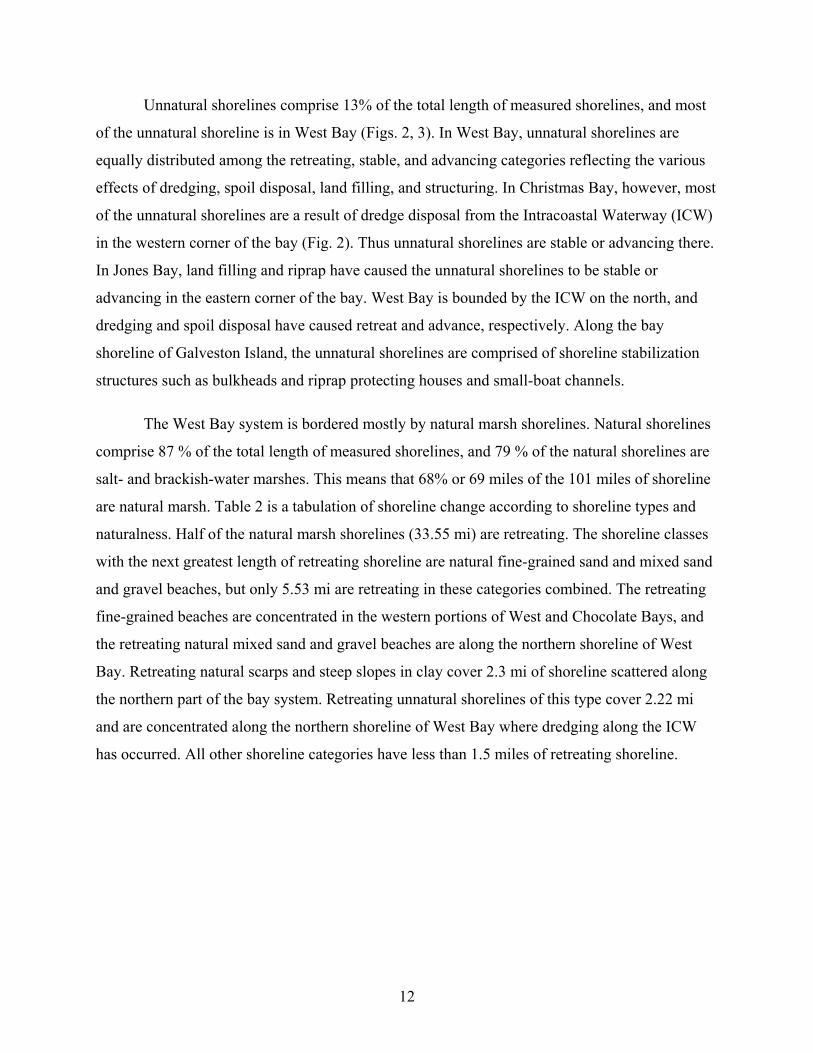
Unnatural shorelines comprise 13% of the total length of measured shorelines, and most
of the unnatural shoreline is in West Bay (Figs. 2, 3). In West Bay, unnatural shorelines are
equally distributed among the retreating, stable, and advancing categories reflecting the various
effects of dredging, spoil disposal, land filling, and structuring. In Christmas Bay, however, most
of the unnatural shorelines are a result of dredge disposal from the Intracoastal Waterway (ICW)
in the western corner of the bay (Fig. 2). Thus unnatural shorelines are stable or advancing there.
In Jones Bay, land filling and riprap have caused the unnatural shorelines to be stable or
advancing in the eastern corner of the bay. West Bay is bounded by the ICW on the north, and
dredging and spoil disposal have caused retreat and advance, respectively. Along the bay
shoreline of Galveston Island, the unnatural shorelines are comprised of shoreline stabilization
structures such as bulkheads and riprap protecting houses and small-boat channels.
The West Bay system is bordered mostly by natural marsh shorelines. Natural shorelines
comprise 87 % of the total length of measured shorelines, and 79 % of the natural shorelines are
salt- and brackish-water marshes. This means that 68% or 69 miles of the 101 miles of shoreline
are natural marsh. Table 2 is a tabulation of shoreline change according to shoreline types and
naturalness. Half of the natural marsh shorelines (33.55 mi) are retreating. The shoreline classes
with the next greatest length of retreating shoreline are natural fine-grained sand and mixed sand
and gravel beaches, but only 5.53 mi are retreating in these categories combined. The retreating
fine-grained beaches are concentrated in the western portions of West and Chocolate Bays, and
the retreating natural mixed sand and gravel beaches are along the northern shoreline of West
Bay. Retreating natural scarps and steep slopes in clay cover 2.3 mi of shoreline scattered along
the northern part of the bay system. Retreating unnatural shorelines of this type cover 2.22 mi
and are concentrated along the northern shoreline of West Bay where dredging along the ICW
has occurred. All other shoreline categories have less than 1.5 miles of retreating shoreline.

13
Table 2. Shoreline Change and Shoreline Types
length (mi) % of bay length length (mi) % of type length (mi) % of type length (mi) % of type mean std. dev. min. max.
Exposed walls and other structures made of
concrete, wood, or metal2.19 2.2 0.99 45.4 1.09 49.6 0.11 5.0 -3.4 5.1 -22.3 6.6
Scarps and steep slopes in clay - Natural 5.75 5.7 2.30 40.0 3.43 59.7 0.02 0.3 -2 1.6 -7.1 2.2
Scarps and steep slopes in clay - Unnatural 4.09 4.1 2.22 54.4 0.87 21.3 0.99 24.3 -4.3 6.3 -14.3 8.6
Fine-grained sand scarps, steep slopes, and beaches - Natural
5.05 5.0 2.94 58.2 1.94 38.5 0.17 3.4 -3.5 3.5 -18.7 5.2
Fine-grained sand scarps, steep slopes,
and beaches - Unnatural0.11 0.1 0.11 100.0 0.00 0.0 0.00 0.0 -13 3.3 -17.5 -8.6
Mixed sand and gravel(shells) beaches -
Natural3.45 3.4 2.59 75.2 0.85 24.8 0.00 0.0 -3.8 2.5 -16.2 1.2
Mixed sand and gravel(shells) beaches -
Unnatural1.80 1.8 0.05 2.6 0.47 25.9 1.29 71.6 4.6 5.6 -21.1 12.0
Gravel(shells) beaches - Natural 2.03 2.0 0.84 41.2 1.01 49.6 0.19 9.2 -1.2 2.2 -9.1 4.0
Gravel(shells) beaches - Unnatural 0.61 0.6 0.11 17.9 0.08 12.8 0.42 69.2 1.3 6.8 -16.0 7.4
Exposed riprap structures 1.80 1.8 0.39 21.6 1.40 77.6 0.02 0.9 -2 3.5 -12.7 2.2
Exposed tidal flats - Natural 1.74 1.7 1.21 69.6 0.42 24.1 0.11 6.3 -3.9 3.8 -12.9 4.3
Exposed tidal flats - Unnatural 0.00 0.0 0.00 0.0 0.00 0.0 0.00 0.0 0 0 0.0 0.0
Sheltered solid structures such as
bulkheads and docks0.36 0.4 0.14 39.1 0.17 47.8 0.05 13.0 -2 3.6 -9.7 4.1
Sheltered scarps - Natural 0.57 0.6 0.03 5.4 0.54 94.6 0.02 2.7 -0.7 0.9 -3.4 1.3
Sheltered scarps - Unnatural 0.31 0.3 0.00 0.0 0.06 20.0 0.25 80.0 4 2.7 -0.4 9.1
Sheltered tidal flats - Natural 0.12 0.1 0.09 75.0 0.03 25.0 0.00 0.0 -3.2 1.2 -5.4 -1.7
Sheltered tidal flats - Unnatural 0.05 0.0 0.05 100.0 0.00 0.0 0.00 0.0 -6.6 0.7 -7.1 -5.9
Salt- and brackish-water marshes - Natural 68.83 68.3 33.55 48.7 33.79 49.1 1.49 2.2 -3.2 4.7 -44.9 18.9
Salt- and brackish-water marshes - Unnatural 1.96 1.9 0.19 9.5 0.62 31.7 1.15 58.7 2.2 2.7 -8.7 6.0
All 100.82 100 47.80 47.4 46.77 46.4 6.26 6.2 -2.9 4.71 -44.9 18.9
retreating stable advancing
14
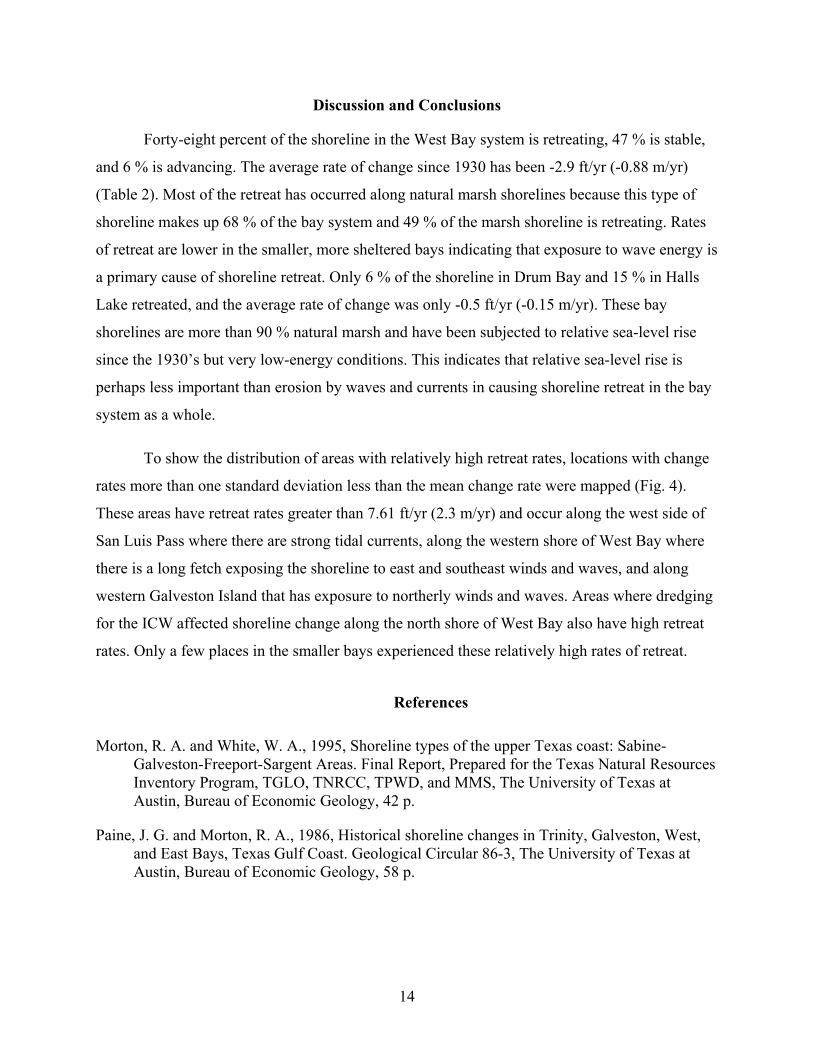
Discussion and Conclusions
Forty-eight percent of the shoreline in the West Bay system is retreating, 47 % is stable,
and 6 % is advancing. The average rate of change since 1930 has been -2.9 ft/yr (-0.88 m/yr)
(Table 2). Most of the retreat has occurred along natural marsh shorelines because this type of
shoreline makes up 68 % of the bay system and 49 % of the marsh shoreline is retreating. Rates
of retreat are lower in the smaller, more sheltered bays indicating that exposure to wave energy is
a primary cause of shoreline retreat. Only 6 % of the shoreline in Drum Bay and 15 % in Halls
Lake retreated, and the average rate of change was only -0.5 ft/yr (-0.15 m/yr). These bay
shorelines are more than 90 % natural marsh and have been subjected to relative sea-level rise
since the 1930’s but very low-energy conditions. This indicates that relative sea-level rise is
perhaps less important than erosion by waves and currents in causing shoreline retreat in the bay
system as a whole.
To show the distribution of areas with relatively high retreat rates, locations with change
rates more than one standard deviation less than the mean change rate were mapped (Fig. 4).
These areas have retreat rates greater than 7.61 ft/yr (2.3 m/yr) and occur along the west side of
San Luis Pass where there are strong tidal currents, along the western shore of West Bay where
there is a long fetch exposing the shoreline to east and southeast winds and waves, and along
western Galveston Island that has exposure to northerly winds and waves. Areas where dredging
for the ICW affected shoreline change along the north shore of West Bay also have high retreat
rates. Only a few places in the smaller bays experienced these relatively high rates of retreat.
References
Morton, R. A. and White, W. A., 1995, Shoreline types of the upper Texas coast: Sabine-Galveston-Freeport-Sargent Areas. Final Report, Prepared for the Texas Natural Resources Inventory Program, TGLO, TNRCC, TPWD, and MMS, The University of Texas at Austin, Bureau of Economic Geology, 42 p.
Paine, J. G. and Morton, R. A., 1986, Historical shoreline changes in Trinity, Galveston, West, and East Bays, Texas Gulf Coast. Geological Circular 86-3, The University of Texas at Austin, Bureau of Economic Geology, 58 p.

15
Jones
#
JamaicaBeach
#
Intracoastal Waterway
Galveston IslandState Park
fillsp
oil
spoil
dredged#
Halls Lake
Choco
late Bay
# FolletsIsland
#
DrumBay
Gulf of Mexico
San Luis Pass
BastropBay
Christmas B
ay
West Bay
Locations with High Shoreline Retreat Rates1930 to 1995
N
#######################
######
###############################################################################################################################
#
#####
####################################################
#
##########################################################################################################
######################################
###
##############################################
#######################
#####
##################################### ##########################################
###################################################################
##########
#####
#
##
################################################################################################################
################################
#
1 0 1 2 3 Miles
Figure 4. Map showing locations where the shoreline is retreating at a rate of more than 7.6 ft/yr, which is the rate that is one standard deviation from the average rate of change for the bay system.

16
Appendix A: Vertical aerial photographs used for shoreline mapping.
Date Scale Type Source 1930, April to November 1:24,000 Black-and-white
mosaics Tobin Research, Inc.
1956, August 1:24,000 Black-and-white mosaics
Tobin Research Inc.
1982, June and July 1:24,000 Color-infrared Texas General Land Office 1995, January 1:24,000 Color-infrared digital
orthophoto quarter quadrangles
Texas Natural Resources Information System
17
Appendix B: Beach profiles.
Plots of beach profiles and data tables. Plots are relative to local mean sea level.

18
0 50 100 150 200 250 300Distance from Monument (m)
-1
0
1
2
Hei
ght (
m)
WST01 -- Galveston Island State ParkWest Bay
January 30, 2002
vertical exaggeration = 20:1
-200 -150 -100 -50 0 50 100Distance from Monument (m)
-1
0
1
2
Hei
ght (
m)
vertical exaggeration = 20:1
WST02 Isla del Sol subdivisionWest Bay
January 30, 2002 datum(wooden pole)
datum
West Bay
West Bayupland
bushesS. patens
high marsh and barren sand flatshigh to low marsh
transitionlow marsh and open water
open water open water
low marsh(dying)
firm sand bottomscattered
oyster shells
sandyberm fringing
low marsh
dry high marsh &barren flatswet and dry high marsh
transitionwet and dry high marshedge cattails
19
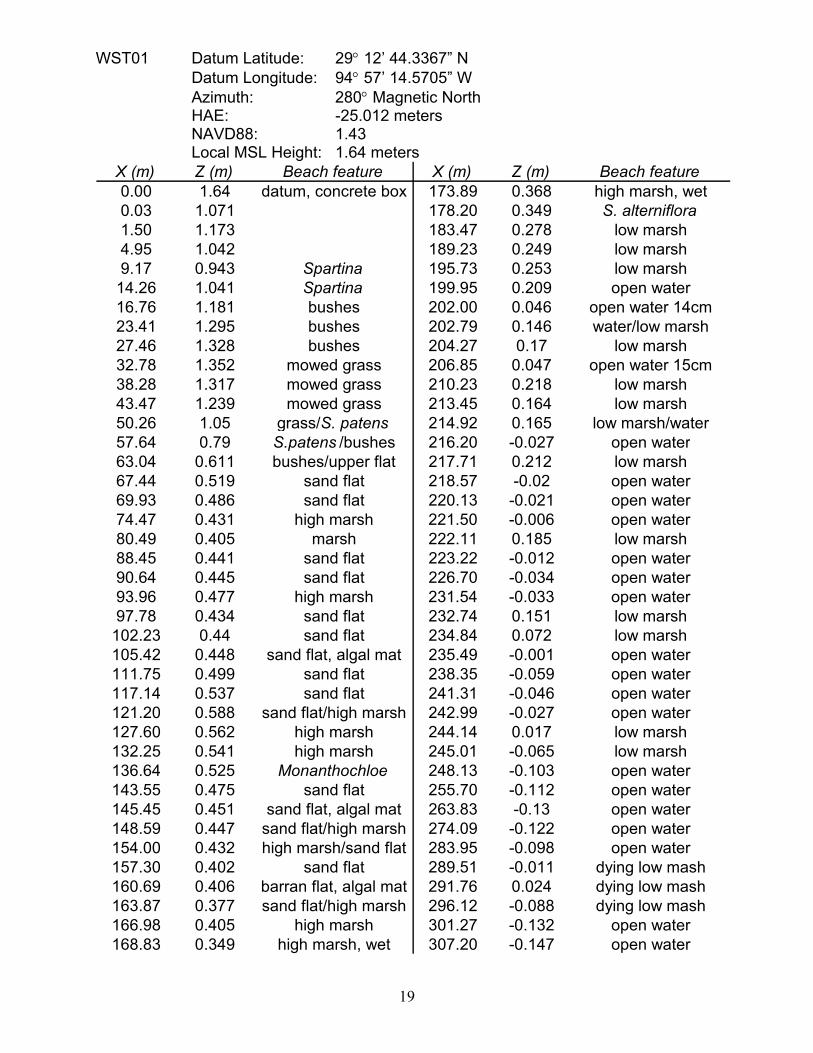
WST01 Datum Latitude: 29° 12’ 44.3367” N Datum Longitude: 94° 57’ 14.5705” W Azimuth: 280° Magnetic North HAE: -25.012 meters NAVD88: 1.43 Local MSL Height: 1.64 meters
X (m) Z (m) Beach feature X (m) Z (m) Beach feature0.00 1.64 datum, concrete box 173.89 0.368 high marsh, wet0.03 1.071 178.20 0.349 S. alterniflora1.50 1.173 183.47 0.278 low marsh4.95 1.042 189.23 0.249 low marsh9.17 0.943 Spartina 195.73 0.253 low marsh
14.26 1.041 Spartina 199.95 0.209 open water16.76 1.181 bushes 202.00 0.046 open water 14cm23.41 1.295 bushes 202.79 0.146 water/low marsh27.46 1.328 bushes 204.27 0.17 low marsh32.78 1.352 mowed grass 206.85 0.047 open water 15cm38.28 1.317 mowed grass 210.23 0.218 low marsh43.47 1.239 mowed grass 213.45 0.164 low marsh50.26 1.05 grass/S. patens 214.92 0.165 low marsh/water57.64 0.79 S.patens /bushes 216.20 -0.027 open water63.04 0.611 bushes/upper flat 217.71 0.212 low marsh67.44 0.519 sand flat 218.57 -0.02 open water69.93 0.486 sand flat 220.13 -0.021 open water74.47 0.431 high marsh 221.50 -0.006 open water80.49 0.405 marsh 222.11 0.185 low marsh88.45 0.441 sand flat 223.22 -0.012 open water90.64 0.445 sand flat 226.70 -0.034 open water93.96 0.477 high marsh 231.54 -0.033 open water97.78 0.434 sand flat 232.74 0.151 low marsh
102.23 0.44 sand flat 234.84 0.072 low marsh105.42 0.448 sand flat, algal mat 235.49 -0.001 open water111.75 0.499 sand flat 238.35 -0.059 open water117.14 0.537 sand flat 241.31 -0.046 open water121.20 0.588 sand flat/high marsh 242.99 -0.027 open water127.60 0.562 high marsh 244.14 0.017 low marsh132.25 0.541 high marsh 245.01 -0.065 low marsh136.64 0.525 Monanthochloe 248.13 -0.103 open water143.55 0.475 sand flat 255.70 -0.112 open water145.45 0.451 sand flat, algal mat 263.83 -0.13 open water148.59 0.447 sand flat/high marsh 274.09 -0.122 open water154.00 0.432 high marsh/sand flat 283.95 -0.098 open water157.30 0.402 sand flat 289.51 -0.011 dying low mash160.69 0.406 barran flat, algal mat 291.76 0.024 dying low mash163.87 0.377 sand flat/high marsh 296.12 -0.088 dying low mash166.98 0.405 high marsh 301.27 -0.132 open water168.83 0.349 high marsh, wet 307.20 -0.147 open water

20
WST02 Datum Latitude: 29° 8’ 22.4082” N Datum Longitude: 95° 3’ 32.7622” W Azimuth: 293° Magnetic North HAE: -24.947 meters NAVD88: 1.43 Local MSL Height: 1.64 meters
X (m) Z (m) Beach feature X (m) Z (m) Beach feature96.81 -0.8 open water -67.32 0.141 Paspalum90.54 -0.778 open water -71.75 0.081 Paspalum82.66 -0.779 open water -76.28 0.143 Paspalum76.00 -0.74 oyster bar to east -79.70 0.19 high marsh69.34 -0.673 open water -82.85 0.231 high marsh64.86 -0.609 open water -85.33 0.112 wet high marsh60.72 -0.558 oyster shells -89.51 0.023 wet high marsh56.92 -0.582 oyster shells -93.70 0.1 wet high marsh52.78 -0.482 oyster shells -97.50 0.177 dry marsh49.78 -0.415 S. alterniflora -100.57 0.235 sand flat47.49 -0.336 waterline -103.26 0.232 sand flat45.10 -0.215 fringing low marsh -109.73 0.305 high marsh42.71 -0.132 sand flat -114.01 0.378 Spartina39.05 0.025 sandy berm -119.24 0.385 Spartina36.75 0.122 sandy berm -124.32 0.478 Spartina33.73 0.152 berm crest -126.48 0.429 Spartina32.82 0.121 berm/high marsh -127.99 0.387 transition/high marsh30.59 0.063 high marsh -132.61 0.304 high marsh25.94 0.062 high marsh -141.48 0.251 high marsh20.45 0.065 high marsh -149.35 0.287 high marsh15.77 0.071 high marsh -155.03 0.306 high marsh/transition8.35 0.091 high marsh/sand flat -157.96 0.321 Spartina0.17 0.084 sand flat/road -161.98 0.304 transition/high marsh0.00 1.64 datum -168.01 0.318 high marsh-0.20 0.051 sand flat/road -174.03 0.284 high marsh-5.53 0.164 sand flat/high marsh -177.93 0.316 Juncus or Paspalum
-12.97 0.188 high marsh -187.65 0.353 Juncus or Paspalum-16.85 0.127 high marsh -190.90 0.462 Spartina-24.97 0.116 high marsh -194.89 0.323 Juncus or Paspalum-28.74 0.103 high marsh -198.26 0.303 Juncus or Paspalum-34.78 0.105 high marsh -201.54 0.267 Scirpus-39.13 0.113 high marsh -207.59 0.328 Scirpus-44.81 0.118 Monanthochloe -211.65 0.375 Scirpus-52.22 0.031 high marsh, wet -218.44 0.448 Spartina-56.10 0.125 high marsh -223.50 0.492 cattails-62.07 0.104 high marsh

21
-150 -125 -100 -75 -50 -25 0 25 50 75 100 125Distance from Monument (m)
-1.5
-1
-0.5
0
0.5
1
1.5
Hei
ght (
m)
WST03 -- Sportsman Road, Galveston IslandWest Bay
January 30, 2002
vertical exaggeration = 20:1
-350 -300 -250 -200 -150 -100 -50 0 50 100 150 200 250Distance from Monument (m)
-2
-1
0
1
2
3
4
5
Hei
ght (
m)
WST04 -- Follets IslandDrum Bay
January 31 and February 1, 2002
vertical exaggeration = 20:1
tidal channellow marsh and barren flats
datumshell berm
high tide berm crestwet/dry lineeroded marsh
firm muddy sand
Hwy 3005datum
(wooden post)
S. patens
wet
foredune
coppicemound
vegetationlines
wet/dry lineberm crests
MHHW
secondarydunes
muddy sand
firm sand
sand berm
barren sand flathigh marsh &barren flats
transitionupland
S. patensgrassesgrasses
S. patens, S. spartinae
West Bay
Gulf ofMexico
Drum Bay

22
WST03 Datum Latitude: 29° 15’ 18.8714” N Datum Longitude: 94° 55’ 4.4288” W Azimuth: 270° Magnetic North HAE: -26.086 meters NAVD88: 0.41 meters Local MSL Height: 0.61 meters
X (m) Z (m) Beach feature X (m) Z (m) Beach feature-132.96 -0.372 tidal channel -13.00 0.105 low marsh-120.25 -0.24 tidal channel -8.99 0.139 low marsh-110.76 -0.194 tidal channel -4.00 0.127 low marsh-103.14 -0.202 tidal channel -1.19 0.151 low marsh-96.75 -0.104 waterline -0.08 0.12 low marsh-94.89 0.081 S. alterniflora 0.00 0.61 datum-88.55 0.119 low marsh 0.05 0.185 low marsh-82.98 0.065 low marsh 1.77 0.174 low marsh-78.27 0.104 low marsh 3.01 0.192 washover shells-72.18 0.129 low marsh 4.25 0.495 crest shell berm-65.86 0.124 low marsh 5.03 0.418-59.93 0.114 low marsh 5.30 0.406 high-tide berm crest-54.13 0.094 low marsh 5.75 0.329-51.52 0.098 low marsh 6.84 0.268 wet/dry line-50.50 -0.04 sand flat, flooded 8.86 0.158 shelly sand/mud-49.18 -0.076 sand flat, flooded 10.97 0.093 eroded marsh-48.01 0.004 low marsh 12.76 -0.062 waterline-47.31 0.087 low marsh 14.83 -0.055 low-tide berm-46.55 -0.053 sand flat, flooded 19.03 -0.154 slightly muddy sand-44.28 -0.093 sand flat, flooded 25.01 -0.211 slightly muddy sand-41.31 -0.088 low marsh 32.34 -0.23 slightly muddy sand-40.78 0.083 low marsh 38.03 -0.251 slightly muddy sand-36.05 0.163 low marsh 46.12 -0.271 slightly muddy sand-31.43 -0.003 low marsh 54.10 -0.296 slightly muddy sand-29.06 -0.049 low marsh/low flat 65.20 -0.355 slightly muddy sand-25.98 -0.089 low flat, flooded 75.05 -0.415 slightly muddy sand-22.21 -0.08 low marsh 83.95 -0.452 slightly muddy sand-21.18 0.071 low marsh 94.57 -0.491 slightly muddy sand-16.76 0.067 low marsh 103.65 -0.549 slightly muddy sand

23
WST04 Datum Latitude: 29° 0’ 23.0073” N Datum Longitude: 95° 13’ 7.2987” W Azimuth: 135° Magnetic North HAE: -22.963 meters NAVD88: 3.31 meters Local MSL Height: 3.51 meters
X (m) Z (m) Beach feature X (m) Z (m) Beach feature-330.86 -0.216 open water -90.35 1.215 upland, grasses-322.58 -0.177 open water -84.55 1.304 upland, grasses-314.19 -0.122 open water -79.30 1.291 upland, grasses-307.26 -0.104 open water -75.55 1.334 upland, grasses-299.08 -0.142 open water -70.78 1.387 upland, grasses-290.92 -0.068 open water -68.21 1.304 upland, grasses-283.03 -0.045 open water -65.54 1.134 S. patens-274.56 0.004 open water -64.25 1.089 S. patens-266.90 0.058 open water -62.92 1.189 S. patens-258.87 0.08 open water -61.57 1.2 upland, grasses-250.85 0.126 open water -56.61 1.222 upland, grasses-246.53 0.172 waterline -51.37 1.275 upland, grasses-243.37 0.248 sand flat -46.00 1.307 upland, grasses-234.77 0.327 sand flat -40.60 1.398 upland, grasses-227.82 0.387 sand berm, algal mat -34.83 1.4159 upland, grasses-223.75 0.51 berm/high marsh -28.93 1.412 upland, grasses-217.49 0.485 Salicornia -24.17 1.434 upland, grasses-209.48 0.508 high marsh/sand flat -20.41 1.432 upland, grasses-203.62 0.501 sand flat, algal mat -17.24 1.456 upland, grasses-197.59 0.538 high marsh/sand flat -14.17 1.469 upland, grasses-191.15 0.573 Salicornia -8.32 1.478 upland, grasses-181.58 0.608 Monanthochloe -3.25 1.517 upland, grasses-174.33 0.621 high marsh/sand flat -0.14 1.483 upland, grasses-168.50 0.644 sand flat/high marsh 0.00 3.51 datum-166.89 0.714 high marsh/sand flat 0.14 1.502 mowed grass-162.39 0.764 sand flat/transition 1.76 1.425 mowed grass-159.12 0.814 S.patens/S.spartinae 5.50 1.472 mowed grass-154.18 0.831 S.patens/S.spartinae 9.82 1.69 mowed grass-149.20 0.891 S.patens/S.spartinae 13.11 1.817 mowed grass-145.67 1.064 S.patens/S.spartinae 15.78 1.98 highway 3005-143.48 0.943 S.patens/S.spartinae 18.90 2.077 highway 3006-138.37 0.936 S.patens/S.spartinae 22.50 1.987 highway 3007-132.38 0.839 S.patens/S.spartinae 25.00 1.851 mowed grass-126.11 0.907 S.patens/S.spartinae 28.26 1.821 mowed grass-121.13 1.066 S.patens/S.spartinae 32.37 1.882 mowed grass-115.67 1.133 S.patens/S.spartinae 33.23 1.727 S. patens-111.21 1.228 S.patens/S.spartinae 36.84 1.82 S. patens-108.65 1.178 S.patens/S.spartinae 41.54 1.936 S. patens-104.83 1.015 S.patens/S.spartinae 45.24 1.945 grass, cactus, dry-99.44 0.995 S.patens/S.spartinae 48.83 1.935 grass, cactus, dry-93.52 1.146 S.patens/S.spartinae 51.80 1.771 S. patens

24
WST04 continued.
X (m) Z (m) Beach feature X (m) Z (m) Beach feature53.12 1.668 S. patens 143.71 3.33 dune crest54.40 1.695 S. patens 146.04 2.548 vegetation line 154.82 1.58 S. patens 147.51 2.23756.95 1.488 S. patens 150.78 1.95160.09 1.713 S. patens 153.37 1.987 insipient foredunes63.70 1.658 S. patens 155.25 1.81567.50 1.612 S. patens 155.78 1.756 old storm wrack line72.16 1.607 S. patens 158.17 1.58676.28 1.568 S. patens 161.47 1.60780.93 1.593 S. patens 164.00 1.654 coppice mounds87.10 1.603 S. patens 166.66 2.291.41 1.617 S. patens 167.61 2.10295.68 1.607 S. patens 169.97 1.617
100.99 1.624 S. patens 173.33 1.569106.06 1.652 S. patens 175.85 1.574 vegetation line 2107.72 1.71 S. patens 181.80 1.569111.63 1.727 S. patens 187.03 1.534 berm crest114.37 1.805 S. patens 192.15 1.402116.61 1.994 S. patens 197.26 1.284 berm crest120.12 2.106 S. patens 202.99 1.135121.76 2.174 S. patens 208.56 1.001123.12 2.403 S. patens/ dune crest 215.03 0.755 wet/dry line124.26 2.249 S. patens 221.02 0.524126.37 2.197 interdune area 226.78 0.333128.68 2.102 interdune area 232.13 0.174129.99 2.3 interdune area 237.18 0.065131.02 2.204 interdune area 242.45 -0.043132.75 2.05 interdune area 245.44 -0.084 waterline135.14 2.009 interdune area 250.34 -0.171137.25 2.17 interdune area 255.24 -0.25138.25 2.223 interdune area 260.91 -0.383138.98 2.346 interdune area 266.24 -0.418139.79 2.416 interdune area 270.82 -0.431141.72 3.171 interdune area 274.55 -0.452

25
-500 -400 -300 -200 -100 0 100Distance from Monument (m)
-2
0
2
4
Hei
ght (
m)
BEG12 -- Follets IslandChristmas Bay
January 31, 2002
vertical exaggeration = 20:1
Gulf ofMexico
ChristmasBay low marsh &
open waterhigh marsh &
barren sand flats
flooded
MHHW
datum
bermwet/dry line
vegetationlines
Hwy 3005
transition
irregularridge
high marshhigh marsh
transition back barrierflat

26
BEG12 Datum Latitude: 29° 2’ 22.8702” N Datum Longitude: 95° 10’ 9.2947” W Azimuth: 136° Magnetic North HAE: -24.331 meters NAVD88: 1.96 meters Orthometric Height: 2.16 meters
X (m) Z (m) Beach feature X (m) Z (m) Beach feature-557.84 -0.23 open water -362.95 0.322 S. alterniflora-550.55 -0.115 open water -357.89 0.379 Salicornia-544.69 -0.092 open water -350.08 0.353 Salicornia-539.42 -0.094 low marsh fringe -342.95 0.347 Salicornia-538.57 0.076 S. alterniflora -335.07 0.364 Salicornia-538.27 0.05 scarp (subaqueous) -327.81 0.346 Salicornia-537.93 0.229 top of scarp -320.16 0.343 high marsh/sand fla-535.15 0.281 low marsh, flooded -314.33 0.354 sand flat, flooded-528.71 0.251 low marsh, flooded -309.44 0.365 sand flat, flooded-519.44 0.159 low marsh, flooded -300.37 0.383 sand flat, flooded-511.91 0.164 low marsh, flooded -290.77 0.394 sand flat, flooded-505.79 0.26 low marsh, flooded -278.92 0.401 sand flat, flooded-499.01 0.216 low marsh, flooded -270.09 0.423 sand flat, flooded-497.78 0.137 low marsh/open water -259.11 0.436 Monanthochloe-494.05 0.175 low marsh/open water -256.24 0.412 high marsh/sand flat-490.36 0.126 low marsh/open water -249.23 0.429 sand flat-489.32 0.138 low marsh/open water -242.95 0.466 sand flat-488.52 0.207 low marsh/open water -239.38 0.574 Monanthochloe-484.02 0.28 low marsh, flooded -236.59 0.665 high marsh/transition-475.19 0.265 S. alterniflora, Batis -234.38 0.726 transition-467.01 0.277 S. alterniflora, Batis -226.66 0.849 S.spartinae/S.patens-458.05 0.262 S. alterniflora, Batis -221.55 0.94 S.spartinae/S.patens-449.91 0.311 S. alterniflora, Batis -216.10 0.933 S.spartinae/S.patens-445.67 0.314 S. alterniflora -213.26 0.793 S.spartinae/S.patens-439.46 0.328 S. alterniflora -211.81 0.679 transition/high marsh-431.15 0.308 S. alterniflora -208.85 0.501 high marsh/sand flat-426.54 0.373 S. alterniflora -200.92 0.468 sand flat, algal mat-419.67 0.323 S. alterniflora -191.02 0.477 sand flat/high marsh-412.58 0.337 S. alterniflora -186.73 0.498 high marsh-407.11 0.241 low marsh/open water -183.45 0.475 S. alterniflora, Batis-405.60 0.195 open water -180.03 0.459 high marsh/sand flat-402.91 0.225 open water -173.74 0.488 sand flat, algal mat-401.62 0.324 S. alterniflora -168.38 0.549 Monanthochloe-395.42 0.341 S. alterniflora -166.20 0.623 Monanthochloe-388.35 0.348 S. alterniflora -164.36 0.678 high marsh/transition-381.40 0.358 S. alterniflora -160.63 0.879 transition-379.65 0.208 open water -155.33 0.991 transition-377.92 0.342 S. alterniflora -150.01 1.12 transition-372.64 0.357 S. alterniflora -140.50 1.063 transition-367.33 0.358 S. alterniflora -133.26 1.175 transition

27
BEG12 continued
X (m) Z (m) Beach feature X (m) Z (m) Beach feature-126.04 1.16 transition 9.45 2.282 mowed grass-120.90 1.029 transition 10.90 2.333 mowed grass-117.79 0.884 transition 12.55 2.444 road berm-113.75 0.81 transition 15.80 1.958 ditch -111.43 0.748 Monanthochloe 19.88 2.309 Highway 3005-108.26 0.682 Monanthochloe 23.27 2.436 Highway 3005-103.64 0.761 transition 27.00 2.505 Highway 3005-99.26 0.689 transition 28.30 2.596 road berm-97.74 0.669 transition/high marsh 29.45 2.929-92.47 0.641 Monanthochloe/Batis 29.96 2.887-85.90 0.646 Monanthochloe/Batis 30.39 2.781-81.37 0.675 Paspalum 32.10 2.633 concrete riprap-77.22 0.748 S. patens, Scirpus 34.26 2.243 concrete riprap-73.97 0.844 high marsh/ transition 36.54 1.794 vegetation line 1-68.62 0.908 transition 38.11 1.579 sparce veg-61.67 1.312 transition 40.92 1.514 interdune area-56.52 1.597 transition, grasses 44.06 1.587 sparce veg-51.55 1.831 transition, grasses 48.43 1.604 sparce veg-48.53 2.159 transition, grasses 52.52 1.604 sparce veg-46.95 2.394 transition, grasses 55.32 1.539 sparce veg-45.49 2.048 transition, grasses 57.51 1.414 vegetation line 2-42.66 1.633 transition, grasses 62.14 1.292-37.26 1.72 transition, grasses 65.33 1.215 wet/dry line-31.89 1.873 transition, grasses 69.11 1.097-27.25 1.852 transition, grasses 74.17 0.988 berm crest-22.22 1.803 transition, grasses 78.75 0.751 beachface-16.95 1.83 transition, grasses 83.49 0.539 beachface-11.44 1.833 transition, grasses 89.50 0.418-5.88 1.88 S. patens 94.75 0.224-1.98 2.016 S. patens 100.81 0.069-0.04 2.037 S. patens 105.26 -0.02 waterline0.00 2.16 datum/S. patens 110.12 -0.1190.02 2.045 S. patens 116.81 -0.2352.05 2.124 grasses/low bushes 119.63 -0.2856.30 2.12 grasses/low bushes