well plugging applications to the inter-aquifer …
TRANSCRIPT

TECHNICAL PUBLICATION 83-8
December 1983
WELL PLUGGING APPLICATIONS TO THE
INTER-AQUIFER MIGRATION OF SALINE GROUNDWATER IN
LEE COUNTY, FLORIDA

TECHNICAL PUBLICATION #83-8 December 1983
WELL PLUGGING APPLICATIONS TO THE INTER-AQUIFER MIGRATION OF
SALINE GROUNDWATER IN LEE COUNTY, FLORIDA
by
Wm. Scott Burns
This publication was produced at an annual cost of $483.75 or $.97 per copy to inform the public. 500 690 Produced on recycled paper.
Groundwater Division Resource Planning Department
South Florida Water Management District West Palm Beach, Florida

TABLE OF CONTENTS
LIST OF FIGURES................................................................ iii
LIST OF TABLES................................................................ iv
SUMMARY........................................................................ v
ACKNOWLEDGEMENTS.............................................................. ix
INTRODUCTION.................................................................. 1
Previous Investigations..................................................... 2
Description of Study Area............................................... 4
HISTORICAL REVIEW OF FLORIDA WELL PLUGGING PRACTICES............................. 5
Development of the SFWMD Well Abandonment Program.......................... 8
HYDROGEOLOGY OF LEE COUNTY.................................................... 14
Surficial Aquifer System................................................ 16
Sandstone Aquifer....................................................... 17
Mid-Hawthorn Aquifer................................................. . 19
Lower Hawthorn/Tampa Producing Zone..................................... 20
Suwannee Aquifer......... ............................................... 21
INTER-AQUIFER MIGRATION OF SALINE WATER IN LEE COUNTY...................... . 23
Well Construction........................................................ 23
Corrosion Processes..................................................... 26
Upward Saline Migration................................................. 32
Downward Saline Migration................................................ 37
GEOPHYSICAL APPLICATIONS TO WELL PLUGGING................................... 40
METHODS OF WELL PLUGGING..................................................... 47
WELL REHABILITATION........................................................... 58
EFFECTS OF WELL PLUGGING ON GROUNDWATER SYSTEMS............................... 64
RECOMMENDATIONS............................................................... 74
Page
i

TABLE OF CONTENTS (Continued)
Page
REFERENCES.... *............................................................... 76
APPENDICES
APPENDIX I - Well Locations and Selected Data From the SouthFlorida Water Management District's Deep Well Plugging Program...................................... 1-1
APPENDIX II - Technical Specifications and Bid Form From theSFWMD/ASCS Well Plugging Contract..................... II-l
APPENDIX III - Cost and Material Summary for the South FloridaWater Management District's Well Plugging Program....III-I

LIST OF FIGURES
1 Location of Study Area.......................................... 4
2 Generalized Hydrostrati graphic Column for Lee County,Florida......................................................... 15
3 Nomograph for Calculating Langelier Index, I[_.................. 29
4 Location and Orientation of Offset Beds in theLower Miocene; Estero, Florida................................. 34
5 Generalized Cross Section Denoting Paths of UpwardSaline Migration................................................36
6 Generalized Cross Section Denoting Brackish WaterRecharge of the Mid-Hawthorn Aquifer........................... 39
7 Correlation of Geophysical Data for Well LEO-28................ 41
8 Lost Probe Retrieval Method Utilized by SFWMD.................. 45
9 Diagram of Southwest Florida Water Management District'sQWIP Bridging Plug..............................................48
10 Rehabilitation Designs for Well WA-85.......................... 59
11 Rehabilitation Designs for Well WA-181......................... 61
12 Water Quality Data from a Partially Plugged Well in theFloridan Aquifer System in St.Johns County, Florida........... 63
13 Areal Extent of a Contaminant Plume Generated by theGrossman Well in Dade County, Florida..........................67
14 Chloride Data from Monitoring Wells in the Sandstone andMid-Hawthorn Aquifer Near WA-123 and WA-181....................69
15 Relation Between Rainfall and Groundwater Recovery in anUnconfined Aquifer in Bonita Springs........................... 71
16 Variations in the Potentiometric Surface of the FloridanAquifer System Between 1973 and 1983........................... 73
Figure Page
iii

LIST OF TABLES
1 Well Construction Details from Selected Wells in Lee County......... 25
2 Corrosion Indices (11_ and Ir ) from RepresentativeSamples Taken from Lee County Aquifers............................... 31
3 Slurry Yields and Weights for Portland Type A Cement/BentoniteSlurries.............................................................. 54
Table Page
iv

SUMMARY
Thousands of free flowing wells, drilled in the 1940's and 50's to supply
Florida's agricultural interests, have become sources of saline intrusion into
freshwater aquifers throughout the state. Legislation has been passed which
addresses the problem by establishing well construction criteria and providing
for the disposal of all abandoned flowing wells by January 1, 1992. The South
Florida Water Management District joined the other WMD's by establishing a
pilot well plugging program in 1979. This program began in Lee County where
three freshwater aquifers (the Surficial, Sandstone, and mid-Hawthorn) were
being contaminated by uncontrolled wells located throughout the county. The
purpose of this program was to: 1) determine methods of saline intrusion
related to water wells, 2) establish cost effective methods of plugging
flowing wells, 3) prevent the continued loss of fresh water by plugging
offensive wells, and 4) determine the effect plugging has on water quality on
a local and regional scale. The results of this study are as follows:
1. Three methods of saline intrusion related to well construction have been
identified in this report: a) saline water enters the Surficial Aquifer
System through seepage adjacent to uncontrolled flowing wells drilled
into the Floridan Aquifer System, b) in wells which are valved off at the
surface, high pressure water from the Floridan enters the mid-Hawthorn
and Sandstone aquifers through uncased portions of the well or through
corrosion holes, and c) in coastal areas where the mid-Hawthorn aquifer
has been widely developed, the fluctuating saline water table has
corroded steel casing below the surface allowing saline water to enter
the well and recharge the mid-Hawthorn aquifer.
In addition, structural offsets in lower Miocene beds were
identified in the Estero area of Lee County. These data substantiate
similar findings elsewhere in the county presented by other authors and
suggest a possible source of upward saline migration from deep aquifers
into the Suwannee aquifer and the lower Hawthorn/Tampa producing zone; No
data indicate these faults extend through the lower Hawthorn confining
zone.
2. Of the wells surveyed in this report, 26 percent were uncontrolled and
flowed freely at land surface. The average discharge from an
uncontrolled well was 86 gpm. Only nine percent of the wells contained
enough casing to isolate the three shallow freshwater aquifers. The mid-
Hawthorn aquifer was directly exposed to the Floridan aquifer in 91% of
the wells and both the mid-Hawthorn and the Sandstone aquifers were
exposed in 12£ of the wells surveyed. The average chloride concentration
for the Floridan aquifer was 995 mg/1.
3. A figure of 1850 is proposed for the total number of flowing wells
drilled in Lee County. This figure is based on the rate of expansion of
the existing USGS inventory and replaces the previous estimate of 3000.
Prior to any plugging activities, an estimate of 90 mgd was proposed by
Healy (1978) for the amount of water which enters the shallow aquifers
from flowing wells in Lee County. This figure is revised to 81 mgd (60
mgd from surface discharge and 11 mgd from internal flow) based on field
data collected from this study.
4. The corrosion potential of waters from the Surfical, Sandstone,
mid-Hawthorn and Floridan Aquifer Systems were evaluated using the Ryzner
stability index and Langelier saturation index. Results indicate that
the waters of the Floridan Aquifer System are non-corrosive in a reducing
environment and tend to produce protective calcium carbonate scale inside
steel casings; however, waters from the shallow artesian systems are more
aggressive to steel casings, with corrosion being most intensive in the
Surfical Aquifer System. Therefore, observed corrosion of steel casings
vi

in Lee County occurs mostly on the outside of the casing adjacent to the
shallow aquifer. In addition to chemical breakdown of casings, sulfur
reducing bacteria (Desulfomaculatum) is suspected to be accelerating
casing decay. A casing life expectancy of 20 to 25 years has been
proposed for steel cased wells constructed without annular grout. The
average age of the flowing wells surveyed is 30 years.
Several methods of plugging flowing wells were attempted during this
study. Stage grouting was found to be the most cost effective. This
method involves the emplacement of calculated volumes and weights of
slurry between each producing zone in a well. The cost of plugging an
"average" flowing well (544 ft deep with 130 feet of six inch casing)
from 1979 to 1983 was $1,825.00. The average cost of plugging a
mid-Hawthorn well in Cape Coral was $176.06 for the same period. Funding
was based on cost sharing cooperatives between the District and various
state, county, and municipal agencies.
By the end of September 1983, a total of 270 flowing wells were plugged,
which prevented an estimated 13 mgd of Floridan Aquifer System water from
contaminating the shallow aquifers. An additional 90 flowing wells were
reported by the USGS as having been plugged prior to the SFWMD's plugging
program. Five hundred and forty two abandoned mid-Hawthorn wells were
plugged in Cape Coral under the Cape Coral-SFWMD1s plugging program. An
additional 593 mid-Hawthorn wells were plugged by the City of Cape Coral
alone prior to 1979.
The rate at which the water quality in an aquifer recovers from point
source contamination depends primarily on the extent of the
contamination, the ambient groundwater velocities, and the hydrodynamic
dispersion of the contaminant through the invaded aquifer.

Dispersion results in faster dissipation of saline plumes than could be
attributed to groundwater flow alone. Water quality recovery will occur
faster in heterogeneous sediments such as fractured or solutioned
limestones, where dispersion is greatest, and in unconfined aquifers
which receive direct recharge. Measurable water quality recovery in
confined aquifers in Lee County will occur within a time frame of several
years, while significant recovery in an unconfined aquifer will occur
within a year depending upon the amount of rainfall. It is too early to
identify regional improvements in water quality in the shallow artesian
aquifers of Lee County although local improvements have been recorded.
The potentiometric surface of the Floridan Aquifer System has shown
recovery on a regional scale. Continued increases of the artesian head
pressures within the upper zones of the Floridan Aquifer System should
prevent further water quality deterioration from deeper sources within
that system.
ACKNOWLEDGEMENTS
This project is the result of concerns over the groundwater resources
within the boundaries of the South Florida Water Management District. The
author wishes to recognize the contributions of the Lee County cooperators
whose genuine concern for the groundwater resources of the area will be
recognized for years to come: the Lee County Commissioners, the City of Fort
Myers, the City of Cape Coral, the East County Water Control District, the
Agricultural Stabilization and Conservation Service, and the Lee County
Department of Transportation. An inventory of deep wells which formed the
basis for long term planning was provided by the U. S. Geological Survey in
Fort Myers under the direction of Frank Watkins. Additional site locations
and field support were provided by Ned DeVaney, Lee County Department of
Environmental Protection Services.
Recognition is given to Edward P. Mosher and the late Bruce Mackelduff
for the administrative development and supervision of the project. The
magnitude and success of this program is reflective of their efforts. Special
thanks are given to Martin C. Braun, Jr. for his contributions in the
technical development of the program. His fine work in the field has had a
major influence on the program.
This report was prepared under the direction and supervision of Abe
Kreitman, former Director, Groundwater Divison, South Florida Water Management
District. It was through his efforts that this program was founded, and his
continued guidance in all aspects of the study is gratefully acknowledged.

INTRODUCTION
The social and economic growth of Florida is strongly influenced by the
extensive groundwater network which supplies fresh water to most of the state.
While much of the potable water comes from shallow water table and artesian
aquifers, large portions of the state are underlain at depth by extensive
limestone aquifers which are under sufficient artesian head to cause wells to
flow at land surface. Much of this water is mineralized to a point where it
is of little use to man and could pose a threat to potable groundwater if
improperly constructed or maintained wells allow this water to enter
freshwater aquifers. In 1978, approximately 15,000 wild flowing wells
discharged about 790 million gallons of mineralized water in Florida every day
(Healy, 1978). Discharge occurs both internally, in wells constructed to tap
several water bearing zones of different pressures, and externally, in wells
without valves or caps. These problems are most pronounced along the southern
coastal regions of the state including, Brevard, Lee, Charlotte, Sarasota, St.
Lucie, Hendry, DeSoto, and Hillsborough Counties.
A second source of groundwater contamination occurs in shallow artesian
aquifers located beneath intertidal areas. In this case, steel casings,
exposed to a fluctuating saline water table have corroded allowing saltwater
to leak into the well and recharge the aquifer.
Florida has recognized the need to protect the groundwater resources of
the state by establishing well construction standards and plugging procedures.
Enactment of these regulations is the responsibility of the Department of
Environmental Regulation and the Water Management Districts. The South
Florida Water Management District (SFWMD) began its well plugging program in
Lee County in 1979. The purpose of this program is to prevent the continued
contamination of the freshwater resources by plugging offensive wells. This
would be accomplished by: 1) determining methods of saline intrusion related
to water wells, 2) establishing cost-effective methods of plugging flowing
-I-
wells, 3) preventing the continued loss of fresh water by plugging offensive
wells, and 4) determining the effect plugging has on water quality on a local
and regional scale. By the end of the 1982-83 fiscal year 350 Floridan wells
were located and logged, and 270 deep flowing wells and 542 shallow wells had
been plugged. This action has prevented the loss of approximately thirteen
million gallons of saline water per day from contaminating freshwater
aquifers. Due to the continued support of the Lee County cooperators and the
Governing Board of the South Florida Water Management District, this program
is being continued and expanded into other counties.
Previous Investigations
Development of a state-wide inventory of flowing wells was first
undertaken by Hendry and Lavender in 1957 in response to legislation passed in
1953 and 1955. The final report was completed in 1957 by Hendry and Lavender.
Details of this inventory are on file with the Department of Environmental
Regulation in Tallahassee. In 1978, this inventory was updated by Healy to
include estimates of the amount of water discharged by flowing wells both at
the surface and internally.
Methods of interaquifer saline migration in Lee County were first
presented by Sproul, Boggess, and Woodward in 1972. Evidence of faulting,
along with well construction practices, were presented as sources of upward
saline migration in the McGregor Isle area. Missimer and Gardner in 1976 used
high resolution seismic reflection profiling to investigate the vertical
extent of the faults proposed by Sproul. They concluded that no faulting
exists above the lower Hawthorn confining zone in the area studied.
In 1974, Boggess evaluated the saline resources of Lee County and
presented selected data on 217 flowing wells. A study on the effects of
plugging a flowing well on water quality in an unconfined aquifer was
presented by Boggess 1973. While the saline plume identified was small (600
feet) recovering to background chloride levels occurred within two years.
- 2 -
The problem of downward saline migration in shallow artesian wells
located in the intertidal areas of Cape Coral was introduced by Boggess,
Missimer, and O'Donnell in 1977. Several case studies involving saline
intrusion related to well construction are outlined in this report.
Description of Study Area
Lee County is located in southwest peninsular Florida between Latitude
26° 19' 04" North and 26° 47' 23" North and Longitude 81° 33' 50M East and 82°
16' 24" East (Figure 1). It is bordered to the north by Charlotte County, to
the east by Hendry County, the south by Collier County, and to the west by the
Gulf of Mexico. The county is bisected by the Caloosahatchee River which is
used for drainage, navigation, and freshwater supply.
Land use patterns in the county have shifted significantly from
agricultural to urban in the past 40 years. During the 1940's and 50's Lee
County was largely an agricultural region producing winter vegetables,
livestock, flowers, and citrus. Agricultural interests were concentrated
along the Caloosahatchee River to facilitate shipping. Hundreds of deep wells
were drilled into the Floridan Aquifer System to obtain free-flowing
irrigation water. Rapid urbanization began in the 1960's and significantly
changed the existing land use patterns. The population grew from 54,539 in
1960 to 205,266 in 1980 and is expected to reach 300,000 by 1995. This trend
has manifested itself in moderate to high density housing with multifamily
housing starts outnumbering single family housing by over 50 percent during
1980 and 1981. The majority of the population is concentrated within 10 miles
of the coast and along the Caloosahatchee River. Development has occurred at
the expense of agriculture and is reflected in the decline in acreage used for
farming. In 1959 a total of 500,000 acres was used for farming. This figure
dropped to 107,182 in 1978. As a result, the majority of former irrigation
wells are now located in populated urban areas.
-3-


HISTORICAL REVIEW OF FLORIDA WELL PLUGGING PRACTICES
Inventories to assess the extent of the flowing well problem were begun
in the mid-fifties by several agencies. In 1954, the Florida Association of
Soil Conservation District Supervisors began collecting data on flowing wells
within their districts. In 1956, the Florida Water Resources Study Commission
began a study which expanded the 1954 inventory to include flowing wells
throughout the State. The results of these studies where combined in 1957 by
the Florida Geological Survey for the State Legislature. A total of 1,883
wild flowing wells were identified (Hendry and Lavender, 1959). Since then,
additional inventories have been conducted by the U. S. Geological Survey and
the Water Management Districts. The more recent inventories include estimates
of wells which allow internal exchange of saline water and are summarized by
Healy (1978).
Attempts by the State to regulate uncontrolled flowing wells began in the
early 1950's and are outlined by Hendry and Lavender (1959) and Healy (1978).
Severe drought conditions in the early 1950's resulted in the passage of
regulatory measures to curtail the misuse of artesian wells in Florida.
Chapter 370.051-370.055 of the Florida State Statutes (1953), required working
valves or caps on all flowing wells. In 1955, the Florida Geological Survey
received an appropriation to implement this program. The passage of Chapter
373.021-373.061 F.S. by the Legislature in 1957 provided for the plugging of
all artesian wells which were in violation of the law.
Until the early 1970‘s the regulation and control of abandoned flowing
wells was the responsibility of various state and local agencies, along with
the individual property owner. In 1972, the Legislature acted to form the
five Water Management Districts. In 1974, formal rules and regulations
governing water wells in Florida were adopted and implemented under the
regulatory responsibility of the Department of Environmental Regulation and
-5-

the Water Management Districts. Three specific considerations towards
abandoned wells were contained in these rules which provided for: (1) the
implementation of a permitting system by the Water Management Districts to
regulate the plugging of abandoned wells; (2) the elimination of wells which
allowed interchange of water between aquifers or the uncontrolled loss of
artesian pressure; and (3) the establishment of minimum criteria for the
plugging of abandoned wells. In June 1983, the Legislature enacted the "Water
Quality Assurance Act of 1983". Part IV of this legislation calls for each of
the five water management districts to: (1) accomplish the plugging of all
known abandoned wells within the District on or before January 1, 1992; and
(2) submit by January 1, 1983 a preliminary inventory and work plan outlining
the methods and costs of plugging all known abandoned wells. The Act also
establishes 500 mg/1 of chlorides as a maximum allowable discharge
concentration for flowing wells.
The extent to which the Water Management Districts regulate the plugging
of derelict wells varies with each District. The Suwannee River Water
Management District (SRWMD) and the Northwest Florida Water Management
District (NFWMD) have limited well plugging programs because the problem of
saline flowing wells and interaquifer contamination is not widespread in these
regions. Well plugging is usually limited to abandoned wells and test holes.
Both Districts established well plugging permitting procedures by 1976. The
SRWMD requires the owner to submit abandonment plans for permit approval while
the NFWMD will provide geophysical logs and prepare technical plugging
specifications for the owner, if necessary, at no charge. The cost for
plugging a well is generally the responsibility of the property owner in
either District.
The Southwest Florida Water Management District (SWFWMD) and the St.
Johns River Water Management District (SJRWMD) developed more comprehensive
- 6 -
programs which provide funding to those areas where abandoned saline wells
pose a much greater threat to freshwater resources. The SWFWMD began its
"Quality of Water Improvement Program" (QWIP) in 1974. This program is
administered through the Peace River, Manasota, and Alafia Basin Boards which
provide funds for plugging. In 1982, the plugging program was active in both
the Peace River and Manasota Basins; all known offensive wells in the Alafia
Basin had been plugged (Kim Preedom, personal communication, 1982). Wells are
plugged to specifications prepared by the SWFWMD which are based on
interpretation of geophysical logs. Techniques utilized by SWFWMD for
plugging wells include: emplacement of inert fill, conventional cement
grouting, and QWIP plugs. The QWIP plug, which was developed by the SWFWMD,
is an inexpensive inflatable cement packer used to isolate producing zones.
By the end of 1982, SWFWMD had plugged 160 wells throughout the District and
capped 208 wells which were uncontrolled but were not found to be a source of
interaquifer contamination (Preedom, personal communication, 1982). A number
of additional wells were plugged in the District through independent programs
developed and funded by Sarasota County and the Department of Transportation.
The St. Johns River Water Management District (SJRWMD) began its
cooperative well plugging program in 1976. This program originated as a cost
sharing project with the Agricultural Stabilization and Conservation Service
(ASCS) to improve the quality of agricultural irrigation wells (Munch, 1978).
Under this program problem wells were identified, geophysically logged, and
rehabilitated or plugged at no cost to the owner. In 1981 a second
cooperative agreement was implemented between SJRWMD and Brevard County to
allow privately owned non-agricultural properties to benefit from this
program. While wells which qualify under the ASCS-SJRWMD program are
generally partially plugged, wells in Brevard are completely plugged using
QWIP plugs or conventional cement grouting. Both flowing and nonflowing wells
-7-

are plugged under this program. At the end of the 81-82 fiscal year, 15 wells
had been plugged in Brevard County and approximately 20 wells had been
rehabilitated or plugged under the ASCS cooperative program (Doug Munch,
personal communication, 1982).
Development of South Florida Water Management District's Well
Abandonment Program
Wells which penetrate the Floridan Aquifer System exhibit flowing
artesian conditions throughout the boundaries of the SFWMD except in the
northern portion of the Kissimmee Planning Area (central Florida) where the
Floridan receives recharge. Waters from the Floridan, although often too
saline for potable use, are used extensively for agriculture throughout south
Florida. Through poor well construction or neglect, thousands of these wells
have become sources of contamination to shallow freshwater aquifers through
uncontrolled surface discharge or internal flow. Areally, approximately 70
percent of the SFWMD is affected by this problem.
Recognizing this, the SFWMD implemented its own well plugging program in
1978. Prior to this, wells were plugged through the state-wide ASCS program
or by local agencies, with the District, the Department of Natural Resources,
the Department of Environmental Regulation, and the U. S. Geological Survey
providing technical review and support. It was initially established that the
plugging program appropriated by the SFWMD's Governing Board would be active
in one county while the program developed. Funding was provided to purchase a
Gearhart-Owens Widco Model 3200 geophysical well logger which would provide
technical data necessary to develop effective plugging techniques.
Administrative work began to locate a study area, appoint a staff, and prepare
the legal agreements needed for the program. The Well Abandonment Program
formally began in August of 1979 with the logging of well WA-1 in Lee County.
In selecting the county to begin the plugging program, consideration was
given to: (a) the type and extent of the problem caused by abandoned wells,
-8-
(b) the number of offensive wells available for plugging, (c) the availability
of an accurate inventory, and (d) selecting an area where maximum social and
economic benefit could be derived from the program. A state-wide inventory of
uncontrolled flowing wells, prepared by the U. S. Geological Survey,
identified five counties in the District with more than 200 uncontrolled
flowing wells: St. Lucie, Okeechobee, Glades, Hendry, and Lee Counties.
Virtually all wells which penetrate the Floridan Aquifer System in St.
Lucie County will flow at land surface. Healy (1978) reported that over 400
of these wells were uncontrolled and were discharging 48 million gallons per
day (mgd). Chloride concentrations for the Floridan Aquifer System in St.
Lucie County range from 200 mg/1 in the southwest to over 1400 mg/1 in the
west central portion of the county (Brown and Reece, 1979). Chloride values
in excess of 1000 mg/1 occur along a “ridge" which trends from southeast to
northwest and along the northeastern coastal region. Surface discharge and
internal flow in these regions have reportedly caused localized contamination
of the shallow freshwater aquifer. As St. Lucie County is rapidly changing
from a primarily agricultural region to an urbanized area, it is anticipated
that the problem of saline flowing wells will become more acute as development
progresses.
Approximately 350 uncontrolled wells discharge over 50 mgd in Okeechobee
County (Healy, 1978). These wells occur in the southern portion of the county
where the potentiometric surface of the Floridan system exceeds land surface.
Chloride concentrations are generally low in the north portion of the county
and increase to the southeast with the 500 mg/1 isochlor located within ten
miles of the north shore of Lake Okeechobee (Shaw and Trost, 1984). Most
wells are used for'irrigation, and requests for plugging or rehabilitation are
usually directed through the ASCS by landowners wishing to improve the quality
of their welIs.
-9-

A total of 650 wells (250 in Glades County and 400 in Hendry County)
discharge approximately 78 mgd through internal and surface flow in Glades and
Hendry Counties (Healy, 1978). Wells drilled into the Floridan Aquifer System
will generally flow throughout both counties with potentiometric heads often
in excess of 30 feet above land surface. Water quality is generally poor with
chloride values ranging from less than 100 mg/1 to 4,240 mg/1 (Klein et al,
1964). A problem of uncontrolled saline discharge extending into both
counties near the City of LaBelle has been documented by Klein and others
(1964). The study identified seven deep wells, ranging in depth from 600 to
800 feet and constructed with 80 feet of steel casing, to be the source of the
contamination. Most shallow, freshwater wells in the area were developed in a
shelly limestone located between 60 and 120 feet below land surface.
Differential pressure between the Floridan and the shallow aquifer resulted in
internal flow which formed a contaminant plume of saline water over two miles
long and three quarters of a mile wide across LaBelle and north into Glades
County. Both counties depend on shallow groundwater for potable supply and,
although neither county is heavily populated, local contamination of the
shallow aquifer is becoming a widespread threat to the potable groundwater.
The problem of saline intrusion related to well construction is best
documented in Lee County where three freshwater aquifers are being
contaminated by abandoned wells. Detailed investigations on the effects of
saline wells in Lee County have been presented by several authors including
Sproul, et al. (1972), Boggess (1973 and 1974), and Boggess, et al. (1977).
An estimate of 2,500 to 3,000 deep artesian wells was proposed by Sproul in
1972 for Lee County. These wells discharge internally into freshwater
aquifers or flow freely at the surface. This, combined with downward leakage
of seawater through corroded casings in shallow coastal aquifers, has had
widespread effects on fresh groundwater resources.
Details from an inventory of 742 flowing wells, collected by the U.S.
Geological Survey (USGS) were made available to the SFWMD. This inventory
included data on both test and monitoring wells in addition to abandoned
wells. Ninety of the wells were known to be plugged and 50 wells belonged to
the USGS monitoring network. Most of the remaining wells would qualify for
plugging under the District's program. The population growth and rapid
development of Lee County was also considered, as the problem of limited
freshwater resources was beginning to threaten future growth. Because of the
magnitude of the problem, the immediate threat posed by saline wells, and the
availability of detailed information regarding the problem, the District began
its well plugging program in Lee County.
It was decided that a cooperative program similar to that used by the St.
Johns River WMD would be the most cost effective method for plugging a large
number of wells in a short period of time. The District agreed to extend the
scope of the cooperative program to include federal, county, or municipal
agencies in order to diversify the program. The initial cooperative
agreements consisted of a labor and cost sharing arrangement. The District's
responsibility included providing manpower and equipment to geophysically log
the wells, preparing plugging specifications, inspecting the actual plugging
procedure, and paying for half the cost of the plugging. The county
cooperator would locate and prepare each well site for logging and plugging,
administer the plugging contract, and pay half the plugging fees.
Contractors were selected through competitive bidding on a- time and materials
basis.
All flowing wells logged and plugged in the SFWMD's program are located
either through the inventory furnished by the USGS or through public relations
campaigns. The use of television, newspapers, and seminars to various civic
associations have proven most useful in expanding the existing flowing well
-11-

inventory. Additional well locations have been provided by property owners
during plugging operations and by SFWMD field crews. By the end of 1983, the
locations of approximately 6016 of the flowing wells surveyed were provided as
a result of public relations campaigns.
After the wells are located, the owners are notified and requested to
sign a waiver which allowed their wells to be logged and plugged. In many
cases, the owners live out of the county and have to be located through the
county tax records. Once the waiver has been signed and the well logged, it
is assigned a priority based on the degree of interaquifer connection, the
salinity of the well, the flow rate, and the proximity to potable supply
welIs.
Details regarding the locations of the wells which have been logged and
plugged, along with details regarding the administration of the plugging
program, are presented in Appendix I and II. The locations of shallow wells
associated with the Cape Coral plugging program are not included.
During the 1979-80 fiscal year the District established cooperative
agreements with Lee County and the East County Water Control District which
represents Lehigh Acres. A third coop was established with the City of Cape
Coral to plug two inch shallow wells. These shallow wells do not require any
special grouting techniques, and therefore, the City of Cape Coral agreed to
administer all aspects of this program with the District supplying funding
only. Under these arrangements 95 flowing wells were located and logged, 24
flowing wells were plugged, and 175 shallow wells in Cape Coral were plugged.
In 1980, the Lee County Department of Transportation joined the program in
order to plug wells under roads or along right-of-ways. During the 1980-81
fiscal year a total of 59 wells were logged, 43 flowing wells and 149 shallow
wells were plugged. In 1981 the Agricultural Stabilization and Conservation
Service (ASCS) and the City of Ft. Myers expanded the program to include six
-12-

cooperators. The ASCS agreed to pay 75% of the plugging cost for wells on
agricultural properties while the District would administer the contract and
provide 25 percent of the plugging cost. The agreement with the City of Ft.
Myers was an equal cost sharing agreement pertaining to flowing wells within
the city limits. During the 1981-82 fiscal year 100 wells were logged, and 98
flowing wells and 157 shallow wells were plugged. All existing cooperative
agreements were extended into the 1982-83 fiscal year; however, due to
manpower shortages experienced by most of the cooperators, the District
provided additional manpower to locate and prepare the well sites. As a
result, the cost sharing agreements with the Lee County, ECWCD, the City of
Cape Coral, and the City of Ft. Myers were modified from a dollar per dollar
agreement to a 60-40 agreement with the District paying 40 percent of the
plugging cost. During this fiscal year, 96 wells were logged, 105 flowing
wells and 120 shallow wells were plugged.

In developing a regional well abandonment program it is necessary to
obtain an accurate understanding of the hydrogeology of the study area. Aside
from aquifer delineation, data on ambient water quality, potentiometric head
and local and regional hydraulic gradients are necessary for each producing
zone. Such knowledge is fundamental in developing theories on the methods of
saline intrusion which in turn provide the criteria for well abandonment
techniques.
Since the objective is to isolate aquifers during abandonment, aquifer
delination is of primary importance. Information on regional extent,
structural elevation, thickness, and degree of confinement is necessary for
each aquifer. In units with interbedded producing and confining zones, the
degree of hydraulic connection and variance in water quality between the
producing zones must be defined. Ambient water quality of each aquifer is
useful in quantifying the degree and areal extent of intrusion caused by a
saline well. Offensive wells can often be located from the contaminant plume
in areas of anomalously poor water quality. Factors affecting the
configuration of the plume include the permeability of the invaded zone, the
differential head pressures between the saline and freshwater aquifer, and the
hydraulic gradients within the invaded zone. Potentiometric pressures of
flowing wells are also necessary to calculate slurry weights of the well
plugs.
The rocks underlying Lee County have been grouped into three major
hydrogeologic systems based on their spatial relationship in the stratigraphic
column (Figure 2). These include the Surficial Aquifer System, the Hawthorn
Aquifer System, and the Floridan Aquifer System (Wedderburn, et al, 1982).
These systems are further divided into aquifers and confining zones based on
the degree of vertical and lateral hydraulic conductivity within each rock
HYDROGEOLOGY OF LEE COUNTY
-14-

S Y S T EM
STRATIGRAPHSERIES F O R M A T I O N
HYDROGEOLOGYMEMBER L I T H O L O G Y S Y S T EM U N I T
Q U A T E R N A R Y h o l o c e n e
P L E IS T O C E N E
U N D I F F E R E N T I A T E D
U N D IF F E R E N T I A T E D
Medium io (me grained subangular quarlz sand with varying amounts ol she4l and clay Th e tower section consists ot loosely consolidated biomicrites antf shell bet*s
Slirlicisl Aquifer S ystem ____
Uncon<ined _ . Semrconfinad
PLIOCENEOchopee l m . Bucking. Lm Pinecrest Sd
Sandy biogenic calcarenile with minor sparry calclle and dolomite S'H phosphale up 10 S ' ■■ highest concentrations al the base
LaSelleC la y
Alva Clay
L«h4ghAcres
Sandstone
HAWTHORN
TERTIARY : MIOCENE
Predominantly claslic sediments .including clay silt, sandstone, and s h e ll b e d s w ith o c c a s io n a l in te rb e d d e d s a n d y b io g e n ic limestones. Varying percentages ol sill lo pebble sue phosphate throughout with highest concentra lions (25 :) occunng si the base ol Ihe unit
UP PER H A W TH O R N C O N F IN IN G Z O N E
SANDSTONEAOU1FEH
MID-HAWTHORNCONFINING
ZONE
MID-HAWTHORN AQUIFER
Predominantly carbonate sedifnenis Including phosphatlc llmestonesand dolomites intetbedded with dolo- silt and clay
LOWEftHAWTHORNCONFINING
ZONE
TAMPALIMESTONE
L ig h t o ra n g e b io g e n tc lim e sto n e s
a n d d o lo m ite s c o n ta in in g u p to 10
pe rce nt qu a rtz sand an d siH si** p h o sp h o r ic . Incre a se d qu a rts sand o cc u r
a n c e at base of unit.
LOWERHAWTHORN/
TAMPAPRODUCING
OLIGOCENE SUWANNEELIMESTONE
M H}ium gr«ineti biogeniccatcartnlte with mino* percentages Ol quartz sand ar>d p h o sp ha te
SUWANNEEAQUIFER
Figure No. 2 GENERALIZED HYDROSTRATIGRAPHIC COLUMN FOR LEE COUNTY, FLORIDA

unit. The Surficial Aquifer System for much of Lee County is characterized as
a water table aquifer; however, in those areas where calcareous clay beds are
present in sufficient thickness to act as semi-confining beds, the System is
divided into two separate producing zones. The Hawthorn Aquifer System
consists of two aquifers; the Sandstone aquifer and the mid-Hawthorn aquifer,
and three semi-confining zones; the upper Hawthorn, the mid-Hawthorn, and the
lower Hawthorn. The Floridan Aquifer System is composed of the lower
Hawthorn/Tampa producing zone, the Suwannee aquifer and deeper aquifers here
left undifferentiated. All aquifers, with the exception of the water table
aquifer, are confined to varying degrees and under artesian pressures. Water
quality varies with depth and distance from primary recharge zones.
Surficial Aquifer System
The Surficial Aquifer System as described by Wedderburn, et al. (1982)
occurs within the permeable sediments of the here undifferentiated terrace
deposits of Pleistocene to Holocene age, and within the Tamiami Formation of
Pliocene age. The System is regionally extensive throughout Lee County. The
undifferentiated terrace deposits consist predominantly of unconsolidated
quartz sand, shell beds, calcareous clays and numerous interfingering
limestones. The underlying Tamiami Formation is principally composed of sandy
biogenic limestones. The Surficial Aquifer System is unconfined throughout
the county except in local areas where calcareous clays, are present in
sufficient thickness to act as semi-confining zones. Here, the System is
divided into a water table and a semi-confined artesian aquifer. The
calcareous clays and dolo-silts of the upper member of the Hawthorn Formation
form the lower boundary of the Surficial Aquifer System. The Surficial
Aquifer System ranges in thickness from less than 25 feet to over 125 feet.
It is thinnest in central Lee County corresponding to a structural high in the
underlying Hawthorn Formation, and thickens to the west and southeast.
-16-

Water levels for the Surficial Aquifer System generally conform to the
topography of the area and respond dynamically to direct recharge as well as
to variations in atmospheric pressure. The major source of recharge into the
aquifer is rainfall, with additional inflow from surface water bodies and
surface discharge from deeper wells. Discharge occurs through
evapotranspiration, outflow to surface water bodies and the Gulf of Mexico,
and downward leakage across semi-confining zones. Regional flow patterns are
controlled by two major recharge areas and by the major outflow basins. In
northern Lee County, groundwater in the Surficial Aquifer System flows south
from the Telegraph Swamp Area in Charlotte County to the Caloosahatchee River.
In southern Lee County, surficial groundwater flows radially from the
Immokalee Rise, south of Lehigh Acres, to the Caloosahatchee River and the
Gulf of Mexico. Maximum hydraulic gradients occur along the outflow basins.
Water quality for the Surficial aquifer varies widely with distance from
the major recharge zones and from the saltwaters of the Gulf of Mexico.
Chloride concentrations for the mainland seldom exceed potable supply limits
(250 mg/1) with chloride concentration below 50 mg/1 at the two major recharge
areas. Salinity increases greatly across the fresh-saltwater interface in
coastal areas where chloride concentrations in excess of 10,000 mg/1 are
common.
Sandstone Aquifer
The Sandstone aquifer, as described by Wedderburn, et al. (1982), is the
upper water bearing unit in the Hawthorn Aquifer System. It occurs within the
permeable sediments of the upper member of the Hawthorn Formation and is of
Miocene Age. The aquifer is regionally extensive throughout most of Lee
County except in the Cape Coral area and in the extreme northwest corner of
the county where the unit is absent. The Sandstone aquifer is composed of
sandstones, biogenic limestones, and sandy dolomites. Porosity is mostly
-17-

intergranular and mol die. The top of the aquifer occurs between -20 and -170
feet NGVD with the thickness of the unit ranging from zero to 200 feet. The
unit is thinnest adjacent to Cape Coral and thickens to the east.
The sandstone aquifer is semi-confined above by the upper Hawthorn
confining zone which is composed of clayey dolo-silts of low permeability.
The aquifer is confined below by the sandy phosphatic dolo-silts of the
mid-Hawthorn confining zone. In eastern Lee County the mid-Hawthorn confining
zone is bisected by a poorly indurated, sandy, micritic limestone. The areal
extent of this unit is not known but has been identified from cuttings in
Buckingham and Lehigh Acres. Post, Buckley, Schuh & Jernigan (1978)
identified this unit in the Corkscrew Swamp area (southeastern Lee County),
informally referring to it as the twelve mile slough limestone. While not
developed for municipal supply, the aquifer does produce fresh water to single
family homes in these areas.
The configuration of the potentiometric surface of the Sandstone aquifer
generally parallels the water levels of the Surficial aquifer. Highest
groundwater elevations occur in east central Lee County along SR 82 and in the
north central portion of the county along the Charlotte County line.
Potentiometric lows occur along the Caloosahatchee River and adjacent to the
Green Meadows Wellfield in south central Lee County. Recharge to the
Sandstone aquifer occurs mainly by downward leakage across the overlying
semi-confining zone and from subsurface inflow from adjacent areas. Discharge
occurs by migration across semi-confining zones, subsurface outflow, and by
withdrawals due to well pumpage. Hydraulic gradients are generally less than
one foot per mile. Maximum gradients, less than 5 feet per mile, occur at the
Green Meadows Wellfield. Regional flow patterns radiate from potentiometric
highs and generally parallel the flow in the Surficial aquifer.
The salinity of the aquifer rarely exceeds potable supply limits.
Chloride concentrations in excess of 250 mg/1 occur in northeast and
-18-

southwestern Lee County. Values below 50 mg/1 occur south of SR 82 in the
south central portion of the county and correspond to the major recharge area.
Chloride concentrations have been measured in excess 700 mg/1 in areas where
the aquifer receives recharge from waters of the Floridan Aquifer System.
Mid-Hawthorn Aquifer
The mid-Hawthorn aquifer, as defined by Wedderburn, et al. (1982), is the
lower water bearing unit of the Hawthorn Aquifer System. It occurs within the
permeable sediments of the lower member of the Hawthorn Formation and is of
Miocene Age. The aquifer, which consists primarily of sandy biogenic
limestones, is regionally extensive throughout all of Lee County. Porosity is
mostly intergranular and moldic. Missimer (1978) described a regional
disconformity at the contact between the limestones that form the aquifer and
the overlying confining beds. The aquifer is confined below by interbedded
phosphatic dolo-silts and low porosity limestones. The top of the aquifer
occurs at -100 feet NGVD in central Cape Coral and dips radially to over -300
feet NGVD in northeastern and southeastern Lee County. The unit rarely
exceeds 75 feet in thickness throughout the county.
The potentiometric surface of the mid-Hawthorn aquifer generally trends
from northeast to southwest with a major depression occurring from western
Cape Coral to southern Ft. Myers. Highest potentiometric elevations occur in
northeastern Lee County where water levels exceed 10 feet above land surface.
The lowest potentiometric levels are encountered in a large depression
associated with the Cape Coral and Florida Cities wellfields, with water
levels greater than 50 feet below NGVD. Hydraulic gradients are steepest
along this depression and often exceed 10 feet per mile. Recharge into the
mid-Hawthorn aquifer occurs through subsurface inflow from adjacent areas and
from artificial recharge from Floridan wells. Discharge from the aquifer
occurs from subsurface outflow and discharge from wells tapping the aquifer.
-19-
Water quality varies widely for the mid-Hawthorn aquifer but is generally
more mineralized than the waters of the Sandstone or Surficial aquifers.
Chloride concentrations in excess of 1000 mg/1 occur in the island system
along the west coast and decrease to the east. The apparent deterioration of
water quality in western Cape Coral may be related to a loss of potentiometric
head associated with high pumpage rates. East of the Caloosahatchee River
chloride concentrations are generally below 250 mg/1; however, values in
excess of 800 mg/1 have been measured adjacent to salty flowing wells.
Lower Hawthorn/Tampa Producing Zone
The lower Hawthorn/Tampa producing zone, as described by Wedderburn, et
al. (1982), is the upper water bearing unit in the Floridan Aquifer System.
It occurs within the permeable sediments of the lower carbonate member of the
Hawthorn Formation and is of lower Miocene age. The aquifer consists of sandy
biogenic limestones and crystalline dolomites with primarily moldic and
intercrystalline porosity. The unit is regionally extensive throughout Lee
County. The aquifer is confined above by the lower Hawthorn confining zone
and below by tight, well indurated sandy micrites. The overlying confining
beds consist of poorly indurated limestone and phosphatic dolo-silts; however,
in western Lee County several well indurated porous limestones exist within
the confining unit that are capable of producing large quantities of water.
Missimer (1979) described two of these zones (Hawthorn Aquifer System, Zone 2
and 3), however, the regional extent of these units are limited to the west
coastal region of the county. The micrites that form the lower confining zone
of the lower Hawthorn/Tampa producing zone vary in the degree of vertical
hydraulic conductivity but are generally considered to be semi-confining in
nature. The elevation to -the top-of the unit is between -350 to -650 feet
NGVD with the thickness ranging from 75 to 250 feet. The unit is thinnest in
the Telegraph Swamp area of north Lee County and thickens rapidly to the
south.
-20-

The potentiometric surface of the lower Hawthorn/Tampa producing zone
trends from northeast to southeast and generally parallels the potentiometric
surface of the mid-Hawthorn aquifer prior to development. The potentiometic
surface is above land surface throughout Lee County and wells which tap this
unit flow freely at the surface. Highest potentiometric head levels,
exceeding +50 feet NGVD, are measured in northeastern Lee County. As
indicated by the high potentiometric surface of the unit, recharge to the
producing zone occurs primarily as subsurface inflow from adjacent areas or
upward leakage from deeper sources. Principal discharge occurs by subsurface
outflow and from wells which tap this aquifer for agricultural and industrial
use.
Water quality for the lower Hawthorn/Tampa producing zones generally
exceeds potable supply standards throughout the county; however, the unit is
extensively used to supply water for agricultural demands. In addition, Cape
Coral, Pine Island, and Sanibel use water from this aquifer and the Suwannee
aquifer to supply raw water to reverse osmosis plants. Chloride
concentrations range from 250 mg/1 to more than 5,000 mg/1.
The Suwannee Aquifer
The Suwannee aquifer is the second water bearing unit within the Floridan
Aquifer System. It occurs within the permeable sediments of the Suwannee
Limestone which is of Oligocene Age. The Suwannee Limestone is 1ithologically
complex, being composed of medium-grained biogenic limestones interbedded with
dolomites, fine grained poorly indurated limestones, and sandstones. The
aquifer is regionally extensive throughout Lee County. Due to the thickness
of the Suwannee limestone and the existence of interbedded micrites of low
permeability, the aquifer is divided into several minor producing zones;
however, the major water bearing zones occur near the contacts at the top and
the base of the unit. Porosity is mostly intergranular and moldic. The top
-21-
of the aquifer occurs between -550 to -800 feet NGVD. A structural high
occurs in the northeastern portion of the county from northern Lehigh Acres to
Buckingham. The water quality of the aquifer is best in this area. The
thickness of the aquifer ranges from 350 to 600 feet.
Little information regarding potentiometric head of the Suwannee aquifer
is available. Flow, temperature, and fluid resistivity logs from four wells
east of the Iona District (WA-156, WA-158, KA-162 and WA-171) indicate
production from each of the wells is solely from the Suwannee aquifer.
Potentiometric levels for these wells taken in January 1982 were +10, +14, +6
and +11 feet NGVD, respectively. Chloride concentrations ranged from 601 to
805 mg/1. Wells WA-134 and WA-144, which are approximately one mile away,
produced water solely from the lower Hawthorn/Tampa producing zone and had
head levels of +18 and +21 feet NGVD, respectively (chloride concentration
4,400 and 5,520 mg/1), suggesting that in this area, head levels are lower for
the Suwannee aquifer than the overlying producing zones. However, in most
areas in the county, the potentiometric surface of the Suwannee aquifer is
thought to equal or exceed that of the lower Hawthorn/Tampa producing zone.
Direct water quality data from the Suwannee aquifer is scarce; however,
specific conductance data gathered by point samples and geophysical methods
(Wedderburn, et. al. 1982) indicate that water quality is generally poorer in
the Suwannee aquifer compared to water quality in the overlying aquifers.
Chloride concentrations range from less than 600 mg/1 in Lehigh Acres to over
10,000 mg/1 near the base of the aquifer.
-22-

INTER-AQUIFER MIGRATION OF SALINE WATER IN LEE COUNTY
Saline intrusion occurs as saltwater of a given potential migrates into a
freshwater body of lower potential. In groundwater, this movement can
progress through natural low permeability layers providing there is sufficient
difference in potential between aquifers, or it can occur along failures in a
confining zone which are caused by faults or uncased well bores. In the study
area, mineralized water migrates both upward, from the Floridan Aquifer System
into the shallow artesian aquifers, and downward, from leaky wells located
along brackish intertidal canals adjacent to developments. In both cases,
early well construction practices have resulted in multi-aquifer connections
along open boreholes or through corrosion failures in the casing. Well
abandonment techniques are based on a detailed understanding of saline
movement within a well.
Well Construction
Beginning in the early 1940s, Lee County began to develop its
agricultural industry. The availability of free flowing water, year long,
combined with the temperate climate, allowed the winter vegetable crop to
flourish. Early deep well drilling practices resulted in the development of
hundreds of wells which were constructed with minimum lengths of casing prone
to corrosion and which have provided direct connection between the Floridan
and shallow freshwater aquifer systems.
Prior to 1970, virtually all wells drilled in south Florida were
constructed with cable tool drill rigs. This method of drilling utilized
percussion action to cut the borehole. Cuttings were removed with a bailer.
Casings were driven in place as the well was being drilled. Due to the impact
stress inherent in the process of setting the casing, black steel or
galvanized pipe was most often used. This structural stress acts to promote
the formation of galvanic cells which promote corrosion. Well casings were
-23-

not grouted in place due to the absence of annular space inherent to this
method of drilling. As a general rule the casing was terminated in a
competent rock unit and the remainder of the well was left open hole. The
well bores of these older wells are frequently tortuous, especially at
clay-limestone interfaces, where rapid drilling resulted in deflections of the
drilling bit at density interfaces. This frequently results in difficulty
with setting tremie pipe and logging the well.
In wells drilled into the Sandstone or mid-Hawthorn aquifers, the casings
were set a few feet into the top of the aquifer and the remaining portion of
the well was completed to the base of that aquifer. However, in wells which
tapped the Floridan Aquifer System, casings were generally terminated hundreds
of feet above the top of the Floridan System. Steel casing, especially during
war years, was the most expensive part of the well construction. As a result,
deep wells drilled into the Floridan were usually cased to the top of the
mid-Hawthorn aquifer and the remainder of the well was left open hole. Well
construction data collected in Lee County are summarized in Table 1.
Geophysical data collected from 147 Floridan wells indicate that only nine
percent of the wells were constructed with enough casing to isolate the
mid-Hawthorn and Sandstone aquifers. The mid-Hawthorn aquifer was directly
exposed to the Floridan Aquifer System in 91 percent of the wells. Both the
Sandstone and mid-Hawthorn aquifers were not cased off in twelve percent of
the wells. The average well depth was 656 feet. This value differs from the
figure quoted for the average well depth plugged given in the appendix due to
the number of shallow non-flowing wells plugged under that program. The
average flow rates calculated from 205 wells surveyed was 173 gpm. The
average chloride concentration was 995 mg/1. All the wells surveyed were
drilled with a cable tool rig. The average age of a Floridan well in Lee
County is approximately 30 years.
-24-

Casing Diameter: 3 in. 4 in. 5 in. 6 in. 8 in.
Number of Samples 6 56 39 101 8Frequency 2.8% 26.7% 18.6% 48.1% 3.8%
Casing Depth: <100 ft. 101 - 200 ft. >201 ft.
Number of Samples 10 128 9Frequency 6.8% 87.1% 6.1%
Flow Rate: <50 qpm 51-100 qpm 101-250 qpm 251-500 qpm >500 qpm
Number of Samples 66 45 41 43 10Frequency 32. 2% 22.0% 20.0% 21.0% 4.8%
Number of wells cased past the mid-Hawthorn aquifer: 13, Frequency: 8.9%.
Number of wells with the mid-Hawthorn aquifer exposed: 134, Frequency: 91.1%.
Number of wells with the Sandstone and mid-Hawthorn exposed: 17, Frequency: 11.6%
Number of uncontrolled flowing wells: 44 (169 wells surveyed), Frequency: 26.0%.
Average casing depth: 148 ft. (147 wells surveyed).
Average well depth: 656 ft. (154 wells surveyed).
Average flow rate: 173 gpm (205 wells surveyed).
Average flow from uncontrolled flowing wells: 86 gpm.
Average chloride concentration: 995 mg/1 (193 wells surveyed).
TABLE 1. WELL CONSTRUCTION DETAILS FROM SELECTED WELLS IN LEE COUNTY.
In more recent years, rotary drilling methods have dominated the deep
well construction industry. This method of drilling utilizes rotational
cutting action instead of percussion to cut through rock. Cuttings are
continuously removed by either fluid (hydraulic rotary) or air (air rotary).
In general, steel casings have been replaced with less expensive PVC pipe. In
1974, the State of Florida required all casing set by rotary rigs must be
cemented in place from top to bottom unless otherwise specified
(Administrative Code, Chapter 17-21.10 (2d)). This same legislation (Chapter
17-21.10(2c)) prohibits the construction of wells which allow inter-aquifer
exchange. With the passage of this legislation, combined with a greater
awareness of the problems generated by past well construction practices, few
wells drilled since 1974 have resulted in inter-aquifer contamination.
Corrosion Processes
Perhaps the most significant cause of saline intrusion in the Sandstone
aquifer, and a major contributor to contamination of the Surficial Aquifer
System, is casing corrosion. Early well construction practices, combined with
the chemical nature of groundwater, produce a corrosive environment to steel
casings throughout the county. Although the causes vary, corrosion occurs in
both shallow and deep wells. Mechanisms of casing failure active in the study
area include electrochemical and bacterial processes. Continued development
of both shallow and deep groundwater resources, with steel cased wells
constructed without annular grout, will eventually result in further
deterioration of the freshwater resource.
The corrosion of iron or steel in aqueous solution occurs as a natural
galvanic cell forms between two regions of differing electrical potential.
This may be caused by nonuniformities in metal stress prevalent in driven
casing, the joining of dissimilar metals, differences in temperature, or
variations in flow rates. The electrolytic cell consists of an anodic area,
-26-

where iron dissociates, and a cationic area, where atomic hydrogen is
generated as follows:
Anode reaction
4 F e ---- A F e ^ + 8e~ (1)
Dissociation of water
8H20 ---- 8H+ + 80H" (2)
Cathode reaction
8H+ + 8e~ ---- 8H° (3)
The dissociation of iron at the anode results in pitting and the
concentration of hydrogen at the cathode polarizes the area, protecting it
from corrosion. In the absence of oxygen the product of this reaction is
ferrous hydroxide, a black insoluble deposit found inside the casing of
flowing wells throughout Lee County.
The chemistry of different groundwaters tends to accelerate or impede
these reactions (Clark, 1980). Sodium reacts with excess hydroxyl ions to
form sodium hydroxide which increases the pH at the cathode. This, in turn,
increases the corrosion potential relative to the anode. Negative ions such
as chloride and sulfate tend to migrate to the anode and prevent the formation
of inhibiting films and thus increase corrosion rates. On the other hand,
water containing dissolved calcium and bicarbonate ions react to form a
protective calcium carbonate scale in the following reaction:
Ca*^ + 20H ---- Ca(0H)2 (4)
Ca(0H)2 + HC03 ---- CaC03 + H20 (5)
Thick scale, while protecting casings from corrosion, often results in reduced
casing diameters and decreased yield. Calcium carbonate scale, often over two
inches thick, has been observed locally but not uniformly throughout Lee
County.
-27-
All of these dissolved ions are present in the groundwater of Lee County;
however, it is the relative concentrations of these various constituents which
cause water to form protective scale or to be corrosive. Observations suggest
that the corrosive character of waters in the study area vary both between
different aquifers and within the same unit. Two methods used to assess the
corrosive nature of groundwater are the saturation index (11_) and the
stability index (Ir). The saturation index originally proposed by Langelier
(1936) is based on the relationship of the waters actual pH to a theoretical
pH value assuming saturation with calcium carbonate. The saturated pH value
(pHs) is calculated from the relation:
pHs = C + pCa + pALK (6)
Where,
C is the total dissolved solids constant corrected for temp.
in degrees centigrade.
pCa is the negative log of the calcium concentration
expressed as mg/1.
pALK is the negative log of the bicarbonate alkalinity
expressed as mg/1.
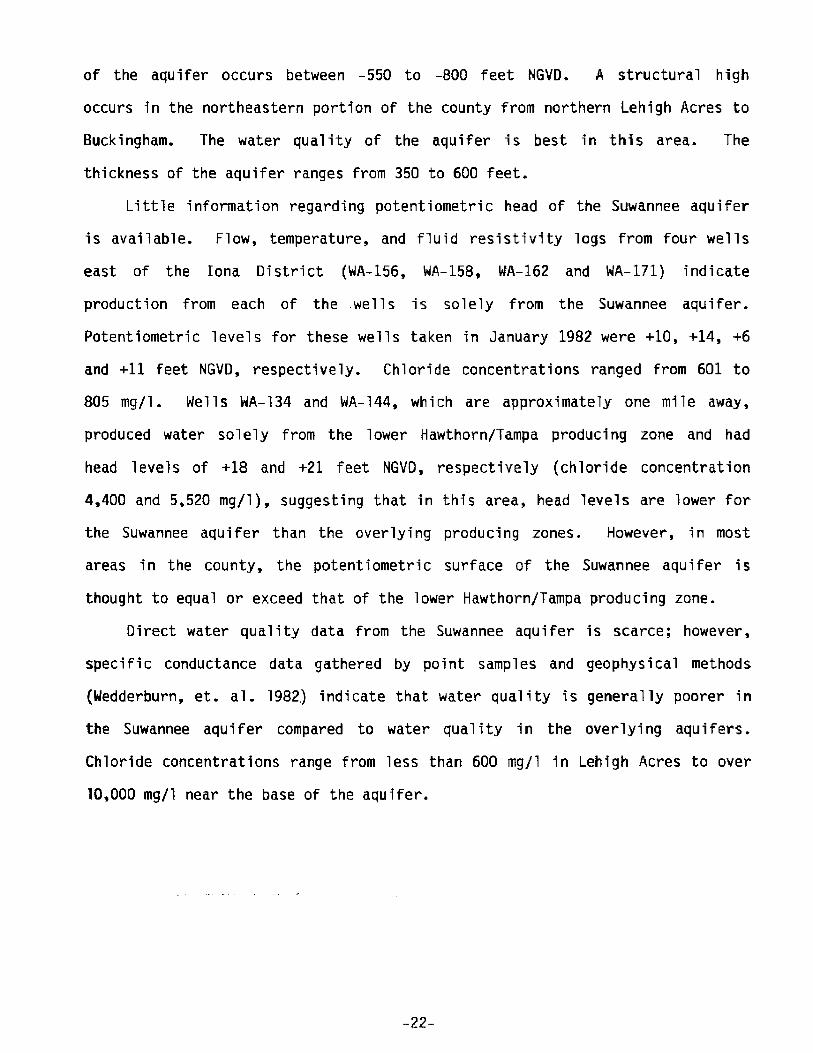
Calculations can be made by inserting the appropriate water quality data in
the chart shown on Figure 3. From this, the saturation index (I|_) equals the
difference between the actual pH of the water (pHa) and the theoretical
saturated pH (pHs):
IL = pHa - pHs (7)
When the saturation index is a negative number the water is generally
corrosive (Clark, 1980); protective scale will form if is greater than zero.
-28-

T O T A L S O L I D S C O N S T A N T C
T E M P r 4 S . 9 0, C p H = 0 0
Ca H A R D N E S S = f 2 0 m g / l
u A L K A L I N I T Y
T O T A L S O L ' D S
pCo pAlkC A T 4 8 - 9 * C =
S U M - pH*
A C T U A L pH
D I F F E R E N C E = s S A T U R A T I O N I N D E X
LU _J <O in
oz<
<o
F °i
j c °
I1 30 = - 1.1
40 = 4 .4
50 = 10.0
60 = 15.6
j ? o = 21.1
80 = 26.7
90 ~ 32 2
100 - 37.8
1 10 = 4 3 3
120 4 8 .9
130 - 5 4 . 4
140 = 60.0
150 = 65.5
160 71.1
ITO 7 6 7
180 = 82 2
190 = 87.7
200
i
= 93.3
mg / I
T O D E T E R M I N E :
pC O - L O C A T E m g / l V A L U E FOR Ca ( A S C a C O j ) ON T H E m g / l S C A L E .P R O C E E D V E R T I C A L L Y T O T H E R I G H T D I A G O N A L L I N E , T H E N AC RO SS T O T H E p C o S C A L E .
pAlk : L O C A T E m g / l V A L U E FOR " M " A L K A L I N I T Y A S ( C a C O j ) ON T H Em g/ l S C A L E - P R O C E E D V E R T I C A L L Y T O T H E L E F T D I A G O N A L L I N E , T H E N A C R O S S T O T H E pAlk S C A L E .
T O T A L L O C A T E mfl/l V A L U E F O R T O T A L S O L I D S ON T H E m g / l S C A L E .S O L I D S ■ P R O C E E D V E R T I C A L L Y T O T H E A P P R O P R I A T E T E M P E R A T U R E L I N E ,
T H E N A C R O S S TO T H E " c " S C A L E .
Figure No. 3 NOMOGRAPH FOR CALCULATIN G LANGELIER INDEX lL

The stability index (Ir ) proposed by Ryzner (1944) is considered to be a
more quantitative indicator of the corrosive nature of water. It is expressed
by the equation.
Experimental data indicate that calcium scale begins to form between index values
of 6.0 to 6.5 and becomes increasingly heavy as the index decreases. Corrosion
increases rapidly for values over 7.0.
Saturation and solubility indices for random water samples taken from
different aquifers in Lee County are summarized in Table 2. Data indicate
that water from the Floridan Aquifer System has a potential for scale
formation while waters from shallower aquifers are more corrosive. This
suggests that while the casing may be protected by heavy calcium scale
frequently observed inside the casing, the process of corrosion is actively
occurring along the outside wall of the casing. This explains why casing
failures (observed by geophysical methods) occur adjacent to shallow producing
zones despite thick accumulation of protective scale. While the values
measured show trends toward corrosion and scale formation, it should be noted
that the range of the corrosion values shown are considered mild to moderate.
At such rates a casing life expectancy of 20 to 25 years is to be expected.
In addition to the chemical breakdown of casing, sulfur reducing bacteria
are suspected to be present in deep wells throughout the study area. Sulfate
reducing bacteria increase corrosion by utilizing free hydrogen ions, which
polarize the cathode area of a galvanic cell to produce hydrogen sulfide in
the reaction:
As a result of the loss of hydrogen at the cathode, the errosion of iron at
the anode is accelerated (Smith, 1982). Desulfomaculatum are strictly an
-30-
Ir = 2pHs - pH (8)
S04 + 8H+ _ S + 4H20
S= + 2H+ ____ H2S
(9)
(10)

FLORIDAN AQUIFER SYSTEM MID-HAWTHORN AQUIFER SANDSTONE AQUIFER SURFICIAL AQUIFER SYSTEM
Well #1 Lanqelier2 Ryznar3 Well # Lanqelier R.yznar Well # Lanqelier Ryznar Well # Lanqelier Ryznar
WA-67 .91 5.87 L-702 .64 6.72 L-1418 .28 6.64 L-730 -.05 7.40
WA-118 1.43 5.60 L-1115 .60 6.80 L-1853 .07 7.07 L-739 .22 6.86
WA-123 1.05 5.09 L-1117 .77 6.36 L-1908 .20 6.90 L-1831 .10 7.00
WA-134 1.09 5.41 L-1973 .56 6.68 L—1974 .40 6.90 L—1982 -.15 7.70
WA-238 .72 6.30 L-2244 .30 7.30 L—1996 .12 6.88 L-1995 -.27 7.44
WA-316 .96 5.93 L-2641 .82 6.56 L-2192 00 7.10 L-2095 -.46 7.72
SampleAverage 1.02 5.70 .62 6.74 .18 6.92 -.10 7.35
lWA: SFWMD Monitor Well L: USGS Monitor Well
^Saturation Index I|_
^Stability Index Ir
TABLE 2. CORROSION INDICES {IL and Ir ) FROM REPRESENTATIVE SAMPLES TAKEN FROM LEE COUNTY AQUIFERS

anaerobic bacteria which thrive in deep wells of moderate salinity. Requiring
a reducing environment prevalent in deep wells, these bacteria frequently
exist in lobate encrustations or "tubercules" within the casing (Lewis, 1965).
Redox potentials for flowing wells, with observed tubercule growth, range from
-20 to -80 mV. The presence of an indicator for the presence of
Desulfomaculatum, in these same wells consistently exceeded the upper
measuring limit of 5 mg/l. Corrosion is most intense at these tubercules and
casing failures have been observed adjacent to tubercules in casing samples
taken in Lee County.
Upward Saline Migration
The mechanisms influencing the upward movement of saline water active in
Lee County have been postulated by several authors including: Sproul; Boggess
and Woodward (1972); Boggess (1973); and Boggess, Missimer and O'Donnell
(1977). Both faulting and well construction have been discussed. A review of
their results is given below.
Evidence of faulting in Lee County was originally presented by Tanner
(1965) in his theory on the origin of the Gulf of Mexico. He proposed two
possible first-order shear planes associated with the theoretical plate
movement bearing between N 30°E to N 50°E and N 70°W to N 90°W. Tanner
theorized the offset in the Lee County coastline, bearing approximately N
50°E, was caused by a fault active in the last 10,000 years. Additional
evidence was presented by Sproul (1972) who described several faults in the
McGregor Isles area as being responsible for temperature and water chemistry
anomalies. These faults, identified by offset geophysical marker beds, are
oriented approximately parallel to the N 70°W bearing described by Tanner.
Similar offset beds have been identified in Estero where wells of high
salinity were logged for plugging. Correlation of marker beds within the
lower Hawthorn/Tampa producing zone, identified from gamma and electric logs,
-32-

are shown on Figure 4. It is not clear whether the offset is caused by
folding or faulting; however, the apparent dips exceeding four degrees in less
than 500 feet strongly suggest faulting. The orientation of the structural
axes are within a few degrees of N 70°W. The magnitude of the offset between
wells on either side of an axis increases with depth through the Hawthorn
Formation suggesting the origin of the structure occurred prior to Miocene
sedimentation. The maximum offsets identified occur at the base of wells
WA-102 and WA-103, and WA-105 and WA-107 with an apparent dip of 4°30‘ and
6°20', respectively. In 1976, Missimer and Gardner used high resolution
continuous seismic profiles to identify subsurface structure along the
Caloosahatchee River. The equipment used provided penetration through the
mid-Hawthorn aquifer and into the top of the lower Hawthorn Formation but no
data were presented for pre-Miocene sediments. The profiles indicated the
middle and upper Miocene strata were extensively folded but not faulted.
Both the geophysical data presented by Sproul, et. al. 1972 and
geophysical data collected during this study indicate the maximum displacement
of beds occur at depth. The magnitude of the displacement decreases rapidly
in more recent strata. This trend is also demonstrated in seismic data and
suggests that if faulting exists, it occurs at depth and does not extend
through the lower Hawthorn confining zone. Although there may be saline
exchange due to faulting within the Floridan Aquifer System, there is no
evidence to suggest that faulting is responsible for the contamination of the
shallow principal aquifers in Lee County.
The primary cause of upward saline migration into the shallow freshwater
aquifers is attributed to early well construction practices combined with the
lack of subsequent well maintenance. Field data collected by the SFWMD
indicates that approximately 26% of the Floridan wells in Lee County are
-33-


uncontrolled and free flow continuously (205 wells surveyed). The average
discharge from the uncontrolled wells was 86 gpm. In addition to surface
discharge, internal flow resulting from differential head pressures between
connected aquifer has been observed throughout the county. Sproul (1972)
measured internal exchange from the Floridan into the mid-Hawthorn aquifer at
100 gpm in the McGregor Isles area. Similar internal flow rates have been
measured in Lehigh Acres and the Buckingham area by SFWMD. A conservative
estimate of the average rate of internal exchange for flowing wells in Lee
County is five gallons per minute.
A generalized cross section depicting the paths of upward saline
migration is shown on Figure 5. The potentiometric surface of the upper
portion of the Floridan aquifer in Lee County ranges from +20 to +55 feet NGVD
and exceeds the heads in all three principal freshwater aquifers throughout
the county (Wedderburn et al. 1982). Differences in potentiometric heads
ranging from 15 to 50 feet allow saline water to recharge the mid-Hawthorn
aquifer directly through uncased portions of the well- Contamination of the
Sandstone aquifer occurs by direct exchange in short cased wells, or through
corrosion holes. The Surficial aquifer receives recharge directly from
surface discharge.
An estimate of the total discharge into freshwater aquifers from Floridan
wells in Lee County was presented by Healy in 1978. Using the figure of 3,000
flowing wells presented by Sproul (1972), Healy estimated a daily discharge of
90 mgd from both surface discharge and internal flow.
From 1979 to 1983 a total of 350 wells were surveyed by the SFWMD. Of
these, 210 wells were located which were not included on the USGS deep well
inventory (742 surveyed wells). From these data, a revised estimate of 1850
wells is proposed for the total number of deep wells in Lee County. This
number is calculated from the rate of new finds combined with the original
-35-

-L.S.uo
o3(D
V>c“1S'n<#
- 100’
- 200 ’
- 300 ’
- 400 ’
- 500 ’
Figure No. 5 GENERALIZED CROSS SECTION DENOTING PATHS OF UPWARD SALINE MIGRATION
-36-

USGS inventory. Assuming 26 percent of these wells discharge continuously
throughout the year at an average rate of 86 gpm, an estimated 59.6 mgd is
calculated for surface discharge. By applying the average internal flow rate
of 5 gpm to 91 percent of the wells (which are short cased to the mid-Hawthorn
aquifer), the total flow loss for Lee County prior to any plugging activities
was approximately 81 mgd.
The effect of continual discharge is reflected by the steady lowering of
the potentiometric surface of the Floridan aquifer where declines of over ten
feet have been reported between 1944 and 1973 (Boggess, 1974). The region of
greatest decline occurs along the Caloosahatchee River where the majority of
deep wells are concentrated. The result of this decline is often reflected by
deterioration in water quality within the Floridan Aquifer System. This is
exemplified in well WA-131 (L-541) located in the Iona District. The chloride
concentration for this well rose from 1180 mg/l in 1950 to 5635 mg/l in 1981
(Wedderburn, et al, 1982). During this period the potentiometric head
pressure dropped from 32 feet to 17 feet NGVD.
Downward Saline Migration
The steady decline in the potentiometric surface of the mid-Hawthorn
aquifer, combined with steel cased wells located within tidal influence,
provide the mechanism for downward saline migration in Cape Coral. Cape
Coral, located in west central Lee County, was developed in the early 1960's.
The area was originally low lying and frequently flooded throughout the year.
In order to alleviate the problem of flooding and to provide residents with
boating access to the Gulf of Mexico, a complex network of canals, which
discharged into the saline waters of the lower Caloosahatchee River, was
established throughout the development. Early residences were provided with a
two-inch galvanized steel well drilled into the mid-Hawthorn aquifer to
provide potable water and lawn irrigation. These wells were frequently
-37-

located within 100 feet of a canal. The casings, driven with cable tool rigs,
were not grouted in place and after being exposed to a fluctuating saline
water table were rapidly corroded.
In the mid 1970's several municipal wellfields were developed in the
mid-Hawthorn aquifer. By 1979, the potentiometric surface of the mid-Hawthorn
aquifer in southern Cape Coral had dropped to over 20 feet below sea level
(Wedderburn et al., 1982). As a result, the elevation of the saline water
table in the vicinity of the canals exceeded that of the mid-Hawthorn and
downward recharge occurred through corrosion failures in the casing
(Figure 6). Several case histories are outlined by Boggess, et al. (1977).
-38-

Mid
-Haw
thor
n Up
per
Haw
thor
n Su
rfic
ial
Aqui
fer
Conf
inin
g Zo
ne
Aqu
ifer
Syst
em
LS
Saltwater Canal or River
x t ; . i . 1 1 1 1 ■1 • i i. i i i ii i
- 100 -
-20Q’--r-*—r
ft“CO3-
fi)
’<D<O
X€ZTO
-■0oCO
aCD<2.o■o3ft3
50)<D
0)<■<P
Figure No. 6 GENERALIZED CROSS SECTION DENOTING BRACKISH WATER RECHARGE OF THE MID-HAWTHORN AQUIFER.
Pre-development
Water
Level (Mid-H
awtho
rn)

GEOPHYSICAL APPLICATIONS TO WELL PLUGGING
In order to properly plug a well open to several aquifers, it is
necessary to locate each producing zone, identify the water quality, and
assess the degree of confinement between zones. To plug a well economically,
fracture zones and washouts must be identified and isolated. Borehole
geophysical surveys provide both site specific data for each well to be
plugged and regional hydrostrati graphic information useful for the future
development of the resource. The District operates a Gearhart-Owens model
3200 downhole logging system solely for well abandonment purposes. This four
channel system is capable of data capture in both digital and analog format.
Digital data is processed through the District's Well Log Analysis System.
This system assimilates digital data and allows for a number of modifications
including adjusting for common depth point, cross plotting, corrections for
variations in temperature and borehole diameter, and scale changes. Data can
be retrieved and displayed in a variety of formats. The surveys which
constitute a suite of logs for well abandonment purposes are shown on Figure 7
and include natural gamma, flowmeter, caliper, 16 and 64 inch normal
resistivity, spontaneous potential, casing collar locator, temperature
gradient, differential temperature, fluid resistivity, and point sampler.
All aquifer systems in Lee County can be approximated by characteristic
gamma activity associated with each unit. The Surficial Aquifer System and
the Sandstone aquifer are usually cased off and are therefore identified
solely by the increased gamma activity which occurs at the base of the
Surficial System and throughout much of the Sandstone aquifer. The top of the
mid-Hawthorn aquifer occurs beneath a high gamma emitting phosphatic regional
disconformity (Missimer, 1978). The Lower Hawthorn/Tampa Producing Zone is
identified on gamma logs by an attenuation of activity which occurs at the
base of the Lower Hawthorn Confining Zone. The top of the Suwannee aquifer is
identified by its virtual lack of gamma emitting minerals.
-40-

SPONTANEOUS POInv0.00 100-00I_______I
64-IN NORflflL RES Ohfl-flETERS
0.00 80.00L _______„ ____ . J
f l o h h e t e rCOUNIS/SECOND
0.00 SO .00 100,00L_______I_______t
0.0I_
DELTA TEMP
75.0__ I_
150.0___r

The resistivity and spontaneous potential logs provide lithologic
information necessary for the design of bridging plugs by identifying clayey
confining zones and competent limestone/dolomite units. Although the dolo-
silt confining zones contain only small percentages of mineralogic clay in Lee
County, often there are enough clay minerals present to cause polarization of
chloride and sodium ions about the confining bed. Cations move through the
confining zone while the chloride ions concentrate at the 1imestone/dolo-siIt
interface resulting in a potential that can be identified on SP logs. Tight
limestones and dolomites are identified by high resistivity values on both the
long and short normal logs. Individual producing zones within the Floridan
Aquifer System can also be located on resistivity logs where the flow of
magnesium rich waters have resulted in the genesis of secondary dolomite in
solution vugs.
Individual producing zones within the Floridan System are identified by
anomalies in the geothermal gradient measured on temperature logs. Calculated
yields from these zones are determined with a calibrated flowmeter lowered to
an area of consistent diameter above and below each producing zone identified
from the temperature logs. The yield (Y) in gallons per minute, is calculated
from the relation:
Y = 0.014 K vr2 (11)
Where,
v = the measured flow from the impeller tool (counts per second (cps))
r = the radius of the tested interval (inches)
< = the flowmeter constant determined empirically (in/min x 1/CPS)
The constant 0.014 is the product of ir and the number of gallons in a cubic
inch. The flowmeter constant (K) describes the tool's response to different
velocities for a given blade and basket assembly. K is the ratio between the
-42-
measured flow velocity in inches per minute and the response of the flowmeter
in counts per second. The value for K is usually calculated in the casing of
a well prior to logging.
Point sample water quality data taken above and below each producing zone
is corrected for the effect of mixing by the mass balance equation (Brown, et.
al., 1981):
[X]zone = Qa [ X U - Qb EX]b
(Qa “ Qb)
Where,
[XJzone = the corrected concentration of the chemical parameter
in question
Qa [XIa = the product of the borehole flow and concentration of the
chemical parameter measured above the producing zone
Qb [X] 5 = the product of the borehole flow and concentration of the
chemical parameter measured below the producing zone
These data are particularly useful in determining plugging and rehabilitation
designs where producing zones of differing water quality must be identified
and isolated.
Borehole geophysical methods are also used to identify interaquifer
exchange within wells. Exchange between the Floridan and mid-Hawthorn aquifer
is measured directly by flowmeter. A calibrated flowmeter is lowered to an
interval of uniform diameter within the confining zone between the units and
the well is shut in at the surface. The exchange rate, excluding frictional
loss, is equal to the flow rate calculated from equation 1 1.
Flow losses occurring into the Sandstone aquifer through corrosion holes
in casings have not been quantitatively measured by flowmeters in this program
but they are frequently identified by other methods. While the caliper is
-43-

sometimes useful in locating large breaks in the casing, the mechanics of the
tool and casing encrustation prevent the identification of small holes. The
casing collar locator, which indicates variations in a self-generated magnetic
flux, is useful in identifying variations in casing thickness caused by
corrosion. In wells which have been allowed to flow for some time, the
differential temperature survey (capable of measuring changes in temperature
of 1/100 of a degree Farenheit) locates cooler water entering the well from
the shallow aquifer via the Venturi effect.
A frequent problem encountered during logging was having a probe stuck in
the well. This problem often occurs in old wells drilled with cable tool rigs
through alternating clay and limestone units. The drill bit wanders at
density interfaces, clays squeeze in and reduce the borehold diameter, and the
wells are seldom drilled normal to land surface. As a result, a probe run
into a well will often drag along the bore wall with the cable constantly
abrading any shelf or irregularity in the borehole. Eventually the cable cuts
a narrow groove or keyhole which prevents the probe from being retrieved
(Figure 8). Swabbing the well with a large diameter steel "dummy" probe
helped reduce the problem but did not alleviate it. After several costly and
unsuccessful attempts by local contractors to retrieve stuck equipment, an
inexpensive and reliable method of “fishing" was devised by SFWMD. This
technique involves the use of 2“ PVC pipe equipped with flush treaded
couplings which is carried in 10 foot sections on a support vehicle. When the
probe is stuck, a grooved aluminum "fishing" head is fitted over the conductor
cable. The fishing head is attached to the PVC pipe and is lowered to the
probe. The fishing head pushes the cable out of the keyhole as the string of
pipe is bounced, freeing the probe. The probe is then pulled into the fishing
head and the string of pipe and probe removed. Because PVC has almost the
same specific gravity as brackish water, a 400 foot string of pipe can be
-44-

Figure No. 8 LOST PROBE RETRIEVAL METHOD UTILIZED BY SFWMD
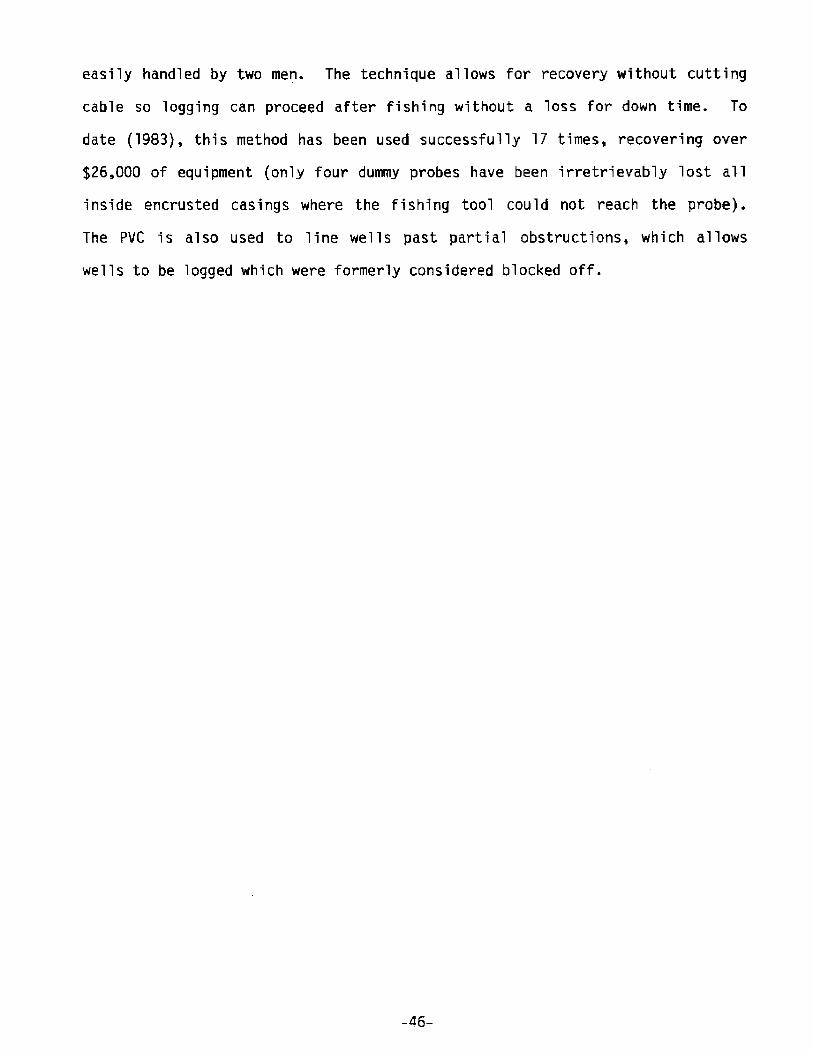
easily handled by two men. The technique allows for recovery without cutting
cable so logging can proceed after fishing without a loss for down time. To
date (1983), this method has been used successfully 17 times, recovering over
$26,000 of equipment (only four dummy probes have been irretrievably lost all
inside encrusted casings where the fishing tool could not reach the probe).
The PVC is also used to line wells past partial obstructions, which allows
wells to be logged which were formerly considered blocked off.
-46-

METHODS OF WELL PLUGGING
To permanently plug a well open to several producing zones, it is
necessary to isolate each zone by replacing the natural confining zones with a
material of equal or superior confining properties. When dealing with a large
number of wells this must be done in a cost effective manner. While methods
of plugging flowing wells range from "stumping" (wedging a log into the casing
below grade and burying the well) to dynamite, there are three basic methods
generally recognized for effective well plugging. These methods, used by
SFWMD, are: a) packer installation, b) backfilling, and c) stage grouting.
A packer, as used in plugging operations, refers to any permanent
impermeable bridging device. While being the most precise method of isolating
producing zones, packers are often cost-prohibitive for widescale use. A
variety of more colorful alternatives have been devised by local contractors
which include wooden posts, sacks of dried beans, or cow dung mixed with
bentonite, all of which rely on hydraulic expansion of the material to form an
impermeable seal. These methods, while posing obvious environmental hazards,
are in themselves extremely unreliable short-term solutions. In contrast, the
more elaborate mechanical well packers used by the oil and groundwater
industry are cost-prohibitive. Investigations have produced two cost
effective, environmentally sound packers. The first, the QWIP plug developed
by SWFWMD, is an inexpensive cement inflatable packer. This device consists
of PVC pipe covered with a coarse mesh burlap sock which is fabricated to a
larger dimension than the borehole. The bottom four feet are constructed with
strong impermeable vinyl fabric which confines the bottom of the plug
(Figure 9). The length of the plug and volume and weight of cement needed to
inflate it are based on the head pressure of the well. The packer is set
adjacent to a competent confining zone with drill rod. Cement is pumped
through the drill rod and into the plug through holes at the base of the PVC
-47-

c z ^
LEFT-H A N D THR EAD NIPPLE
HOSE-CLAM P
2 3/8” PVC PIPE
BURLAP SOCK
1/2” HOLES
HOSE-CLAM P
C O N E-SH APEDCENTRALIZER
4’ P LA STIC B O O T O U TS ID E BURLAP SO CK
Figure No. 9 DIAGRAM OF SO UTH W EST FLORIDA WATER MANAGEMENT DISTR ICTS QWIP BRIDGING PLUG
-48-
PLUG
LE
NG
TH
VARI
ES
WIT
H H
YDR
OG
EOLO
GIC
C
ON
DIT
ION
S
AN
D
SPEC
IFIC
G
RAV
ITY
OF
THE
CE
ME
NT

core. Cement weeps through the burlap forming a positive seal to the bore
wall. This device has been used extensively by SWFWMD and by the SJRWMD but
has had limited use in Lee County.
The second device, a gravel-bentonite packer, consists of a burlap sack
over a PVC pipe which is filled with fine gravel and dry granular bentonite.
It is lowered to a confining zone and held in place for 20 to 30 minutes as
the bentonite expands and conforms to the bore wall. The plug is then
detached from the drill stem and cemented in place. The advantage of this
type of packer is that the driller can set it without having to pump cement
through a drill stem as with the QWIP plug. This device is widely used
outside of Florida in both flowing and non-flowing wells; however, it has
limited applications in saline wells as dissolved salts impede the hydraulic
expansion of bentonite. Because of this, the gravel-bentonite packer is not
applicable for most of Lee County's flowing wells.
Backfilling is used to fill voids, fractures, or washouts associated with
most wells. Backfill can be used adjacent to producing zones, if possible, to
prevent slurry loss, or in between cement stages within thick confining zones.
The material most often used for backfill is clean crushed stone or sand
treated with calcium hypochlorite to prevent biologic contamination.
Emplacement of backfill is complicated by "bridging" in most wells, and to
insure proper placement the fill must often be tamped in place with drill rod.
There are obvious limitations on the use of backfill in flowing wells;
however, once the flow is stopped with packers or stage grouting, backfill is
an economic alternative to straight grout.
By incorporating site specific data provided by geophysical methods with
potentiometric head pressures, conventional bottom to top grouting can be
supplemented by stage grouting. Stage grouting utilizes the upward hydraulic
force exerted by a flowing well to balance an unconfined specific volume of
-49-

slurry of a given weight. This technique is used to isolate individual flow
zones without the use of a packer. Because less cement is used (compared with
conventional bottom to top continuous plugs) stage grouting is useful in
reducing the volume of slurry lost to the formation caused by excessive
weight.
There are two approximations used to calculate the amount of slurry
needed for each stage in the Floridan Aquifer System; the minimum weight
needed to compensate for the hydraulic head of a flow zone and the volume
needed to overcome the difference in flow rates between the well and the
slurry pumpage rate. The upward force P (in pounds) exerted by the producing
zone is a function of head, measured from land surface, and the capacity of
the well:
P = 8.3 C (hi - h2) (13)
Where,
C = capacity of the well casing (gal/ft)
hj = the potentiometric head (in feet) of the flowing well
referenced from land surface
h2 = the potentiometric head of the next overlying, uncased
producing zone or aquifer with a potentiometric head below
land surface
In Lee County, the h2 term, referenced from land surface, applies primarily to
those wells in which the mid-Hawthorn aquifer is not cased off. In those
areas where the well is fully cased into the Floridan System, the h2 value is
zero. Approximation of h2 values are obtained from regional potentiometric
surface maps. Due to the magnitude of the physical variables and the degree
of error in estimating h2, corrections for specific gravity and temperature
-50-

are not applicable. In deep wells which contain several independent producing
zones within the Floridan Aquifer System, the value for P, calculated at land
surface prior to plugging, is applied to each zone. While this assumption is
not always accurate, field tests of wells with diameters up to eight inches
indicate a significant tolerance for slurries with excessive weight. Using
high viscosity slurries, slurry stages weighing over 20 times the calculated
value of P have been successfully floated in wells. This is attributed to the
degree of cohesion in high viscosity cement-bentonite slurries combined with
the small diameter and roughness of the borehole. It is not known if this
tolerance for excessive weight holds for wellbores greater than eight inches;
however, existing data suggests that greater precision is required for large
diameter welIs.
The second approximation allows for the amount of slurry that will be
diffused and held in suspension due to differential flow velocity when pumping
first begins. Using 1^ inch PVC tremie pipe it is difficult to exceed a
pumping rate of 30 gpm when using a high viscosity slurry. In wells flowing
several hundred gallons per minute the first portion of slurry is put in
suspension and acts as a drill fluid coating the bore wall and weighing down
the borehole fluid. The higher the velocity of the water in the borehole, the
greater the pressure drop along the bore wall. This causes greater amounts
of suspended slurry to migrate to the sides of the well. While unable to
calculate the amount of slurry which stays in suspension or the point at which
the well will stop flowing, an upper limit can be derived using the ratio
between the formation discharge {Qf) taken from a corrected flow log and the
rate of slurry discharge (Qs). This value is multiplied by the calculated
value of P divided by the weight of the slurry W (in pounds per gallon) to
yield the volume of the stage V (in gallons).
-51-

(14)
The only remaining factor to be considered is the amount of slurry lost
to the formation. This value, known as the Formation Loss Factor (F), is the
ratio betwen the actual measured footage plugged (La) and the theoretical
linear footage (Lt) which is based on the volume of slurry pumped and the
capacity of the well.
Shrinkage of the slurry while setting is negligible for high bentonite
slurries which exhibit little shrinkage. Field data in Lee County for wells
drilled with cable tool rigs indicate values for F range between 15 and 20
percent in the Floridan Aquifer System. The values for F decrease to 10
percent or less in the lower Hawthorn Confining Zone.
Once enough stages have been pumped to isolate each producing zone in the
Floridan Aquifer System, the tremie pipe is removed and the contractor is paid
to stand by while the slurry sets. After a slurry sample sets, the remainder
of the well is backfilled and grouted to surface. It is not necessary for
casings to be ripped or perforated prior to grouting, due to the lack of
annular space inherent to cable tool drilling and due to the hydraulic
expansion capabilities of the clayey confining materials.
The properties of the cement used to plug a well can be modified to fit
specific needs by using various slurry additives. Three basic additives have
been used in this program: bentonite, barite, and calcium chloride.
Bentonite is used to seal the formation walls, decrease cement shrinkage, and
to reduce the slurry weight. It is used in concentrations up to 15 percent to
produce high viscosity slurries with weights below 13 pounds per gallon. It
F = 1 - (hi) X 100%V (15)
-52-

is used in smaller concentrations to reduce formation loss and to increase the
per sack yield of straight cement {Table 3). In highly fractured formations,
especially at depths over 800 feet, loss circulation materials such as
Micatex® and Fibertex© are added to cement bentonite slurries to further
reduce formation loss. Bentonite is also mixed with crushed stone or sand to
fill washout voids or fractures. Fresh water must be used with bentonite
since dissolved solids inhibit clay expansion and render the additive useless.
When fresh water isn't available, salt tolerant muds containing attapulgite
(Zeogel®) are used instead of bentonite to increase viscosity. Barite
replaces bentonite to reduce formation loss in high pressure wells where
slurry weights over 15 pounds per gallon are needed. Calcium chloride is used
as an accelerator to reduce setting time. When used in concentrations between
3 to 5 percent it allows straight Portland Type A slurries to set in one hour
or less. When used with formation water high in dissolved calcium chloride,
flash setting can occur. This phenomenon has proven useful in preventing
floating plugs from sinking to the bottom of the well.
A case study of well number WA-51 is presented as an example of the
techniques described. WA-51 was drilled in the late 1950's for agricultural
purposes and was geophysically logged in February 1980. It was 823 feet deep,
contained 115 feet of six inch steel casing, and flowed at a measured rate of
310 gpm. Interpretation of geophysical data indicates the flow occurred from
three major zones located at -720 to -740, -520 to -535, and -400 to -440 feet
below land surface (LS). There was no flow below -720 feet. The top of the
Suwannee aquifer was identified at -520 ft. L.S. and the top of the lower
Hawthorn/Tampa producing zone occurred at -360 ft. L.S. The mid-Hawthorn
aquifer was identified between -110 to -200 ft. L.S. and was not cased off.
The average borehole diameter was seven and one-half inches.
-53-

-54-
Percentientonite
Water Requirements Gal/Sk Ft3/Sk
Slurry Weight lbs/Gal Ibs/Ft3
Slurry Volume Gal/Sk Ft3/Sk
Compressive Strength Setting Time PSI at 80° F >2000 (hrs) 12 hrs 24 hrs 72 hrs
0 5.2 0.70 15.6 117 8.8 1.18 2:14 580 1905 4125
2 6.5 0.87 14.7 110 10.2 1.36 2:25 455 1090 2840
4 7.8 1.04 14.1 105 11.6 1.55 2:26 220 750 1775
6 9.1 1.22 13.5 101 12.9 1.73 2:16 85 360 1170
8 10.4 1.39 13.1 98 14.4 1.92 2:31 50 265 720
10 11.8 1.48 12.7 95 15.7 2.10 1c ★ ★ ★
12 13.0 1.64 12.3 92 17.1 2.29 * * *
PercentIentonite
Compressive Strength PSI Setting Time Setting Time at 80°F 2% CaCl2 2% CaCl?(hrs) 4% CaClp(hrs) 6 hrs 8 hrs 12 hrs 18 hrs
Compressive Strength PSI at 80°F 456 CaCl2
24 hrs 6 hrs 8 hrs 12 hrs 18 hrs 24 hrs
0 1:30 0:47 685 1230 1675 2520 3125 960 1490 2010 2800 3080
2 2:00 0:56 350 620 1150 1805 1820 535 730 1100 1610 2020
4 2:41 1:52 170 240 500 785 1085 265 335 355 865 1195
Jfno data presented
TABLE 3. SLURRY YIELDS AND WEIGHTS FOR PORTLAND TYPE A CEMENT/BENTONITE SLURRIES (FROM HALLIBURTON, 1975)

On August 24, 1983, WA-51 was plugged. Prior to plugging, the
potentiometric head was measured at +16 ft. L.S. The potentiometric head for
the mid-Hawthorn aquifer was approximately -10 ft. L.S. at this time. Using
equation 13, the value for P was calculated as 320 lbs. Using a 13 lb/gal
slurry and a Qs value of 30 gpm, the value of V calculated from equation 14
was 235 gallons (rounded). The first stage, consisting of 650 gallons of
slurry was pumped at a depth of -560 ft. L.S. This large volume of slurry was
used to test the wells response to excessive slurry weights and to attempt to
cement off the flow zone occurring at -535 ft. L.S. The slurry contained 4.4
percent bentonite to reduce formation loss, and 100 lbs. of calcium chloride
which was added to the last 300 gallons of slurry (approximately five
percent). After the stage was pumped, the tremie was removed and the well
capped at land surface. The following day, the well was flowing at
approximately 125 gpm and the top of the plug was tagged at -472 ft. L.S.
Assuming an average borehole capacity of 2.3 gal/ft, the theoretical length of
the plug was calculated as 283 feet.
It is apparent that the excessive weight of this stage caused the plug to
sink. However, the location of the top of the plug at -472 ft. L.S. indicates
that the plug did not sink to the bottom of the well. The base of the plug
was located at approximately -720 ft. which corresponds to the top of the
deepest producing zone. This assumption is based on the fact that there is no
upward force to balance the weight of the slurry below -720 ft. L.S. If
slurry were able to pass below 720, the entire plug would sink to the bottom
of the well. The formation loss factor F, assuming the base of the plug at -
720 ft., was calculated as 14 percent for this stage.
A second stage, consisting of 56 bags of cement, 350 pounds of bentonite,
and 200 lbs of calcium chloride was pumped from a depth of -320 ft. L.S. The
top of the second stage was located the next day at -102 ft. L.S. The base of
-55-

the plug was located at approximately -400 ft. L.S. The theoretical length of
the plug was 335 feet and the actual length is 298 feet. Therefore, the
formation loss factor F for the second stage was 11 percent. The remainder of
the casing was cemented to land surface.
A total of 1,585 gallons of slurry, consisting of 116 bags of cement, 650
ponds of bentonite, and 400 pounds of calcium chloride were used to plug WA-
51. By applying the average value for F of 12.5 percent to the calculated
capacity of the borehole prior to plugging, the total volume of slurry needed
to fill the well bottom to top would have been approximately 2000 gallons.
The difference between the volume needed to fill the well and the volume of
slurry actually pumped is 415 gallons which is equivalent to 180 linear feet
of borehole. Based on the assumed location at the bottom of the two plugs, a
total of 172 feet of borehole was not cemented, which indicates the base of
the plugs are within a few feet of the -720 and -400 foot depths proposed.
In both the first and second stage, the excessive weight of slurry caused
the plugs to sink to the top of a major flow zone. These data, along with
similar test results, suggest a tolerance for larger slurry stages than those
calculated from equations 13 and 14. While extra slurry weight may provide
insurance against having a stage washout, excessive volumes are not needed to
effectively isolate a producing zone and, in some cases, may be a waste of
materials.
Between 1979 and the end of the 1982-83 fiscal year, a total of 268 wells
had been plugged under the SFWMD - Lee County deep well programs. A total of
27,125 bags of cement and 1,900 bags of bentonite were used to plug 146,822
linear feet of borehole. The average flowing well plugged was 544 feet deep
and was constructed with 130 feet of six inch steel casing, at a cost of
$1,825.03. A total of 542 wells were plugged under the SFWMD - Cape Coral
shallow well co-op. The average Cape Coral well was 120 feet deep,
-56-

constructed with two inch steel casing, and required 7.3 bags of cement to
plug. The average cost per well was $176.06. A detailed summary of the costs
and materials used in these programs is included in Appendix III.
-57-

WELL REHABILITATION
In many cases a well can be rehabilitated to yield better quality water
at a lower cost than drilling a new well. Rehabilitation involves eliminating
inter-aquifer connection afforded by the original construction while providing
adequate quantity and water quality to suit the needs of the user. In order
to prevent leakage through the old steel casing, all rehabilitation designs
require the emplacement of a PVC liner which is cemented in place from land
surface to the top of the aquifer to be developed. Site specific information
including corrected flow log, fluid resistivity, and point sampler data are
necessary to assess the feasibility of rehabilitation. While there are no
funds available for rehabilitation through this program at this time, a brief
discussion on rehabilitation may be useful to well owners or contractors. The
most common method, known as partial plugging, involves cementing off the deep
saline zones of a well while preserving shallow freshwater zones.
If geophysical data indicates a marked decrease in water quality with
depth in the Floridan Aquifer System, it is possible to selectively cement off
the deeper saline producing zones while preserving the better quality flow
zones. This technique is applied to agricultural properties where free
flowing wells are preferred, and has been widely used in St. Johns County by
the St. Johns River Water Management District's plugging program (Munch,
1978). Flowmeter logs and point sample water quality data should be
considered to determine the water quality and yield of the well after
rehabilitation. An example of this method of rehabilitation is shown for well
WA-85 on Figure 10. Fluid resistivity data identified saline water entering
the borehole near the bottom of the well. A flowmeter survey was run and
point sample data were collected above and below the six producing zones
identified. Water quality data were corrected for the effects of mixing. At
the time of testing (July 1980), the chloride concentration at the well head
-58-


was 771 mg/1. The owner installed the PVC liner as shown, but didn't cement
off the base of the well. By August, 1983, the chloride level measured at the
well head had increased to over 1000 mg/1 indicating further increases in
salinity from the deeper producing zones. By plugging the bottom 250 feet of
the well, the flow will be cut in half and the chloride level will drop to
approximately 700 mg/1.
A second application of partial plugging pertains to wells in which the
mid-Hawthorn aquifer is not cased off. In these wells, the entire Floridan
Aquifer System is cemented off, leaving the mid-Hawthorn aquifer available for
development. The major advantage to this method is the improvement in water
quality; however, the mid-Hawthorn aquifer does not free flow in much of Lee
County and, in many cases, the rehabilitated well will require a pump.
An example of this type of partial plugging is shown on Figure 11. Well
WA-181 was 444 feet deep and contained 110 feet of four inch steel casing
which was set in a limestone unit (twelve mile slough limestone) as determined
from the 16" and 64” normal resistivity logs. A flowmeter and temperature
survey determined that the entire flow (260 gpm) was from a single producing
zone at the base of the well. The well was valved off and an internal flow
rate of 55 gpm was measured between the lower Hawthorn/Tampa producing zone
and shallow artesian aquifers. As there is no central water and sewer system
in this area, the owner of WA-181 was notified his well was contaminating a
potable aquifer system. The owner requested partial plugging to maintain a
supply of water to his cattle and agreed to emplace a PVC liner at his
expense. At the time of plugging (June 30, 1983) the chloride concentration
at the well head was 1044 mg/1. The well was cemented back to -160 ft L.S.
and was allowed to set for three days prior to development. By October 26,
1983, the chloride concentration had dropped to 757 mg/1. The well flows
freely at a rate of 15 gpm.
-60-

pvc liner
100-
200 -
Cement-Bentonite grout
300-
400-
Gamma logSurficial Aquifer
System
Upper Hawthorn Confining Zone
SandstoneAquifer
Mid-Hawthorn Confining Zone (Twelve Mile
Slough Lm.)
Mid-HawthornAquifer
Lower Hawthorn Confining Zone
Floridan Aquifer _ System
(Lower Hawthorn/Tampa Producing Zone)
Figure No. 11 REHABILITATION DESIGNS FOR WELL WA- 181
-61-

Water quality recovery for the two methods of partial plugging described
vary in both magnitude and time. For wells which are back plugged to the base
of the mid-Hawthorn aquifer, the time required for water quality parameters to
reach background levels is dependent upon the extent of intrusion and to the
degree in which the rehabilitated well is used after partial plugging. In
general, a rapid drop in salinity is experienced within months of
rehabilitation; however, complete recovery takes several years. In Lee
County, background chloride levels for the mid-Hawthorn aquifer are generally
below 500 mg/1 west of the Caloosahatchee River and below 250 mg/1 east of the
Caloosahatchee. In contrast, recovery is almost immediate for wells which are
partially plugged to tap a single zone within the Floridan Aquifer System. In
such a case, chlorides from well WA-136 dropped from 1120 mg/1 to 840 mg/1 in
just one day. Figure 12 indicates similar rapid recovery rates occur in the
Florida Aquifer System in St. Johns County. Well SJ-147 was partially plugged
in November 1976 with an initial chloride concentration of 2800 mg/1. Days
after plugging, the chlorides had dropped to 1950 mg/1, and by December 1976
had dropped to 740 mg/1. This rapid rate of water quality recovery is
attributed to the relative equality of the potentiometric levels for each
producing zone in the Floridan Aquifer System. The lack of a hydraulic
gradient between producing zones limits the extent of interaquifer exchange.
While isolating a single zone in the Florida Aquifer System may yield rapid
water quality improvements, minimum chloride levels for the Floridan in Lee
County are rarely less than 600 mg/1.
-62-

CHLORIDE C O N C E N TR A TIO N IN PARTS PER MILLION
O © S S © O O g§ o o o © o oS o o 5 © ©— — — __ w CM V CO 00 O N « < o eoO M « " n cm n 01 01
l— i— i— I____________________________________________________________________________ I_____ I________i I_____i I I__I________I_______ I________1_______ I_______ I________I...J . .) - j I___ I I_____I________I I____ 1________I
April1975
2800
Figure No. 12 WATER QUALITY DATA FROM A PARTIALLY PLUGGED WELL IN TH E FLORIDAN AQUIFER SYSTEM IN ST. JOHNS CO UNTY, FLA. (FROM MUNCH, 1978)
-63-

EFFECTS OF WELL PLUGGING ON GROUNDWATER SYSTEMS
The rate at which the water quality in an aquifer recovers from point
source contamination depends primarily on the extent of the contamination,
ambient ground water velocities, and the hydrodynamic dispersion of the
contaminant through the invaded aquifer. Additional parameters considered in
solute transport problems such as distribution coefficients, ion exchange
capacities, decay constants, branching ratios and coupling ratios between
pores, and fractures pertain to site specific problems and are not considered
here. In Lee County where saline wells have been leaking or free flowing for
decades, the systems are assumed to have reached steady state and the period
of contamination is considered to be infinite.
The extent of a saline plume generated by a single well is related to the
rate of contaminant discharge, the salinity of the outflow, and the hydraulic
properties of the invaded aquifer. Where topsoils are permeable, virtually
all water which discharges on land surface enters the water table aquifer with
the rate of discharge being directly related to the areal extent of the
contamination. In Lee County, where many of the flowing wells occur on
agricultural properties, much of the flow is diverted through ditch irrigation
systems. In these areas, saline plumes are influenced by surface features as
well as by the hydraulic properties of the aquifer. The rate of internal flow
into the shallow artesian aquifers is dependent on the differential pressure
between aquifers and the permeability of the invaded zone. The potentiometric
surface of the Floridan Aquifer System shows very little seasonal fluctuation
in Lee County; however, seasonal variations over 15 feet occur in both the
Sandstone and the mid-Hawthorn aquifers adjacent to major well fields
(Wedderburn et. al., 1982). In wells with short casings, resulting exchange
rates may as much as double during the dry season as compared with the wet
season in these areas.
-64-
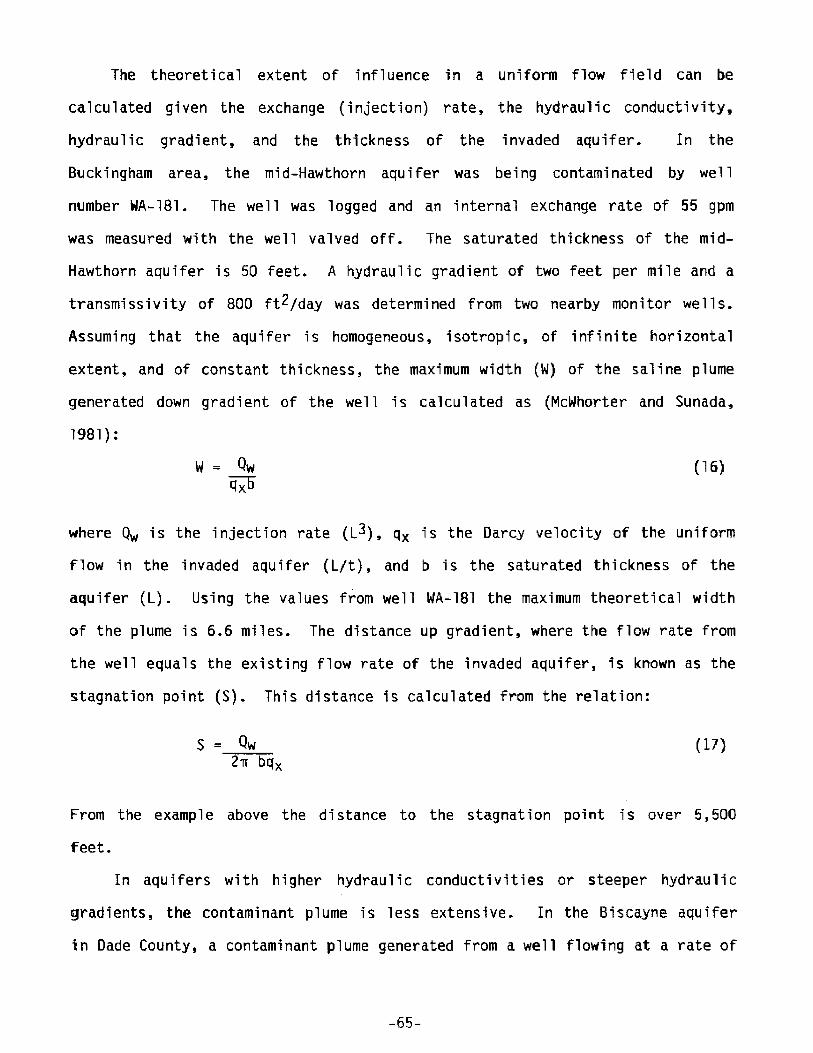
The theoretical extent of influence in a uniform flow field can be
calculated given the exchange (injection) rate, the hydraulic conductivity,
hydraulic gradient, and the thickness of the invaded aquifer. In the
Buckingham area, the mid-Hawthorn aquifer was being contaminated by well
number WA-181. The well was logged and an internal exchange rate of 55 gpm
was measured with the well valved off. The saturated thickness of the mid-
Hawthorn aquifer is 50 feet. A hydraulic gradient of two feet per mile and a
transmissivity of 800 ft^/day was determined from two nearby monitor wells.
Assuming that the aquifer is homogeneous, isotropic, of infinite horizontal
extent, and of constant thickness, the maximum width (W) of the saline plume
generated down gradient of the well is calculated as (McWhorter and Sunada,
1981):
where Qw is the injection rate (L^), qx is the Darcy velocity of the uniform
flow in the invaded aquifer (L/t), and b is the saturated thickness of the
aquifer (L). Using the values from well WA-181 the maximum theoretical width
of the plume is 6.6 miles. The distance up gradient, where the flow rate from
the well equals the existing flow rate of the invaded aquifer, is known as the
stagnation point (S). This distance is calculated from the relation:
From the example above the distance to the stagnation point is over 5,500
feet.
In aquifers with higher hydraulic conductivities or steeper hydraulic
gradients, the contaminant plume is less extensive. In the Biscayne aquifer
in Dade County, a contaminant plume generated from a well flowing at a rate of
W = Qw
Px^
(16)
s = Qw 2tt bqx
(17)
-65-
1000 gpm was mapped using surface geophysical methods (Figure 13). The
hydaulic conductivity for the Biscayne aquifer at this location is
approximately 8020 ft/day based on a thickness of 50 feet. The gradient is
one third of a foot per mile. From this data, the width of the plume W is
7,700 feet and the distance to the stagnation point S is 1,200 feet. These
values correlate well with the field data.
Solute transfer caused by the bulk movement of water through an aquifer
is known as advection and represents the primary process in which a
contaminant moves through an aquifer. The average velocity (V) of water
through a porous medium can be expressed as the Darcy velocity (qx) divided by
the porosity (0):
V = qx = -K3h (18)0 03s
Where,
K = the hydraulic conductivity (L/t)
3h = the hydraulic gradient (dimensionless)3s
In the shallow artesian systems of Lee County, interstitial velocities
are low. Using the data taken from well WA-181, and assuming a 10 percent
porosity for the mid-Hawthorn aquifer, the average linear velocity is 0.065
ft/day. Applying this velocity to the distance to the stagnation point, the
time needed for the contaminant to move down gradient of the injection well is
200 years. In contrast, groundwater velocities calculated from the Biscayne
aquifer, where the hydralic conductivity is over two orders of magnitude
larger than those of the mid-Hawthorn aquifer, were over one foot per day
(Camp, Dresser, and McKee, 1980). Because other processes act to reduce the
concentration of the contaminant as it moves from the source, consideration of
advection alone represents the worst case calculation in terms of noticable
water quality recovery.
-56-

Figure No. 13 AREAL EXTENT OF A CONTAM INANTP L U M E G E N E R A T E D BY T H E GROSSMAN WELL IN DADE COUNTY, FLORIDA (FROM WALLER, 1982)
f -67-

The primary process which acts to reduce saline concentration in a
fractured environment is hydrodynamic dispersion. Dispersion refers to mixing
caused by variations in interstitial velocities and molecular diffusion where,
D = f(v,d1,d2) + f(Dd) (19)
Dispersivity (D) is a function (f) of interstitial velocity (v), the
longitudinal (d]) and transverse (d2) dispersivity coefficients, determined
emperically, and molecular diffusion (D^) (Mercer and Ross, 1982). The major
factor which affects the values of v, d], and d2 is media heterogeneity which
cause variations in flow rates through the aquifer. In homogeneous
particulate aquifers the effects of dispersion are small compared to the
effects in the fractured and solutioned limestones which comprise the
Sandstone and mid-Hawthorn aquifers of Lee County. Diffusion, which results
through molecular motion, is primarily temperature dependent.
In confined aquifers dispersion occurs along the perimeter of the
contaminant plume with the longitudinal dispersivity (parallel to the
direction of flow) generally being larger than the transverse dispersivity.
Water quality data from two monitoring wells in the mid-Hawthorn (LM-18 and
LM-40) and one well in the Sandstone aquifer (LM-17) are shown in Figure 14.
Contamination into the Sandstone aquifer occurred from a nearby well, WA-123,
which was constructed with 80 feet of casing. Exchange rates between the
Floridan and the Sandstone aquifer in WA-123 were below 20 gpm. The rapid
recovery demonstrated in LM-18 and LM-40 is attributed to local development of
the mid-Hawthorn aquifer. Increased gradients associated with pumpage act to
increase interstitial velocities thus increasing the effective dispersivity of
the mid-Hawthorn aquifer. In contrast, little development of the Sandstone
aquifer occurs near the site and as a result of minor changes in the hydraulic
-68-

■69'
LM-18 IM-40 LM-45 MID-HAWTHORN AQUIFER
o31
CJCOLlJ
a
ct:C D
r
Nair
aioxc_>
750-C 725-0 _ 7 0 0 .G „ G75 .0 _650.0625.0 _ 600-0 „ 575-0 . 550 .0 525 -0 . 500 * 0 _| 475 *0450 -0600 -0 575-0 „ 550 -0 . 525-0 500 -0 _ 475-0 A 50 .0 425-0 .400.0 _ 375-0. 350 -G325.0 300-0.
LH-17 LH-19 -- SANDSTONE AQUIFER
a: v-o_ a: cr r:
oID<r uo
>o
acr"5
CD QCcr CL
cc>-cri;
oa
0-iijCO o>oz
uUJa
crCDLlJ
cecrz:
t*Ta.a: <X
1981 19B2 1983
M O N ITO R W ELLS FOR WA-123 AND WA-181
Figure No. 14 CHLORIDE DATA FROM MONITORING WELLS IN THE SANDSTONE AND MID-HAWTHORN AQUIFER NEAR WA-123 AND WA-181

gradient, recovery is more gradual. Preliminary data indicate that recovery
rates for the shallow artesian aquifers depend primarily on the extent of
contamination and the degree to which the aquifer is developed after the
contamination is stopped. Based on the theoretical extent of contamination
caused by even small inter-aquifer exchange rates, combined with low hydraulic
conductivities, hydraulic gradients, and recharge rates for both the mid-
Hawthorn and the Sandstone aquifers, significant water quality recovery
generally occurs on the order of several years after plugging.
Dispersion in unconfined aquifers is accelerated by direct recharge. The
lower density fresh water effectively "floats" on top of saline water allowing
dispersion to occur vertically as well as horizontally about the contaminant
plume. Additional characteristics of water table aquifers which act to
accelerate water quality recovery include rapid changes in hydraulic gradients
associated with convective storms, and seasonal temperature variations which
influence diffusion rates.
An example of water quality recovery in the water table aquifer was
presented by Boggess (1973) in the Bonita Springs area of Lee County. A
saline plume over 600 feet down gradient from a deep well flawing five gpm was
identified in the Highland Estates development. Four shallow residential
wells within the plume were monitored for a period of four years. Three
months after the deep well was plugged, chloride levels in the monitor wells
dropped an average of 60 percent (Figure 15). By October 1969, 20 months
after plugging, the chloride levels in the four monitor wells had virtually
reached background levels. Representative rainfall data for the period was
taken from Corkscrew Swamp, approximately 8 miles east of the study. The
uniform recovery observed at all stations suggests that dilution of the plume
by rainfall is more prevalent than dissipation by advection. If this is the
case, similar rapid recovery rates can be anticipated for larger plumes
-70-

600DCLU
£ 500a«
I 400
£ 300I-zooLU9 200acO
100 -
coLUXo
15
10
< 5cc
i— i— i— i— i— i— i— i— i— i— r n — i— i— i— i— i— r ~ T i— i— i— i— i— i— i— i i i iJ M M J S N J M M J S N J M M J S N J M M J S N J M M J S N J
1968 1969 1970TIM E (M O N TH S)
1971 1972
Figure No. 15 RELATION BETWEEN RAINFALL AND GROUNDWATERRECOVERY IN AN UNCONFINED AQUIFER IN BONITA SPRINGS (MODIFIED FROM BOGGESS, 1973)
-71-
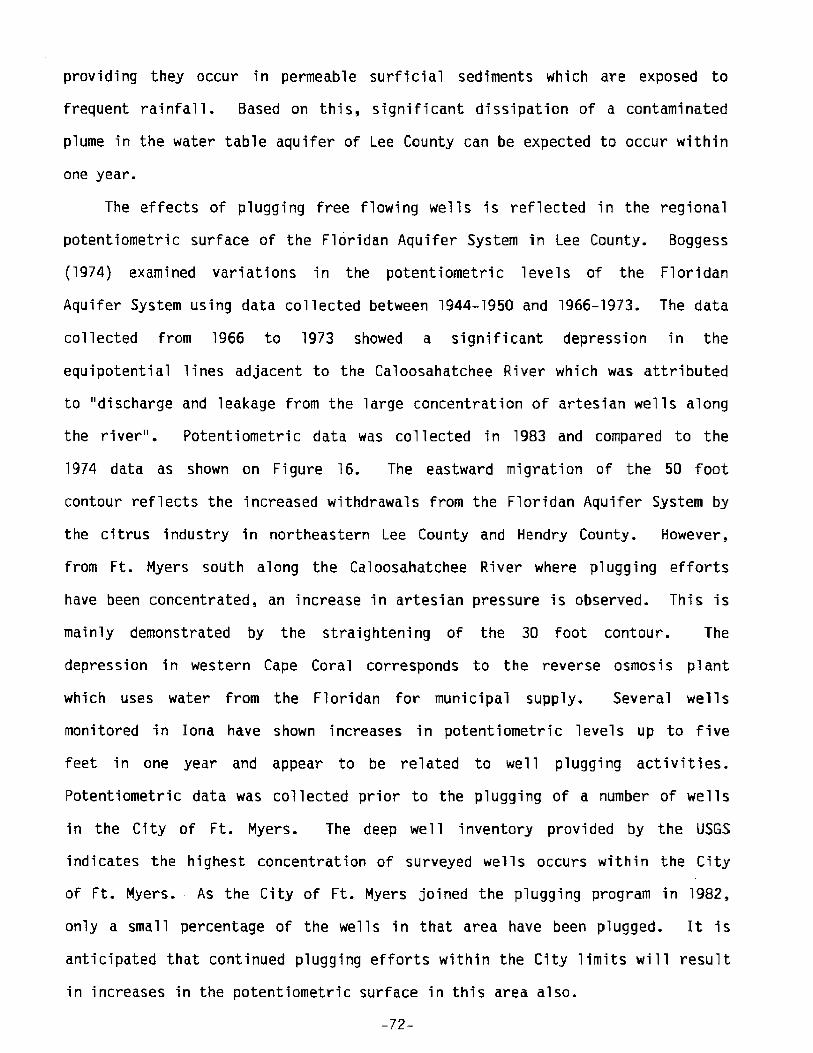
providing they occur in permeable surficial sediments which are exposed to
frequent rainfall. Based on this, significant dissipation of a contaminated
plume in the water table aquifer of Lee County can be expected to occur within
one year.
The effects of plugging free flowing wells is reflected in the regional
potentiometric surface of the Floridan Aquifer System in Lee County. Boggess
(1974) examined variations in the potentiometric levels of the Floridan
Aquifer System using data collected between 1944-1950 and 1966-1973. The data
collected from 1966 to 1973 showed a significant depression in the
equipotential lines adjacent to the Caloosahatchee River which was attributed
to "discharge and leakage from the large concentration of artesian wells along
the river". Potentiometric data was collected in 1983 and compared to the
1974 data as shown on Figure 16. The eastward migration of the 50 foot
contour reflects the increased withdrawals from the Floridan Aquifer System by
the citrus industry in northeastern Lee County and Hendry County. However,
from Ft. Myers south along the Caloosahatchee River where plugging efforts
have been concentrated, an increase in artesian pressure is observed* This is
mainly demonstrated by the straightening of the 30 foot contour. The
depression in western Cape Coral corresponds to the reverse osmosis plant
which uses water from the Floridan for municipal supply. Several wells
monitored in Iona have shown increases in potentiometric levels up to five
feet in one year and appear to be related to well plugging activities.
Potentiometric data was collected prior to the plugging of a number of wells
in the City of Ft. Myers. The deep well inventory provided by the USGS
indicates the highest concentration of surveyed wells occurs within the City
of Ft. Myers. As the City of Ft. Myers joined the plugging program in 1982,
only a small percentage of the wells in that area have been plugged. It is
anticipated that continued plugging efforts within the City limits will result
in increases in the potentiometric surface in this area also.
-72-

-73-

RECOMMENDATIONS
Further investigations into the life expectancy of steel casings should
be undertaken with respect to regulating wells currently exempt from
requirements of cement grouting (cable tool drilling with driven
casings).
Detailed investigations pertaining to the occurrence of structural offset
beds in pre-Miocene sediments should be undertaken prior to consideration
of deep well injection sites in Lee County. Such investigations should
conclusively define the nature of the offsets (faulting of folding) as
well as establishing their vertical and areal extent.
Funding should be provided to develop and institute remote sensing
techniques such as thermal infrared photo imagery to locate free flowing
wells in remote areas.
Data collection from existing water quality monitoring networks should be
continued to further quantify the recovery rates. Additional monitoring
should be established in areas where plugging activities have been
maximized. Applications of surface geophysical methods should be
examined as an inexpensive method of monitoring the location and
dissipation of saline contamination in shallow aquifers.
This type of program is beneficial to groundwater resources and should be
expanded to other counties in the District. Funding should be
substantially subsidized by the land owners, municipal governments, or
state agencies on a cooperative basis. As hydrogeologic conditions vary
throughout the District, site specific geophysical data should continue
to be obtained to provide the basis for plugging designs.
The South Florida Water Management District should encourage county
governments to draft zoning ordinances which require the appraisal and
plugging of all flowing wells on properties prior to zoning changes
and/or development.

7. County governments should be encouraged to develop inventories of free
flowing wells within their boundaries. These inventories should be
prioritized to achieve maximum benefit from limited budgeting. Wells
should be categorized on the basis of discharge rate, salinity, degree of
maintenance and proximity to municipal wellfields or potable sources.
-75-

REFERENCES
Boggess, D. H., 1973. The Effects of Plugging a Deep Artesian Well on the Concentration of Chloride in Water in the Water Table Aquifer at Highland Estates, Lee County, Florida: I). S. Geological Survey Open File Report73003, 20 p.
Boggess, D. H., 1974. Saline Groundwater Resources in Lee County, Florida: U. S. Geological Survey Open File Report 74-247, 62 p.
Boggess, D. H., Missimer, T. M., and O'Donnell, T. H., 1977. Saline-water intrusion related to well construction in Lee County, Florida: U. S.Geological Survey Water-Resources Investigations 77-33, 29 p.
Brown, M, P. and Reece, D. E., 1979. Hydrogeologic Reconnaissance of the Floridan Aquifer System, Upper East Coast Planning Area: South FloridaWater Management District, Technical Map Series 79-1.
Brown, M. P., Hynes, S. D., and Wedderburn, L. W., 1981. Guidebook to the SFWMD's geophysical logging and digitized data processing techniques: South Florida Water Management District, Technical Memorandum, 112 p.
Camp, Dresser, and McKee, 1980. Dixie Well Field Stress Analysis, 56 p.
Clarke, F. £., 1980. Corrosion and encrustation in water wells: Food andAgriculture Organization Irrigation and Drainage Paper No. 34, 95 p.
Fitzpatrick, D.J., 1982. Hydrologic Data from Monitoring of Saline-WaterIntrusion in the Cape Coral Area, Lee County, Florida: U.S. Geological Survey Open File Report 82-772, 48 p.
Halliburton Cementing Tables, 1975. Halliburton Services Incorporated, Duncan Okla., 485 p.
Healy, H. G., 1978. Appraisal of uncontrolled flowing artesian wells in Florida: U. S. Geological Survey Water-Resources Investigations 78-95,26 p.
Hendry, C. W., Jr., and Lavender, J. A., 1959. Final report on an inventory of flowing artesian wells in Florida: Florida Geological SurveyInformation Circular 21, 30 p.
Klein, H., Schroeder, M. C., and Lichtler, W. F., 1964. Geology andground-water resources of Glades and Hendry Counties, Florida: FloridaGeological Survey Report of Investigations 37, 101 p.
Langelier, W. F., 1936. the analytical control of anticorrosion watertreatment: Journal of American Water Works Association, Vol. 28, No.
Lewis, R.F., 1965. Control of sulfate-reducing bacteria, Journal of American Water Works Association, Vol. 57, No. 8, August, 5 p.
McWhorter, D.B., and Sunada, D. K., 1981. Ground-water Hydrology andHydraulics: Water Resources Publications, 287 p.
-76-

Mercer, J.W., Thomas, S. D., and Ross, B., 1982. Parameters and Variables Appearing in Repository Siting Models, NUREG/CR3066: Prepared for the Nuclear Regulatory Commission, 244 p.
Missimer, T. M. and Gardner, R. A., 1976. High Resolution Seismic Reflection Profiling for Mapping Shallow Aquifers in Lee County, Florida: U. S.Geological Survey Water-Resources Investigations 76-45.
Missimer, T. M., 1978. The Tamiami Formation - Hawthorn Formation Contact in Southwest Florida: Florida Scientist, Vol. 41, No. 1, 33-39 p.
Missimer and Associates, Inc., February, 1979. Hydrologic Investigation ofthe Hawthorn and Suwannee Aquifer System in the Central Area, Sanibel, Florida: Prepared for the Island Water Association, Inc.
Munch, D. A., 1978. Improvement of water quality through a cooperative well plugging program: St. Johns River Water Management District, InformationCircular NO. 2, 18 p.
Post, Buckley, Shuh, and Jernigan, Inc., 1978. Hydrology and Geology of aProposed New Wellfield Site in South Lee County, Florida.
Ryznar, J. W., 1944. A new index for determining amount of calcium carbonate scale formed by a water: Journal of American Water Works Association,Vol. 35, No. 472-486, 15 p.
Shaw, J. E. and Trost, S. M., 1984. Hydrogeology of the Kissimmee Planning Area: South Florida Water Management District, Technical Publication 84-1 in print.
Smith, S. Sulfur bacterial problems revisited, Water Well Journal, Vol. 36, No. 2, February 1982.
Sproul, C. R., Boggess, D. H., and Woodward, H. J., 1972. Saline-waterintrusion from deep artesian sources in the McGregor Isles area of LeeCounty, Florida: Florida Department of Natural Resources, Bureau ofGeology, Information Circular 75, 30 p.
Tanner, W. F., 1965. The Origin of the Gulf of Mexico: Gulf CoastAssociation of Geological Society Trans., Vol. 15.
Waller, B. G., 1982. Areal extent of a plume of mineralized water from a flowing artesian well in Dade County, Florida: U. S. Geological SurveyWater-Resources Investigations 82-20, 20 p.
Wedderburn, L. A., Knapp, M. S., Waltz, D. P., and Burns, W. S., 1982.Hydrogeologic Reconnaissance of Lee County, Florida: South Florida WaterManagement District, Technical Publication 82-1, 192 p.
-77-


APPENDIX I
Well Locations and Selected Data From the
South Florida Water Management District's
Deep Well Plugging Program


C H A R LO TTE CO U N TY
INSERT B

INSERT C

GULF OF MEXICO
