welcome by summit host: "state of the industry"
TRANSCRIPT

@JackMyerscom
Welcome By Summit Host
“State of the Industry”
Jack Myers
Media Ecologist / Chairman
MyersBizNet

Full Contents Copyright 2014 Jack Myers.
May not be copied or redistributed without written permission.
TWEET: @jackmyerscom
http://www.magazine.org/sites/default/files/
styles/event-sub-section/public/IMAG-14-
logo-v2ff-B.jpg?itok=T_E8b6H3


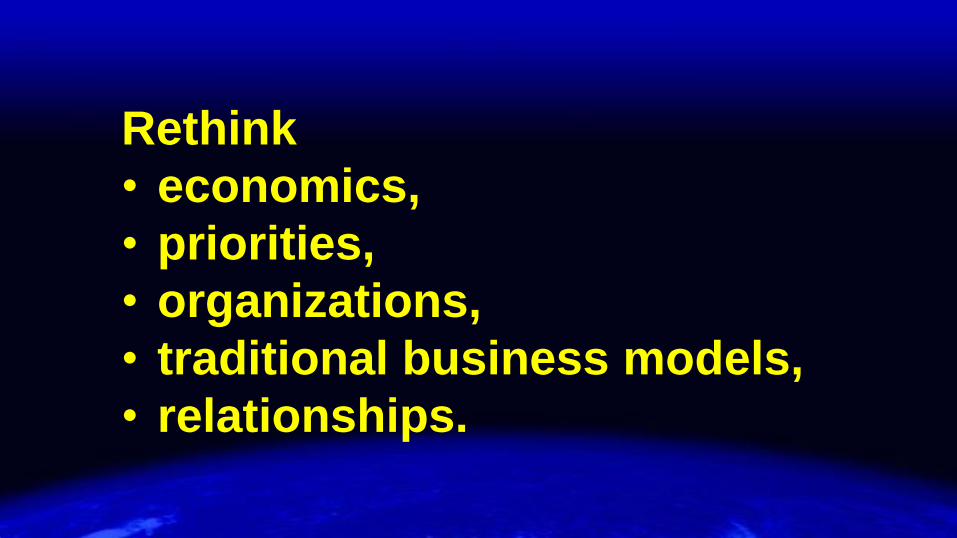
Rethink
• economics,
• priorities,
• organizations,
• traditional business models,
• relationships.

Agencies’ drive toward programmatic
and automated transactions ...
Marketers’ growing emphasis on
engagement, activation and content
association.

Video Advertising (Billions)
DEMAND
2010 $ 73.7 B
2014 $ 81.5 B* +5.2%
2016 $ 89.5 B* 2020 $107.0 B* * Estimated Source: Jack Myers Media Business Report
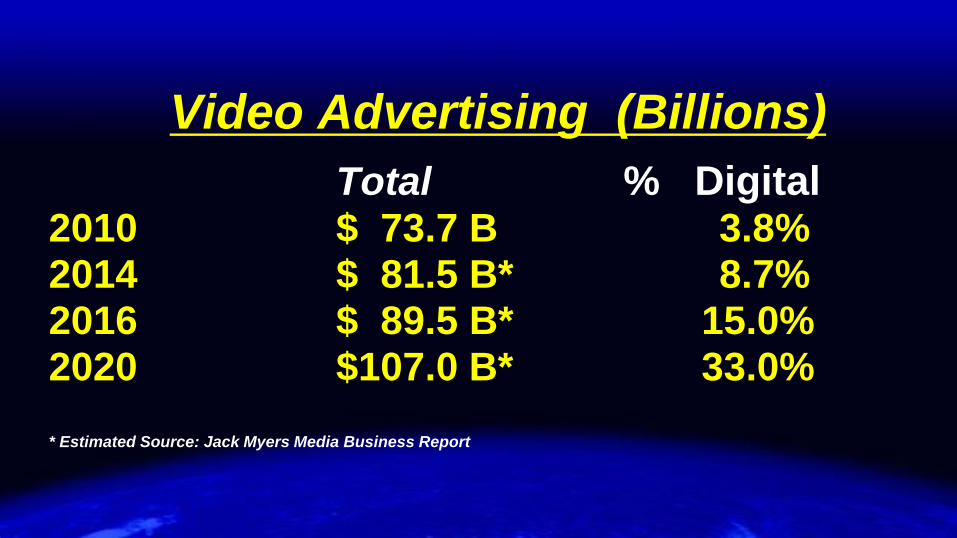
Video Advertising (Billions)
Total % Digital 2010 $ 73.7 B 3.8% 2014 $ 81.5 B* 8.7% 2016 $ 89.5 B* 15.0% 2020 $107.0 B* 33.0% * Estimated Source: Jack Myers Media Business Report

Mobile Advertising (Billions)
Total
2010 $ 914 M
2014 $ 6.6 B* +36% 2016 $ 14.4 B*
2020 $ 26.2 B* * Estimated Source: Jack Myers Media Business Report

Social Marketing-WOM (Billions)
2010 $ 1.2 B
2014 $ 6.2 B* +30%
2016 $ 11.0 B*
2020 $ 24.5 B* • Estimated Source: Jack Myers Media Business Report
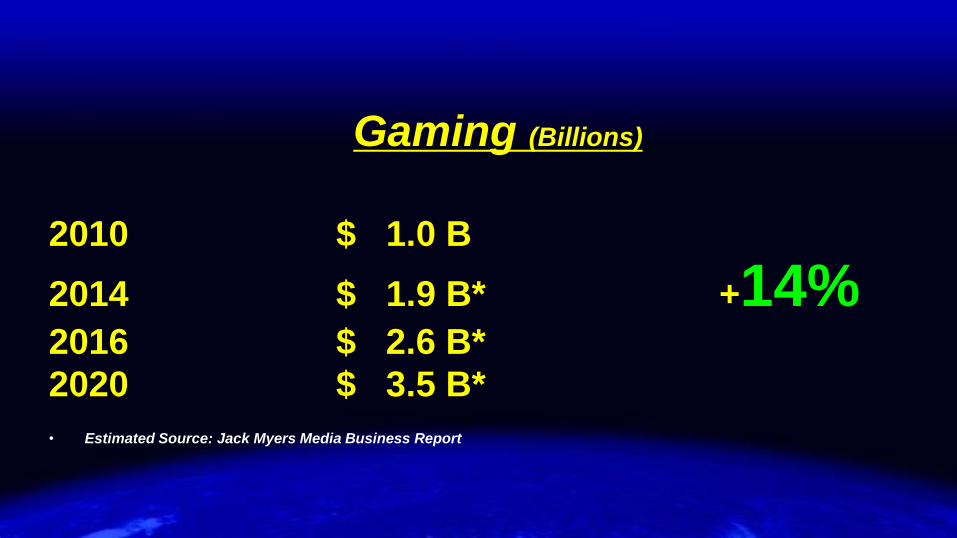
Gaming (Billions)
2010 $ 1.0 B
2014 $ 1.9 B* +14%
2016 $ 2.6 B*
2020 $ 3.5 B* • Estimated Source: Jack Myers Media Business Report
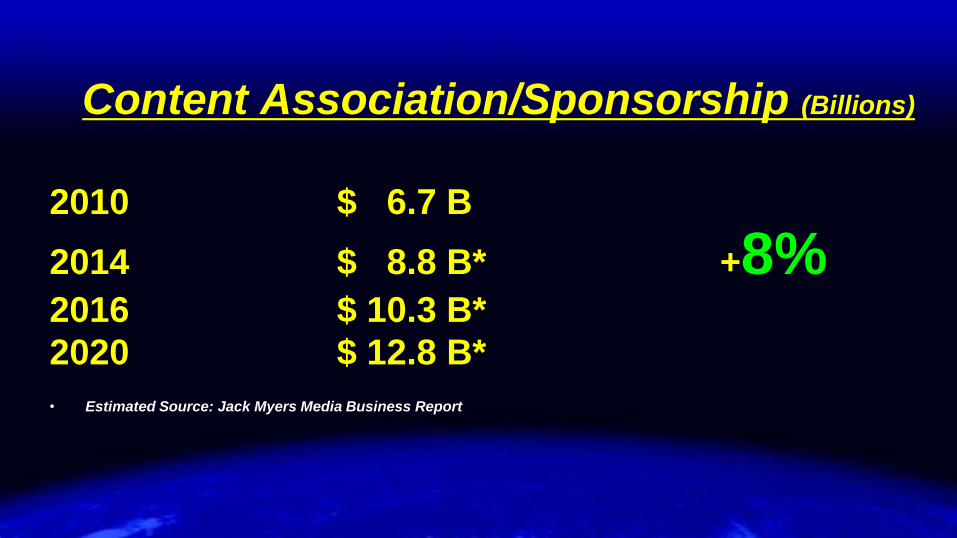
Content Association/Sponsorship (Billions)
2010 $ 6.7 B
2014 $ 8.8 B* +8%
2016 $ 10.3 B*
2020 $ 12.8 B* • Estimated Source: Jack Myers Media Business Report
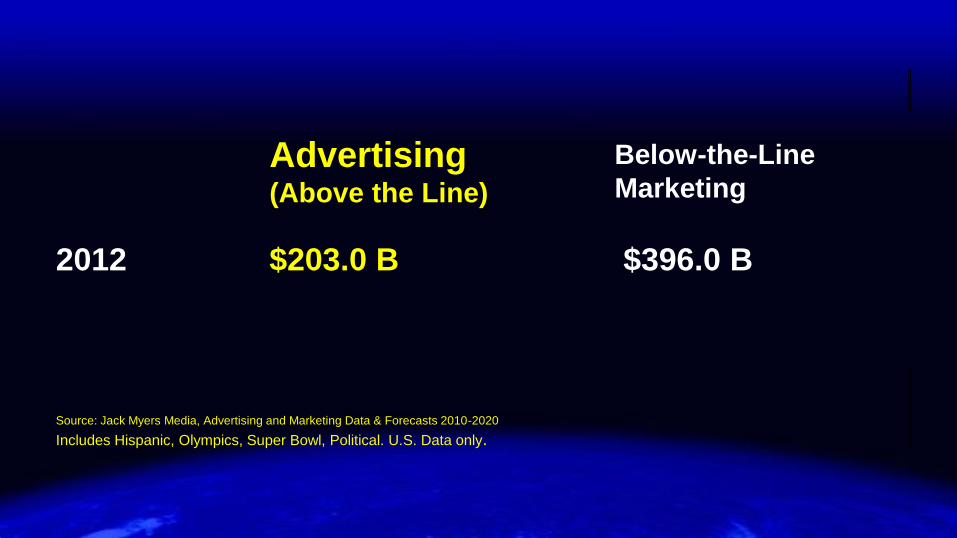
Advertising (Above the Line)
Below-the-Line
Marketing
2012 $203.0 B $396.0 B
Source: Jack Myers Media, Advertising and Marketing Data & Forecasts 2010-2020
Includes Hispanic, Olympics, Super Bowl, Political. U.S. Data only.
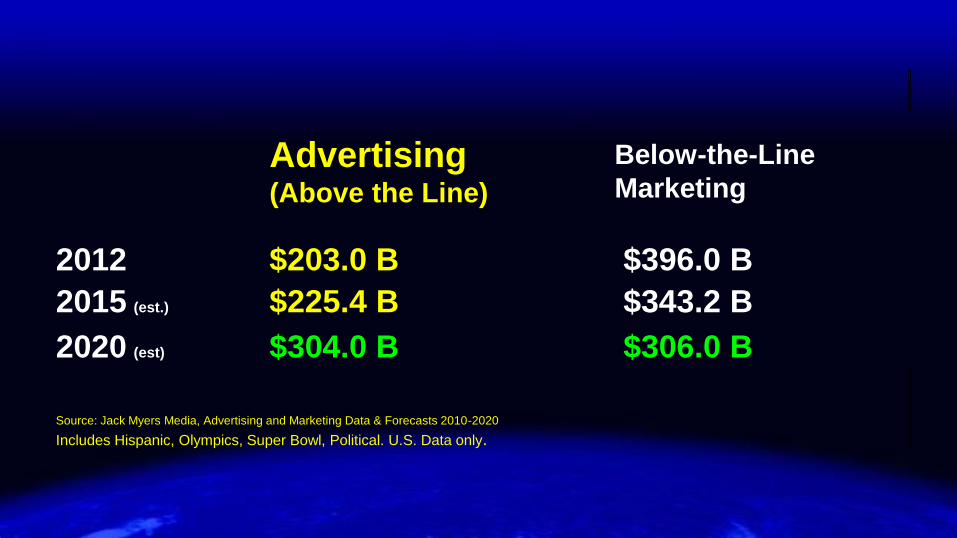
Advertising (Above the Line)
Below-the-Line
Marketing
2012 $203.0 B $396.0 B
2015 (est.) $225.4 B $343.2 B
2020 (est) $304.0 B $306.0 B
Source: Jack Myers Media, Advertising and Marketing Data & Forecasts 2010-2020
Includes Hispanic, Olympics, Super Bowl, Political. U.S. Data only.

Awareness, Reach, Frequency
Interaction
Activation
Content Association
ENGAGEMENT

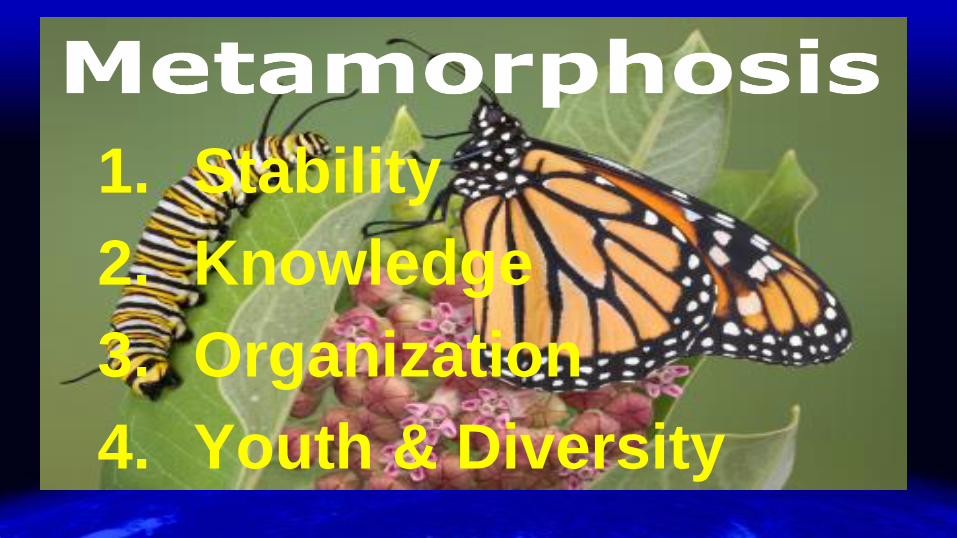
1. Stability
2. Knowledge
3. Organization
4. Youth & Diversity
Full Contents Copyright 2014 Jack Myers.
May not be copied or redistributed without written permission.
@jackmyerscom