weekly october 3, 2003 / vol. 52 / no. 39 · weekly october 3, 2003 / vol. 52 / no. 39 department...
TRANSCRIPT

Morbidity and Mortality Weekly Report
Weekly October 3, 2003 / Vol. 52 / No. 39
depardepardepardepardepartment of health and human sertment of health and human sertment of health and human sertment of health and human sertment of health and human servicesvicesvicesvicesvicesCenters for Disease Control and PreventionCenters for Disease Control and PreventionCenters for Disease Control and PreventionCenters for Disease Control and PreventionCenters for Disease Control and Prevention
INSIDE
937 Follow-Up of Deaths Among U.S. Postal ServiceWorkers Potentially Exposed to Bacillus anthracis —District of Columbia, 2001–2002
938 Recognition of Illness Associated With Exposure toChemical Agents — United States, 2003
941 West Nile Virus Activity — United States, September 25–October 1, 2003
941 Notices to Readers
Cardiac Deaths After a Mass Smallpox Vaccination Campaign —New York City, 1947
During the first wave of the 2003 smallpox vaccination cam-paign, two ischemic cardiac deaths occurred in civilianvaccinees aged 55 and 57 years, and one occurred in a mili-tary vaccinee aged 55 years, 4–17 days after vaccination withthe New York City Board of Health (NYCBOH) vacciniastrain (1–3). Whether these and 13 other recognized militaryand civilian nonfatal ischemic events among vaccinees wereassociated with smallpox vaccination is unclear. The sameNYCBOH strain was used in 1947 to vaccinate approximatelysix million New York City (NYC) residents (80% of the popu-lation) during a 4-week period (April 4–May 2) after a small-pox outbreak (Figure 1). To determine whether smallpoxvaccination increased the risk for cardiac death in 1947, theNYC Department of Health and Mental Hygiene (DOHMH)analyzed data from NYC death certificates during that period.This report summarizes the results of that analysis, whichfound no increases in cardiac, atherosclerotic, or all-causedeaths. The findings are consistent with a growing body ofevidence suggesting that ischemic cardiac deaths observedafter the 2003 campaign might have been unrelated to vaccine.
In April 2003, data were extracted from NYC death certifi-cates filed during March–June 1947 and from the sameperiod in 1946 and 1948 (N = 81,529). DOHMH estimatedthe relative risk for cardiac deaths in the period after vaccina-tion compared with other periods, adjusting for secular trends.The number of adults vaccinated on each of the 29 days ofthe vaccination campaign was estimated by using DOHMHrecords and articles from local newspapers and magazines (4).Death certificates issued in NYC during March–June in 1946–1948 were obtained from the NYC Municipal Archives. Dateof death, age of decedent, and primary and other cause-of-death data (classified according to the International Classifica-tion of Diseases, Fifth Revision [ICD-5] codes) were abstractedfrom all records. Causes of death were defined as cardiac if the
FIGURE 1. New York City residents line up for vaccinationsduring a smallpox vaccination campaign — New York City, 1947
Photo/Associated Press
ICD-5 codes for primary or other cause included pericarditis(090), acute endocarditis (091), chronic endocarditis (092),myocardial disease (093), coronary artery diseases (094), orother disease of the heart (095). Certificates with illegible pri-mary cause-of-death codes (0.6% of records) were excluded.

934 MMWR October 3, 2003
SUGGESTED CITATIONCenters for Disease Control and Prevention. [ArticleTitle]. MMWR 2003;52:[inclusive page numbers].
Centers for Disease Control and Prevention
Julie L. Gerberding, M.D., M.P.H.Director
Dixie E. Snider, M.D., M.P.H.(Acting) Deputy Director for Public Health Science
Donna F. Stroup, Ph.D., M.Sc.(Acting) Associate Director for Science
Epidemiology Program Office
Stephen B. Thacker, M.D., M.Sc.Director
Office of Scientific and Health Communications
John W. Ward, M.D.Director
Editor, MMWR Series
Suzanne M. Hewitt, M.P.A.Managing Editor, MMWR Series
David C. Johnson(Acting) Lead Technical Writer/Editor
Jude C. RutledgeTeresa F. Rutledge
Jeffrey D. Sokolow, M.A.Writers/Editors
Lynda G. CupellMalbea A. Heilman
Visual Information Specialists
Kim L. Bright, M.B.A.Quang M. Doan, M.B.A.
Erica R. ShaverInformation Technology Specialists
Division of Public Health Surveillanceand Informatics
Notifiable Disease Morbidity and 122 Cities Mortality DataRobert F. Fagan
Deborah A. AdamsFelicia J. ConnorLateka DammondDonna Edwards
Patsy A. HallPearl C. Sharp
The MMWR series of publications is published by theEpidemiology Program Office, Centers for Disease Controland Prevention (CDC), U.S. Department of Health andHuman Services, Atlanta, GA 30333.
Approximately 6.4 million NYC residents were vaccinatedduring April 4–May 2, 1947 (4) (Figure 2), including an esti-mated 500,000–1,000,000 persons each day during the peak5 days of the vaccination campaign (April 17–21). The puta-tive high-risk period for cardiac death was an estimated 4–17days after vaccination, corresponding to the range of onsetdates of cardiac events observed during the 2003 campaign.On the basis of these estimates, 2-week and 4-week risk peri-ods were identified.
Daily mortality rates during the postvaccination risk peri-ods were compared with rates during other periods. Countsof cardiac deaths were modeled by using Poisson regressionanalysis, adjusting for a long-term temporal trend during1946–1948 and a seasonal trend during March–June each year.
Of the 81,010 legible records available, 39,150 (48%) listedcardiac disease and 9,112 (11%) specified coronary artery oratherosclerotic disease as a cause of death. Counts of cardiacdeaths ranged from 72 to 149 deaths per day during the studyperiod (Figure 3). The difference in the rate of cardiacdeaths was not statistically significant during the 2-weekrisk period compared with other periods among persons aged50–64 years (rate ratio: 1.05; 95% confidence interval [CI] =0.95–1.15) or among all adults (rate ratio: 1.01; 95% CI =0.95–1.07) (Table). Similarly, no statistically significantincreases in risk were observed in all-cause deaths, atheroscle-rotic deaths, or deaths caused by myo/pericarditis during the4-week risk period compared with other periods.Reported by: T Frieden, F Mostashari, SP Schwartz, New York CityDept of Health and Mental Hygiene, New York. LE Thorpe, Div ofAdult Community Health, National Center for Chronic DiseasePrevention and Health Promotion; AM Karpati, Epidemiology ProgramOffice; MA Marx, SE Manning, EIS officers, CDC.
Editorial Note: The findings in this report indicate that inci-dence of cardiac deaths did not increase after the 1947 masssmallpox vaccination campaign in NYC. The large numberand proportion of persons vaccinated in a short time permit-ted a focused assessment of cardiac deaths after vaccination.These results suggest that cardiac deaths observed in 2003might have been unrelated to smallpox vaccination. However,factors that could limit the applicability of the 1947 studyresults to the 2003 vaccination campaign include 1) changesin characteristics or administration of the vaccine, 2) changesin population distribution of cardiac risk factors, and3) differences in the vaccination and smallpox infectionhistory (i.e., immunity status) of vaccine recipients in the twoperiods.
Both campaigns used the same NYCBOH vaccinia strain.Although long-term storage might have resulted in antigenicshift of the vaccine, DNA viruses such as vaccinia arenot prone to antigenic variability (5). Both campaigns

Vol. 52 / No. 39 MMWR 935
administered the vaccine intradermally. In 1947, vaccinatorsused various multiple-pressure techniques; the 2003 techniqueinvolved multiple punctures with a bifurcated needle to ad-minister the vaccine. Both campaigns used a vaccine that con-tained a mixture of lymph and other components. Before 1960,the vaccine consisted of wet glycerinated lymph (with a titerof >106 plaque-forming units [pfu]/mL) composed of 50%glycerine and 50% calf lymph (6). Currently, lyophilizedNYCBOH vaccinia containing calf lymph is mixed with adiluent containing polymixin B, streptomycin, chlortetracy-cline, and neomycin to a titer of >108 pfu/mL. However, noevidence has been found to indicate that these changes wouldlead to increases in cardiac adverse events after vaccination.
Each of the 2003 vaccinees with cardiac fatalities had mul-tiple risk factors for cardiac disease, including hypertension,hyperlipidemia, and smoking, and each had been vaccinatedfor smallpox in childhood. If risk factors for cardiac deathwere more prevalent in 2003 than in 1947, the number ofcardiac-associated deaths probably would be greater among2003 campaign vaccinees than among those in 1947. How-ever, the prevalence of these three risk factors and cardiacmortality rates was substantially higher in 1947 than in 2003(7,8). In addition, the 1947 vaccination campaign encour-aged residents to participate regardless of health status, whereasthe first wave of the 2003 campaign targeted only military,health-care, and emergency response professionals, all of whomwere screened for noncardiac health problems andcontraindications to vaccination.
If a greater proportion of those vacci-nated in 1947 were revaccinees comparedwith those vaccinated in 2003, and ifprevious vaccination reduced the risk forsubsequent cardiac mortality, the 1947findings would underestimate the risk forcardiac death after vaccination in 2003.However, nearly all of the 2003 civilianvaccinees were born before 1971, whenchildhood smallpox vaccination was rou-tine in the United States, and would havereceived the smallpox vaccine onceduring childhood.
This was an ecologic study; data aboutindividual vaccination status for the1947 population were unavailable. How-ever, approximately 80% of the NYCpopulation was vaccinated during the1947 campaign. Although the 20% whowere not vaccinated during the campaignmight have differed systematically fromthe general population, any bias prob-
ably would not be substantial enough to alter the results ofthis study qualitatively.
Myo/pericarditis after smallpox vaccination has beendescribed previously (9) and has been observed in both civil-ians and military personnel vaccinated during the 2003 cam-paign. However, autopsy findings indicate that the 2003cardiac deaths were linked not to myo/pericarditis but directlyto ischemic events (2). In contrast to studies of inflammatorycomplications, few data support the association of ischemiccardiac adverse events with smallpox vaccination. Only onecase series was found describing the experience of eight Frenchvaccinees (of 12 million) aged 53–83 years who experiencedacute ischemic events after smallpox vaccination, five of whomdied (10).
Smallpox vaccination is recommended for military person-nel and civilian first responders without contraindications whoare identified as part of terrorism preparedness and first-response teams. New screening guidelines have been institutedto minimize potential ischemic risks by excluding persons withknown cardiac disease or three or more cardiac risk factors.Although this study casts doubt on the causal link betweendeath caused by cardiac adverse events and smallpox vaccina-tion, in the absence of a smallpox outbreak, all potential vol-unteers should be screened for risk factors, and those at highrisk for adverse reactions to vaccination should be excluded.
FIGURE 2. Number of adult smallpox vaccination doses administered and number ofcardiac deaths in estimated risk period for fatal cardiac adverse events — New YorkCity, March–June 1947
0
20
40
60
80
100
120
140
160
Date
Adult vaccine doses administered (estimated)No. cardiac deaths during other periodsNo. cardiac deaths during the 2-week risk period
Campaignbegins
No.
card
iac
deat
hs
No. doses (in thousands)
1,000
900
800
700
600
500
400
300
200
100
0
Mar Apr May Jun
1 8 15 22 29 5 12 19 26 3 10 17 24 31 7 14 21 28

936 MMWR October 3, 2003
TABLE. Rate ratios of cardiac deaths comparing postvaccination periods with reference periods*, by outcome — New York City,March–June 1946–1948Outcome (ICD-5† code) Postvaccination period Rate ratio (95% CI§)
All cardiac deaths (090–095) April 22–May 5 (2-week) 1.01 (0.96–1.07)Persons aged 50–64 years 1.05 (0.95–1.15)
Atherosclerotic cardiac deaths (094) April 22–May 5 (2-week) 1.06 (0.97–1.16)Persons aged 50–64 years 1.00 (0.86–1.15)
Myo/pericarditis deaths (090, 093) April 22–May 5 (2-week) 1.00 (0.94–1.07)All deaths April 22–May 5 (2-week) 1.00 (0.97–1.04)All cardiac deaths (090–095) April 16–May 13 (4-week) 0.99 (0.95–1.04)
* All models are adjusted for long-term temporal and seasonal trends.†
International Classification of Diseases, Fifth Revision.§
Confidence interval.
AcknowledgmentsThis report is based on contributions by data entry staff, D Nash,
New York City Dept of Health and Mental Hygiene; Public HealthLibrary; Bur of Management Information Systems; Bur of VitalStatistics and Vital Records; New York City Dept of Records andInformation Svcs; BS Chang, New York. DA Henderson, JohnsHopkins Bloomburg School of Public Health, Baltimore, Maryland.M Kulldorf, Div of Epidemiology and Biostatistics, Dept ofCommunity Medicine and Health Care, Univ of ConnecticutHealth Center, Farmington, Connecticut. JM Lane, Atlanta,Georgia. J Grabenstein, U.S. Army Surgeon General’s Office.Smallpox Vaccination and Adverse Events Team; NationalImmunization Program Cardiac Investigation Task Force, R Chen,S Chu, W Orenstein, National Immunization Program; D Stroup,J Livengood, Office of Science Policy and Technology Transfer;S Zaza, Epidemiology Program Office; L Neff, R Schreiber, Div ofAdult Community Health, National Center for Chronic DiseasePrevention and Health Promotion, CDC.
References1. CDC. Cardiac adverse events following smallpox vaccination—United
States, 2003. MMWR 2003;52:248–50.2. CDC. Update: adverse events following smallpox vaccination—United
States, 2003. MMWR 2003;52:278–82.3. CDC. Update: cardiac-related events during the civilian smallpox vac-
cination program—United States, 2003. MMWR 2003;52:492–6.4. Weinstein I. An outbreak of smallpox in New York City. Am J Public
Health 1947;37:1347–84.5. Wittek R. Vaccinia virus. In: Webster RG, Granoff A, eds. Encyclope-
dia of Virology, Vol. 3. London, England: Academic Press, 1994.6. CDC. Smallpox vaccine. Available at http://www.bt.cdc.gov/agent/
smallpox/training/aeworkshop/smallpox-vaccine.pdf.7. Mosterd A, D’Agostino RB, Silbershatz H, et al. Trends in prevalence
of hypertension, antihypertensive therapy, and left-ventricular hyper-trophy from 1950 to 1989. N Engl J Med 1999;340:1221–7.
8. CDC. Health, US, 2002 with chartbook on trends in the health ofAmericans. Hyattsville, Maryland: U.S. Department of Health andHuman Services, CDC, National Center for Health Statistics, 2002.
9. Dalgaard JB. Fatal myocarditis following smallpox vaccination. AmHeart J 1957;54:156–7.
10. Mathieu L, Hadot S, Hadot E, Vincent J, Hueber E. Smallpox vacci-nation and acute coronary thrombosis. Arch Mal Coeur 1953;48:802–6.
FIGURE 3. Number of daily cardiac deaths during risk periodscompared with other periods — New York City, March–June1946–1948
0
20
40
60
80
100
120
140
160
Date
Cardiac deaths during2-week risk period
1946 1947 1948
JunMayAprMar JunMayAprMar JunMayAprMar
Num
ber

Vol. 52 / No. 39 MMWR 937
Follow-Up of Deaths Among U.S.Postal Service Workers Potentially
Exposed to Bacillus anthracis —District of Columbia, 2001–2002
In October 2001, two letters contaminated with Bacillusanthracis spores were processed by mechanical and manualmethods at the U.S. Postal Service (USPS) Brentwood MailProcessing and Distribution Center in the District of Colum-bia. Four postal workers at the Brentwood facility became illwith what was diagnosed eventually as inhalational anthrax;two died. The facility was closed on October 21, andpostexposure prophylaxis was recommended for approximately2,500 workers and business visitors (1). Subsequent reportsof deaths of facility workers prompted concern about whethermortality was unusually high among workers, perhaps relatedto the anthrax attacks. To evaluate the rates and causes of deathamong workers at the Brentwood facility during October 12,2001–October 11, 2002, CDC, in collaboration with stateand local health departments, analyzed death certificate data.In addition, these data were compared with aggregate mortal-ity data from the five USPS facilities contaminated withB. anthracis during the fall 2001 anthrax attacks. This reportsummarizes the results of that analysis, which indicate thatrates and causes of death among Brentwood workers duringthe 12 months after the anthrax attacks of 2001 were notdifferent from rates and causes of deaths that occurred duringthe preceding 5 years.
Deaths among Brentwood workers were identified throughreview of death certificates, which were obtained from theUSPS Office of Personnel Management, the District ofColumbia Health Department, and state health departmentsin Maryland and Virginia. Cause-specific deaths were com-pared with actuary/mortality tables from the National Centerfor Health Statistics. Aggregate mortality data for the five USPSfacilities were obtained from the USPS Human ResourcesManagement. Death rates for each USPS fiscal year were cal-culated by dividing the total number of deaths occurring atthe respective facility by the number of USPS personnelassigned to that facility as of October 12, 2001. For each con-taminated postal facility, a general linear model was used tocompare death rates during the 5 years preceding the studyperiod with the death rate during the study period.
During the study period, 2,646 persons were employed atthe Brentwood facility; 2,434 (92%) were black, and 1,496(57%) were male. A total of 11 deaths occurred among facil-ity workers during this period, excluding the two deathsresulting from known inhalational anthrax (Table 1); deathsoccurred during eight of 12 months. Of the 11 deaths, 10(91%) were among blacks, and four (36%) were among
female workers; these proportions were not statistically differ-ent from the expected proportion of deaths in this popula-tion. The median age of workers at death was 56 years (range:43–65 years) for both males and females, compared with themedian worker age of 52 years (range: 25–75 years). Six (55%)deaths resulted from heart disease, two (18%) from malig-nant neoplasm, two (18%) from liver disease, and one fromsepticemia after a prolonged coma resulting from a cerebrovas-cular accident. On the basis of comparisons with U.S. mor-tality data (2), the rates of these causes of death amongBrentwood workers during the study period did not differfrom the rates for expected causes of death for the U.S. popu-lation, adjusted for age and race. Although annual death ratesfor workers from the five contaminated USPS facilities var-ied, consistent with differences in demographics, no statisti-cally significant differences were observed between death ratesduring the study period and those during the 5 years preced-ing the study period (Table 2).Reported by: K Berry, MD, S Colvin, MD, District of ColumbiaHealth Dept. D Blythe, MD, Maryland State Dept of Health.RB Stroube, MD, CD Woolard, PhD, B Essex, Virginia Dept of Health.EA Bresnitz, MD, New Jersey Dept of Health. JA Hayslett, PharmD,PM Dull, MD, EAS Whitney, MPH, DB Reissman, MD, TH Taylor,Jr., MS, B Plikaytis, MSc, N Rosenstein, MD, B Perkins, MD, DAAshford, DVM, R Pinner, MD, National Center for Infectious Diseases,CDC.
Editorial Note: The findings in this report suggest that therates and causes of death among workers of the Brentwoodmail facility during the 12 months after the anthrax attacks of2001 were not different from those expected for this popula-tion. Although death certificate data might be subject tomisclassification (3,4), the listed causes of death for the 11workers do not raise suspicion of anthrax or mortality causedby adverse drug reactions.
TABLE 1. Age, sex, race, and cause of death of U.S. PostalService workers* at the Brentwood Mail Processing andDistribution Center — District of Columbia, October 12, 2001–October 11, 2002Age at death (yrs) Sex Race Cause of death
43 Male Black Heart disease51 Female White Cancer53 Female Black Cancer55 Male Black Heart disease55 Male Black Heart disease59 Female Black Heart disease59 Male Black Heart disease59 Male Black Heart disease62 Male Black Liver disease62 Female Black Liver disease65 Male Black Septicemia
* N = 11; excludes two previously known deaths resulting from inhalationalanthrax.

938 MMWR October 3, 2003
If another anthrax attack were to occur, prevention of deathswould probably depend on heightened surveillance and rapiddiagnostics to identify an attack and prompt prophylaxis withantibiotics and vaccination. Three types of surveillance areneeded: 1) pre-event surveillance systems to detect the initialcase of anthrax, which signals a new outbreak or release;2) event surveillance to focus on continuous case-finding; and3) postevent surveillance to identify any cases that might havebeen missed and morbidity and mortality associated with treat-ment or prophylaxis. In each stage of surveillance, the goals,priorities, and methods differ. Evaluation of unexplaineddeaths is an ongoing surveillance initiative that is part of CDC’sEmerging Infections Program (5).
Monitoring of death rates among persons potentiallyexposed to B. anthracis spores during the anthrax attacks of2001 continues; however, the onset of anthrax disease 2 yearsafter the exposures is unlikely. Through December 2003,CDC, in collaboration with federal, state, and local partners,will continue to assess mortality among postal workers poten-tially exposed to B. anthracis at the USPS facilities and rates ofadverse events among all 10,000 persons for whom >60 daysof postexposure prophylaxis was recommended (6).References1. Dewan PK, Fry AM, Laserson K, et al. Inhalational anthrax outbreak
among postal workers, Washington, DC, 2001. Emerg Infect Dis2002;8:1066–72.
2. CDC. National Vital Statistics Report 2002;50(16):1–86.3. Lloyd-Jones DM, Martin DO, Larson MG, Levy D. Accuracy of death
certificates for coding coronary heart disease as the cause of death. AnnIntern Med 1998;129:1020–6.
4. Sington JD, Cottrell BJ. Analysis of the sensitivity of death certificatesin 440 hospital deaths: a comparison with necropsy findings. J ClinPathol 2002;55:499–502.
5. Hajjeh RA, Relman D, Cieslak PR, et al. Surveillance for unexplaineddeaths and critical illnesses due to possibly infectious causes, UnitedStates, 1995–1998. Emerg Infect Dis 2002;8:145–52.
6. CDC. Evaluation of postexposure antibiotic prophylaxis to preventanthrax. MMWR 2002;51:59.
TABLE 2. Number* of U.S. Postal Service (USPS) workers and death rates†, by USPS facility and fiscal year§ — United States,1997–2002Facility No. 1997 1998 1999 2000 2001 2002 p value
Brentwood P&DC¶, Washington, D.C. 2,646 4.54 6.80 3.78 4.54 2.65 4.16 0.86Southern New Jersey P&DC, Bellmawr, New Jersey 714 7.00 5.60 4.20 7.00 4.20 2.80 0.14Trenton P&DC, Trenton, New Jersey 963 3.12 2.08 4.15 2.08 3.12 4.15 0.26Morgan P&DC, New York City, New York 4,662 3.70 3.04 2.83 1.96 2.83 2.39 0.52Southern Connecticut P&DC, Wallingford, Connecticut 1,724 2.32 1.16 0.58 0 1.16 1.74 0.50
* As of October 2002.†
Per 1,000 workers.§
USPS fiscal year is approximately October–September (varies slightly by year).¶
Processing and distribution center.
Recognition of Illness AssociatedWith Exposure to Chemical Agents —
United States, 2003Since September 11, 2001, concern has increased about
potential terrorist attacks involving the use of chemical agents.In addition, recent cases involving intentional or inadvertentcontamination of food with chemicals have highlighted theneed for health-care providers and public health officials tobe alert for patients in their communities who have signs andsymptoms consistent with chemical exposures (1–3). Forexample, in February 2003, a Michigan supermarket workerwas charged with intentionally contaminating 200 lbs. of meatwith a nicotine-containing insecticide (3). Althoughintentional release of chemical agents might be an overt event(i.e., one whose nature reveals itself ), such as release of a nerveagent in a subway or a large explosion of a chemical container,a chemical release might instead be a covert event (i.e., anunrecognized release in which the presence of ill persons mightbe the first sign of an exposure), such as deliberate contami-nation of food, water, or a consumer product. To increase thelikelihood that health-care providers will recognize a chemi-cal-release–related illness and that public health authoritieswill implement the appropriate emergency response and pub-lic health actions, CDC identified examples of chemical-induced illness (Table) and created appropriate guidance forhealth-care providers and public health personnel. Thisreport summarizes the epidemiologic clues and clinical signsor patterns of illness that might suggest covert release of achemical agent. CDC is working to developnational surveillance capabilities for detecting chemical-release–related illnesses.
A covert release of a chemical agent might not be identifiedeasily for at least five reasons. First, symptoms of exposure tosome chemical agents (e.g., ricin) might be similar to those ofcommon diseases (e.g., gastroenteritis). Second,immediate symptoms of certain chemical exposures might benonexistent or mild despite the risk for long-term effects (e.g.,

Vol. 52 / No. 39 MMWR 939
neurocognitive impairment from dimethyl mercury, terato-genicity from isotretinoin, or cancer from aflatoxin). Third,exposure to contaminated food, water, or consumer productsmight result in reports of illness to health-care providers overa long period and in various locations. Fourth, personsexposed to two or more agents might have symptoms not sug-gestive of any one chemical agent (i.e., a mixed clinical pre-sentation). Finally, health-care providers might be less familiarwith clinical presentations suggesting exposure to chemicalagents than they are with illnesses that are treated frequently.
Epidemiologic Clues Suggesting a CovertChemical Release
Epidemiologic clues that might suggest the covert release ofa chemical agent include 1) an unusual increase in thenumber of patients seeking care for potential chemical-release–related illness; 2) unexplained deaths among young or healthypersons; 3) emission of unexplained odors by patients; 4) clus-ters of illness in persons who have common characteristics,such as drinking water from the same source; 5) rapid onsetof symptoms after an exposure to a potentially contaminatedmedium (e.g., paresthesias and vomiting within minutes of
Clinical syndrome
• Salivation, diarrhea, lacrimation, bronchorrhea,diaphoresis, and/or urination
• Miosis, fasciculations, weakness, bradycardia ortachycardia, hypotension or hypertension, alteredmental status, and/or seizures
• Seizure-like, generalized muscle contractions orpainful spasms (neck and limbs) and usuallytachycardia and hypertension
• Lip, mouth, and pharyngeal ulcerations and burningpain
• Mild: nausea, vomiting, and headache• Severe: altered mental status, dyspnea, hypoten-
sion, seizures, and metabolic acidosis
• Peripheral neuropathy signs and symptoms: muscleweakness and atrophy, “glove and stocking” sensoryloss, and depressed or absent deep tendon reflexes
• Neurocognitive effects: memory loss, delirium,ataxia, and/or encephalopathy
• Abdominal pain, vomiting, profuse diarrhea (possiblybloody), and hypotension, possibly followed bymultisystem organ failure
TABLE. Selected* clinical syndromes and potential chemical etiologiesPotential chemical etiology
• Nicotine†
• Organophosphate insecticides†
— decreased acetylcholinesterase activity• Carbamate insecticides• Medicinal carbamates (e.g., physostigmine)
• Strychnine— intact sensorium
• Paraquat†
— dyspnea and hemoptysis secondary to pulmonaryedema or hemorrhage; can progress to pulmonaryfibrosis over days to weeks
• Diquat• Caustics (i.e., acids and alkalis)• Inorganic mercuric salts• Mustards (e.g., sulfur)
• Cyanide† (e.g., hydrogen cyanide gas or sodium cyanide)— bitter almond odor§
• Sodium monofluoroacetate (SMFA)†
— hypocalcemia or hypokalemia• Carbon monoxide• Hydrogen sulfide• Sodium azide• Methemoglobin-causing agents
• Mercury (organic)†
— visual disturbances, paresthesias, and/or ataxia• Arsenic (inorganic)†
— delirium and/or peripheral neuropathy• Thallium
— delirium and/or peripheral neuropathy• Lead
— encephalopathy• Acrylamide
— encephalopathy and/or peripheral neuropathy
• Arsenic†
• Ricin†
— inhalation an additional route of exposure; severerespiratory illness possible
• Colchicine• Barium
— hypokalemia common
Category
Cholinergic crisis
Generalized muscle rigidity
Oropharyngeal pain andulcerations
Cellular hypoxia
Peripheral neuropathy and/orneurocognitive effects
Severe gastrointestinal illness,dehydration
* Not intended as a complete differential diagnosis for each syndrome or a list of all chemicals that might be used in a covert chemical release.†
Potential agents for a covert chemical release based on historic use (i.e., intentional or inadvertent use), high toxicity, and/or ease of availability.§
Unreliable sign.
940 MMWR October 3, 2003
eating a meal); 6) unexplained death of plants, fish, or ani-mals (domestic or wild); and 7) a syndrome (i.e., a constella-tion of clinical signs and symptoms in patients) suggesting adisease associated commonly with a known chemical expo-sure (e.g., neurologic signs or pinpoint pupils in eyes ofpatients with a gastroenteritis-like syndrome or acidosis inpatients with altered mental status).
Various chemical agents could be used as covert weapons,and the actual clinical syndrome will vary depending on thetype of agent, the amount and concentration of the chemical,and the route of the exposure. However, certain clinical pre-sentations might be more common with a covert chemicalrelease. Certain syndromes are associated with groups of chemi-cal agents with similar toxic properties that have been usedpreviously, have high toxicity, or are easily available (Table) (4–10).Reported by: M Patel, MD, J Schier, MD, M Belson, MD, C Rubin,DVM, P Garbe, DVM, Div of Environmental Hazards and HealthEffects; J Osterloh, MD, Div of Laboratory Sciences, National Centerfor Environmental Health, CDC.
Editorial Note: Health-care providers, public health agen-cies, and poison control centers might be the first to recog-nize illness, treat patients, and implement the appropriateemergency response to a chemical release. Familiarity withgeneral characteristics of a covert chemical release and recog-nition of epidemiologic clues and syndromic presentations ofchemical agent exposures could improve recognition of thesereleases and might reduce further morbidity and mortality.
Public health agencies and health-care providers might ren-der the most appropriate, timely, and clinically relevant treat-ment possible by using treatment modalities based onsyndromic categories (e.g., burns, respiratory depression,neurologic damage, and shock). Treating exposed persons byclinical syndrome rather than by specific agent probably isthe most pragmatic approach to the treatment of illness causedby chemical exposures.
State and local health departments should educate health-care providers to recognize unusual illnesses that might indi-cate release of a chemical agent. Strategies for responding tointentional chemical releases include 1) providing informa-tion or reminders to health-care providers and clinical labora-tories; 2) encouraging reporting of acute poisonings to localpoison control centers, which can guide patient managementand facilitate notification of the proper health agencies, andto the local or state health department; 3) initiating surveil-lance for incidents that potentially involve the covert releaseof a chemical agent; 4) implementing the capacity to receiveand investigate any report of such an event; 5) implementingappropriate protocols, including potentially accessing theLaboratory Response Network for Bioterrorism, to collect and
transport specimens and to store them appropriately beforelaboratory analysis; 6) reporting immediately to CDC andlocal law enforcement if the results of an investigation suggestthe intentional release of a chemical agent; and 7) requestingCDC assistance when necessary.
To begin developing national surveillance capabilities fordetecting chemical-release–related illnesses, CDC is collabo-rating with the American Association of Poison Control Cen-ters to use its Toxic Exposure Surveillance System to identifyindex cases, evolving patterns, or emerging clusters of hazard-ous exposures. Identification of early markers for chemicalreleases (e.g., characteristic symptom complexes, temporal andregional increases in hospitalizations, or sudden increases incase frequency or severity) will enable public health authori-ties to respond quickly and appropriately to an intentionalchemical release.
CDC materials for emergency and health-care personnel,including a list of chemical agents and biologic toxins andtheir expected clinical syndromes, are available at http://www.bt.cdc.gov/agent/agentlistchem.asp. Additional informa-tion about responding to chemical attacks is available fromthe U.S. Army Medical Research and Materiel Command athttp://www.biomedtraining.org/progmat.htm, the U.S.Army Medical Research Institute of Chemical Defense at http://ccc.apgea.army.mil, and CDC and the Agency for ToxicSubstances and Disease Registry at http://www.atsdr.cdc.gov/mhmi.html.References1. Khan AS, Swerdlow DL, Juranek DD. Precautions against biological
and chemical terrorism directed at food and water supplies. PublicHealth Rep 2001;116:3–14.
2. Buchholz U, Mermin J, Rios R, et al. An outbreak of food-borne ill-ness associated with methomyl-contaminated salt. JAMA2002;288:604–10.
3. CDC. Nicotine poisoning after ingestion of contaminated groundbeef—Michigan 2003. MMWR 2003;52:413–6.
4. Namba T, Nolte CT, Jackrel J, Grob D. Poisoning due to organophos-phate insecticides. Am J Med 1971;50:475–91.
5. Daisley H, Simmons V. Homicide by paraquat poisoning. Med SciLaw 1999;39:266–9.
6. Wolnik KA. The Tylenol tampering incident—tracing the source. AnalChem 1984;56:466–70, 474.
7. Chi CH, Chen KW, Chan SH, et al. Clinical presentation and prog-nostic factors in sodium monofluoroacetate intoxication. Clin Toxicol1996;34:707–12.
8. Nierenberg DW, Nordgren RE, Chang MB, et al. Delayed cerebellardisease and death after accidental exposure to dimethylmercury. N EnglJ Med 1998;338:1672–6.
9. Falkenrath RA, Newnan RD, Thayer BA. America’s Achilles’ Heel:Nuclear, Biological, and Chemical Terrorism and Covert Attack. Cam-bridge, Massachusetts: Massachusetts Institute of Technology Press,1998.
10. Franz DR, Jaax N. Ricin toxin. In: Sidell FR, Takafuji ET, Franz DR,eds. Medical Aspects of Chemical and Biological Warfare. Washing-ton, DC: Office of the Surgeon General, 1997.

Vol. 52 / No. 39 MMWR 941
West Nile Virus Activity —United States, September 25–
October 1, 2003This report summarizes West Nile virus (WNV) surveil-
lance data reported to CDC through ArboNET as of 3 a.m.,Mountain Daylight Time, October 1, 2003.
During the reporting week of September 25–October 1, atotal of 1,034 human cases of WNV infection were reportedfrom 27 states (Colorado, Connecticut, Georgia, Illinois, Iowa,Kansas, Maryland, Massachusetts, Michigan, Minnesota,Missouri, Montana, Nebraska, New Hampshire, New Jersey,New Mexico, New York, North Carolina, Ohio, Oklahoma,Pennsylvania, South Dakota, Tennessee, Texas, Vermont,Virginia, and Wyoming), including 22 fatal cases from 10states (Colorado, Georgia, Maryland, Michigan, Montana,Nebraska, New York, Pennsylvania, Texas, and Wyoming).During the same period, WNV infections were reported in692 mosquito pools, 549 dead birds, 306 horses, four squir-rels, two unidentified animal species, and one dog.
During 2003, a total of 5,861 human cases of WNV infec-tion have been reported from Colorado (n = 1,991), Nebraska(n = 999), South Dakota (n = 840), Texas (n = 335), Wyo-ming (n = 313), Montana (n = 207), New Mexico (n = 174),North Dakota (n = 148), Iowa (n = 98), Minnesota (n = 96),Pennsylvania (n = 91), Louisiana (n = 67), Ohio (n = 57),Mississippi (n = 51), New York (n = 45), Oklahoma (n = 40),Kansas (n = 40), Missouri (n = 38), Florida (n = 32), Alabama(n = 26), Illinois (n = 22), Maryland (n = 20), North Carolina(n = 19), New Jersey (n = 17), Georgia (n = 13), Arkansas(n = 11), Massachusetts (n = 10), Wisconsin (n = 10), Con-necticut (n = nine), Tennessee (n = eight), Virginia (n = seven),Indiana (n = six), Kentucky (n = six), Delaware (n = four),Rhode Island (n = three), New Hampshire (n = two), Arizona(n = one), Michigan (n = one), Nevada (n = one), SouthCarolina (n = one), Utah (n = one), and Vermont (n = one)(Figure). Of 5,787 (99%) cases for which demographic datawere available, 3,028 (52%) occurred among males; themedian age was 47 years (range: 1 month–99 years), and thedates of illness onset ranged from March 28 to September 26.Of the 5,787 cases, 115 fatal cases were reported from Colo-rado (n = 36), Nebraska (n = 15), Texas (n = 11), SouthDakota (n = eight), Wyoming (n = eight), New York (n = six),New Mexico (n = four), Alabama (n = three), Iowa (n = three),Minnesota (n = three), Ohio (n = three), Georgia (n = two),Maryland (n = two), Missouri (n = two), Montana (n = two),Kansas (n = one), Louisiana (n = one), Michigan (n = one),Mississippi (n = one), New Jersey (n = one), North Dakota(n = one), and Pennsylvania (n = one). A total of 617presumptive West Nile viremic blood donors have been
reported to ArboNET. Of these, 558 (90%) were reportedfrom the following nine western and midwestern states: Colo-rado, Kansas, Nebraska, New Mexico, North Dakota, Okla-homa, South Dakota, Texas, and Wyoming. Of the 489 donorsfor whom data was completely reported, four subsequentlyhad meningoencephalitis, and 66 subsequently had WestNile fever. In addition, 8,955 dead birds with WNV infectionwere reported from 42 states, the District of Columbia, andNew York City; 2,449 WNV infections in horses have beenreported from 36 states, 19 infections in unidentified animalspecies, 13 infections in dogs, and nine infections in squirrels.During 2003, WNV seroconversions have been reported in612 sentinel chicken flocks from 13 states. Of the eightseropositive sentinel horses reported, Minnesota reported four;South Dakota, three; and West Virginia, one. A total of 5,633WNV-positive mosquito pools have been reported from 39states and New York City.
Additional information about WNV activity is availablefrom CDC at http://www.cdc.gov/ncidod/dvbid/westnile/index.htm and http://www.westnilemaps.usgs.gov.
Notice to Readers
SARS, Influenza, and Use of Influenza VaccineCDC supports and emphasizes the use of influenza vacci-
nation for reducing influenza infections and their associatedcomplications. CDC does not recommend influenza vaccina-tion for the primary purpose of reducing the number ofpersons who might be evaluated for severe acute respiratorysyndrome (SARS).
FIGURE. Areas reporting West Nile virus (WNV) activity —United States, 2003*
* As of 3 a.m., Mountain Daylight Time, October 1, 2003.
Human WNV disease and animal WNV activity
Animal WNV activity only

942 MMWR October 3, 2003
Influenza vaccine is effective only against influenza virusinfection and is the best option for preventing influenza andits complications. These complications occur most often inchildren aged <24 months, persons aged >65 years, and thoseof any age who have certain medical conditions placing themat high-risk for having complications from influenza infec-tion.* Annual vaccination is recommended for persons at highrisk aged >6 months and for persons in other target groups,including family members and other close contacts of high-risk persons, those aged 50–64 years, and health-care work-ers. Vaccination is encouraged, when feasible, for children aged6–23 months and for their household contacts and out-of-home caregivers. Influenza vaccination of health-care workersis especially important for reducing transmission of influenzaviruses to patients with high-risk conditions in hospital andother health-care settings and for protecting the health-careworkforce during the influenza season. Additional informa-tion about prevention and control of influenza is availableat http://www.cdc.gov/mmwr/preview/mmwrhtml/rr5208a1.htm.
On a population level, widespread use of the influenza vac-cine will reduce the number of influenza cases and mightdecrease the number of persons with a febrile respiratory ill-ness who are evaluated for SARS. However, such secondarybenefits cannot be reliably anticipated. For example, the over-all decrease in febrile respiratory illnesses would be minimal ifcirculating levels of influenza viruses are low or if other respi-ratory pathogens are actively circulating in a community.
Persons vaccinated against influenza can still have a febrilerespiratory illness because influenza vaccine will not preventinfection by noninfluenza agents and the effectiveness ofinfluenza vaccine is <100%. Therefore, receipt of influenzavaccination in a person who subsequently experiences a fe-brile respiratory illness does not eliminate influenza as a pos-sible cause nor necessarily increase the likelihood that the illnessis SARS.
Notice to Readers
Domestic Violence Awareness Month,October 2003
October is Domestic Violence Awareness Month (DVAM).Approximately 1.5 million U.S. women and 835,000 U.S.men are raped or physically assaulted by a current or former
spouse, cohabitating partner, or date each year (1). Theannual health-related costs of intimate partner violence in theUnited States is approximately $5.8 billion (2). DuringOctober, state and territorial domestic violence coalitions, cor-porations, health-care providers, faith-based groups, and CDCwill highlight activities that increase awareness about intimatepartner violence.
A packet of materials designed to help plan events, initiateoutreach in communities, and generate public awareness aboutdomestic violence during October and throughout the year isavailable from the National Resource Center on DomesticViolence, Domestic Violence Awareness Month Project, 6400Flank Drive, Suite 1300, Harrisburg, PA 17112-2778,telephone 800-537-2238, and at http://dvam.vawnet.org.Additional information about DVAM is available from CDCat http://www.cdc.gov/injury.References1. Tjaden P, Thoennes N. Full report of the prevalence, incidence, and
consequences of violence against women. Washington, DC: NationalInstitute of Justice and CDC, 2000 (NCJ183781).
2. CDC. Costs of intimate partner violence against women in the UnitedStates. Atlanta, Georgia: U.S. Department of Health and Human Ser-vices, CDC, 2003. Available at http://www.cdc.gov/ncipc/pub-res/ipv_cost/ipv.htm.
Erratum: Vol. 52, No. SS-9In the Surveillance Summary, “Assisted Reproductive Tech-
nology Surveillance—United States, 2000,” dated August 29,2003, an error occurred on page 6, in the third paragraph ofthe Discussion section. The text should read, “This divergenceis not surprising because Massachusetts had a statewide man-date for insurance coverage for ART procedures in 2000.”Although a similar mandate was introduced in New Jersey inearly 2000, it was not approved until August 2001 and didnot take effect until January 1, 2002.
Erratum: Vol. 52, No. 38In the article, “Update: Detection of West Nile Virus in
Blood Donations United States, 2003,” an error occurred onpage 918 in the second sentence of the third full paragraphdiscussing Case 2. The sentence should read, “These 20samples were tested by NAT at three different laboratories;one sample tested equivocal at one laboratory (Lab A), reac-tive in a second, and nonreactive in a third.” This sample sub-sequently tested positive for West Nile virus RNA at a fourthlaboratory and was reactive when retested at Lab A by using alarger extraction volume (estimated virus titer: 0.1 plaque-forming units/mL).
* Persons at high risk include residents of chronic care facilities, persons withchronic pulmonary or cardiovascular disorders (e.g., asthma, chronic metabolicdiseases, renal dysfunction, hemoglobinopathies, or immunosuppression),children receiving long-term aspirin therapy, and women who will be in thesecond or third trimester of pregnancy during the influenza season.
Vol. 52 / No. 39 MMWR 943
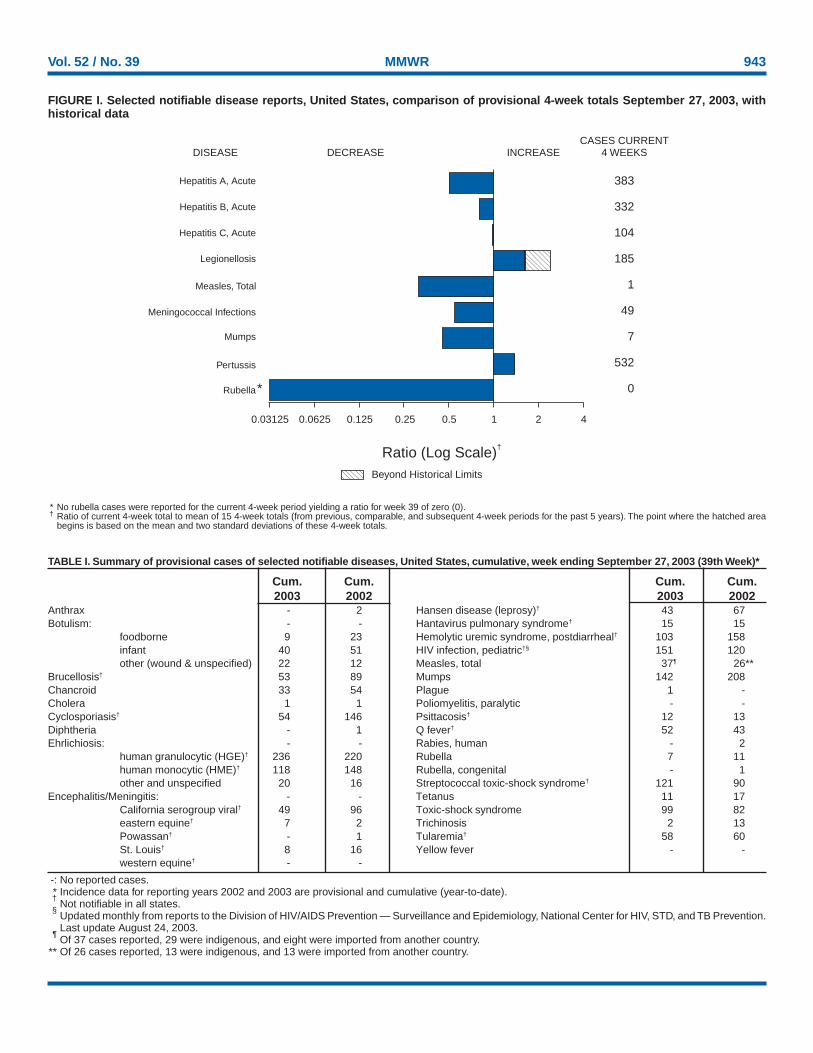
* No rubella cases were reported for the current 4-week period yielding a ratio for week 39 of zero (0).† Ratio of current 4-week total to mean of 15 4-week totals (from previous, comparable, and subsequent 4-week periods for the past 5 years). The point where the hatched area
begins is based on the mean and two standard deviations of these 4-week totals.
FIGURE I. Selected notifiable disease reports, United States, comparison of provisional 4-week totals September 27, 2003, withhistorical data
DISEASE DECREASE INCREASECASES CURRENT
4 WEEKS
Ratio (Log Scale)†
Beyond Historical Limits
4210.50.250.125
383
332
104
185
1
49
7
532
0
Hepatitis A, Acute
Hepatitis B, Acute
Hepatitis C, Acute
Legionellosis
Measles, Total
Mumps
Pertussis
Rubella
Meningococcal Infections
0.06250.03125
*
-: No reported cases.* Incidence data for reporting years 2002 and 2003 are provisional and cumulative (year-to-date).†
Not notifiable in all states.§
Updated monthly from reports to the Division of HIV/AIDS Prevention — Surveillance and Epidemiology, National Center for HIV, STD, and TB Prevention.Last update August 24, 2003.
¶Of 37 cases reported, 29 were indigenous, and eight were imported from another country.
** Of 26 cases reported, 13 were indigenous, and 13 were imported from another country.
TABLE I. Summary of provisional cases of selected notifiable diseases, United States, cumulative, week ending September 27, 2003 (39th Week)*
Cum. Cum. Cum. Cum.2003 2002 2003 2002
Anthrax - 2 Hansen disease (leprosy)† 43 67Botulism: - - Hantavirus pulmonary syndrome† 15 15
foodborne 9 23 Hemolytic uremic syndrome, postdiarrheal† 103 158infant 40 51 HIV infection, pediatric†§ 151 120other (wound & unspecified) 22 12 Measles, total 37¶ 26**
Brucellosis† 53 89 Mumps 142 208Chancroid 33 54 Plague 1 -Cholera 1 1 Poliomyelitis, paralytic - -Cyclosporiasis† 54 146 Psittacosis† 12 13Diphtheria - 1 Q fever† 52 43Ehrlichiosis: - - Rabies, human - 2
human granulocytic (HGE)† 236 220 Rubella 7 11human monocytic (HME)† 118 148 Rubella, congenital - 1other and unspecified 20 16 Streptococcal toxic-shock syndrome† 121 90
Encephalitis/Meningitis: - - Tetanus 11 17California serogroup viral† 49 96 Toxic-shock syndrome 99 82eastern equine† 7 2 Trichinosis 2 13Powassan† - 1 Tularemia† 58 60St. Louis† 8 16 Yellow fever - -western equine† - -

944 MMWR October 3, 2003
N: Not notifiable. U: Unavailable. -: No reported cases. C.N.M.I.: Commonwealth of Northern Mariana Islands.* Incidence data for reporting years 2002 and 2003 are provisional and cumulative (year-to-date).† Chlamydia refers to genital infections caused by C. trachomatis.§ Updated monthly from reports to the Division of HIV/AIDS Prevention — Surveillance and Epidemiology, National Center for HIV, STD, and TB Prevention. Last update
August 31, 2003.¶ Contains data reported through National Electronic Disease Surveillance System (NEDSS).
TABLE II. Provisional cases of selected notifiable diseases, United States, weeks ending September 27, 2003, and September 28, 2002(39th Week)*
Encephalitis/MeningitisAIDS Chlamydia† Coccidiodomycosis Cryptosporidiosis West Nile
Cum. Cum. Cum. Cum. Cum. Cum. Cum. Cum. Cum. Cum.Reporting area 2003§ 2002 2003 2002 2003 2002 2003 2002 2003 2002
UNITED STATES 30,269 29,547 606,232 615,449 2,820 3,369 2,104 2,232 812 1,877
NEW ENGLAND 989 1,225 20,219 20,367 - - 125 152 - 23Maine 49 27 1,439 1,227 N N 16 9 - -N.H. 24 25 1,023 1,169 - - 11 25 - -Vt. 13 12 752 672 - - 26 26 - -Mass. 408 629 8,285 8,156 - - 48 63 - 16R.I. 79 74 2,183 2,043 - - 12 16 - -Conn. 416 458 6,537 7,100 N N 12 13 - 7
MID. ATLANTIC 6,726 6,786 81,771 68,999 - - 265 286 52 72Upstate N.Y. 693 522 14,548 12,396 N N 88 84 - 21N.Y. City 3,390 3,943 23,888 22,807 - - 62 113 - 26N.J. 1,159 1,075 9,670 10,513 - - 4 15 2 21Pa. 1,484 1,246 33,665 23,283 N N 111 74 50 4
E.N. CENTRAL 2,925 2,916 99,963 112,994 7 20 536 767 52 1,077Ohio 555 513 24,261 28,335 - - 97 98 52 137Ind. 378 397 12,362 12,713 N N 69 33 - 17Ill. 1,348 1,359 29,711 35,986 - 2 56 101 - 547Mich. 506 502 22,468 23,249 7 18 99 91 - 335Wis. 138 145 11,161 12,711 - - 215 444 - 41
W.N. CENTRAL 563 487 34,269 34,872 1 1 408 305 208 53Minn. 110 106 7,479 7,803 N N 114 154 27 -Iowa 63 58 2,676 4,073 N N 76 37 33 -Mo. 266 224 13,033 11,767 - - 31 29 20 24N. Dak. 2 1 700 910 N N 12 10 5 -S. Dak. 9 3 1,956 1,606 - - 31 18 38 14Nebr.¶ 39 44 3,269 3,570 1 1 15 43 32 11Kans. 74 51 5,156 5,143 N N 129 14 53 4
S. ATLANTIC 8,582 8,879 116,625 115,897 3 3 258 226 65 44Del. 176 155 2,239 1,966 N N 3 2 2 -Md. 994 1,399 12,201 11,971 3 3 17 16 13 17D.C. 765 399 2,101 2,423 - - 12 4 - -Va. 655 607 12,536 13,056 - - 35 12 6 -W. Va. 61 67 1,916 1,836 N N 4 2 - -N.C. 869 760 19,337 18,486 N N 34 28 - -S.C.¶ 551 608 11,795 10,848 - - 3 6 1 1Ga. 1,369 1,236 24,292 23,747 - - 79 90 15 19Fla. 3,142 3,648 30,208 31,564 N N 71 66 28 7
E.S. CENTRAL 1,306 1,384 39,076 39,667 N N 97 104 20 237Ky. 111 222 5,934 6,582 N N 21 4 4 30Tenn. 575 566 15,051 12,106 N N 32 50 6 1Ala. 308 298 9,097 12,228 - - 35 43 10 23Miss. 312 298 8,994 8,751 N N 9 7 - 183
W.S. CENTRAL 3,128 3,308 74,155 81,671 - 10 46 51 166 370Ark. 127 190 5,754 5,699 - - 13 7 11 8La. 414 808 12,610 14,584 N N 2 9 2 191Okla. 154 155 6,828 8,520 N N 10 11 13 -Tex. 2,433 2,155 48,963 52,868 - 10 21 24 140 171
MOUNTAIN 1,152 1,025 34,244 38,090 1,957 2,142 104 125 245 1Mont. 11 9 1,325 1,614 N N 17 4 200 -Idaho 17 24 1,860 1,832 N N 20 23 - 1Wyo. 6 8 739 692 1 - 4 9 41 -Colo. 296 211 8,147 10,519 N N 27 45 - -N. Mex. 92 65 5,052 5,620 5 7 8 18 2 -Ariz. 490 432 9,880 11,147 1,914 2,093 5 11 - -Utah 47 49 3,114 2,182 9 11 16 11 1 -Nev. 193 227 4,127 4,484 28 31 7 4 1 -
PACIFIC 4,898 3,537 105,910 102,892 851 1,192 265 216 4 -Wash. 311 336 12,264 10,875 N N 25 22 - -Oreg. 184 234 4,709 5,033 - - 33 33 4 -Calif. 4,319 2,858 83,679 80,929 851 1,192 206 159 - -Alaska 13 22 2,693 2,727 - - 1 - - -Hawaii 71 87 2,565 3,328 - - - 2 - -
Guam 6 1 - 481 - - - - - -P.R. 787 798 1,391 1,917 N N N N - -V.I. 25 63 142 125 - - - - - -Amer. Samoa U U U U U U U U U UC.N.M.I. 2 U - U - U - U - U
Vol. 52 / No. 39 MMWR 945
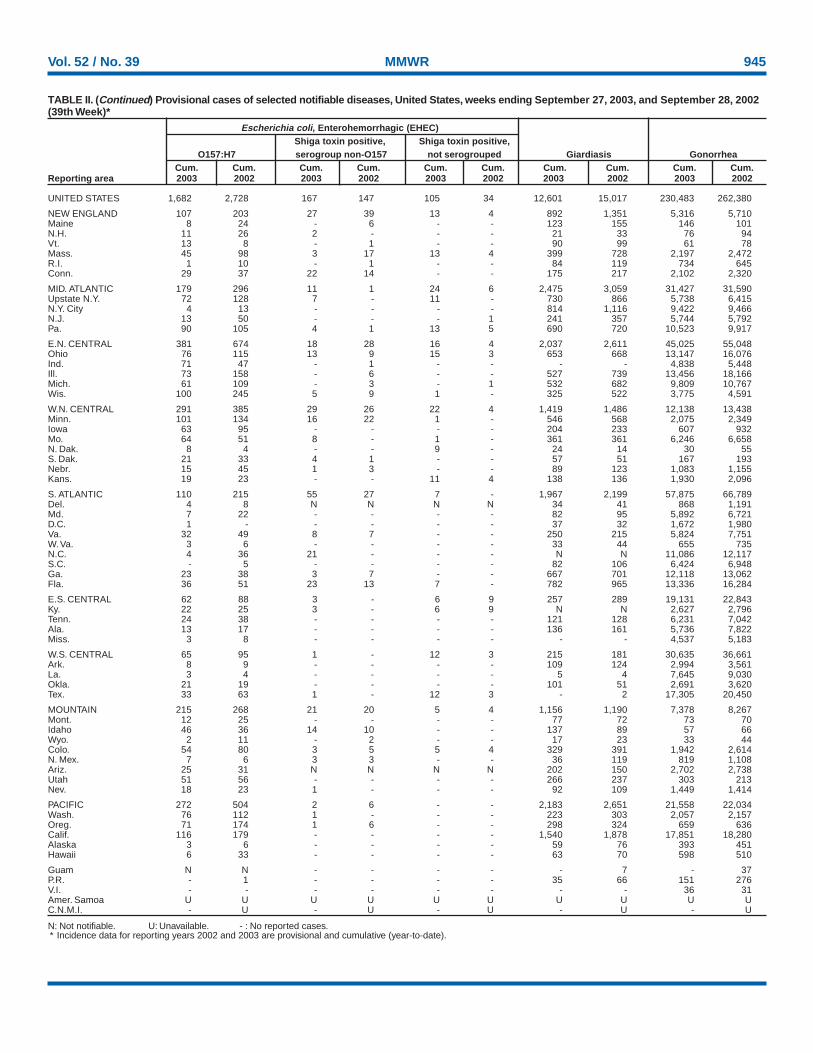
N: Not notifiable. U: Unavailable. - : No reported cases.* Incidence data for reporting years 2002 and 2003 are provisional and cumulative (year-to-date).
TABLE II. (Continued) Provisional cases of selected notifiable diseases, United States, weeks ending September 27, 2003, and September 28, 2002(39th Week)*
Escherichia coli, Enterohemorrhagic (EHEC)Shiga toxin positive, Shiga toxin positive,
O157:H7 serogroup non-O157 not serogrouped Giardiasis GonorrheaCum. Cum. Cum. Cum. Cum. Cum. Cum. Cum. Cum. Cum.
Reporting area 2003 2002 2003 2002 2003 2002 2003 2002 2003 2002
UNITED STATES 1,682 2,728 167 147 105 34 12,601 15,017 230,483 262,380
NEW ENGLAND 107 203 27 39 13 4 892 1,351 5,316 5,710Maine 8 24 - 6 - - 123 155 146 101N.H. 11 26 2 - - - 21 33 76 94Vt. 13 8 - 1 - - 90 99 61 78Mass. 45 98 3 17 13 4 399 728 2,197 2,472R.I. 1 10 - 1 - - 84 119 734 645Conn. 29 37 22 14 - - 175 217 2,102 2,320
MID. ATLANTIC 179 296 11 1 24 6 2,475 3,059 31,427 31,590Upstate N.Y. 72 128 7 - 11 - 730 866 5,738 6,415N.Y. City 4 13 - - - - 814 1,116 9,422 9,466N.J. 13 50 - - - 1 241 357 5,744 5,792Pa. 90 105 4 1 13 5 690 720 10,523 9,917
E.N. CENTRAL 381 674 18 28 16 4 2,037 2,611 45,025 55,048Ohio 76 115 13 9 15 3 653 668 13,147 16,076Ind. 71 47 - 1 - - - - 4,838 5,448Ill. 73 158 - 6 - - 527 739 13,456 18,166Mich. 61 109 - 3 - 1 532 682 9,809 10,767Wis. 100 245 5 9 1 - 325 522 3,775 4,591
W.N. CENTRAL 291 385 29 26 22 4 1,419 1,486 12,138 13,438Minn. 101 134 16 22 1 - 546 568 2,075 2,349Iowa 63 95 - - - - 204 233 607 932Mo. 64 51 8 - 1 - 361 361 6,246 6,658N. Dak. 8 4 - - 9 - 24 14 30 55S. Dak. 21 33 4 1 - - 57 51 167 193Nebr. 15 45 1 3 - - 89 123 1,083 1,155Kans. 19 23 - - 11 4 138 136 1,930 2,096
S. ATLANTIC 110 215 55 27 7 - 1,967 2,199 57,875 66,789Del. 4 8 N N N N 34 41 868 1,191Md. 7 22 - - - - 82 95 5,892 6,721D.C. 1 - - - - - 37 32 1,672 1,980Va. 32 49 8 7 - - 250 215 5,824 7,751W. Va. 3 6 - - - - 33 44 655 735N.C. 4 36 21 - - - N N 11,086 12,117S.C. - 5 - - - - 82 106 6,424 6,948Ga. 23 38 3 7 - - 667 701 12,118 13,062Fla. 36 51 23 13 7 - 782 965 13,336 16,284
E.S. CENTRAL 62 88 3 - 6 9 257 289 19,131 22,843Ky. 22 25 3 - 6 9 N N 2,627 2,796Tenn. 24 38 - - - - 121 128 6,231 7,042Ala. 13 17 - - - - 136 161 5,736 7,822Miss. 3 8 - - - - - - 4,537 5,183
W.S. CENTRAL 65 95 1 - 12 3 215 181 30,635 36,661Ark. 8 9 - - - - 109 124 2,994 3,561La. 3 4 - - - - 5 4 7,645 9,030Okla. 21 19 - - - - 101 51 2,691 3,620Tex. 33 63 1 - 12 3 - 2 17,305 20,450
MOUNTAIN 215 268 21 20 5 4 1,156 1,190 7,378 8,267Mont. 12 25 - - - - 77 72 73 70Idaho 46 36 14 10 - - 137 89 57 66Wyo. 2 11 - 2 - - 17 23 33 44Colo. 54 80 3 5 5 4 329 391 1,942 2,614N. Mex. 7 6 3 3 - - 36 119 819 1,108Ariz. 25 31 N N N N 202 150 2,702 2,738Utah 51 56 - - - - 266 237 303 213Nev. 18 23 1 - - - 92 109 1,449 1,414
PACIFIC 272 504 2 6 - - 2,183 2,651 21,558 22,034Wash. 76 112 1 - - - 223 303 2,057 2,157Oreg. 71 174 1 6 - - 298 324 659 636Calif. 116 179 - - - - 1,540 1,878 17,851 18,280Alaska 3 6 - - - - 59 76 393 451Hawaii 6 33 - - - - 63 70 598 510
Guam N N - - - - - 7 - 37P.R. - 1 - - - - 35 66 151 276V.I. - - - - - - - - 36 31Amer. Samoa U U U U U U U U U UC.N.M.I. - U - U - U - U - U

946 MMWR October 3, 2003
N: Not notifiable. U: Unavailable. -: No reported cases.* Incidence data for reporting years 2002 and 2003 are provisional and cumulative (year-to-date).† Non-serotype b: nontypeable and type other than b; Unknown serotype: type unknown or not reported. Previously, cases reported without type information were counted as non-
serotype b.
TABLE II. (Continued) Provisional cases of selected notifiable diseases, United States, weeks ending September 27, 2003, and September 28, 2002(39th Week)*
Haemophilus influenzae, invasive† Hepatitis
All ages Age <5 years (viral, acute), by type
All serotypes Serotype b Non-serotype b Unknown serotype ACum. Cum. Cum. Cum. Cum. Cum. Cum. Cum. Cum. Cum.
Reporting area 2003 2002 2003 2002 2003 2002 2003 2002 2003 2002
UNITED STATES 1,292 1,266 15 25 72 102 135 116 4,444 6,894
NEW ENGLAND 103 85 1 - 6 8 5 2 232 243Maine 4 1 - - - - 1 - 9 8N.H. 11 7 1 - - - - - 11 11Vt. 7 6 - - - - - - 6 1Mass. 47 40 - - 6 4 3 2 133 110R.I. 6 10 - - - - 1 - 12 30Conn. 28 21 - - - 4 - - 61 83
MID. ATLANTIC 296 234 - 2 1 14 38 20 892 882Upstate N.Y. 110 91 - 2 1 4 11 6 94 141N.Y. City 47 55 - - - - 10 9 324 340N.J. 52 46 - - - - 6 5 103 149Pa. 87 42 - - - 10 11 - 371 252
E.N. CENTRAL 183 248 4 3 7 9 28 32 476 861Ohio 58 63 - - - 1 10 7 84 241Ind. 37 35 1 1 4 7 - - 58 38Ill. 58 97 - - - - 14 17 146 233Mich. 19 11 3 2 3 1 1 - 150 179Wis. 11 42 - - - - 3 8 38 170
W.N. CENTRAL 92 56 1 1 7 2 12 4 145 243Minn. 36 36 1 1 7 2 2 2 37 36Iowa - 1 - - - - - - 25 54Mo. 36 11 - - - - 10 2 51 73N. Dak. 1 4 - - - - - - - 1S. Dak. 1 1 - - - - - - - 3Nebr. 2 - - - - - - - 8 16Kans. 16 3 - - - - - - 24 60
S. ATLANTIC 302 288 1 5 12 15 14 22 1,067 1,900Del. - - - - - - - - 4 11Md. 67 72 - 2 5 3 - 1 110 243D.C. - - - - - - - - 30 65Va. 41 25 - - - - 5 4 69 97W. Va. 14 16 - - - 1 - 1 14 15N.C. 35 30 - - 3 3 1 - 72 182S.C. 3 11 - - - - - 2 26 54Ga. 54 61 - - - - 5 10 408 367Fla. 88 73 1 3 4 8 3 4 334 866
E.S. CENTRAL 59 54 1 1 - 4 8 10 158 206Ky. 4 4 - - - 1 - - 25 41Tenn. 33 27 - - - - 4 7 105 83Ala. 20 14 1 1 - 3 3 1 14 32Miss. 2 9 - - - - 1 2 14 50
W.S. CENTRAL 52 46 1 2 7 8 3 2 201 809Ark. 7 1 - - 1 - - - 17 45La. 7 6 - - - - 2 2 38 64Okla. 35 37 - - 6 8 1 - 10 39Tex. 3 2 1 2 - - - - 136 661
MOUNTAIN 128 139 4 4 18 25 17 13 364 439Mont. - - - - - - - - 7 12Idaho 4 2 - - - - 1 1 - 24Wyo. 1 2 - - - - - - 1 2Colo. 26 26 - - - - 5 2 56 67N. Mex. 14 22 - - 4 6 1 1 15 20Ariz. 64 62 4 2 6 14 8 6 209 237Utah 11 14 - 1 5 3 2 - 34 39Nev. 8 11 - 1 3 2 - 3 42 38
PACIFIC 77 116 2 7 14 17 10 11 909 1,311Wash. 9 2 - 1 6 1 2 - 42 134Oreg. 37 44 - - - - 3 3 46 50Calif. 17 39 2 6 8 16 4 4 806 1,096Alaska - 1 - - - - - 1 8 8Hawaii 14 30 - - - - 1 3 7 23
Guam - - - - - - - - - -P.R. - 1 - - - - - - 26 177V.I. - - - - - - - - - -Amer. Samoa U U U U U U U U U UC.N.M.I. - U - U - U - U - U

Vol. 52 / No. 39 MMWR 947
N: Not notifiable. U: Unavailable. -: No reported cases.* Incidence data for reporting years 2002 and 2003 are provisional and cumulative (year-to-date).
TABLE II. (Continued) Provisional cases of selected notifiable diseases, United States, weeks ending September 27, 2003, and September 28, 2002(39th Week)*
Hepatitis (viral, acute), by typeB C Legionellosis Listeriosis Lyme disease
Cum. Cum. Cum. Cum. Cum. Cum. Cum. Cum. Cum. Cum.Reporting area 2003 2002 2003 2002 2003 2002 2003 2002 2003 2002UNITED STATES 4,494 5,463 1,213 1,420 1,416 837 436 456 12,515 15,259
NEW ENGLAND 180 212 3 18 64 74 35 51 2,193 4,298Maine 1 8 - - 2 2 6 5 161 49N.H. 11 15 - - 6 4 3 4 87 189Vt. 2 4 3 12 5 31 - 3 32 30Mass. 147 118 - 6 22 28 13 27 487 1,666R.I. 11 21 - - 13 1 - 1 434 252Conn. 8 46 U U 16 8 13 11 992 2,112
MID. ATLANTIC 720 1,158 124 80 398 233 85 134 8,430 8,255Upstate N.Y. 90 91 36 35 118 61 24 42 3,481 3,611N.Y. City 254 575 - - 32 50 14 31 5 56N.J. 165 233 - 4 34 27 11 27 1,372 1,991Pa. 211 259 88 41 214 95 36 34 3,572 2,597
E.N. CENTRAL 293 501 129 81 278 217 52 59 592 1,131Ohio 108 70 7 - 175 85 18 15 57 49Ind. 28 38 7 - 20 14 5 6 17 18Ill. 1 115 14 18 3 21 7 15 - 46Mich. 133 235 101 60 67 65 17 15 7 25Wis. 23 43 - 3 13 32 5 8 511 993
W.N. CENTRAL 237 168 183 605 52 43 16 12 269 193Minn. 29 20 7 2 3 10 8 1 196 112Iowa 8 13 1 1 9 10 - 1 29 32Mo. 165 88 174 591 24 11 5 7 33 36N. Dak. 2 4 - - 1 - - 1 - -S. Dak. 2 1 - 1 2 2 - - 1 1Nebr. 18 22 1 10 4 10 3 1 2 6Kans. 13 20 - - 9 - - 1 8 6
S. ATLANTIC 1,389 1,290 126 159 397 142 94 58 848 1,098Del. 5 13 - - 21 7 N N 137 153Md. 98 97 13 9 98 28 14 14 486 619D.C. 9 15 - - 13 5 - - 6 18Va. 137 152 7 9 72 17 9 4 66 123W. Va. 25 18 1 2 15 - 6 - 17 12N.C. 111 174 11 22 30 9 15 5 77 101S.C. 110 90 24 4 5 6 2 8 3 13Ga. 409 333 3 61 24 13 25 9 12 2Fla. 485 398 67 52 119 57 23 18 44 57
E.S. CENTRAL 303 284 64 104 79 26 23 13 43 56Ky. 50 47 10 4 35 10 5 2 11 19Tenn. 147 106 18 22 28 10 5 7 12 20Ala. 47 59 6 6 13 6 11 4 5 8Miss. 59 72 30 72 3 - 2 - 15 9
W.S. CENTRAL 225 753 456 239 36 25 21 27 38 124Ark. 38 94 3 10 2 - 1 - - 2La. 46 102 46 76 - 4 1 2 3 3Okla. 31 52 2 5 6 3 2 7 - -Tex. 110 505 405 148 28 18 17 18 35 119
MOUNTAIN 472 482 41 45 50 33 28 25 15 13Mont. 13 7 1 - 3 3 2 - - -Idaho - 6 - - 3 1 2 2 3 3Wyo. 27 15 - 5 2 2 - - 1 1Colo. 63 61 12 6 11 7 10 6 4 1N. Mex. 27 137 - 2 2 2 2 2 - 1Ariz. 234 176 7 4 9 7 9 11 1 2Utah 49 33 - 4 15 8 - 3 3 4Nev. 59 47 21 24 5 3 3 1 3 1
PACIFIC 675 615 87 89 62 44 82 77 87 91Wash. 54 56 14 17 8 3 3 8 3 9Oreg. 84 102 12 10 N N 5 8 16 11Calif. 509 443 58 61 54 41 70 53 65 68Alaska 8 6 1 - - - - - 3 3Hawaii 20 8 2 1 - - 4 8 N N
Guam - - - - - - - - - -P.R. 41 144 - - - - - 2 N NV.I. - - - - - - - - - -Amer. Samoa U U U U U U U U U UC.N.M.I. - U - U - U - U - U
948 MMWR October 3, 2003
N: Not notifiable. U: Unavailable. - : No reported cases.* Incidence data for reporting years 2002 and 2003 are provisional and cumulative (year-to-date).
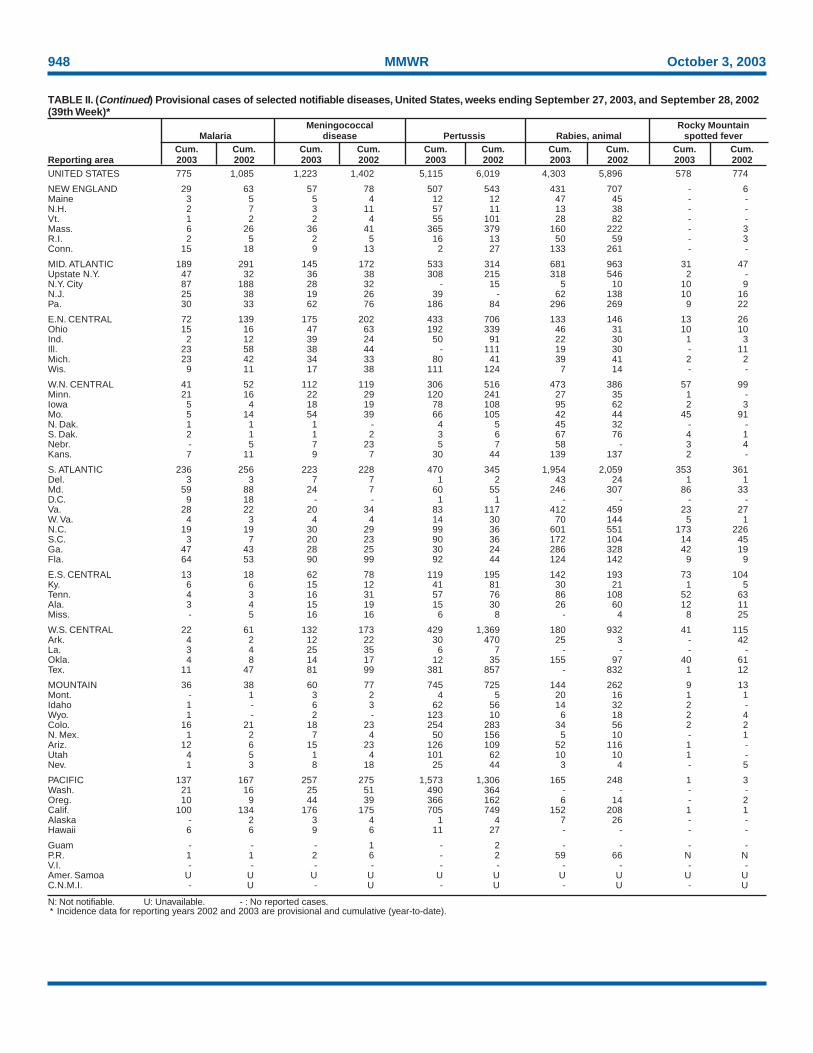
TABLE II. (Continued) Provisional cases of selected notifiable diseases, United States, weeks ending September 27, 2003, and September 28, 2002(39th Week)*
Meningococcal Rocky MountainMalaria disease Pertussis Rabies, animal spotted fever
Cum. Cum. Cum. Cum. Cum. Cum. Cum. Cum. Cum. Cum.Reporting area 2003 2002 2003 2002 2003 2002 2003 2002 2003 2002UNITED STATES 775 1,085 1,223 1,402 5,115 6,019 4,303 5,896 578 774
NEW ENGLAND 29 63 57 78 507 543 431 707 - 6Maine 3 5 5 4 12 12 47 45 - -N.H. 2 7 3 11 57 11 13 38 - -Vt. 1 2 2 4 55 101 28 82 - -Mass. 6 26 36 41 365 379 160 222 - 3R.I. 2 5 2 5 16 13 50 59 - 3Conn. 15 18 9 13 2 27 133 261 - -
MID. ATLANTIC 189 291 145 172 533 314 681 963 31 47Upstate N.Y. 47 32 36 38 308 215 318 546 2 -N.Y. City 87 188 28 32 - 15 5 10 10 9N.J. 25 38 19 26 39 - 62 138 10 16Pa. 30 33 62 76 186 84 296 269 9 22
E.N. CENTRAL 72 139 175 202 433 706 133 146 13 26Ohio 15 16 47 63 192 339 46 31 10 10Ind. 2 12 39 24 50 91 22 30 1 3Ill. 23 58 38 44 - 111 19 30 - 11Mich. 23 42 34 33 80 41 39 41 2 2Wis. 9 11 17 38 111 124 7 14 - -
W.N. CENTRAL 41 52 112 119 306 516 473 386 57 99Minn. 21 16 22 29 120 241 27 35 1 -Iowa 5 4 18 19 78 108 95 62 2 3Mo. 5 14 54 39 66 105 42 44 45 91N. Dak. 1 1 1 - 4 5 45 32 - -S. Dak. 2 1 1 2 3 6 67 76 4 1Nebr. - 5 7 23 5 7 58 - 3 4Kans. 7 11 9 7 30 44 139 137 2 -
S. ATLANTIC 236 256 223 228 470 345 1,954 2,059 353 361Del. 3 3 7 7 1 2 43 24 1 1Md. 59 88 24 7 60 55 246 307 86 33D.C. 9 18 - - 1 1 - - - -Va. 28 22 20 34 83 117 412 459 23 27W. Va. 4 3 4 4 14 30 70 144 5 1N.C. 19 19 30 29 99 36 601 551 173 226S.C. 3 7 20 23 90 36 172 104 14 45Ga. 47 43 28 25 30 24 286 328 42 19Fla. 64 53 90 99 92 44 124 142 9 9
E.S. CENTRAL 13 18 62 78 119 195 142 193 73 104Ky. 6 6 15 12 41 81 30 21 1 5Tenn. 4 3 16 31 57 76 86 108 52 63Ala. 3 4 15 19 15 30 26 60 12 11Miss. - 5 16 16 6 8 - 4 8 25
W.S. CENTRAL 22 61 132 173 429 1,369 180 932 41 115Ark. 4 2 12 22 30 470 25 3 - 42La. 3 4 25 35 6 7 - - - -Okla. 4 8 14 17 12 35 155 97 40 61Tex. 11 47 81 99 381 857 - 832 1 12
MOUNTAIN 36 38 60 77 745 725 144 262 9 13Mont. - 1 3 2 4 5 20 16 1 1Idaho 1 - 6 3 62 56 14 32 2 -Wyo. 1 - 2 - 123 10 6 18 2 4Colo. 16 21 18 23 254 283 34 56 2 2N. Mex. 1 2 7 4 50 156 5 10 - 1Ariz. 12 6 15 23 126 109 52 116 1 -Utah 4 5 1 4 101 62 10 10 1 -Nev. 1 3 8 18 25 44 3 4 - 5
PACIFIC 137 167 257 275 1,573 1,306 165 248 1 3Wash. 21 16 25 51 490 364 - - - -Oreg. 10 9 44 39 366 162 6 14 - 2Calif. 100 134 176 175 705 749 152 208 1 1Alaska - 2 3 4 1 4 7 26 - -Hawaii 6 6 9 6 11 27 - - - -
Guam - - - 1 - 2 - - - -P.R. 1 1 2 6 - 2 59 66 N NV.I. - - - - - - - - - -Amer. Samoa U U U U U U U U U UC.N.M.I. - U - U - U - U - U
Vol. 52 / No. 39 MMWR 949
N: Not notifiable. U: Unavailable. - : No reported cases.* Incidence data for reporting years 2002 and 2003 are provisional and cumulative (year-to-date).
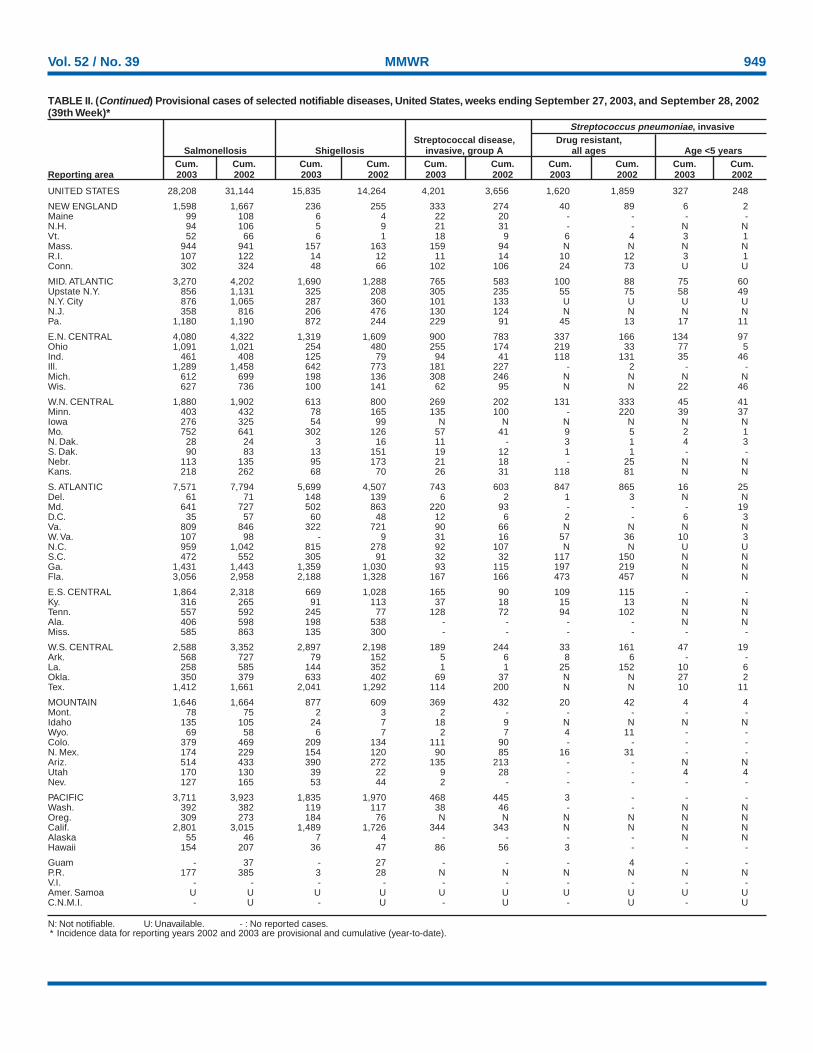
TABLE II. (Continued) Provisional cases of selected notifiable diseases, United States, weeks ending September 27, 2003, and September 28, 2002(39th Week)*
Streptococcus pneumoniae, invasiveStreptococcal disease, Drug resistant,
Salmonellosis Shigellosis invasive, group A all ages Age <5 yearsCum. Cum. Cum. Cum. Cum. Cum. Cum. Cum. Cum. Cum.
Reporting area 2003 2002 2003 2002 2003 2002 2003 2002 2003 2002
UNITED STATES 28,208 31,144 15,835 14,264 4,201 3,656 1,620 1,859 327 248
NEW ENGLAND 1,598 1,667 236 255 333 274 40 89 6 2Maine 99 108 6 4 22 20 - - - -N.H. 94 106 5 9 21 31 - - N NVt. 52 66 6 1 18 9 6 4 3 1Mass. 944 941 157 163 159 94 N N N NR.I. 107 122 14 12 11 14 10 12 3 1Conn. 302 324 48 66 102 106 24 73 U U
MID. ATLANTIC 3,270 4,202 1,690 1,288 765 583 100 88 75 60Upstate N.Y. 856 1,131 325 208 305 235 55 75 58 49N.Y. City 876 1,065 287 360 101 133 U U U UN.J. 358 816 206 476 130 124 N N N NPa. 1,180 1,190 872 244 229 91 45 13 17 11
E.N. CENTRAL 4,080 4,322 1,319 1,609 900 783 337 166 134 97Ohio 1,091 1,021 254 480 255 174 219 33 77 5Ind. 461 408 125 79 94 41 118 131 35 46Ill. 1,289 1,458 642 773 181 227 - 2 - -Mich. 612 699 198 136 308 246 N N N NWis. 627 736 100 141 62 95 N N 22 46
W.N. CENTRAL 1,880 1,902 613 800 269 202 131 333 45 41Minn. 403 432 78 165 135 100 - 220 39 37Iowa 276 325 54 99 N N N N N NMo. 752 641 302 126 57 41 9 5 2 1N. Dak. 28 24 3 16 11 - 3 1 4 3S. Dak. 90 83 13 151 19 12 1 1 - -Nebr. 113 135 95 173 21 18 - 25 N NKans. 218 262 68 70 26 31 118 81 N N
S. ATLANTIC 7,571 7,794 5,699 4,507 743 603 847 865 16 25Del. 61 71 148 139 6 2 1 3 N NMd. 641 727 502 863 220 93 - - - 19D.C. 35 57 60 48 12 6 2 - 6 3Va. 809 846 322 721 90 66 N N N NW. Va. 107 98 - 9 31 16 57 36 10 3N.C. 959 1,042 815 278 92 107 N N U US.C. 472 552 305 91 32 32 117 150 N NGa. 1,431 1,443 1,359 1,030 93 115 197 219 N NFla. 3,056 2,958 2,188 1,328 167 166 473 457 N N
E.S. CENTRAL 1,864 2,318 669 1,028 165 90 109 115 - -Ky. 316 265 91 113 37 18 15 13 N NTenn. 557 592 245 77 128 72 94 102 N NAla. 406 598 198 538 - - - - N NMiss. 585 863 135 300 - - - - - -
W.S. CENTRAL 2,588 3,352 2,897 2,198 189 244 33 161 47 19Ark. 568 727 79 152 5 6 8 6 - -La. 258 585 144 352 1 1 25 152 10 6Okla. 350 379 633 402 69 37 N N 27 2Tex. 1,412 1,661 2,041 1,292 114 200 N N 10 11
MOUNTAIN 1,646 1,664 877 609 369 432 20 42 4 4Mont. 78 75 2 3 2 - - - - -Idaho 135 105 24 7 18 9 N N N NWyo. 69 58 6 7 2 7 4 11 - -Colo. 379 469 209 134 111 90 - - - -N. Mex. 174 229 154 120 90 85 16 31 - -Ariz. 514 433 390 272 135 213 - - N NUtah 170 130 39 22 9 28 - - 4 4Nev. 127 165 53 44 2 - - - - -
PACIFIC 3,711 3,923 1,835 1,970 468 445 3 - - -Wash. 392 382 119 117 38 46 - - N NOreg. 309 273 184 76 N N N N N NCalif. 2,801 3,015 1,489 1,726 344 343 N N N NAlaska 55 46 7 4 - - - - N NHawaii 154 207 36 47 86 56 3 - - -
Guam - 37 - 27 - - - 4 - -P.R. 177 385 3 28 N N N N N NV.I. - - - - - - - - - -Amer. Samoa U U U U U U U U U UC.N.M.I. - U - U - U - U - U
950 MMWR October 3, 2003
N: Not notifiable. U: Unavailable. - : No reported cases.* Incidence data for reporting years 2002 and 2003 are provisional and cumulative (year-to-date).
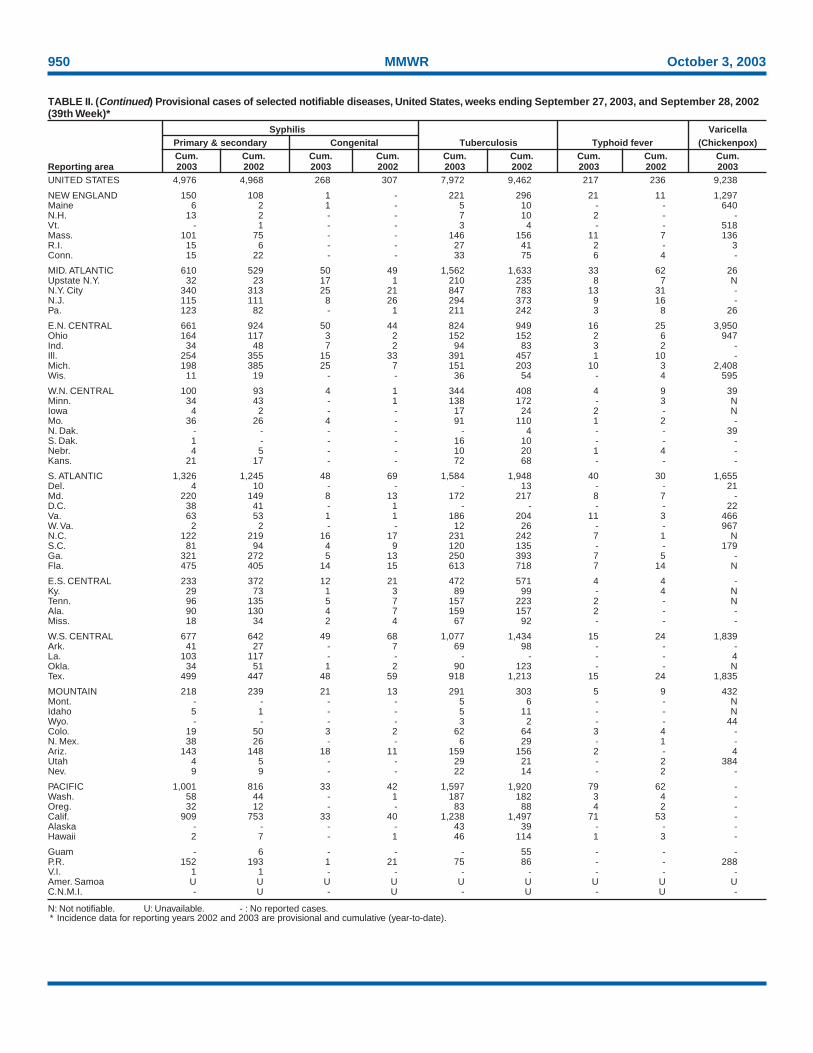
TABLE II. (Continued) Provisional cases of selected notifiable diseases, United States, weeks ending September 27, 2003, and September 28, 2002(39th Week)*
Syphilis VaricellaPrimary & secondary Congenital Tuberculosis Typhoid fever (Chickenpox)Cum. Cum. Cum. Cum. Cum. Cum. Cum. Cum. Cum.
Reporting area 2003 2002 2003 2002 2003 2002 2003 2002 2003UNITED STATES 4,976 4,968 268 307 7,972 9,462 217 236 9,238
NEW ENGLAND 150 108 1 - 221 296 21 11 1,297Maine 6 2 1 - 5 10 - - 640N.H. 13 2 - - 7 10 2 - -Vt. - 1 - - 3 4 - - 518Mass. 101 75 - - 146 156 11 7 136R.I. 15 6 - - 27 41 2 - 3Conn. 15 22 - - 33 75 6 4 -
MID. ATLANTIC 610 529 50 49 1,562 1,633 33 62 26Upstate N.Y. 32 23 17 1 210 235 8 7 NN.Y. City 340 313 25 21 847 783 13 31 -N.J. 115 111 8 26 294 373 9 16 -Pa. 123 82 - 1 211 242 3 8 26
E.N. CENTRAL 661 924 50 44 824 949 16 25 3,950Ohio 164 117 3 2 152 152 2 6 947Ind. 34 48 7 2 94 83 3 2 -Ill. 254 355 15 33 391 457 1 10 -Mich. 198 385 25 7 151 203 10 3 2,408Wis. 11 19 - - 36 54 - 4 595
W.N. CENTRAL 100 93 4 1 344 408 4 9 39Minn. 34 43 - 1 138 172 - 3 NIowa 4 2 - - 17 24 2 - NMo. 36 26 4 - 91 110 1 2 -N. Dak. - - - - - 4 - - 39S. Dak. 1 - - - 16 10 - - -Nebr. 4 5 - - 10 20 1 4 -Kans. 21 17 - - 72 68 - - -
S. ATLANTIC 1,326 1,245 48 69 1,584 1,948 40 30 1,655Del. 4 10 - - - 13 - - 21Md. 220 149 8 13 172 217 8 7 -D.C. 38 41 - 1 - - - - 22Va. 63 53 1 1 186 204 11 3 466W. Va. 2 2 - - 12 26 - - 967N.C. 122 219 16 17 231 242 7 1 NS.C. 81 94 4 9 120 135 - - 179Ga. 321 272 5 13 250 393 7 5 -Fla. 475 405 14 15 613 718 7 14 N
E.S. CENTRAL 233 372 12 21 472 571 4 4 -Ky. 29 73 1 3 89 99 - 4 NTenn. 96 135 5 7 157 223 2 - NAla. 90 130 4 7 159 157 2 - -Miss. 18 34 2 4 67 92 - - -
W.S. CENTRAL 677 642 49 68 1,077 1,434 15 24 1,839Ark. 41 27 - 7 69 98 - - -La. 103 117 - - - - - - 4Okla. 34 51 1 2 90 123 - - NTex. 499 447 48 59 918 1,213 15 24 1,835
MOUNTAIN 218 239 21 13 291 303 5 9 432Mont. - - - - 5 6 - - NIdaho 5 1 - - 5 11 - - NWyo. - - - - 3 2 - - 44Colo. 19 50 3 2 62 64 3 4 -N. Mex. 38 26 - - 6 29 - 1 -Ariz. 143 148 18 11 159 156 2 - 4Utah 4 5 - - 29 21 - 2 384Nev. 9 9 - - 22 14 - 2 -
PACIFIC 1,001 816 33 42 1,597 1,920 79 62 -Wash. 58 44 - 1 187 182 3 4 -Oreg. 32 12 - - 83 88 4 2 -Calif. 909 753 33 40 1,238 1,497 71 53 -Alaska - - - - 43 39 - - -Hawaii 2 7 - 1 46 114 1 3 -
Guam - 6 - - - 55 - - -P.R. 152 193 1 21 75 86 - - 288V.I. 1 1 - - - - - - -Amer. Samoa U U U U U U U U UC.N.M.I. - U - U - U - U -

Vol. 52 / No. 39 MMWR 951
NEW ENGLAND 554 366 123 34 12 19 44Boston, Mass. 149 88 33 19 5 4 13Bridgeport, Conn. 48 35 12 - - 1 3Cambridge, Mass. 14 11 2 - - 1 4Fall River, Mass. 27 16 9 - 2 - 3Hartford, Conn. 47 25 12 2 1 7 4Lowell, Mass. 17 12 3 2 - - -Lynn, Mass. 13 8 5 - - - -New Bedford, Mass. 31 23 3 4 - 1 1New Haven, Conn. 34 24 8 1 1 - 4Providence, R.I. 47 32 13 - 1 1 4Somerville, Mass. 4 3 - - 1 - -Springfield, Mass. 45 32 7 2 1 3 1Waterbury, Conn. 32 26 6 - - - 2Worcester, Mass. 46 31 10 4 - 1 5
MID. ATLANTIC 1,987 1,361 402 150 36 28 95Albany, N.Y. 55 40 7 6 2 - 5Allentown, Pa. 18 12 1 5 - - 1Buffalo, N.Y. 82 58 16 5 - 3 10Camden, N.J. 26 16 7 2 1 - 4Elizabeth, N.J. 10 6 3 1 - - -Erie, Pa. 47 34 9 4 - - 3Jersey City, N.J. 55 40 9 4 - 2 -New York City, N.Y. 1,026 703 207 76 15 15 39Newark, N.J. 50 27 15 3 4 1 7Paterson, N.J. 13 6 5 1 1 - -Philadelphia, Pa. 212 125 54 25 7 1 7Pittsburgh, Pa.§ 30 22 5 1 2 - 2Reading, Pa. 25 19 4 - - 2 -Rochester, N.Y. 143 109 23 8 2 1 11Schenectady, N.Y. 11 9 2 - - - 2Scranton, Pa. 25 20 5 - - - -Syracuse, N.Y. 99 74 15 5 2 3 4Trenton, N.J. 48 31 13 4 - - -Utica, N.Y. 12 10 2 - - - -Yonkers, N.Y. U U U U U U U
E.N. CENTRAL 2,036 1,336 441 132 51 70 116Akron, Ohio 57 38 15 3 1 - 5Canton, Ohio 33 26 5 1 1 - 2Chicago, Ill. 367 219 94 28 11 9 20Cincinnati, Ohio 82 54 16 9 1 2 5Cleveland, Ohio 122 77 26 9 3 7 7Columbus, Ohio 216 142 46 12 5 11 15Dayton, Ohio 98 70 18 4 5 1 4Detroit, Mich. 222 129 63 19 3 8 15Evansville, Ind. 49 30 10 5 4 - 3Fort Wayne, Ind. 80 63 13 2 - 2 5Gary, Ind. 17 9 6 - - 2 1Grand Rapids, Mich. 36 25 5 3 1 2 5Indianapolis, Ind. 230 147 47 16 10 10 12Lansing, Mich. 45 30 9 5 1 - 1Milwaukee, Wis. 109 69 28 6 2 4 5Peoria, Ill. 31 25 1 1 - 4 2Rockford, Ill. 55 43 7 1 - 4 3South Bend, Ind. 43 34 5 2 - 2 1Toledo, Ohio 85 58 17 6 3 1 5Youngstown, Ohio 59 48 10 - - 1 -
W.N. CENTRAL 541 378 106 36 12 9 28Des Moines, Iowa 126 80 34 8 3 1 4Duluth, Minn. 23 18 3 2 - - 1Kansas City, Kans. 21 13 5 2 1 - 2Kansas City, Mo. 105 78 19 4 4 - 6Lincoln, Nebr. 35 29 5 1 - - 2Minneapolis, Minn. 75 43 19 7 2 4 2Omaha, Nebr. 59 45 8 4 1 1 4St. Louis, Mo. U U U U U U USt. Paul, Minn. 56 41 6 7 - 2 5Wichita, Kans. 41 31 7 1 1 1 2
S. ATLANTIC 1,134 704 264 98 33 35 48Atlanta, Ga. 146 89 38 9 6 4 3Baltimore, Md. 140 79 40 14 3 4 12Charlotte, N.C. 85 46 23 11 4 1 1Jacksonville, Fla. 131 92 25 7 3 4 6Miami, Fla. 113 75 23 10 2 3 4Norfolk, Va. 67 37 13 8 4 5 3Richmond, Va. 45 23 12 6 3 1 1Savannah, Ga. 55 36 14 3 - 2 1St. Petersburg, Fla. 68 41 16 6 2 3 3Tampa, Fla. 160 111 27 14 1 7 8Washington, D.C. 101 59 29 7 5 1 3Wilmington, Del. 23 16 4 3 - - 3
E.S. CENTRAL 772 478 188 62 26 17 52Birmingham, Ala. 165 112 29 13 7 3 14Chattanooga, Tenn. 68 46 13 7 2 - 3Knoxville, Tenn. 92 59 23 4 5 1 1Lexington, Ky. 69 41 20 3 1 4 7Memphis, Tenn. 116 70 32 10 1 3 9Mobile, Ala. 60 37 14 5 3 1 4Montgomery, Ala. 49 27 15 5 2 - 4Nashville, Tenn. 153 86 42 15 5 5 10
W.S. CENTRAL 1,423 890 302 123 69 39 65Austin, Tex. 73 49 21 1 - 2 5Baton Rouge, La. U U U U U U UCorpus Christi, Tex. 72 51 14 5 1 1 -Dallas, Tex. 207 137 36 24 6 4 10El Paso, Tex. 86 68 14 2 2 - 1Ft. Worth, Tex. 104 62 31 9 2 - 4Houston, Tex. 439 236 91 48 45 19 23Little Rock, Ark. 69 51 11 2 3 2 1New Orleans, La. 41 23 15 3 - - -San Antonio, Tex. 194 121 40 17 9 7 11Shreveport, La. 47 29 11 5 - 2 9Tulsa, Okla. 91 63 18 7 1 2 1
MOUNTAIN 898 555 159 55 25 19 48Albuquerque, N.M. 55 40 10 3 2 - 2Boise, Idaho 42 32 7 - 2 1 4Colo. Springs, Colo. 80 48 16 13 3 - 3Denver, Colo. 106 67 22 7 2 8 8Las Vegas, Nev. 236 157 53 16 2 8 11Ogden, Utah 33 25 6 2 - - -Phoenix, Ariz. 90 4 - 1 - - 7Pueblo, Colo. 25 19 4 2 - - -Salt Lake City, Utah 97 65 14 7 9 2 5Tucson, Ariz. 134 98 27 4 5 - 8
PACIFIC 1,447 1,011 289 84 39 24 108Berkeley, Calif. 12 8 1 1 1 1 2Fresno, Calif. 163 115 31 12 5 - 15Glendale, Calif. 17 15 2 - - - -Honolulu, Hawaii 80 60 15 3 1 1 8Long Beach, Calif. 82 60 17 2 2 1 5Los Angeles, Calif. 276 199 51 12 6 8 17Pasadena, Calif. U U U U U U UPortland, Oreg. 214 139 51 14 4 6 14Sacramento, Calif. U U U U U U USan Diego, Calif. 176 122 39 7 7 1 17San Francisco, Calif. U U U U U U USan Jose, Calif. 143 95 26 16 4 2 17Santa Cruz, Calif. 29 23 6 - - - 1Seattle, Wash. 109 73 22 9 4 1 5Spokane, Wash. 47 32 9 3 2 1 3Tacoma, Wash. 99 70 19 5 3 2 4
TOTAL 10,792¶ 7,079 2,274 774 303 260 604
U: Unavailable. -:No reported cases.* Mortality data in this table are voluntarily reported from 122 cities in the United States, most of which have populations of >100,000. A death is reported by the place of its
occurrence and by the week that the death certificate was filed. Fetal deaths are not included.† Pneumonia and influenza.§ Because of changes in reporting methods in this Pennsylvania city, these numbers are partial counts for the current week. Complete counts will be available in 4 to 6 weeks.¶ Total includes unknown ages.
TABLE III. Deaths in 122 U.S. cities,* week ending September 27, 2003 (39th Week)All causes, by age (years) All causes, by age (years)
All P&I† All P&I†
Reporting Area Ages >65 45-64 25-44 1-24 <1 Total Reporting Area Ages >65 45-64 25-44 1-24 <1 Total
MMWR
The Morbidity and Mortality Weekly Report (MMWR) Series is prepared by the Centers for Disease Control and Prevention (CDC) and is available free of chargein electronic format and on a paid subscription basis for paper copy. To receive an electronic copy each week, send an e-mail message to [email protected]. Thebody content should read SUBscribe mmwr-toc. Electronic copy also is available from CDC’s World-Wide Web server at http://www.cdc.gov/mmwr or from CDC’sfile transfer protocol server at ftp://ftp.cdc.gov/pub/publications/mmwr. To subscribe for paper copy, contact Superintendent of Documents, U.S. GovernmentPrinting Office, Washington, DC 20402; telephone 202-512-1800.
Data in the weekly MMWR are provisional, based on weekly reports to CDC by state health departments. The reporting week concludes at close of business onFriday; compiled data on a national basis are officially released to the public on the following Friday. Address inquiries about the MMWR Series, including materialto be considered for publication, to Editor, MMWR Series, Mailstop C-08, CDC, 1600 Clifton Rd., N.E., Atlanta, GA 30333; telephone 888-232-3228.
All material in the MMWR Series is in the public domain and may be used and reprinted without permission; citation as to source, however, is appreciated.
All MMWR references are available on the Internet at http://www.cdc.gov/mmwr. Use the search function to find specific articles.
Use of trade names and commercial sources is for identification only and does not imply endorsement by the U.S. Department of Health and Human Services.
References to non-CDC sites on the Internet are provided as a service to MMWR readers and do not constitute or imply endorsement of these organizations ortheir programs by CDC or the U.S. Department of Health and Human Services. CDC is not responsible for the content of these sites. URL addresses listed inMMWR were current as of the date of publication.
✩ U.S. Government Printing Office: 2004-633-140/69148 Region IV ISSN: 0149-2195
952 October 3, 2003