week of december 17, 2018 weekly relative value
TRANSCRIPT
Weekly Relative Value
Tom Slefinger is Senior Vice President, Director of Institutional Fixed Income Sales at Balance Sheet Solutions.
www.balancesheetsolutions.org
WEEK OF DECEMBER 17, 2018
The “R” Word: Recession
Over the past 12 months, U.S. real GDP growth is expected to have grown by about 3.25%. If so, this will have been the best growth rate in the U.S. economy in a decade. Unfortunately, as we ring out the old and ring in the new, we may have seen the zenith in economic growth for this cycle.
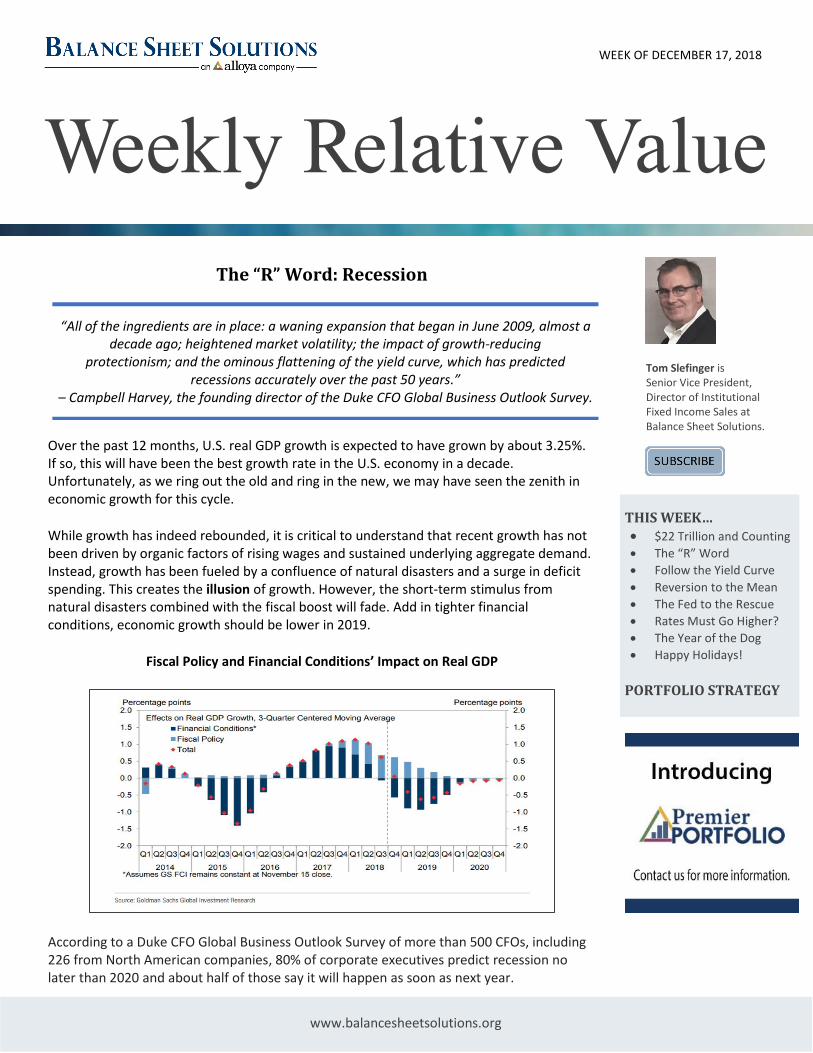
While growth has indeed rebounded, it is critical to understand that recent growth has not been driven by organic factors of rising wages and sustained underlying aggregate demand. Instead, growth has been fueled by a confluence of natural disasters and a surge in deficit spending. This creates the illusion of growth. However, the short-term stimulus from natural disasters combined with the fiscal boost will fade. Add in tighter financial conditions, economic growth should be lower in 2019.
Fiscal Policy and Financial Conditions’ Impact on Real GDP
According to a Duke CFO Global Business Outlook Survey of more than 500 CFOs, including 226 from North American companies, 80% of corporate executives predict recession no later than 2020 and about half of those say it will happen as soon as next year.
THIS WEEK… • $22 Trillion and Counting • The “R” Word
• Follow the Yield Curve
• Reversion to the Mean
• The Fed to the Rescue
• Rates Must Go Higher?
• The Year of the Dog
• Happy Holidays!
PORTFOLIO STRATEGY
“All of the ingredients are in place: a waning expansion that began in June 2009, almost a decade ago; heightened market volatility; the impact of growth-reducing
protectionism; and the ominous flattening of the yield curve, which has predicted recessions accurately over the past 50 years.”
– Campbell Harvey, the founding director of the Duke CFO Global Business Outlook Survey.

BALANCE SHEET SOLUTIONS WEEKLY RELATIVE VALUE | 2
www.balancesheetsolutions.org
In stark contrast to all the “animal spirits” of this time a year ago, a just released survey by NBC/Wall Street Journal (taken from December 9-12) showed just 28% of American households have a positive economic outlook heading into 2019, while 33% predict things will get worse. This is a downbeat assessment we have not seen in about six years. At the turn of the year, those numbers were sitting at 35% and 20%, respectively.
The New York Fed’s recession model (based on the yield curve) rose from 14.1% in October to 15.8% in November —where it was in November 2008 (it was below 11% a year ago). Note that this metric doesn’t peak at 100% before the recession, but rather 30%-40%. So, on a “normalized” basis, it is basically saying that recession odds are between one-third and fifty-fifty odds.
The St. Louis Fed’s recession model jumped last month to its highest level since the angst of March 2016. It is right where it was in September 2007, June 2000 (recession nine months hence), April1990 and December 1980.
Overall these themes are consistent story of rising recession risks for 2019.
$22 TRILLION AND COUNTING
On the fiscal side, U.S. national debt will likely hit the $22 trillion-mark next month. When Barack Obama entered the White House in January 2008, the U.S. was $10.6 trillion in debt, and so we have added $11.2 trillion of new debt to that total in less than 11 years. It doesn’t take a math genius to figure out that we have added an average of a trillion dollars plus a year to the national debt for more than a decade.
But instead of getting our insatiable appetite for debt under control, Congress is actually accelerating our spending. When President Trump took office, he embraced tax cuts but rejected structural spending overhauls. According to the Committee for a Responsible Federal Budget, legislation passed in fiscal year 2018 accounts for almost half the $1 trillion projected budget deficit for 2019.
“I think it’s the three monkeys in Washington — I hear no evil, I speak no evil, I see no evil — about the reality of $1 trillion deficits that will frankly explode in the economic downturn.”
– Mark Sanford, South Carolina Republican Representative

BALANCE SHEET SOLUTIONS WEEKLY RELATIVE VALUE | 3
www.balancesheetsolutions.org
We have been spending far, far more money than we have been bringing in, and that has been propping up our economy. But we are progressively making our long-term problems much worse, and there is no way that we can sustain this Ponzi scheme for much longer. We have painted ourselves into a corner.
The best-case scenario is that current deficits are really eating up domestic investment — which they are — and will continue to slow our economic growth. Worst-case scenario or scariest scenario, we’re heading for a debt-driven financial crisis.
Out of Control Spending
Moving on. Consumers are once again heavily leveraged with sub-prime auto loans, mortgages and student debt. When the recession hits, the reduction in employment will further damage what remains of their consumption ability. Further, the downturn will increase the strain on an already burdened government welfare system as an insufficient number of individuals paying into the scheme is being absorbed by a swelling pool of aging baby boomers now forced to draw on it. Yes, more government funding will be required to solve that problem as well. As debts and deficits swell in the coming years, the negative impact to economic growth will continue.
And let’s not forget Corporate America. Last week, Janet Yellen discussed the issue of leverage in the economy stating that companies are taking on too much debt and could be in trouble should some unexpected trouble hit the economy or markets.
U.S. companies have re-leveraged their balance sheets, tempted by historically low borrowing costs. Indeed, U.S. corporate debt as a percentage of GDP is now at a record level, well above the previous peak in 2008. A bigger concern is the degraded credit profile of the corporate universe, which has been accelerating. To wit, the number of A to BBB downgrades doubled to a whopping $176 billion in the fourth quarter, just shy of the all-time high hit in the fourth quarter of 2015. With several weeks still left this quarter, it is likely that a new downgrade record will soon be hit.
Currently, more than 50% of the investment grade debt carries a credit rating of BBB. If corporates were to be faced with the combined challenge of the increased cost of borrowing and potentially lower operating profits in an economic downturn, then it is likely that some would struggle. In other words, with rates rising, economic growth slowing (debt is
“Corporate indebtedness is now quite high, and I think it’s a danger that if there’s something else that causes a downturn, that high levels of corporate leverage could prolong the downturn and lead to lots of bankruptcies in the
non-financial corporate sector.” – Former Fed Chair Janet Yellen
BALANCE SHEET SOLUTIONS WEEKLY RELATIVE VALUE | 4
www.balancesheetsolutions.org
serviced from revenues), and the health of balance sheets deteriorating (BBB is one notch above “junk”), the risk of an “event-driven” credit crisis is real.
Non-Financial Debt as % of GDP
THE “R” WORD
In the U.S., there are no imminent signs of a recession; however, as we head into 2019, quantitative tightening (QT) is expected to accelerate. QT, combined with expectations of further interest rate increases from the Fed, could drive the economy to a standstill next year.
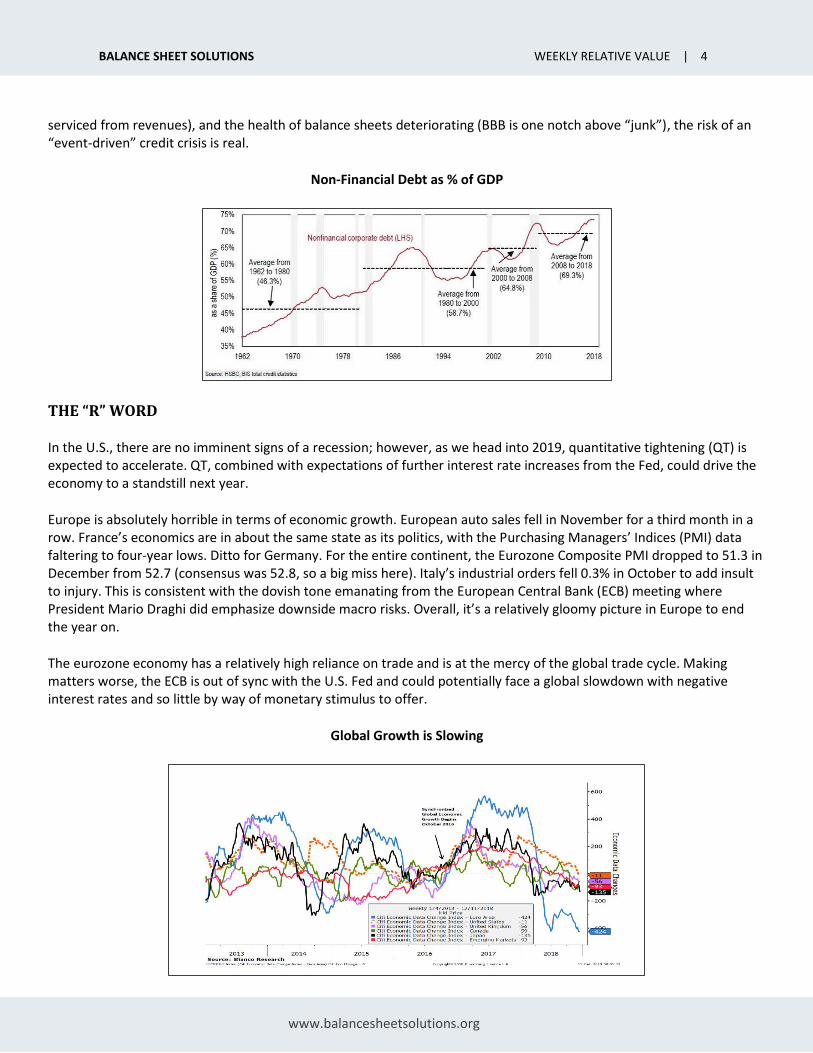
Europe is absolutely horrible in terms of economic growth. European auto sales fell in November for a third month in a row. France’s economics are in about the same state as its politics, with the Purchasing Managers’ Indices (PMI) data faltering to four-year lows. Ditto for Germany. For the entire continent, the Eurozone Composite PMI dropped to 51.3 in December from 52.7 (consensus was 52.8, so a big miss here). Italy’s industrial orders fell 0.3% in October to add insult to injury. This is consistent with the dovish tone emanating from the European Central Bank (ECB) meeting where President Mario Draghi did emphasize downside macro risks. Overall, it’s a relatively gloomy picture in Europe to end the year on.
The eurozone economy has a relatively high reliance on trade and is at the mercy of the global trade cycle. Making matters worse, the ECB is out of sync with the U.S. Fed and could potentially face a global slowdown with negative interest rates and so little by way of monetary stimulus to offer.
Global Growth is Slowing

BALANCE SHEET SOLUTIONS WEEKLY RELATIVE VALUE | 5
www.balancesheetsolutions.org
And China – whose recent economic data have been on the verge of disaster – is closely watched as the spark that could light the next global economic and financial conflagration. Note: it was China’s record credit burst in 2009 that dragged the world out of a global recession.
Which brings us to the latest Chinese data, which showed that economic activity has further disappointed with industrial production missing and consumption/retail sales slowing. Of note, Chinese retail activity grew by just 8.1% in November. You have to go back 15 years to find something less.
Troubles in China
And unlike the 2008-2009 financial crisis, China simply has no monetary room with which to kick start any domestic growth. Therefore, the Chinese government is left between the rock and the hard place.
The global economy, despite all officials’ protestations everywhere, has never once picked up toward recovery. Global trade growth also slowed markedly, running about one-third lower than earlier in the year.
No ocean is large enough to insulate the economy from what is happening abroad. And no forecasting model adequately captures the spillovers and spillbacks between the U.S. economy and the rest of the world.
I should stress that the Fed does not see a recession on the horizon. Then again, they never have. Wall Street’s ever-bullish economist crowd does not see one either. The consensus forecast of 89 economists predict 2.6% growth in 2019. But let me remind readers that, according to a study by the International Monetary Fund, not one of the 49 recessions around the world in 2009 was predicted. And only two of 60 recessions in the 1990s had been predicted a year in advance. In other words, relying on the Fed and/or Wall Street forecasts, while making one feel better, may not be a good investment strategy.
What causes the next correction is always unknown until after the fact. However, there are ample warnings that suggest the current cycle may be closer to its inevitable conclusion than many currently believe. There are many factors that can, and will, contribute to the eventual correction.
FOLLOW THE YIELD CURVE
In 1996, New York Fed economists Arturo Estrella and Frederic Mishkin found the yield curve is most predictive of recession a year or so ahead of time. In fact, they concluded an inverted yield curve was the only useful predictor of recessions. Examining all the data from 1960-1995, they calculated the probability a recession would occur four quarters ahead, based on the spread between three-month and 10-year Treasury securities.

BALANCE SHEET SOLUTIONS WEEKLY RELATIVE VALUE | 6
www.balancesheetsolutions.org
And here’s the reason: Banks – the main driver of our financialized society – still make at least some of their money by borrowing short and lending long. In normal times, long-term rates are higher than short-term to compensate lenders for tying their money up for longer periods. The banks earn that spread. When the yield curve flattens and then inverts – that is, when short rates exceed long rates – banks lose the ability to make money this way. They lend less, financial conditions tighten, and the economy weakens. Simple as that.
This chart shows the spread between 10-year and one-year Treasury yields. The gray vertical bars are recessions. You can see how the spread dropped below the 0% line right before each one and is now close to that point again. But notice also how long it stayed inverted before the last recession, and how far in advance. The 10-year/1-year spread dropped below zero in January 2006, came back above for a little bit, stayed there and began to move higher when the recession finally started. The same happened in 2000. In fact, by the time the actual recession arrives, the yield curve can resume a normal pattern.
Follow the Curve
Here’s a slightly different chart using the 10-year/2-year yields. This is the “tens and twos” spread traders usually watch.
Yields are supposed to reflect risk, and risk grows with time. The chance something bad will happen in the next five years is higher than the chance something equally bad will happen in the next year. Lenders (i.e. bond investors) should demand a higher yield as compensation for that higher risk. Presently they aren’t.
Reuters conducted a poll of bond managers: Thirty of more than 40 strategists expect the 2s/10s yield spread to become negative in the next 12 months, including 15 who said within the next six months. Half of 26 strategists in the poll expect a U.S. recession to follow that inversion within the next two years.

BALANCE SHEET SOLUTIONS WEEKLY RELATIVE VALUE | 7
www.balancesheetsolutions.org
While there is no set pattern on how long it takes for a recession to hit once the yield curve has flipped, the table below shows how long it’s taken during each of the last recessions from the first yield curve inversion until the actual start of the recession.
So, about the “R” word. Yes, there is a lot of talk about a recession. That’s a good thing, not a bad thing. Obviously, none of us wants a recession to occur, but they happen like mother nature. It’s the business cycle. Since 1950, the U.S. economy has had 10 recessions. Further, we are all in the risk management business and it’s important to understand what risks lie out there. Let’s face it: the good news takes care of itself. It’s the bad stuff that can really hurt and if you are not prepared it can sneak up on you.
REVERSION TO THE MEAN
There is one important truth that is indisputable, irrefutable, and absolutely undeniable: “mean reversions” are the only constant in the financial markets over time.
So, just how big of a correction would be required to revert equity valuations back to long-term means?
The Shiller Price-to-Earnings (PE) ratio – invented by Yale Professor Robert Shiller – is a valuation measure. However, the Shiller PE tries to work around the shortcomings of the current PE ratio – either inappropriate earnings or over- or undervaluation – by averaging results over a longer time frame. That means neither temporary dips in earnings (for example, during the Great Recession) nor investor over-optimism (say, during the Tech Bubble) or over-pessimism will be inappropriately weighted in a holistic view of the market.
“Stock prices have reached what looks like a permanently high plateau. I do not feel there will be soon if ever a 50- or 60-point break from present levels, such as they have predicted. I expect to see the stock market a good deal
higher within a few months.” – Dr. Irving Fisher, economist at Yale University, 1929

BALANCE SHEET SOLUTIONS WEEKLY RELATIVE VALUE | 8
www.balancesheetsolutions.org
Today’s CAPE ratio suggests that stocks are quite rich by historical standards.
Stocks Are Overvalued
Let’s look at another valuation metric. The “Price-to-Revenue” ratio is currently higher than at any point in previous market history. Given that the longer-term norm for the S&P 500 Price-to-Sales ratio is roughly 1.0, a retreat back towards those levels, as was seen in 2000 and 2008, each required a price decline of 50% or more.
S&P 500 Price-to-Sales
As shown below, if markets revert to their long-term mean, the range of potential reversions runs from 36% to more than 54%. Many say this cannot happen. But the bubble has burst twice since 2000 and both reversions resulted in 50% declines.
“Since 1877, there are 1,654 monthly measurements of Cyclically Adjusted Price-to- Earnings (CAPE 10). Of these, 82 or only about 5%, have been the same or greater than current CAPE levels (30.5). Other than a few instances over the last two years and two others which occurred in 1929, the rest
occurred during the late 1990’s tech boom. The graph below charts the percentage of time the market has traded at various ranges of CAPE levels.”

BALANCE SHEET SOLUTIONS WEEKLY RELATIVE VALUE | 9
www.balancesheetsolutions.org
That said, it is unlikely that a 50-60% correction would happen outside of the onset of a recession. But considering we are already pushing the longest economic growth cycle in modern American history, such a risk should not be ignored.
Reversion to the Mean?
Today, household equity ownership to disposable income is the highest ever. Should the equity markets decline significantly, the wealth effect will work in reverse. Consumer confidence and consumption will fall further, eroding economic growth and pushing the economy further into recession.
THE FED TO THE RESCUE
After a decade of central bank interventions, it has become a commonly held belief the Fed will quickly jump in to forestall a market decline at every turn. The problem is, the government has already spent its fiscal bullets and the Fed will not have the luxury of cutting rates by 500 basis points as it has done, on average, in the past.
Even after recent U.S. interest rate hikes, that much without going negative. In Europe and Japan, where rates are already less than zero, easing would require substantially negative levels, which would likely be politically impossible. Even current levels are controversial. Negative rates penalize savers and weaken the banking system.
BALANCE SHEET SOLUTIONS WEEKLY RELATIVE VALUE | 10
www.balancesheetsolutions.org
During Recessions the Fed Cuts Rates By 500bps On Average
Federal Funds Rate (%)
Start End Start Level% End Level% Change
Oct-57 May-58 3.50 0.57 -2.93
May-60 Jul-61 3.83 1.18 -2.65
Nov-66 Jul-67 5.74 3.79 -1.95
Feb-70 Feb-71 8.95 6.03 -2.92
Sep-71 Feb-72 5.53 3.30 -2.23
Jul-74 May-75 12.91 5.22 -7.69
Apr-80 Jul-80 17.43 9.01 -8.42
Jul-81 Dec-81 19.10 12.44 -6.66
Aug-84 Dec-84 11.50 8.13 -3.38
May-89 Sep-92 9.81 3.00 -6.81
Dec-00 Jun-03 6.50 1.00 -5.50
Aug-07 Dec-08 5.25 0.13 -5.13
Average 9.17 4.48 -4.69
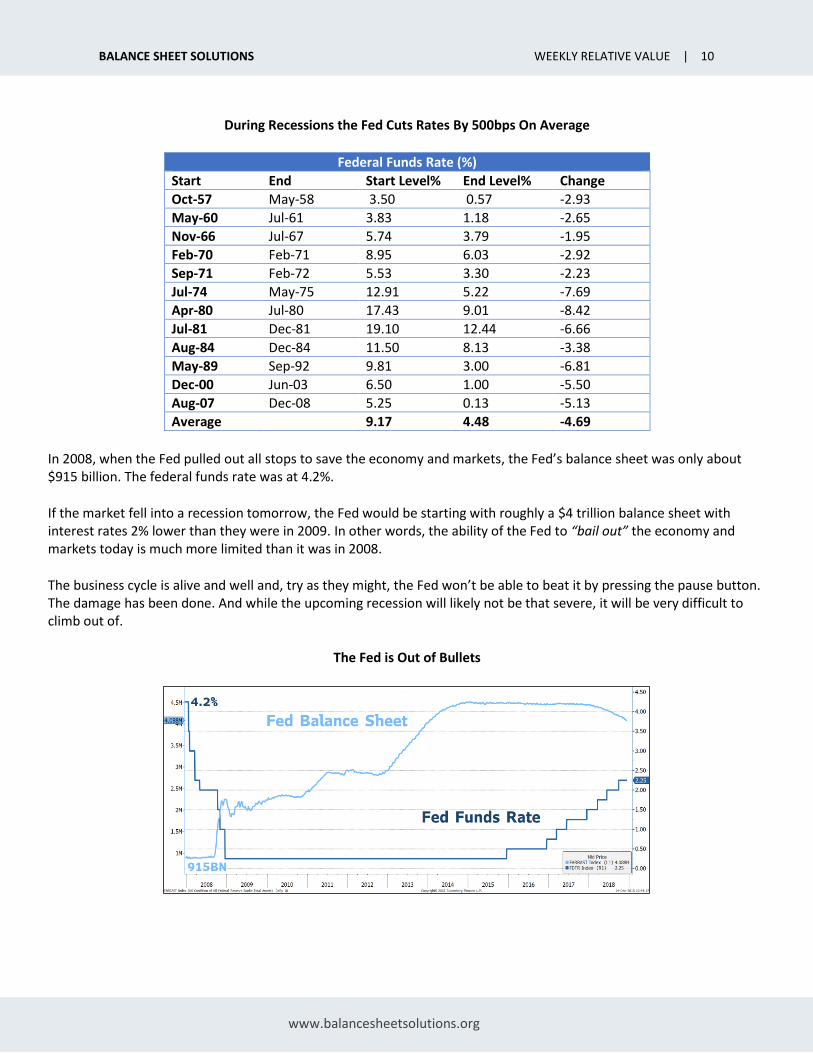
In 2008, when the Fed pulled out all stops to save the economy and markets, the Fed’s balance sheet was only about $915 billion. The federal funds rate was at 4.2%.
If the market fell into a recession tomorrow, the Fed would be starting with roughly a $4 trillion balance sheet with interest rates 2% lower than they were in 2009. In other words, the ability of the Fed to “bail out” the economy and markets today is much more limited than it was in 2008.
The business cycle is alive and well and, try as they might, the Fed won’t be able to beat it by pressing the pause button. The damage has been done. And while the upcoming recession will likely not be that severe, it will be very difficult to climb out of.
The Fed is Out of Bullets

BALANCE SHEET SOLUTIONS WEEKLY RELATIVE VALUE | 11
www.balancesheetsolutions.org
RATES MUST GO HIGHER?
The consensus view is that long-term rates must rise because they are so low. And there have been many revered Wall Street veterans from Bill Gross, Paul Tudor Jones, Ray Dalio and Jeff Gundlach calling for higher rates. But these calls for higher rates and the end of the great bond bull market have been ongoing for years. The fact is, they have been consistently wrong.
As Lance Roberts at Real Investment Advice points out, interest rates can remain low for a very, very long time. As shown in the graph below, when interest rates fell below the long-term median, they remained there for more than 35 years! And, while U.S. rates are below the median today, the duration of that stay is only eight years. If history is any guide, we could stay below the median level for years to come.
Long-Term Rates Can Remain Low for A Long Time
Lance notes that there have been two previous periods in the past that supported rising interest rates over a long period of time. The first was during the turn of the previous century as the country became more accessible via railroads and automobiles, production ramped up for World War I and America began the shift from an agricultural to industrial economy.
The second period occurred post-World War II as America became the “last man standing” as Europe, Russia and Japan were destroyed. America experienced its strongest economic growth as we rebuilt the world.
Fast forward to today. The U.S. economy has never been more leveraged. And rising borrowing costs spread through the entire financial ecosystem like a virus. We have already seen the impact of higher rates on housing and autos. There is limited ability for rates to rise in a sustained manner before you push the economy back into recession. Of course, you don’t have to look much further than Japan for a clear example.

BALANCE SHEET SOLUTIONS WEEKLY RELATIVE VALUE | 12
www.balancesheetsolutions.org
Is the U.S. Becoming Japan?
THE YEAR OF THE DOG
As of Friday’s, close, the major U.S. equity indices are in correction (down 10%) or worse...
• Dow Jones Industrial Average -10.5% from highs
• S&P 500 -11.3% from highs, lowest weekly close since March 2018
• Nasdaq Composite -14.6% from highs
• Russell 2000 -18.5% from highs, lowest since September 2017
• The S&P Banks and Financials indices are both down over 20% from their highs (in bear market)
• FANG stocks are down 23% from their highs
• Apple has been hammered (down 29% from the highs)
Unless Santa shows up soon and very soon, virtually every asset class will have suffered “negative” returns in 2018. In fact, 90% of asset classes have negative year-to-date returns, which is the highest such percentage since 1900!
The last time both equity and bond market returns were both negative in the same calendar year was in 1969. And since 1928, this condition has only happened 3% of the time.
The last time cash outperformed BOTH stocks and bonds was in 1994. Again, since 1928 this has only happened 13% of the time.
Now you know why 2018 was the Chinese Year of the Dog — and as we have found out, this canine’s bite ended up being worse than its bark!
But should this be surprising?
As I have mentioned more than a few times, virtually every asset in the world has been distorted and overpriced due to the massive, unprecedented and coordinated quantitative easing and zero interest rate policy implemented by the central banks around the world. Cheap money had inflated the prices of all manner of assets, from real estate to cryptocurrencies to risky bonds to equities, while imposing an unnatural tranquility on all.
“Equity markets have predicted nine of the past five recessions – Economist Paul Samuleson

BALANCE SHEET SOLUTIONS WEEKLY RELATIVE VALUE | 13
www.balancesheetsolutions.org
The theme that I have focused on throughout most of 2018 centered on one issue: How would asset markets react to the withdrawal of liquidity, which had been provided in copious quantities in the decade since the great financial crisis a decade earlier?
As shown below, there has been a strong positive correlation between money printing and asset prices. But what has propped up the markets could now work in reverse as the liquidity is drained from the markets. As central banks have tightened their monetary policies, equity returns have been the victims.
Which begs the question: will the economy and markets be able to stand on their own two feet without life support from the Fed?
Can the Markets Stand on Their Own?
MARKET OUTLOOK AND PORTFOLIO STRATEGY
The probability of a U.S. recession over the next 12 months has risen. Even if a recession does not happen, U.S. growth will slow markedly in 2019 due to the following:
• The lagged impact from the Fed’s tightening program
• Fiscal policy stimulus withdrawal
• The negative wealth effect from sliding equity prices and slowing home values
• The looming corporate deleveraging cycle and hit to capital spending
• The negative impacts from trade wars
There might be justification for the Federal Open Market Committee (FOMC) to skip a rate boost this week, given the rising uncertainty about global growth and trade policy, as well as jittery global markets, were it not for one thing: President Donald Trump’s continuing criticism of Fed hikes.
The Federal Reserve holds it last meeting of 2018 on Tuesday and Wednesday. The rate decision will be followed by a press conference.
“We don’t think Chairman Jay Powell pays much attention to the President, but cynics in the bond market and elsewhere would howl that a stand-pat Fed has become politicized.”
– Greg Valliere, Horizon Investments Chief Global Strategist

BALANCE SHEET SOLUTIONS WEEKLY RELATIVE VALUE | 14
www.balancesheetsolutions.org
The federal fund futures are implying a 25-basis-point hike to 2.25%-2.5% this week with more than 70% probability. But the key will be what the panel foresees for 2019. That will be revealed in the FOMC’s projections for the economy and expectations for the fed funds at year-end, embodied in the so-called dot plot graph. The previous dot plot envisioned four quarter-point hikes (including this week’s all-but-certain boost) by the end of 2019, to a median projection of 3.1%. But those guesses were made in September, and more than likely, the update will show fewer hikes for next year.
Economists polled by The Wall Street Journal anticipated two more rate increases in 2019, with the first coming either in March or June. The FOMC’s dots very well could fall into line with the economists’ thinking.
Yet the federal funds futures market — which has proven to be far more prescient than the dot plot or most economists — now sees only one additional hike in 2019 and not until the September 17-18 meeting with greater than a 50% probability. Regardless, Fed Chairman Jerome Powell’s post-meeting press conference will be must-see TV for economy watchers and investors alike.
My view is Fed policy changes in 2019 are likely to be more “data dependent.” Lower-than-anticipated job growth and inflation could lead to fewer rate hikes than the FOMC’s current median projection of three 25-basis-point rate increases. Stronger growth and higher-than-projected inflation could lead to a faster pace of policy tightening than currently anticipated by financial markets.
In terms of investment strategy, credit unions should stock up on lower-risk, liquid assets to defend against rising volatility and increased risk of a slowdown in the economy.
HAPPY HOLIDAYS!
This holiday season, the team at Balance Sheet Solutions and Alloya Corporate would like to express our sincerest appreciation for the trust you have placed in us. I assure you, we do not take it for granted.
I also want to take this time to personally thank everyone for their readership of the Weekly Relative Value over the past year and beyond. It’s been a memorable year and I’m certain that the new year will bring many unexpected twists and turns as well.
Wishing everyone a wonderful holiday season and new year with family and friends!
This will be the final edition of the Weekly Relative Value in 2018. The next edition will be published on January 7, 2019!

BALANCE SHEET SOLUTIONS WEEKLY RELATIVE VALUE | 15
www.balancesheetsolutions.org
PREMIER PORTFOLIO
For the first time, Balance Sheet Solutions, LLC credit union clients are now able to perform many of their daily investment activities all in one location, including…
• Access Documents and Reports Easily access key documents, monthly statements and overall market analyses.
• View Portfolio Holdings See current investments online and easily export into a spreadsheet format.
• View and Buy Offerings Review a list of available security offerings and highlighted specials – place “buy” orders right from the convenience of your desk, AND… connect directly into the SimpliCD website to make CD purchases.
• Quickly View Current Rates Stay in the know – view daily rates in the same location where purchase decisions are made.
• Read Daily Commentary & Weekly Relative Value Gain access to educational content that tracks market and economic trends, analyzes key releases and watches ongoing political developments. Understand the impacts of current events on credit unions.
Watch the overview video here: www.alloyacorp.org/premierportfolio
MORE INFORMATION
For more information about credit union investment strategy, portfolio allocation and security selection, please contact the author at [email protected] or (800) 782-2431, ext. 2753.
Tom Slefinger, Senior Vice President, Director of Institutional Fixed Income Sales, and Registered Representative of ISI, has more than 30 years of fixed income portfolio management experience. He has developed and successfully managed various high profile domestic and global fixed income mutual funds. Tom has extensive expertise in trading and managing virtually all types of domestic and foreign fixed income securities, foreign exchange and derivatives in institutional environments.
At Balance Sheet Solutions, Tom is responsible for developing and managing operations associated with institutional fixed income sales. In addition to providing strategic direction, Tom is heavily involved in analyzing portfolios, developing investment portfolio strategies and identifying appropriate sectors and securities with the goal of optimizing investment portfolio performance at the credit union level.
Information contained herein is prepared by ISI Registered Representatives for general circulation and is distributed for general information only. This information does not consider the specific investment objectives, financial situations or needs of any specific individual or organization that may receive this report. Neither the information nor any opinion expressed constitutes an offer, or an invitation to make an offer, to buy or sell any securities. All opinions, prices, and yields contained herein are subject to change without notice. Investors should understand that statements regarding prospects might not be realized. Please contact Balance Sheet Solutions to discuss your specific situation and objectives.