webinar introducing the paygo perform key performance
TRANSCRIPT
WEBINAR
Introducing the PAYGo
PERFORM Key Performance
Indicators
29 June 2021 at 9:00 AM (ET)
2
LOGISTICS
Attendee microphones will
remain muted during the
entire webinar session. To ask questions during the
webinar, please use the Chat box
on the right-hand side of the
Zoom window.
To ensure your question is seen
by the moderator, select
“Everyone” from the drop-down
menu.The webinar recording
will be emailed to all
attendees and registrants
Please keep your
webcam off to
ensure your privacy
and avoid
bandwidth issues
3
Opening Remarks
Send your questions through the chat box
Select “Everyone” from the drop-down menu to
ensure your question is seen by the moderator
Russell Sturm
International Finance Corporation
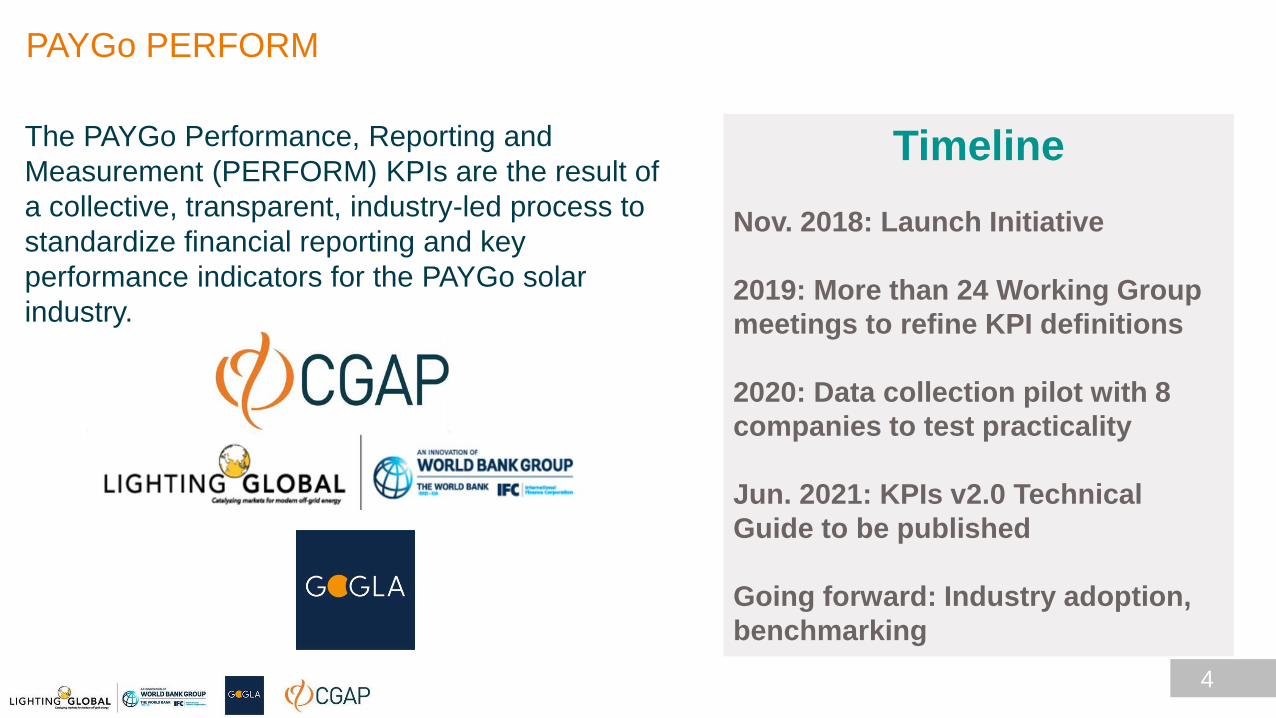
PAYGo PERFORM
4
Timeline
Nov. 2018: Launch Initiative
2019: More than 24 Working Group
meetings to refine KPI definitions
2020: Data collection pilot with 8
companies to test practicality
Jun. 2021: KPIs v2.0 Technical
Guide to be published
Going forward: Industry adoption,
benchmarking
The PAYGo Performance, Reporting and
Measurement (PERFORM) KPIs are the result of
a collective, transparent, industry-led process to
standardize financial reporting and key
performance indicators for the PAYGo solar
industry.
Why PAYGo PERFORM?
5
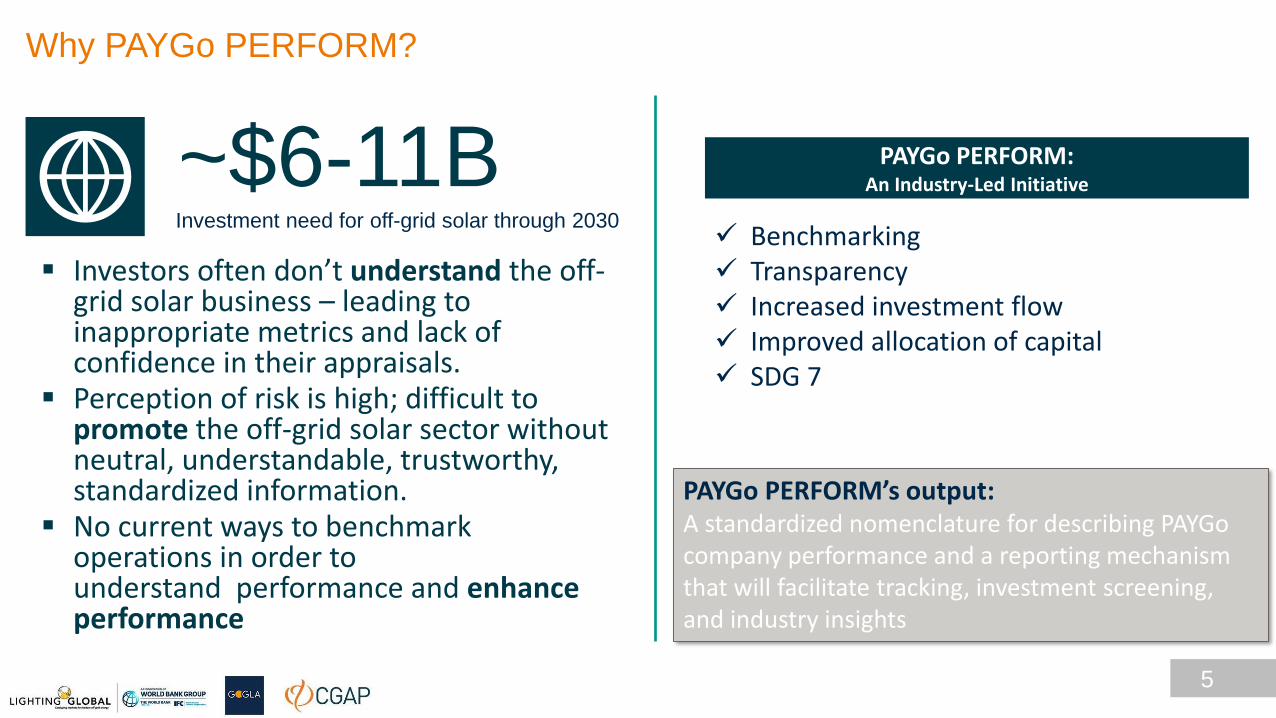
~$6-11BInvestment need for off-grid solar through 2030
▪ Investors often don’t understand the off-grid solar business – leading to inappropriate metrics and lack of confidence in their appraisals.
▪ Perception of risk is high; difficult to promote the off-grid solar sector without neutral, understandable, trustworthy, standardized information.
▪ No current ways to benchmark operations in order to understand performance and enhanceperformance
PAYGo PERFORM’s output: A standardized nomenclature for describing PAYGo company performance and a reporting mechanism that will facilitate tracking, investment screening, and industry insights
✓ Benchmarking✓ Transparency✓ Increased investment flow✓ Improved allocation of capital✓ SDG 7
PAYGo PERFORM:An Industry-Led Initiative
PAYGo PERFORM Use Cases
6
06 01
02
0304
05
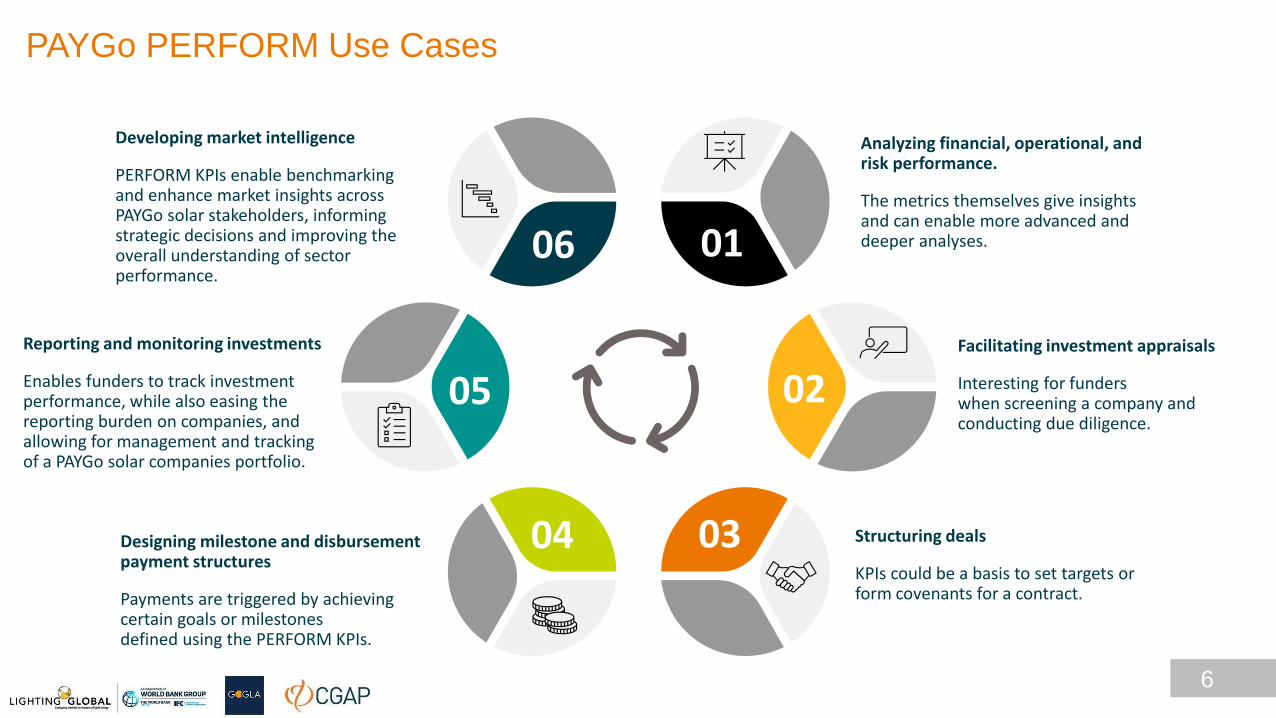
Analyzing financial, operational, and risk performance.
The metrics themselves give insights and can enable more advanced and deeper analyses.
Developing market intelligence
PERFORM KPIs enable benchmarking and enhance market insights across PAYGo solar stakeholders, informing strategic decisions and improving the overall understanding of sector performance.
Facilitating investment appraisals
Interesting for funders when screening a company and conducting due diligence.
Structuring deals
KPIs could be a basis to set targets or form covenants for a contract.
Designing milestone and disbursement payment structures
Payments are triggered by achieving certain goals or milestones defined using the PERFORM KPIs.
Reporting and monitoring investments
Enables funders to track investment performance, while also easing the reporting burden on companies, and allowing for management and tracking of a PAYGo solar companies portfolio.
Introducing the PAYGo PERFORM KPIs
Roan Borst
GOGLA
Kevin Kennedy
International Finance
Corporation
Send your questions through the chat box.
Select “Everyone” from the drop-down menu to
ensure your question is seen by the moderator.
Nicky Khaki
CGAP
7
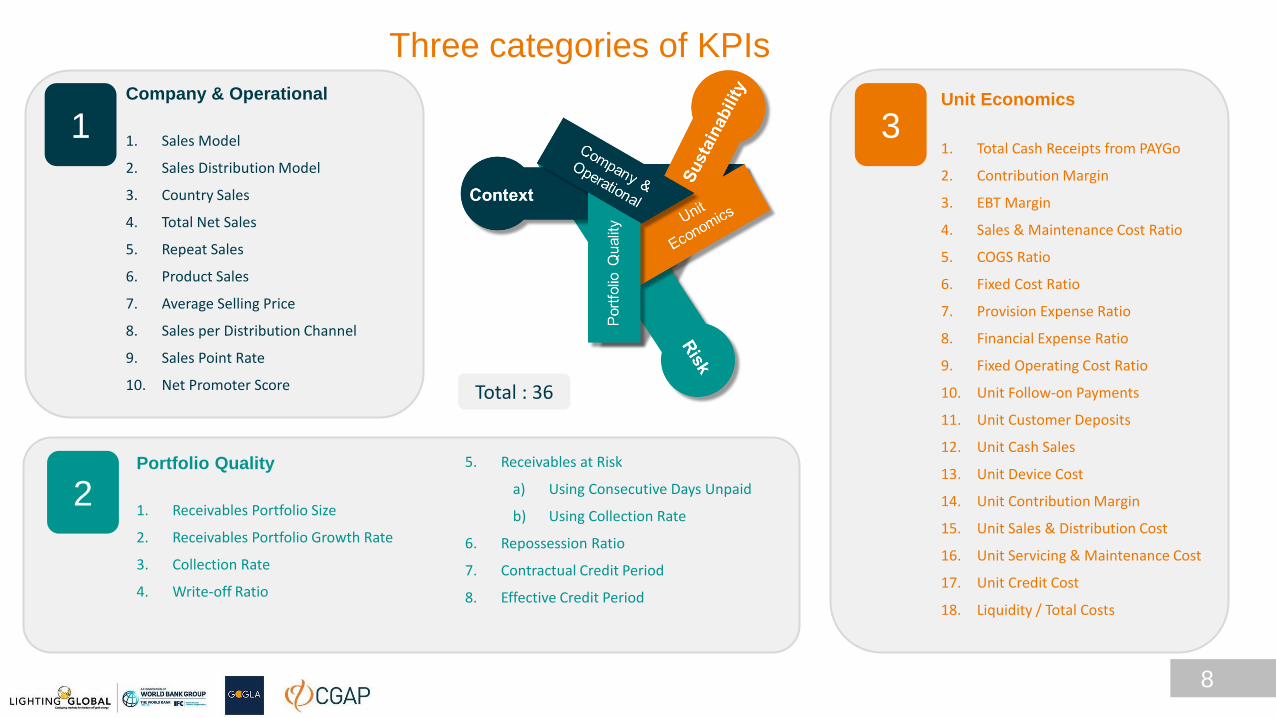
1Company & Operational
1. Sales Model
2. Sales Distribution Model
3. Country Sales
4. Total Net Sales
5. Repeat Sales
6. Product Sales
7. Average Selling Price
8. Sales per Distribution Channel
9. Sales Point Rate
10. Net Promoter Score
3Unit Economics
1. Total Cash Receipts from PAYGo
2. Contribution Margin
3. EBT Margin
4. Sales & Maintenance Cost Ratio
5. COGS Ratio
6. Fixed Cost Ratio
7. Provision Expense Ratio
8. Financial Expense Ratio
9. Fixed Operating Cost Ratio
10. Unit Follow-on Payments
11. Unit Customer Deposits
12. Unit Cash Sales
13. Unit Device Cost
14. Unit Contribution Margin
15. Unit Sales & Distribution Cost
16. Unit Servicing & Maintenance Cost
17. Unit Credit Cost
18. Liquidity / Total Costs
Three categories of KPIs
Portfolio Quality
1. Receivables Portfolio Size
2. Receivables Portfolio Growth Rate
3. Collection Rate
4. Write-off Ratio
5. Receivables at Risk
a) Using Consecutive Days Unpaid
b) Using Collection Rate
6. Repossession Ratio
7. Contractual Credit Period
8. Effective Credit Period
2
Total : 36
8
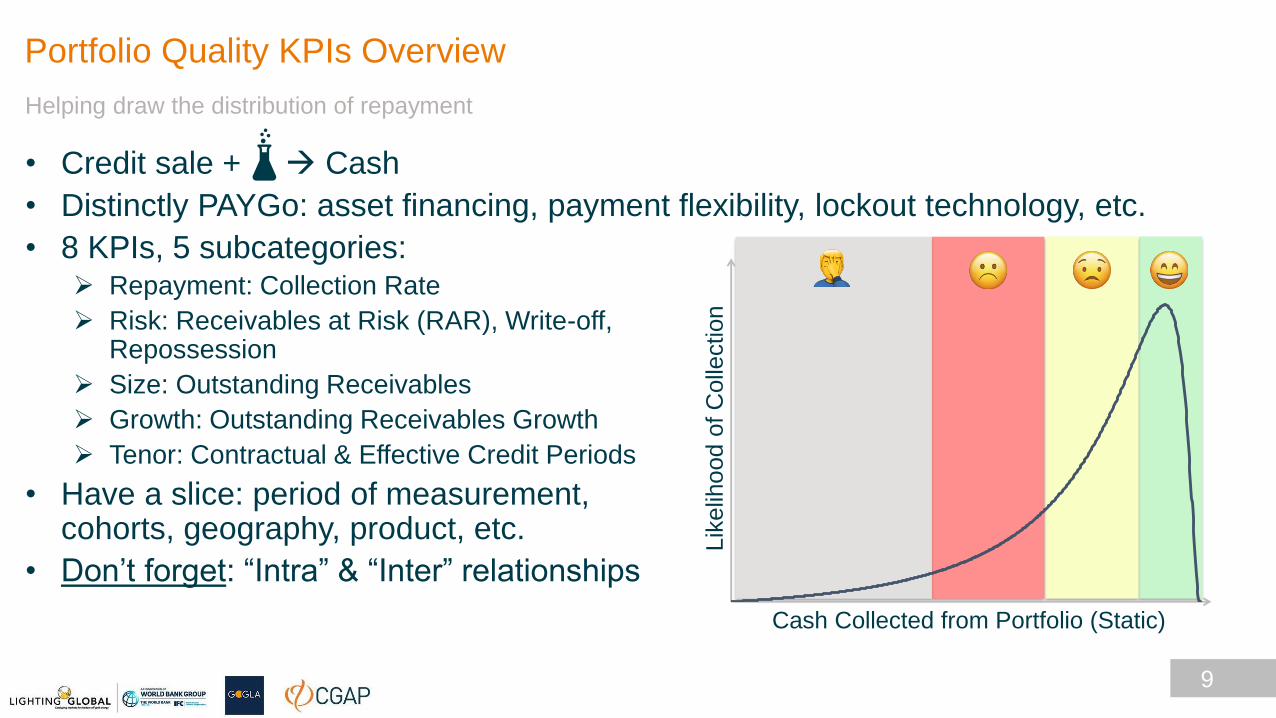
• Credit sale + → Cash
• Distinctly PAYGo: asset financing, payment flexibility, lockout technology, etc.
• 8 KPIs, 5 subcategories: ➢ Repayment: Collection Rate
➢ Risk: Receivables at Risk (RAR), Write-off, Repossession
➢ Size: Outstanding Receivables
➢ Growth: Outstanding Receivables Growth
➢ Tenor: Contractual & Effective Credit Periods
• Have a slice: period of measurement, cohorts, geography, product, etc.
• Don’t forget: “Intra” & “Inter” relationships
9
Lik
elih
ood o
f C
olle
ction
Cash Collected from Portfolio (Static)
Helping draw the distribution of repayment
Portfolio Quality KPIs Overview
10
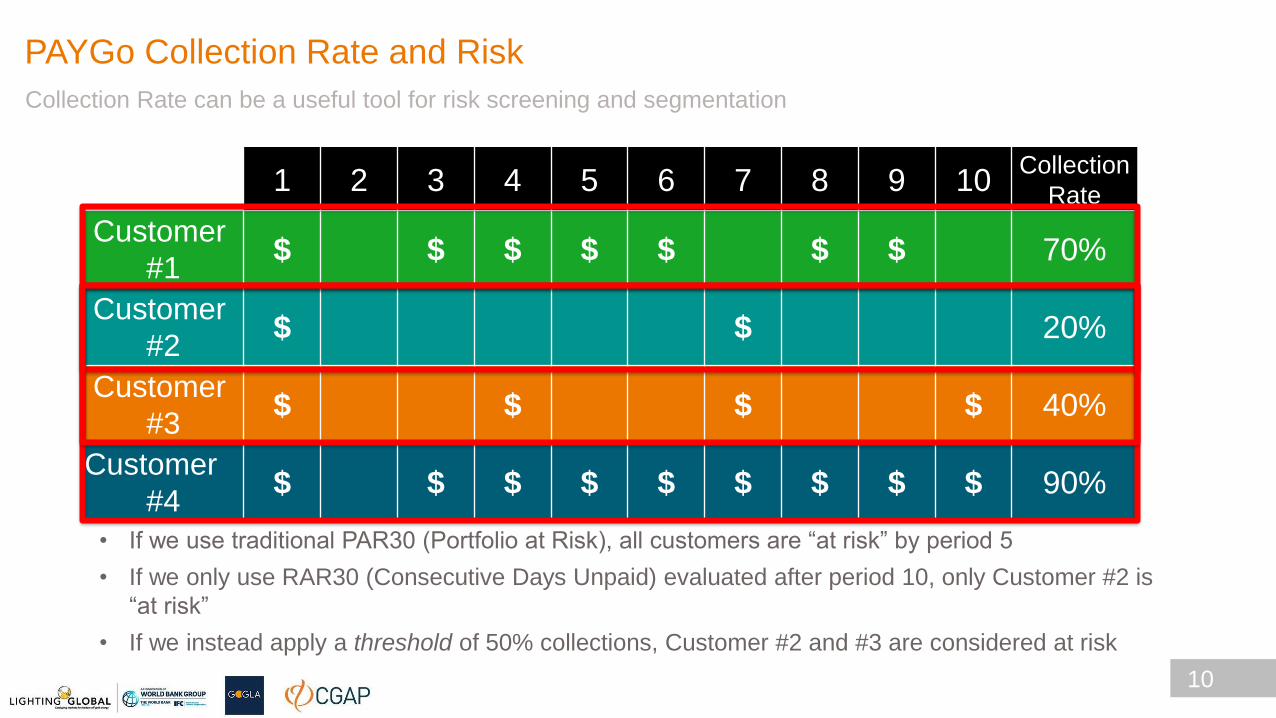
1 2 3 4 5 6 7 8 9 10Collection
Rate
Customer
#1$ $ $ $ $ $ $ 70%
Customer
#2$ $ 20%
Customer
#3$ $ $ $ 40%
Customer
#4$ $ $ $ $ $ $ $ $ 90%
• If we use traditional PAR30 (Portfolio at Risk), all customers are “at risk” by period 5
• If we only use RAR30 (Consecutive Days Unpaid) evaluated after period 10, only Customer #2 is
“at risk”
• If we instead apply a threshold of 50% collections, Customer #2 and #3 are considered at risk
Collection Rate can be a useful tool for risk screening and segmentation
PAYGo Collection Rate and Risk
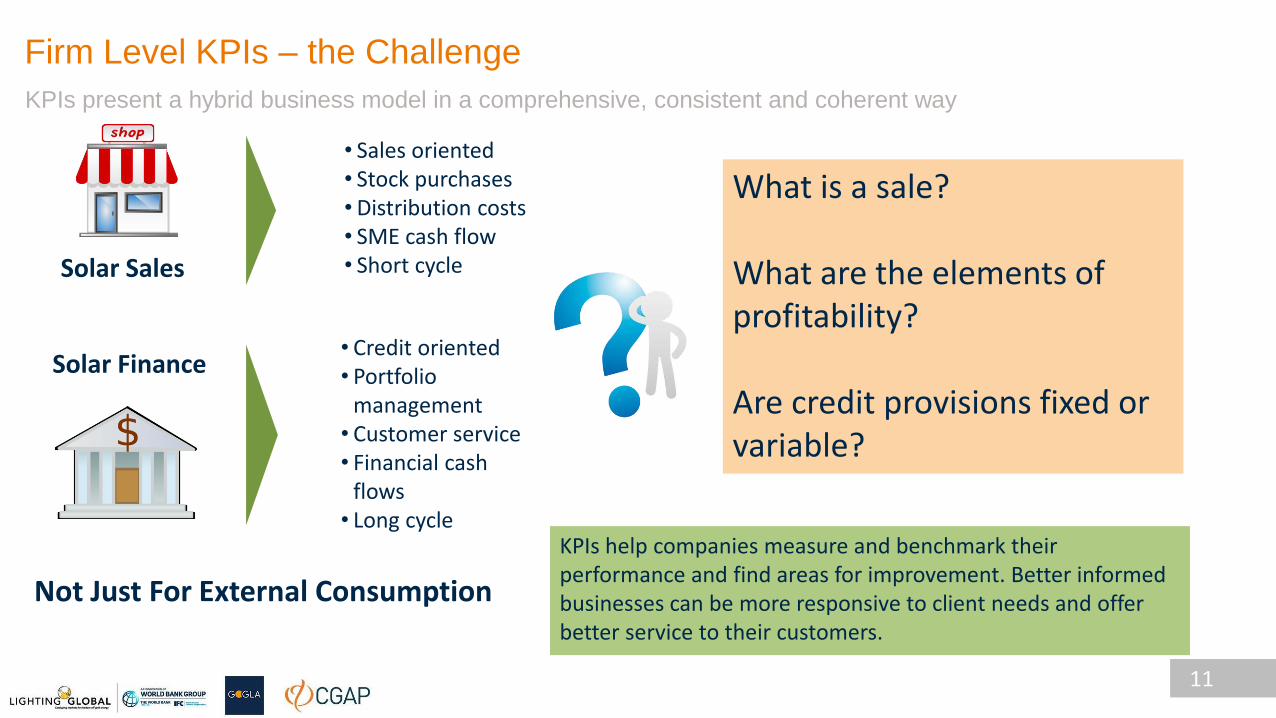
Solar Sales
Solar Finance
• Sales oriented• Stock purchases• Distribution costs• SME cash flow• Short cycle
• Credit oriented• Portfolio
management• Customer service• Financial cash
flows• Long cycle
What is a sale?
What are the elements of profitability?
Are credit provisions fixed or variable?
KPIs help companies measure and benchmark their performance and find areas for improvement. Better informed businesses can be more responsive to client needs and offer better service to their customers.
Not Just For External Consumption
Firm Level KPIs – the Challenge
KPIs present a hybrid business model in a comprehensive, consistent and coherent way
11
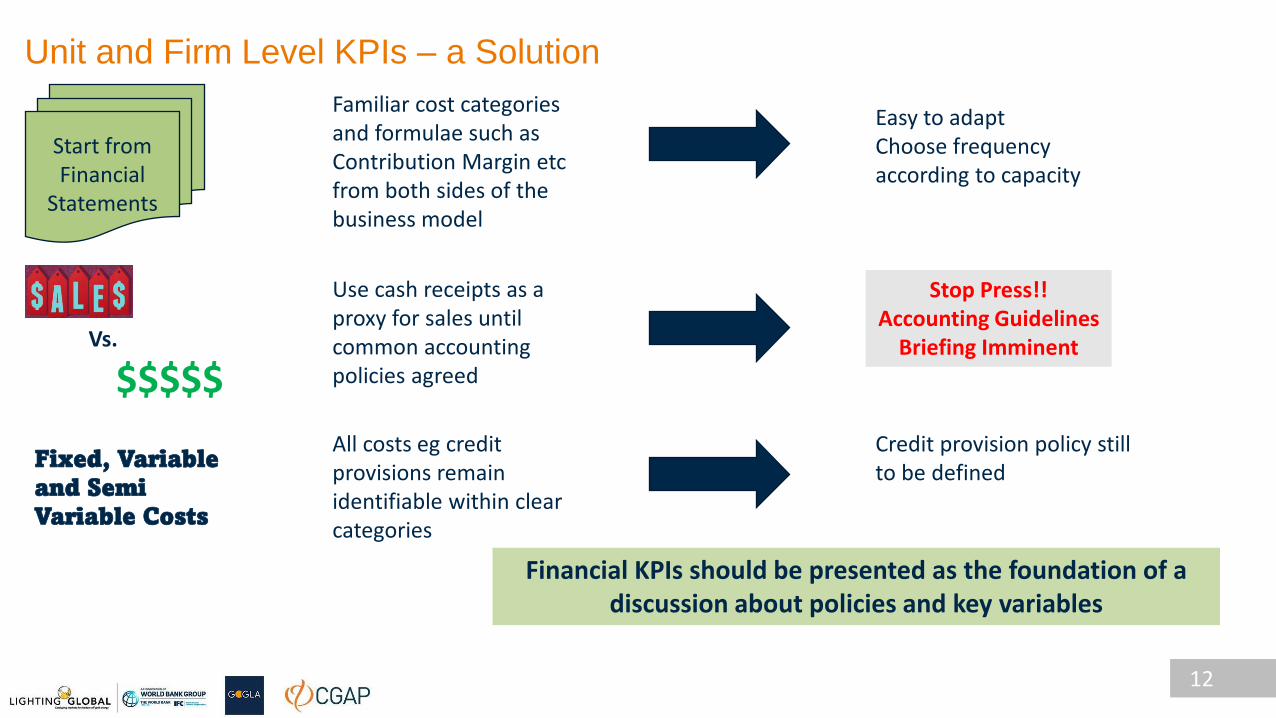
Start fromFinancial
Statements
Familiar cost categories and formulae such as Contribution Margin etc from both sides of the business model
Easy to adaptChoose frequency according to capacity
Vs.
$$$$$
Use cash receipts as a proxy for sales until common accounting policies agreed
Stop Press!! Accounting Guidelines
Briefing Imminent
Fixed, Variable and Semi Variable Costs
All costs eg credit provisions remain identifiable within clear categories
Credit provision policy still to be defined
Financial KPIs should be presented as the foundation of a discussion about policies and key variables
Unit and Firm Level KPIs – a Solution
12
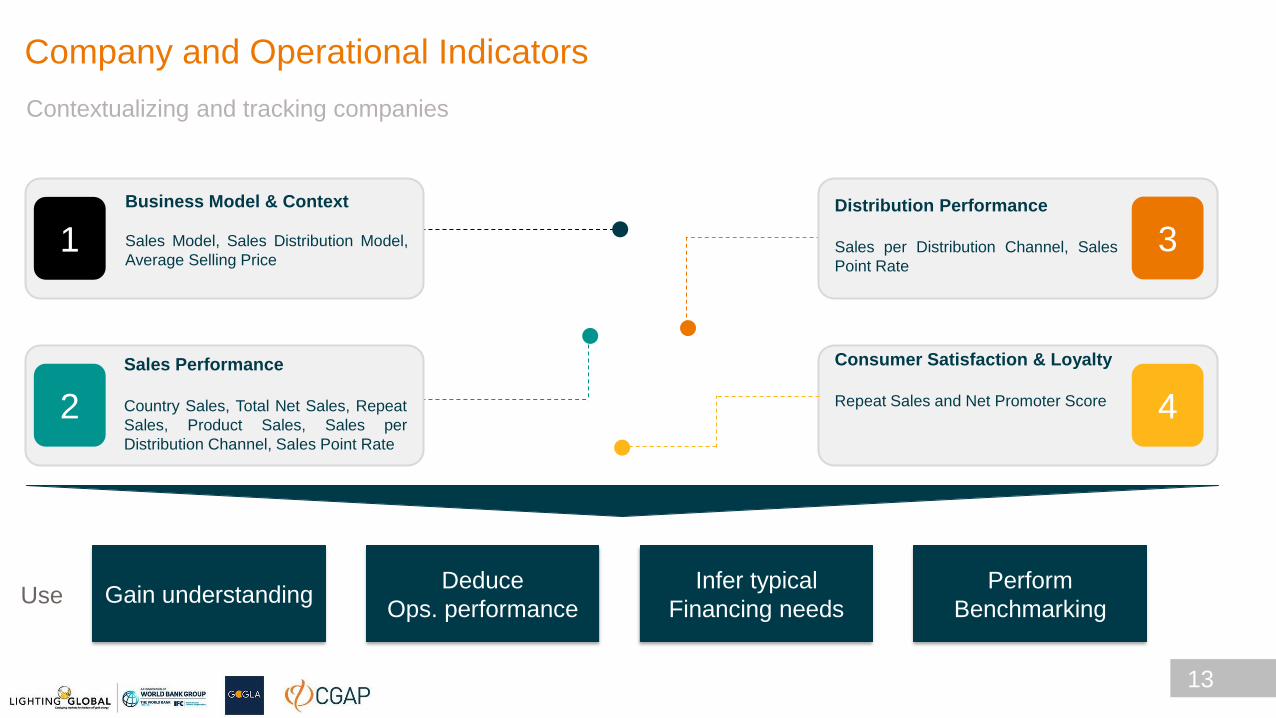
1
Business Model & Context
Sales Model, Sales Distribution Model,
Average Selling Price
2
3
4
Sales Performance
Country Sales, Total Net Sales, Repeat
Sales, Product Sales, Sales per
Distribution Channel, Sales Point Rate
Distribution Performance
Sales per Distribution Channel, Sales
Point Rate
Consumer Satisfaction & Loyalty
Repeat Sales and Net Promoter Score
Contextualizing and tracking companies
Gain understanding Infer typical
Financing needs
Perform
BenchmarkingUse
Deduce
Ops. performance
13
Company and Operational Indicators
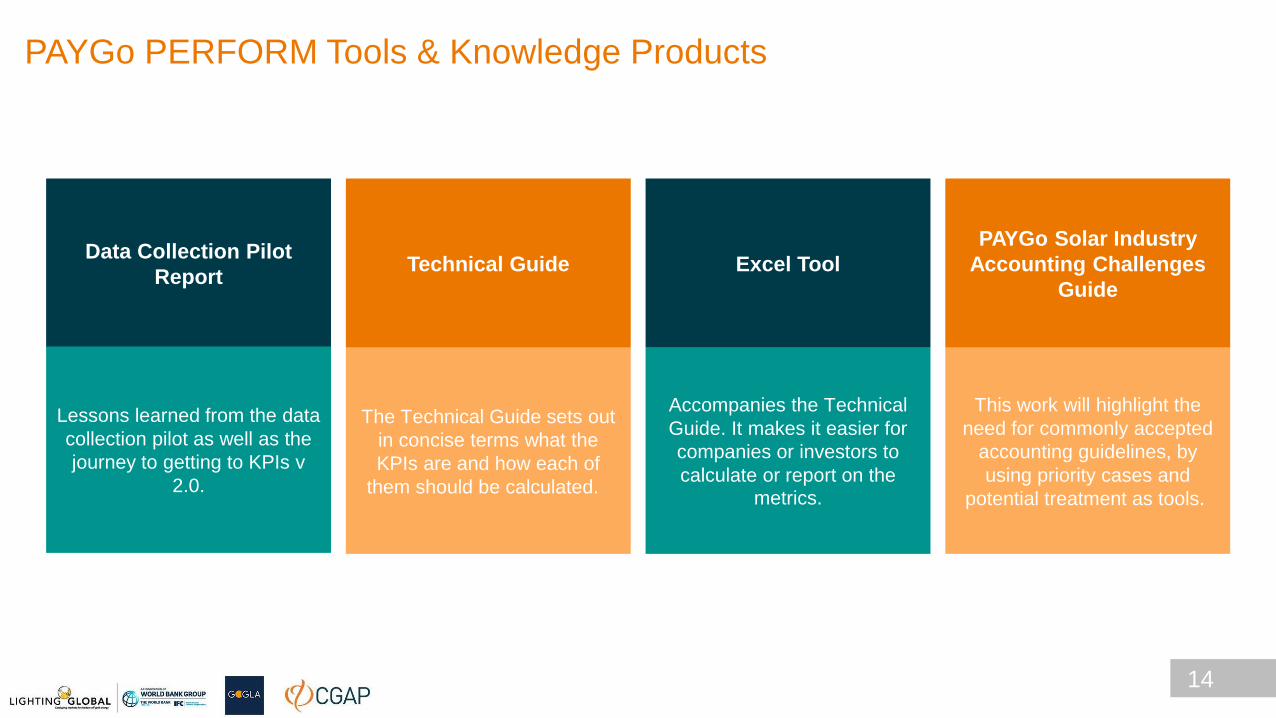
Data Collection Pilot
ReportTechnical Guide Excel Tool
PAYGo Solar Industry
Accounting Challenges
Guide
Lessons learned from the data
collection pilot as well as the
journey to getting to KPIs v
2.0.
The Technical Guide sets out
in concise terms what the
KPIs are and how each of
them should be calculated.
Accompanies the Technical
Guide. It makes it easier for
companies or investors to
calculate or report on the metrics.
This work will highlight the
need for commonly accepted
accounting guidelines, by
using priority cases and
potential treatment as tools.
14
PAYGo PERFORM Tools & Knowledge Products
15
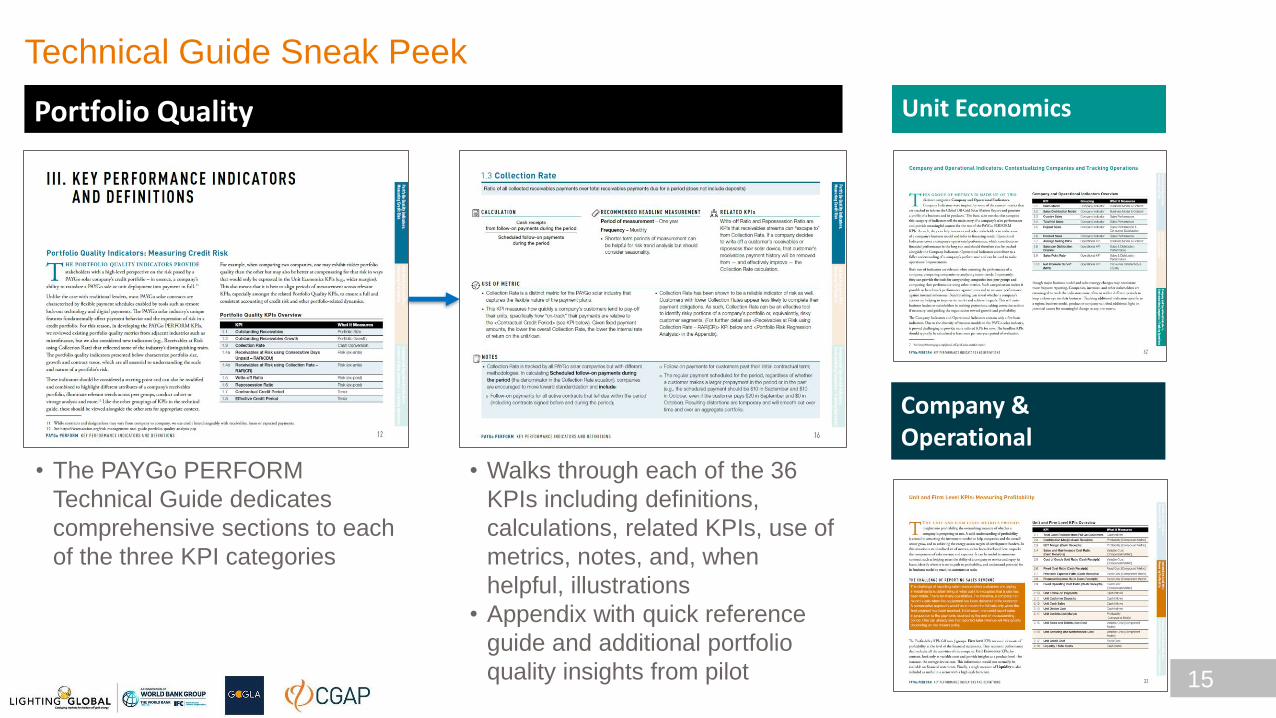
Portfolio Quality Unit Economics
Company & Operational
• The PAYGo PERFORM
Technical Guide dedicates
comprehensive sections to each
of the three KPI categories
• Walks through each of the 36
KPIs including definitions,
calculations, related KPIs, use of
metrics, notes, and, when
helpful, illustrations
• Appendix with quick reference
guide and additional portfolio
quality insights from pilot
Technical Guide Sneak Peek

PANELISTS
Send your questions through the chat box.
Select “Everyone” from the drop-down menu to
ensure your question is seen by the moderator.
MODERATOR
Geoffrey Manley
CDC Group
Sarah Mijabi
Greenlight Planet
Tobias Ruckstuhl
PersistentThebean Gilfillian
Oolu Solar
16
How the KPIs are already being used to monitor the PAYGo Industry
Send your questions through the chat box
Select “Everyone” from the drop-down menu to
ensure your question is seen by the moderator
Lucia Spaggiari
MFR
17
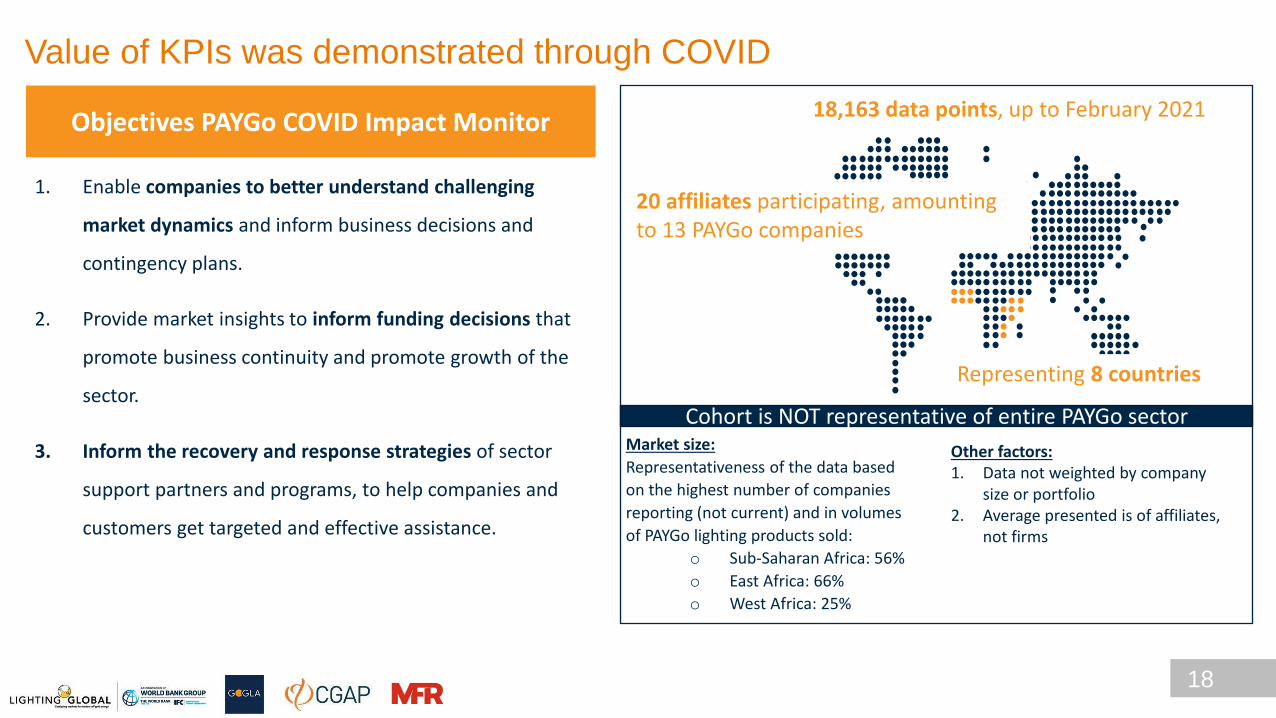
1. Enable companies to better understand challenging
market dynamics and inform business decisions and
contingency plans.
2. Provide market insights to inform funding decisions that
promote business continuity and promote growth of the
sector.
3. Inform the recovery and response strategies of sector
support partners and programs, to help companies and
customers get targeted and effective assistance.
20 affiliates participating, amounting to 13 PAYGo companies
Representing 8 countries
18,163 data points, up to February 2021
Market size:
Representativeness of the data based
on the highest number of companies
reporting (not current) and in volumes
of PAYGo lighting products sold:
o Sub-Saharan Africa: 56%
o East Africa: 66%
o West Africa: 25%
Objectives PAYGo COVID Impact Monitor
Cohort is NOT representative of entire PAYGo sector
Other factors: 1. Data not weighted by company
size or portfolio 2. Average presented is of affiliates,
not firms
18
Value of KPIs was demonstrated through COVID
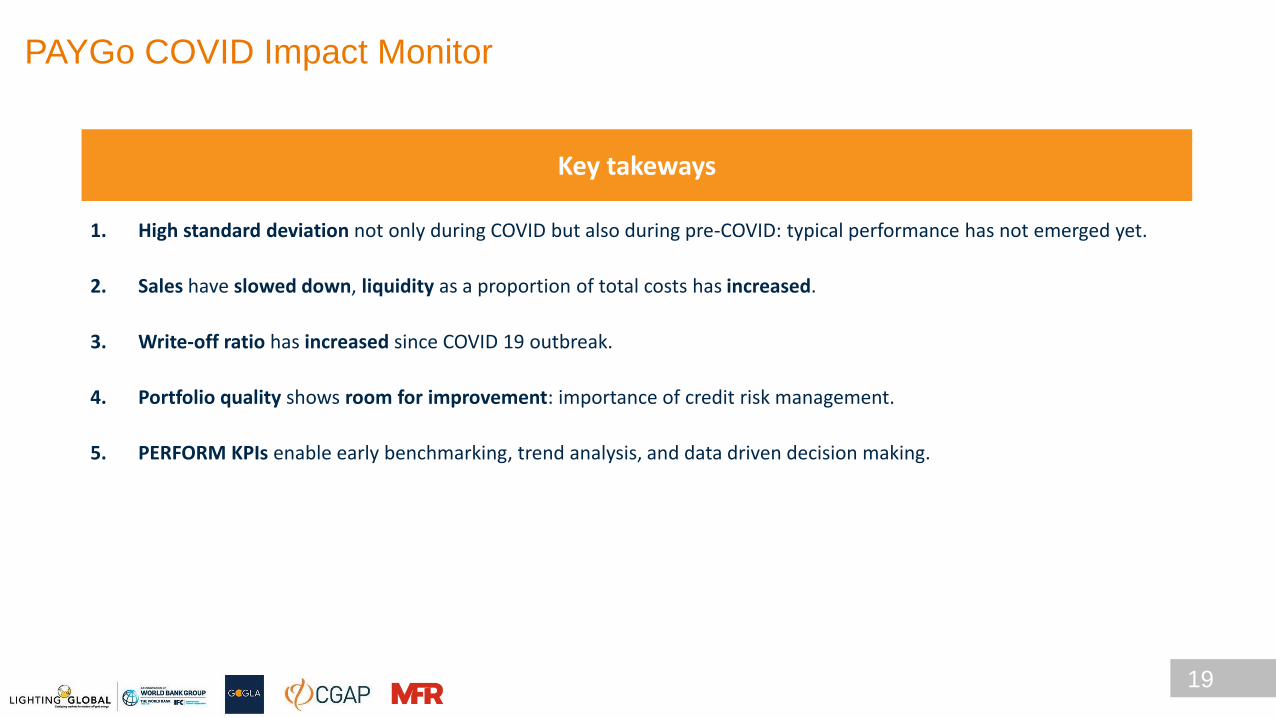
Key takeways
1. High standard deviation not only during COVID but also during pre-COVID: typical performance has not emerged yet.
2. Sales have slowed down, liquidity as a proportion of total costs has increased.
3. Write-off ratio has increased since COVID 19 outbreak.
4. Portfolio quality shows room for improvement: importance of credit risk management.
5. PERFORM KPIs enable early benchmarking, trend analysis, and data driven decision making.
19
PAYGo COVID Impact Monitor
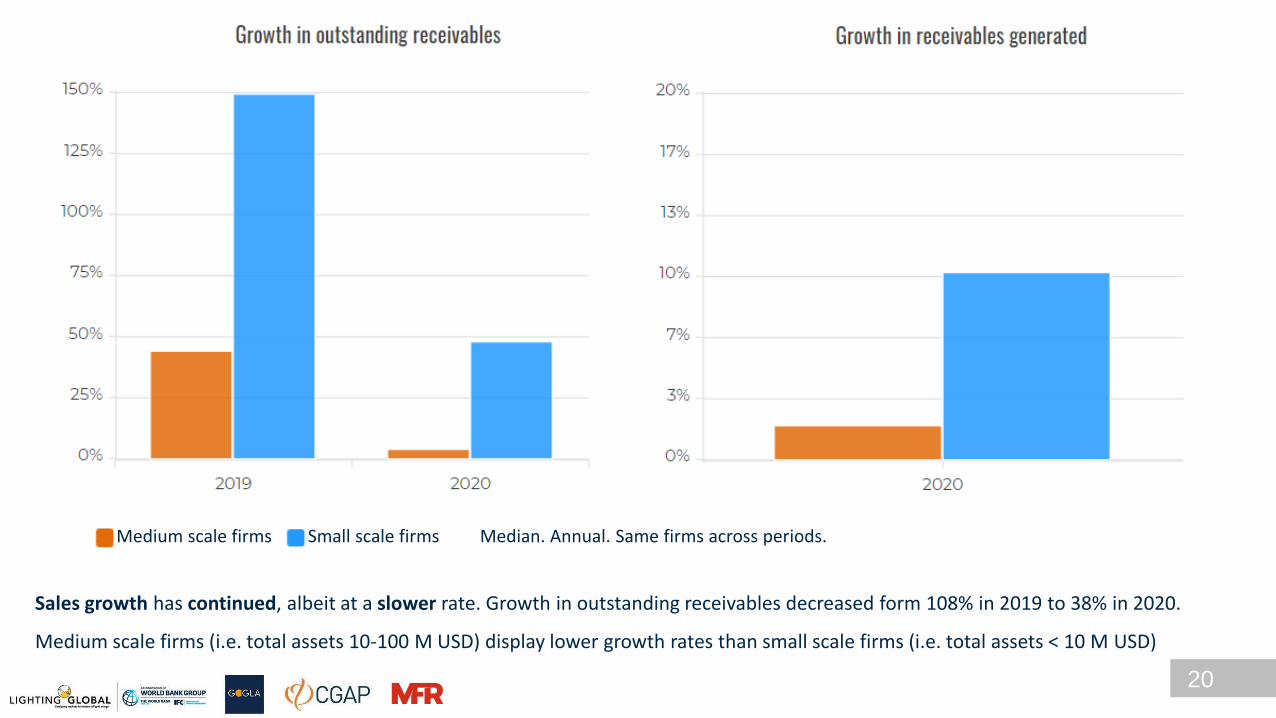
Medium scale firms Small scale firms Median. Annual. Same firms across periods. Source: www.atlasdata.org/paygo-monitor
Sales growth has continued, albeit at a slower rate. Growth in outstanding receivables decreased form 108% in 2019 to 38% in 2020.
Medium scale firms (i.e. total assets 10-100 M USD) display lower growth rates than small scale firms (i.e. total assets < 10 M USD)
20
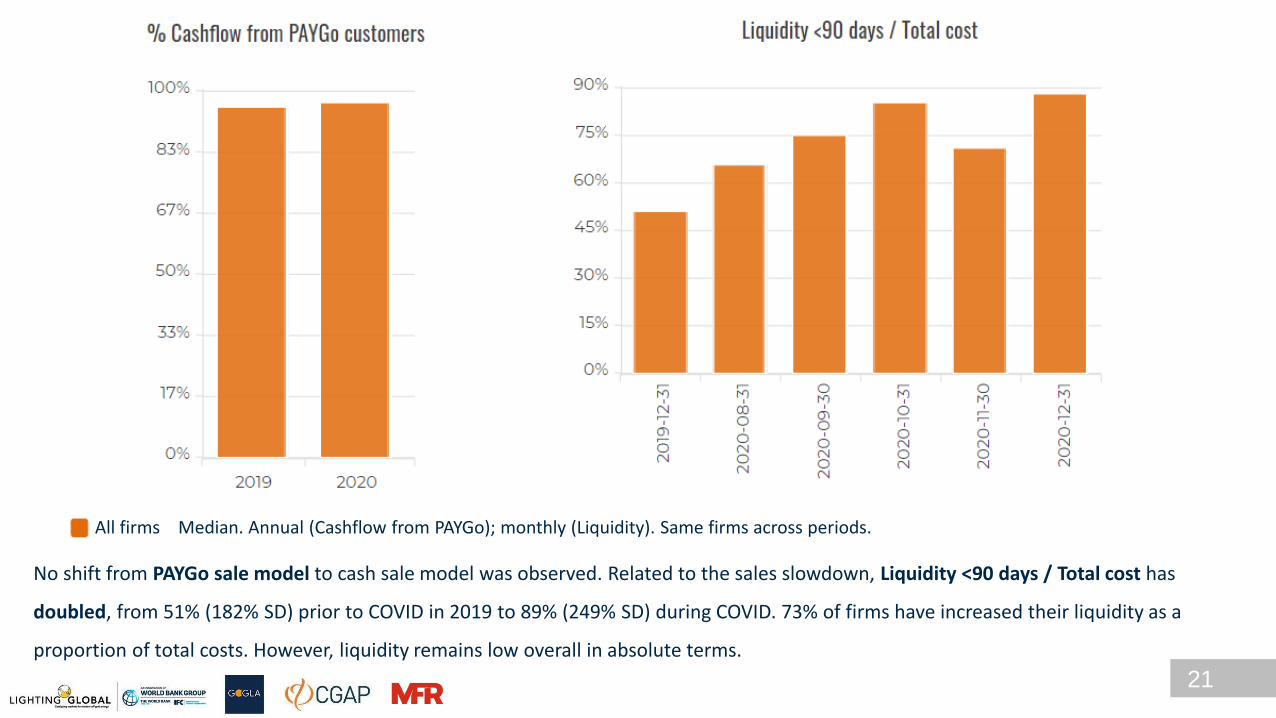
All firms Median. Annual (Cashflow from PAYGo); monthly (Liquidity). Same firms across periods. Source: www.atlasdata.org/paygo-monitor
No shift from PAYGo sale model to cash sale model was observed. Related to the sales slowdown, Liquidity <90 days / Total cost has
doubled, from 51% (182% SD) prior to COVID in 2019 to 89% (249% SD) during COVID. 73% of firms have increased their liquidity as a
proportion of total costs. However, liquidity remains low overall in absolute terms.
21
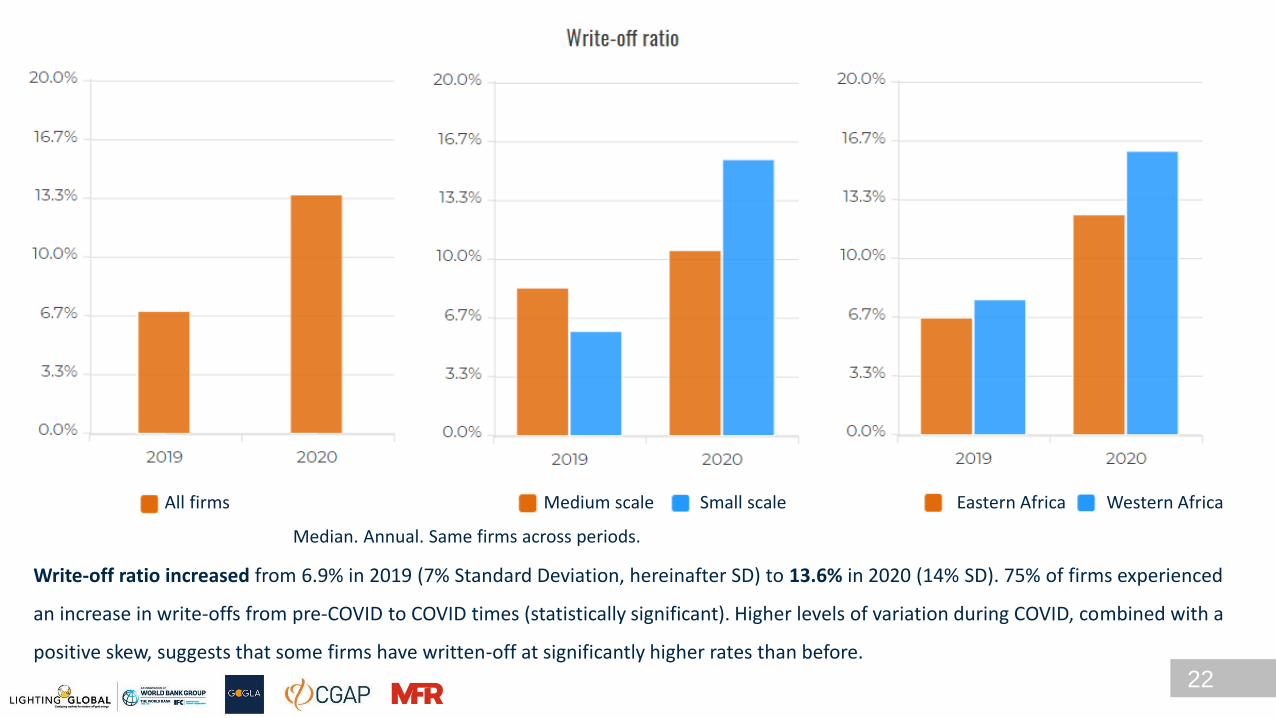
Write-off ratio increased from 6.9% in 2019 (7% Standard Deviation, hereinafter SD) to 13.6% in 2020 (14% SD). 75% of firms experienced
an increase in write-offs from pre-COVID to COVID times (statistically significant). Higher levels of variation during COVID, combined with a
positive skew, suggests that some firms have written-off at significantly higher rates than before.
All firms Medium scale Small scale Eastern Africa Western Africa
Median. Annual. Same firms across periods. Source: www.atlasdata.org/paygo-monitor
22
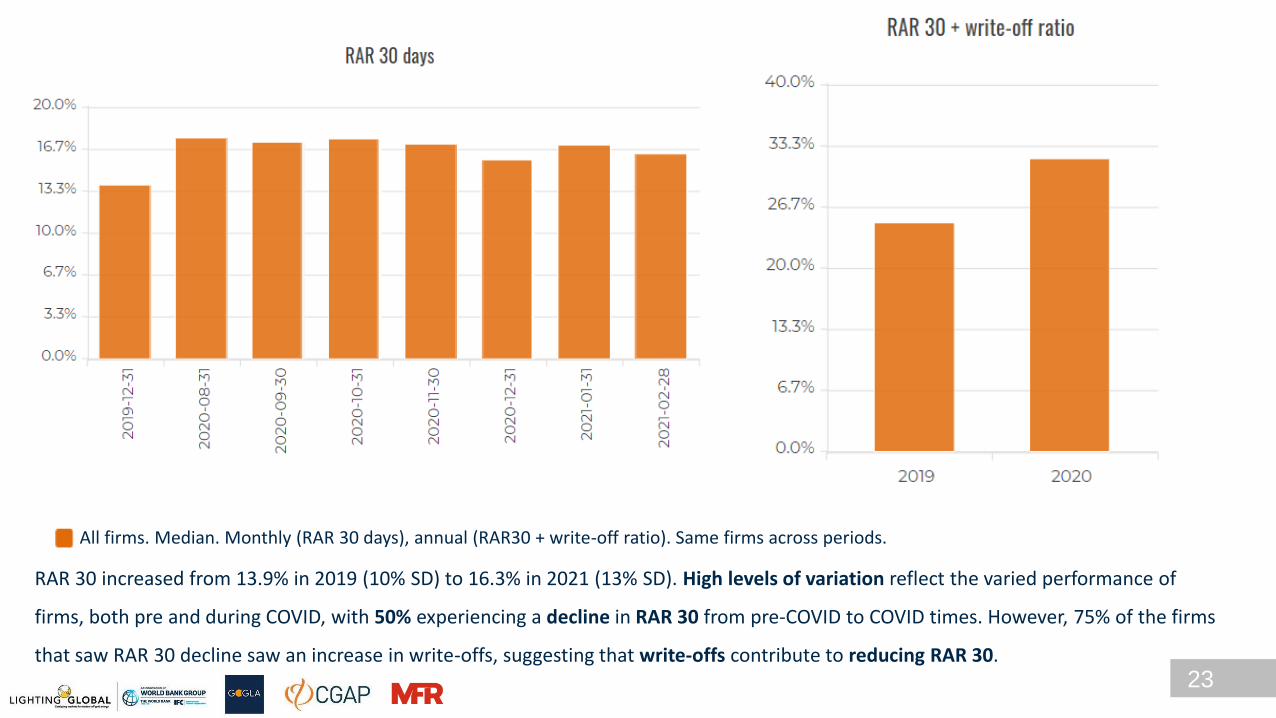
RAR 30 increased from 13.9% in 2019 (10% SD) to 16.3% in 2021 (13% SD). High levels of variation reflect the varied performance of
firms, both pre and during COVID, with 50% experiencing a decline in RAR 30 from pre-COVID to COVID times. However, 75% of the firms
that saw RAR 30 decline saw an increase in write-offs, suggesting that write-offs contribute to reducing RAR 30.
All firms. Median. Monthly (RAR 30 days), annual (RAR30 + write-off ratio). Same firms across periods. Source: www.atlasdata.org/paygo-monitor
23
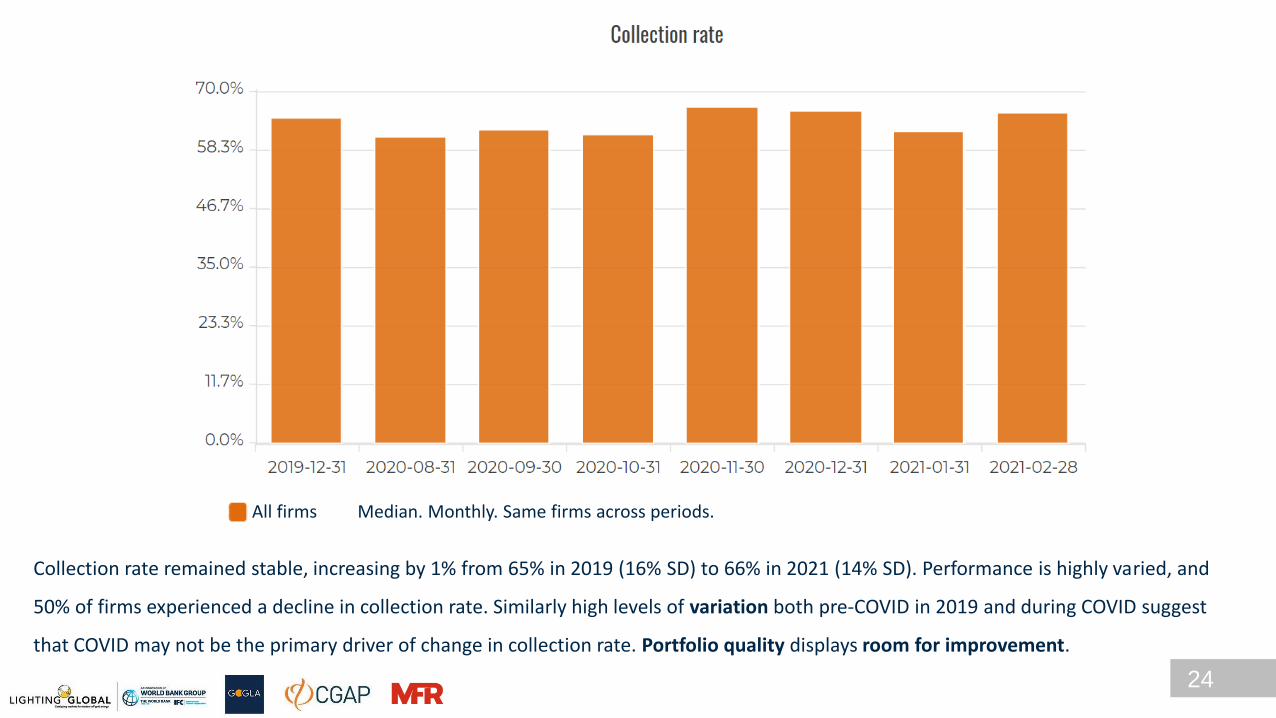
All firms Median. Monthly. Same firms across periods. Source: www.atlasdata.org/paygo-monitor
Collection rate remained stable, increasing by 1% from 65% in 2019 (16% SD) to 66% in 2021 (14% SD). Performance is highly varied, and
50% of firms experienced a decline in collection rate. Similarly high levels of variation both pre-COVID in 2019 and during COVID suggest
that COVID may not be the primary driver of change in collection rate. Portfolio quality displays room for improvement.
24

Q&A Please submit your questions via the chat
WHAT’S NEXT
1
3
Please take a minute to let us know what you thought about today’s webinar by
completing the survey available on the screen now.
For more resources on financial inclusion, visit www.FinDevGateway.org and www.cgap.org
2 We will email you when the webinar recording and related materials become available
on the FinDev Gateway website.
26
Thank you www.FinDevGateway.org
@FinDevGateway FinDev Gateway FinDev Gateway