web.hku.hkweb.hku.hk/~samchu/docs/cheang-2014-or-ms-journals.docx · web view(joh) (as highlighted...
TRANSCRIPT

Cite As: Cheang, B, Chu, S.K.W., Li, C. & Lim, A. (in press) "OR/MS Journals Evaluation Based on a Refined PageRank Method: An Updated and More Comprehensive Review." Scientometrics.
OR/MS Journals Evaluation Based on a Refined PageRank Method: An Updated and More Comprehensive Review
Brenda CheangInternational Center of Management Science and Engineering, School of Management and Engineering, Nanjing
University, Nanjing, 210093, China; and
Division of Information and Technology Studies, Faculty of Education,University of Hong Kong, Runme Shaw Building, Pokfulam Road, Hong Kong S.A.R
Samuel Kai Wah Chu Division of Information and Technology Studies, Faculty of Education,
University of Hong Kong, Runme Shaw Building, Pokfulam Road, Hong Kong S.A.R
Chongshou Li*Department of Management Sciences, College of Business,
City University of Hong Kong, Tat Chee Ave, Kowloon, Hong Kong S.A.R
Andrew Lim**International Center of Management Science and Engineering, School of Management and Engineering, Nanjing
University, Nanjing, 210093, China. Abstract
The purpose of this research is to furnish the Operations Research and the Management Sciences (OR/MS) research community with an updated assessment of the discipline’s journals set with refinements that also highlight the various characteristics of OR/MS journals. More specifically, we apply a refined PageRank method initially proposed by Xu, Cheang, Lim and Wen (2011) to evaluate the top 31 OR/MS journals for 2010, and report our findings. We also report the shifts in the rankings that span five years, from 2006 to 2010. We observe that Manufacturing and Service Operations Management (MSOM), indexed by the SCI only in 2008, is a specialized journal that is consistently highly regarded within the discipline. The rankings also suggest that Management Science (MS) is more established as a generalized journal as it has more external impact. In general, our ranking results correlate with expert opinions, and we also observe, report and discuss some interesting patterns that have emerged over the past five years from 2006 to 2010.
Keywords: Journals Evaluation; Citation Analysis; Journal Influence; Journal Impact; Impact Factor; Influence Index; OR/MS; PageRank.
_________________________________________________
*Corresponding Author, Chongshou Li, Telephone: +852 6350 5292, Fax Number: +852 3442 0189, Email: [email protected]** Andrew Lim is currently on no pay leave from City University of Hong Kong
/tt/file_convert/5ae158367f8b9ad47c8bb217/document.docx 5/7/2023 2:38 PM 1
1. Introduction
Before the turn of the new century, the field of Operations Research/Management Sciences (OR/MS) became established as a key discipline in most business schools. Off this backdrop surfaced a growing body of literature that evaluates the impacts of OR/MS journals. This phenomenon is apparently due to two circumstances: that journal evaluations provide the constant need for expedient information to a diverse set of academic stakeholders (Dubois & Reeb, 2000; Xu, Cheang, Lim & Wen, 2011); and given the vastly diverse and continually evolving nature of OR/MS related research, new journals have been formed while older journals have changed either in terms of their status or their research directions so as to remain relevant (Olson, 2005). Indeed, a review of past studies supports this observation: for example, Barman et al. (1991, 2001) conducted journal evaluations a decade apart and observed that Production and Operations Management, a new journal entrant within that time frame, had “established itself as a major player”, faring very well in terms of its peer-perceived relevance and quality. Similarly, we observe that in recent years, having published its first issue in 1999, Manufacturing & Service Operations Management (M&SOM) was not only considered for evaluation despite it being a relatively new journal, it also fared exceptionally well in studies conducted by Olson (2005) and Gorman and Kanet (2005, 2007). But with that being said, the most recently published OR/MS journals evaluation study we found is a citations-based study by Xu et al. (2011) using data from 2004.
And as if methodological validity and reliability are not complex enough, there is a growing consensus that different academics perceive the prestige of journals differently (Seglen, 1997; Pendlebury, 2009; Rousseau, 2002; Weingart, 2005). Thus, a journal’s prestige, impact, or influence can hardly be derived based on a single metric (Moed, colledge, Reedijk, Moya-Anegon, Guerrero-Bote, Plume, & Amin, 2012).
Ergo, the motivation of this paper is to furnish the OR/MS research community with an updated review of the discipline’s selected journals set using methodological refinements to highlight the multifaceted characteristics of the selected OR/MS journals. In particular, we extend upon a refined PageRank method originally proposed by Xu et al. (2011) to evaluate and report our findings of 31 OR/MS journals from cross-sectional and longitudinal perspectives, and where appropriate, we also compare and contrast our findings with those of other approaches.
The remainder of this paper is structured as follows: Section 2 is a literature review of relevant existing and emerging approaches to journal ranking. Section 3 describes the underlying methodology for implementation, describes how differentiating the citations types can refine our journal evaluations, and describes the delimitations of our study. In Section 4, we present the ranking results and analyses for our cross-sectional evaluation for 2010, as well as four different five-year rolling reviews from 2006 to 2010. We conclude our paper in Section 5.
/tt/file_convert/5ae158367f8b9ad47c8bb217/document.docx 5/7/2023 2:38 PM 2

2. Literature Review
Although peer surveys have been conducted in the past1, journal evaluations based on citations data appear to be the more common approach today (Olson 2005, Vokurka 1996). According to Xu et al. (2011), citations-based evaluations generally refer to journals being ranked “based on the frequency with which journal articles are cited in subsequent issues of the same journal or in a set of discipline-specific journals” (p.375). In this approach, scientometricians may rank journals according to their specified evaluation criteria, such as taking total citations into consideration, excluding self-citations of articles, and so on. However, although earlier citations-based studies include Goh, Holsapple, Johnson, and Tanner (1996, 1997) and Vokurka (1996), the most widely used is that originally proposed by the E Garfield Institute for Scientific Information (ISI), which has since been acquired by Thomson-Reuters and is now more widely known as Thomson’s Science Citation Index (SCI). The SCI recognizes over 12,000 journals today, and through its annual Journal Citation Report (JCR), the agency provides the rankings of journals based on a two-year rolling impact factor (IF) score for each indexed journal. The IF score for a given journal in year X is determined by the average number of citations received in year X to its articles during the previous two years; the premise of the IF is that the higher the IF score, the higher the journal impact or “quality” (Xu et al., 2011).
But in spite of their popularity, SCI’s IF method has increasingly been derided as a fundamentally flawed ranking technique (Butler, 2008; Pendlebury, 2009; Seglen, 1997). A recurring criticism of the method is that it merely ranks journals by citation frequency; that citation quantity and citation quality are hardly the same thing (Olson, 2005). Furthermore, there is no differentiation of citations in the IF method. This means that each citation is regarded to be of equal “value” although it has been countered that citations by an article published in a renowned journal should outweigh citations by an article published in a mediocre one (Pinski and Narin, 1976; Xu et al., 2011). Accordingly, numerous studies suggest that rank orders of journals derived from the IF method are often incongruent with peer perceptions (Seglen, 1997; Rousseau, 2002; Olson, 2005; Weingart, 2005).
The limitations of the IF method coupled with the constant need for reliable journals information by the various stakeholders have thus placed the onus on scientometricians to devise better journal ordering mechanisms (Leydesdorff, 2008). Responding to this challenge, Gorman and Kanet (2005, 2007) recently interpreted and applied the Author-Affiliation Index (AAI) method originally devised by Harless and Reilly (1998). The concept, as proposed by Gorman and Kanet, is anchored on the premise that journal impact should correlate with the affiliation of authors that publish their articles in a given journal; that a journal’s impact can be determined simply by taking into consideration the journals with which authors from leading universities 1 Past studies based on peer surveys include Saladin (1985); Barman, Tersine, and Buckley (1991) Barman, Hana, and LaForge (2001); Olson (2005).
/tt/file_convert/5ae158367f8b9ad47c8bb217/document.docx 5/7/2023 2:38 PM 3

publish (Xu et al., 2011). According to its proponents, the AAI method is cost-effective compared to peer opinion surveys, can simply be calculated in any given period, and appears to be an objective enough measure of journal influence as the ranking results appear to be congruent with those of opinion survey results (Chen and Huang, 2007). However, its critics argue that because the rank order is determined based on publications from authors affiliated with leading institutions, the AAI is merely a coarse measuring tool. The contention is that while the prestige of a journal should be ascertained by the quality of their articles, the prestige of an institution is ascertained by numerous factors apart from the quality of publications by their faculty. This fundamental difference has since opened the door for critics who identified, challenged and cautioned the theoretical and statistical interpretations, assumptions and applications of the concept (Agrawal et al., 2011). Essentially, with potential bias being introduced in journal selection and sampling via the AAI approach, stakeholders cannot conclude with sufficient confidence that some journals are undoubtedly better than others (Xu et al., 2011).
Around the time the AAI approach was proposed and implemented, another group of scholars began experimenting with the application of the PageRank method as a journal ranking mechanism. Originally developed by Google’s founders as a web-search approach to ordering webpages by their impact, PageRank had been based on Pinski and Narin’s (1976) assertion as stated above (Page, Sergey, Motwani, & Winograd, 1999). Since then, Google’s PageRank has been transposed and applied in at least three online bibliometric platforms and five journal-ranking studies. They are discussed in the following:
Bibliometric Platforms
Newer online bibliometric platforms such as www.journal-ranking.com (developed by Lim et al., 2007), Eigenfactor (see http://www.eigenfactor.org/) and SCImago Journal Rank (SJR) (see http://www.scimagojr.com/) have apparently elected to implement their systems based on the PageRank method. Be that as it may, these platforms have included unique methodological refinements that set their systems apart from one another (please refer to Table 1 for a concise summary): First of all, while www.journal-ranking.com rank a journal’s influence based on its Quality Index (QI), Eigenfactor use what they call the Article Influence (AI) score (West, Althouse &Rosvall, 2008), and SCImago use the SJR (Gonzalez-Pereira, Guerrero-Bote & Moya-Anegón, 2010) and SJR2 (Guerrero-Bote & Moya-Anegón, 2012); Secondly, all three platforms treat citation types differently. In the case of Eigenfactor, all self-citations are ignored (self-citations refer to journal articles that cite other articles from the same journal), while in the case of SCImago, self-citations are limited to a maximum of 33% of a journal’s total citations. As for www.journal-ranking.com, all citations are being considered; Thirdly and most notably, there are differences in the way the PageRank model is being customized among these platforms. Indeed, the PageRank algorithm (Brin & Page, 1998) can be explained as computing the leading eigenvector of a stochastic matrix, and is defined as follows:
/tt/file_convert/5ae158367f8b9ad47c8bb217/document.docx 5/7/2023 2:38 PM 4
P=d∗M +(1−d )∗a . eT ,where d is the damping factor; e is row vector with all elements equal to 1 and a is the personalization vector. Further, a . eTis the matrix with identical columns a while M is the citation matrix, and P is the stochastic matrix. Eigenfactor and SCImago follow this approach, but with an added personalization vector, which is multiplied by (1 – damping factor), and theoretically guarantee the uniqueness of the principle eigenvector of the stochastic matrix. That being said, although the damping factor and personalization vector may be used to determine the rankings, Bressan and Peserico (2010) point out that the rankings of journals can be very sensitive to both the damping factor and personalization vector. As for www.journal-ranking.com, they do not use personalization vectors or damping factors. Instead, by removing dangling journals, they construct a strongly connected citations graph and use a reiterative approach, and where convergence is guaranteed by this strong connectivity of citation graphs (Wen, 2008).
Table 1. Comparison of Article Influence, SJR, SJR2 and Quality Index
PageRank-based MethodsDifferences
Eigenfactor’s Article Influence
SCImago’sSJR and SJR2
www.journal-ranking.com’sQuality Index
Differencesin Non-PageRank
Aspects
Source Database Journal Citation Report (JCR)
Scopus Journal Citation Report (JCR)
Citing Time Window 1year 1year 1 yearCited Time Window 5 years 3 years 10 yearsSelf-citations Remove Limited Weighted by input
parameterExternal-citations N.A.* N.A. Weighted by input
parameterInternal-citations N.A. N.A. IncludedConsidering Citation Quality
Yes Yes Yes
Differences in PageRank Aspects
Damping Factor 0.85 0.9 1.0
Dangling Journals** Included Included RemovedConvergence of Iterative Algorithm
Theoretically Guaranteed
Theoretically Guaranteed Guaranteed by strong connectivity of the citations graph
Sensitivity to Damping Factor
Yes. Yes. No.
Personalization Vector (Brin & Page,1998)
Normalized Article Number
Two parts: a minimum prestige
value:1−d−e
N prestige given by the
number of papers:e∗Arti
∑j=1
N
Art j
where Arti is the number
N.A.
/tt/file_convert/5ae158367f8b9ad47c8bb217/document.docx 5/7/2023 2:38 PM 5

of articles published by journal i during examined time period
Note: *N.A.: Not Available**Dangling Journals: Journals that do not cite other journals during time period examinedPageRank-based Journal Ranking Studies
There have been at least five PageRank-based studies on journal ranking (namely Palacios-Huerta and Volij, 2004; Lim, Ma, Wen, Xu, Cheang, Tan & Zhu, 2007; Lim, Ma, Wen, Xu, & Cheang, 2009; Xu et al., 2011; Cheang, Chu, Li & Lim, 2013). Of these, the study by Xu et al. (2011) produced the rank orders of a set of 31 OR/MS journals that were not only based on how influential the selected journals were among all SCI-indexed journals, but also how influential the selected journals were particularly within the OR/MS domain. At the time, however, Xu et al. (2011) had elected to use data from 2004 to directly compare their results to those based on other existing methods. The authors also demonstrated that their application of the PageRank method was not only an improvement on traditional methods of citations analyses, they also showed that their approach enabled the discernment of different journal impacts compared to other existing methods. More recently, Cheang et al. (2013) extended upon Xu et al.’s (2011) approach to order 39 selected management journals. In particular, the authors expanded on Xu et al.’s (2011) supposition that although PageRank is a reliable method in determining a journal’s impact or quality, it does not distinguish the nature of a journal’s influence or impact. Indeed, some journals may be highly influential by way of receiving substantial self-citations because they are highly specialized journals. On the other hand, some journals may be highly influential because they are (both) well cited within and outside their domains (in other words, they have significant internal and external citations, respectively). However, the nuances of particular journals would not come to light if the various citation types are undifferentiated or that certain types of citations are ignored (Cheang et al., 2013).
Thereupon, in view of the aforementioned theoretical and practical developments, and the assertion that journals evaluation is such a labyrinthine process that it “cannot be captured in one single metric” (Moed et al., 2012, p.368), we adopt the same approach as Xu et al. (2011) and Cheang et al. (2013) to provide the OR/MS community with an updated and more comprehensive review of the discipline’s selected journals set. Therefore, we not only provide a cross-sectional evaluation (one-year), we also provide a longitudinal (five-year rolling) review of the selected OR/MS journals to observe relevant trends and compare our analysis with those of other methods, where appropriate.
3. Methodology
3.1 Description of the PageRank Method
/tt/file_convert/5ae158367f8b9ad47c8bb217/document.docx 5/7/2023 2:38 PM 6

As mentioned in the literature review, the PageRank method has also been transposed to harness citations data for journal ranking purposes (Cheang et al., 2013). It consists of two major parts. The first is the construction of a citations graph network where every node represents a journal and an edge represents a collection of citations from one journal to another.
After the citations network database is constructed, we can then proceed to determine the quality of each journal using PageRank’s underlying principle where citations from a higher quality journal should be given higher weightage (Xu et al., 2011). The problem can be modeled by solving a set of linear equations whereby the impact value of each journal is treated as a variable of positive value (Lim et al., 2009). The linear equations compute the transitivity among the citations reiteratively until the values converge (Lim et al., 2007; Xu et al., 2011; Cheang et al., 2013). Thus, we can use the random walk method (Pearson, 1905) or matrix multiplication approach since both methods are iterative in nature (Cheang et al., 2013). Summarily, the equation may be expressed as follows:
PRix+1= ∑
j=1
n
p ji PR jx,
whereby the influence of journal i (PRi) is the sum of the product of the influence (PR) of every journal j multiplied by the proportion (p) of citations from j to i ( Lim et al., 2009; Xu et al., 2011, Cheang et al, 2013). Essentially, the method uses the influence of cited journals to gauge the impact of a citation. Subsequently, journal i’s influence is divided by the number of articles they publish every year (to identify the average impact/influence of the journal’s articles) to derive what is known as the Quality Index (QI) as proposed by www.journal-ranking.com (Lim et al., 2007) For further technical explanations of the PageRank Method, please refer to the paper by Xu et al., (2011), pages 4 -5.
3.1.2 Differentiation of Citation Types for More Refined Journal Evaluations
The concept of journal evaluations is a contentious subject (Seglen, 1997; Glanzel & Moed, 2002; Harzing, 2007). This is, in large part, due to the subjectivity and therefore complexity in establishing a journal’s impact (Robey & Markus, 1998; Cheang et al., 2013). For instance, while some may equate high citation count with being of high impact, others may view high self-citation count with being a manipulative journal (Rousseau, 2002; Smith, 2006; Weingart, 2005). Nevertheless, this brought about the idea that varying viewpoints may be better captured if ranking techniques can be further refined to reflect it (Xu et al., 2011; Cheang et al., 2013). In particular, Xu et al. (2011) proposed that varying viewpoints could be captured via the differentiation of the various citation types.
To be clear, there are three citation types as shown in Figure 1: self-citations – articles in a journal citing other articles from the very same journal; internal-citations - journals cited by core
/tt/file_convert/5ae158367f8b9ad47c8bb217/document.docx 5/7/2023 2:38 PM 7

journals (core journals are journals within a specific domain); and external-citations - journals cited by non-core journals (non-core journals are journals outside a specific domain) (Cheang et al., 2013). Through this differentiation process, we can better ascertain what sort of influence or impact (i.e. external and/or internal influence) a journal possesses.
Figure 1. Illustration of Citation Types
Now, let us also use Figure 1 to quantify the various citation types: Let (J1) be Operations Research, (J2) be Journal of Scheduling and (J4) be Academy of Management Review. We also define journals in discipline A as core journals and journals in discipline B as non-core journals in relation to discipline A. The citation relationships among these journals may be represented as shown in Table 2, where for examples, C2,1 refers to the number of citations that J1 received from J2 (both journals are from the same core), C4,1 refers to the number of citations J1 received from J4 (where J4 is not in the same core journals set as J1), C1,1 refers to the number of citations that J1 received from itself, and so on.
Table 2. Summary of Quantifying the Three Citation Types in Figure 1
Journals Internal Citations
External Citations
Self-Citations
Core Journals
J1, Operations Research C2,1 C4,1 C1,1
J2, Journal of Scheduling C1,2 C3,2 C2,2
Non-core Journals
J4, Academy of Management Review 0 C1,4 + C2,4 C4,4
3.2 Applying the Refined PageRank Method: Parameters and Input Values The general application of the PageRank method is given in the following:
First, we structure a core journals set, a universal list J. Next, we set parameters and input values including a year t, a length of time span N, the
external-citation parameter γ and the self-citation parameter β. Then, we calculate the PageRank values and derive the QI for each journal.
/tt/file_convert/5ae158367f8b9ad47c8bb217/document.docx 5/7/2023 2:38 PM 8

Accordingly, we fix the parameters and inputs as described in the following:
As our aim is to update the OR/MS journal rankings, we input all 10,625 journals indexed in the 2010 Journal Citation Report (JCR) to form the universal journals set J. Note that as the International Journal of Flexible Manufacturing System (IJFMS) ceased issue in 2008, the journal is thus delisted from our universal list J. However, we include Manufacturing & Service Operations Management (M&SOM) in our universal list as it was indexed by SCI in 2008.
We set the year t to be 2010 and the period length N to be 10. Internal-citations have a default weight of 1. And the weight of external- and self-citations can be set relative to the weight of internal citations. With regards to the external citation parameter γ and self-citation parameter β, we consider all combinations of γ going from 0.0, 0.1, …, 0.9, 1.0 and β going from 0.0, 0.1, …, 0.9, 1.0. As such, there are 121 combinations of γ and β. Accordingly, we pay close attention to (γ =0.0, β =0.0), (γ =1.0, β =1.0), (γ =0.0, β =1.0) and (γ =1.0, β =0.0).
In order to obtain the QI for each journal, we obtain the number of articles published in every journal in the core set from t - N + 1 to t, which is from 2001 to 2010 for our case. However, we encounter one exception, M&SOM, which was indexed by SCI only after 2007. Thus, we multiply the average number of articles that were published in M&SOM from 2006 to 2010 by 10 to estimate the total number of articles published from 2001 to 2010. For other journals, we tally the number of articles published from 2001 to 2010.
Due to the immense size of our universal set list, we also implemented the recursive algorithm by Page et al. (1999) to accelerate the computation of PageRank values with a time limitation of three minutes.
Finally, we generate the QI for each journal for all sampled parameter values including the 121 value combinations of β and γ, and factor their average scores to derive the journal rankings.
4 Results and Discussions
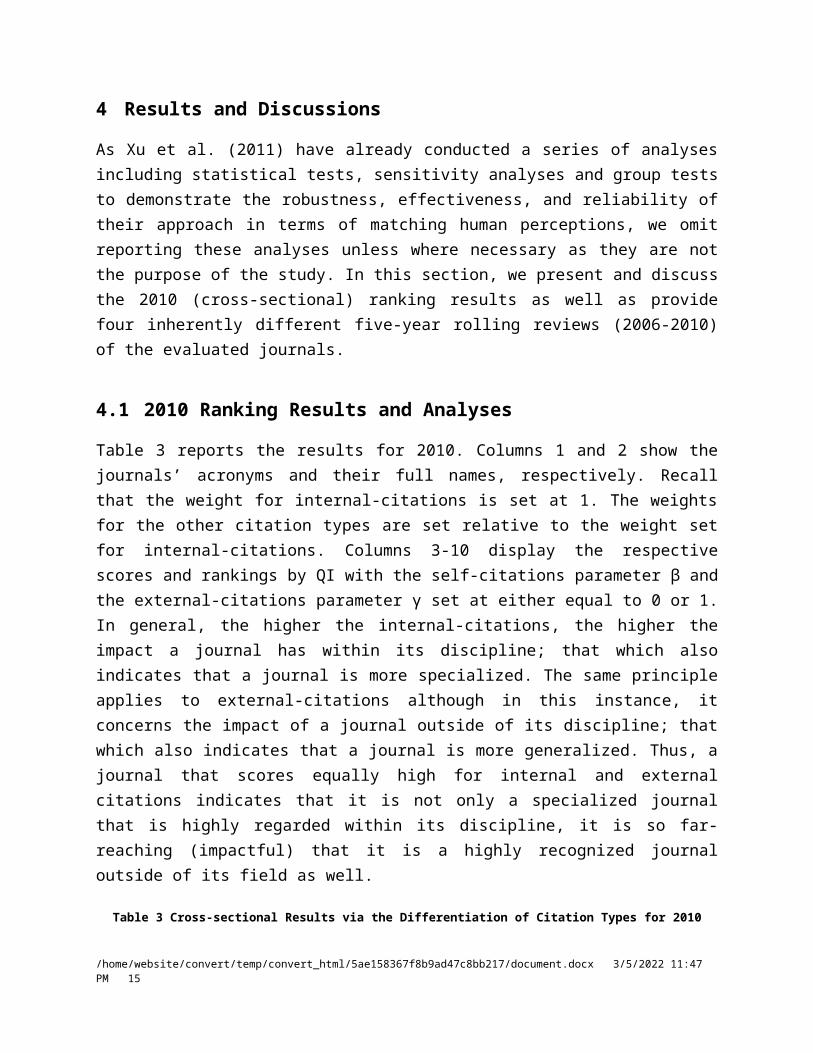
As Xu et al. (2011) have already conducted a series of analyses including statistical tests, sensitivity analyses and group tests to demonstrate the robustness, effectiveness, and reliability of their approach in terms of matching human perceptions, we omit reporting these analyses unless where necessary as they are not the purpose of the study. In this section, we present and discuss the 2010 (cross-sectional) ranking results as well as provide four inherently different five-year rolling reviews (2006-2010) of the evaluated journals.
4.1 2010 Ranking Results and Analyses
Table 3 reports the results for 2010. Columns 1 and 2 show the journals’ acronyms and their full
/tt/file_convert/5ae158367f8b9ad47c8bb217/document.docx 5/7/2023 2:38 PM 9
names, respectively. Recall that the weight for internal-citations is set at 1. The weights for the other citation types are set relative to the weight set for internal-citations. Columns 3-10 display the respective scores and rankings by QI with the self-citations parameter β and the external-citations parameter γ set at either equal to 0 or 1. In general, the higher the internal-citations, the higher the impact a journal has within its discipline; that which also indicates that a journal is more specialized. The same principle applies to external-citations although in this instance, it concerns the impact of a journal outside of its discipline; that which also indicates that a journal is more generalized. Thus, a journal that scores equally high for internal and external citations indicates that it is not only a specialized journal that is highly regarded within its discipline, it is so far-reaching (impactful) that it is a highly recognized journal outside of its field as well.
Table 3 Cross-sectional Results via the Differentiation of Citation Types for 2010
Journal Quality Index(β =0.0, γ =0.0)
Quality Index (β =0.0, γ =1.0)
Quality Index(β =1.0, γ =0.0)
Quality Index(β =1.0, γ =1.0)
Acronym Name Score Rank Score Rank Score Rank Score Rank
AOR Annals of Operations Research 0.019 18 0.021 18 0.013 24 0.018 21CIE Computers and Industrial Engineering 0.009 26 0.01 29 0.007 27 0.009 29COR Computers and Operations Research 0.023 15 0.022 16 0.018 18 0.021 17DS Decision Sciences 0.035 9 0.025 14 0.029 9 0.023 15DSS Decision Support Systems 0.006 29 0.015 25 0.009 26 0.015 25EJOR European Journal of Operational Research 0.019 17 0.025 13 0.022 11 0.028 9IFACE Interfaces 0.022 16 0.017 22 0.022 12 0.019 19IIE IIE Transactions 0.025 14 0.022 17 0.02 16 0.02 18IJOC Informs Journal on Computing 0.032 10 0.027 10 0.024 10 0.024 14IJOPM International Journal of Operations and
Production Management 0.016 22 0.012 27 0.017 20 0.012 27IJPE International Journal of Production
Economics 0.015 24 0.014 26 0.015 22 0.016 24IJPR International Journal of Production
Research 0.007 27 0.008 30 0.007 28 0.009 30JCO Journal of Combinatorial Optimization 0.007 28 0.018 21 0.006 29 0.016 22JGO Journal of Global Optimization 0.013 25 0.026 12 0.018 19 0.026 10JMS Journal of Manufacturing Systems 0.002 30 0.003 31 0.001 31 0.003 31JOH Journal of Heuristics 0.018 20 0.015 23 0.012 25 0.013 26JOM Journal of Operations Management 0.06 5 0.042 7 0.094 3 0.047 6JORS Journal of the Operational Research Society 0.016 23 0.015 24 0.015 23 0.016 23JOS Journal of Scheduling 0.028 13 0.024 15 0.021 14 0.022 16M&SOM M&SOM-Manufacturing & Service
Operations Management 0.148 1 0.069 5 0.125 1 0.071 5MCM Mathematical and Computer Modeling 0.001 31 0.011 28 0.002 30 0.01 28MOR Mathematics of Operations Research 0.04 8 0.086 2 0.038 8 0.08 3MP Mathematical Programming 0.045 7 0.073 4 0.069 6 0.083 2MS Management Science 0.07 4 0.143 1 0.105 2 0.142 1NET Networks 0.018 19 0.02 20 0.016 21 0.019 20
/tt/file_convert/5ae158367f8b9ad47c8bb217/document.docx 5/7/2023 2:38 PM 10

NRL Naval Research Logistics 0.029 11 0.029 9 0.021 15 0.025 11OMEGA Omega-The International Journal of
Management Science 0.017 21 0.021 19 0.02 17 0.025 12OR Operations Research 0.095 2 0.075 3 0.089 4 0.077 4ORL Operations Research Letters 0.029 12 0.027 11 0.022 13 0.024 13POM Production and Operations Management 0.081 3 0.04 8 0.075 5 0.042 8TS Transportation Science 0.055 6 0.046 6 0.047 7 0.046 7
From the results presented in Table 3, we highlight some interesting findings. In particular, we note that there are two top journals, Manufacturing & Service Operations Management (M&SOM) and Management Science (MS). Despite it being indexed by the SCI only in 2008, M&SOM has managed to rank first for when (β =0.0, γ =0.0) and when (β =1.0, γ =0.0), and is ranked fifth when (β =0.0, γ =1.0) and when (β =1.0, γ =1.0). What these rankings suggest are that despite it being a relatively new entrant, M&SOM is a specialized journal that is highly regarded within the discipline. On the other hand, MS, which is a well-established journal, is ranked first for when (β =0.0, γ =1.0) and when (β =1.0, γ =1.0), is ranked fourth when (β =0.0, γ =0.0), and is ranked second when (β =1.0, γ =0.0). These rankings suggest that MS has established itself as a generalized journal and therefore, has more external impact (outside its discipline) compared to M&SOM.
Next, we present in Table 4, the rankings as computed by Xu et al.’s Quality Index (QI), SCI’s Impact Factor (IF), and Eigenfactor’s Article Influence (AI) for 2010, and discuss the more significant ranking disparities. Thus, where there are significant ranking disparities between the QI and IF, the rows are highlighted in blue. And because SCI’s IF method treats all citations equally, we elected to use QI’s results for when (β =1.0, γ =1.0) so that all citation types are also taken into account.
From the table, what is most notable is that Mathematics of Operations Research (MOR), one of the most highly regarded journals in the domain, is only ranked 21st by the IF. Rankings of other traditionally well-regarded journals such as Mathematical Programming (MP) and Transportation Science (TS) also exhibit considerable disparities between the QI and IF. The significant disparity in the case of MOR highlights what we have argued earlier; that the weighting of journals based on impact affect their placements, and hence, transitive relationships should be taken into account when conducting citation analyses.
Another interesting point to note is that, with the exception of Journal of Global Optimization (JGO) and Journal of Heuristics (JOH) (as highlighted in yellow), the rankings computed by Eigenfactor’s AI method appear to be closer to the results derived from Xu et al.’s QI. Indeed, while the QI and AI share similar methodological philosophies and roots, we believe the differences might be due to the several factors listed in Table 1 of Section 2 (i.e. using damping factor for AI but not for QI, consideration of the cited time window, and/or the consideration or disregard for self-citations).
/tt/file_convert/5ae158367f8b9ad47c8bb217/document.docx 5/7/2023 2:38 PM 11

Further, based on the Kendall Rank-Order Correlation coefficients in Table 5, we observe that the AI is closer to the QI than the IF; where the value of QI (β=0 , γ=0) and AI stands at 0.715 and the value of QI (β=1 , γ=1) and AI stands at 0.723 with a significance level of 0.00000. These two values are significantly larger when comparing the QI with other methods.
Table 4: Ranking Comparisons between QI, IF and AI Rank Orders for 2010
Journal QI(β =1.0, γ =1.0)
IF 2010
AI2010
Disparity(QI – IF)
Disparity(QI - AI)
Acronym Name Rank Rank Rank Positions PositionsAOR Annals of Operations Research 21 30 19 -9 2CIE Computers and Industrial Engineering 29 14 28 15 1COR Computers and Operations Research 17 12 14 5 3DS Decision Sciences 15 3 9 12 6DSS Decision Support Systems 25 6 20 19 5EJOR European Journal of Operational Research 9 5 16 4 -7IFACE Interfaces 19 28 27 -9 -8IIE IIE Transactions 18 17 17 1 1IJOC Informs Journal on Computing 14 19 12 -5 2IJOPM International Journal of Operations and
Production Management 27 18 23 9 4IJPE International Journal of Production Economics 24 9 22 15 2IJPR International Journal of Production Research 30 24 30 6 0JCO Journal of Combinatorial Optimization 22 27 25 -5 -3JGO Journal of Global Optimization 10 20 24 -10 -14JMS Journal of Manufacturing Systems 31 31 31 0 0JOH Journal of Heuristics 26 13 15 13 11JOM Journal of Operations Management 6 1 5 5 1JORS Journal of the Operational Research Society 23 22 26 1 -3JOS Journal of Scheduling 16 16 11 0 5M&SOM M&SOM-Manufacturing & Service Operations
Management 5 7 2 -2 3MCM Mathematical and Computer Modeling 28 23 29 5 -1MOR Mathematics of Operations Research 3 21 8 -18 -5MP Mathematical Programming 2 10 3 -8 -1MS Management Science 1 4 1 -3 0NET Networks 20 25 18 -5 2NRL Naval Research Logistics 11 26 13 -13 -2OMEGA Omega-The International Journal of
Management Science 12 2 10 10 2OR Operations Research 4 8 4 -4 0ORL Operations Research Letters 13 29 21 -16 -8POM Production and Operations Management 8 11 7 -3 1TS Transportation Science 7 15 6 -8 1
Table 5: Kendall Rank-Order Correlation coefficients among the various ranking methodologies.
/tt/file_convert/5ae158367f8b9ad47c8bb217/document.docx 5/7/2023 2:38 PM 12

QualityIndex¿
γ=1¿
JCR(2010) Xu et al. (2011) Olson’s Survey(2005)
GormanKanet’s
AAI(2005)
ImpactFactor
Article Influence
Score
¿γ=0¿
¿γ=1¿
QualityIndex
¿γ=0¿
Coefficient 0.683 0.286 0.715 0.609 0.48 0.553 0.547Sig.(2-tailed) 0.00000 0.024863 0.00000 0.00000 0.00021 0.00001 0.00083N 31 31 30 30 30 31 20
¿γ=1¿
Coefficient 0.31 0.723 0.503 0.503 0.555 0.537Sig.(2-tailed) 0.015064 0.00000 0.00010 0.00012 0.00001 0.00105N 31 30 30 30 31 20
JCR(2010)
ImpactFactor
Coefficient 0.457 0.168 0.131 -0.0409 -0.0316Sig.(2-tailed) 0.00041 0.19895 0.31775 0.75965 0.87113N 30 30 30 31 20
Article Influence
Score
Coefficient 0.49 0.416 0.384 0.368Sig.(2-tailed) 0.00015 0.00132 0.00306 0.03007N 30 30 30 19
Xu et al.(2011)
¿γ=0¿
Coefficient 0.669 0.49 0.532Sig.(2-tailed) 0.000000 0.00016 0.00164N 30 30 19
¿γ=1¿
Coefficient 0.508 0.462Sig.(2-tailed) 0.00009 0.00636N 30 19
Olson’ Survey (2005)Coefficient 0.663Sig.(2-tailed) 0.00005N 20
4.2 2006 – 2010 Rolling Reviews
Although our main purpose is to update the rankings of selected OR/MS journals, it is also interesting to observe the trends that have surfaced over the past five years leading up to the 2010 rankings since the most recent review was done with 2004 data. Thus, in this subsection, we not only present two five-year rolling reviews based on the QI method of the 31 selected OR/MS journals from 2006 to 2010, we also present two five-year rolling reviews, one based on the AI method and one on the IF method, of the same set of OR/MS journals from 2006 to 2010.
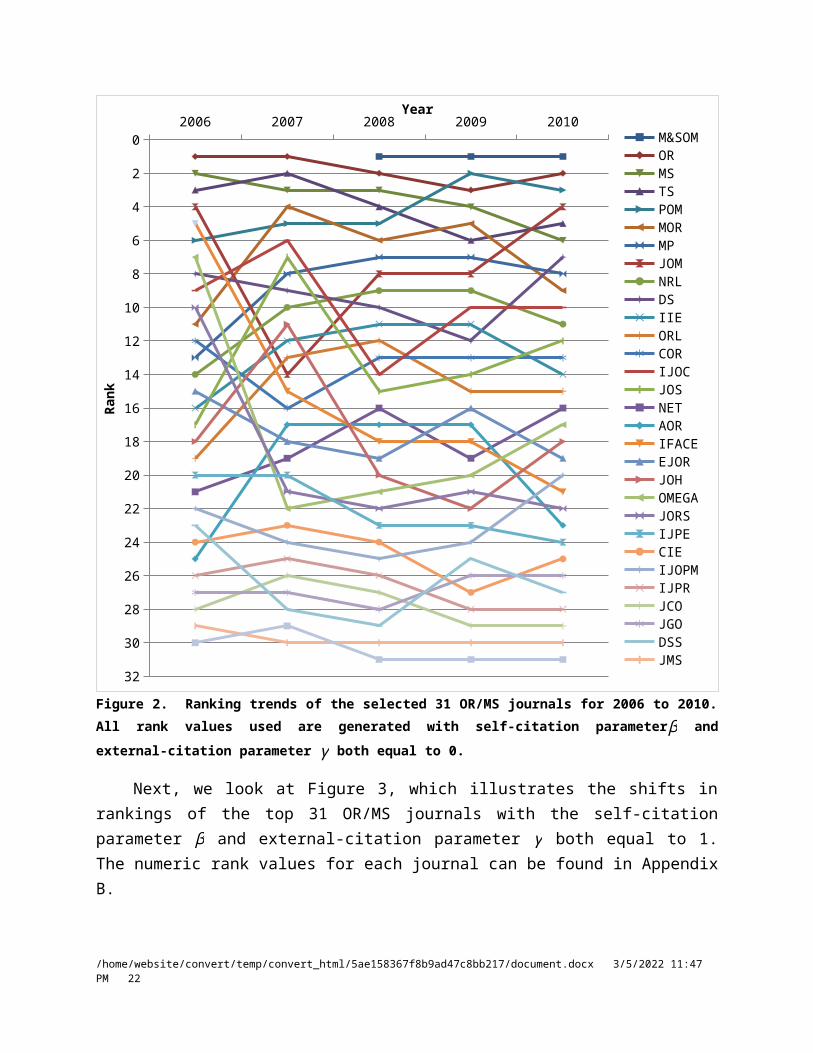
We begin with Figure 2, which illustrates the shifts in rankings of the top 31 journals only within the OR/MS discipline as the self-citation parameter β and external-citation parameter γ are both equal to 0. The numeric rank values for each journal can be found in Appendix A.
The results show that M&SOM, indexed since 2008, is consistently being held in high regard; consistent with Olson’s opinion survey in 2005, the journal clearly earned itself this reputation even before being indexed by SCI. As seen from the figure, with the exception of JOM, the rankings for the top five journals have been more or less consistent throughout the years. The bottom few journals are also quite consistently ordered.
/tt/file_convert/5ae158367f8b9ad47c8bb217/document.docx 5/7/2023 2:38 PM 13
However, the pattern in the rankings between the top and bottom five journals is quite interesting. We observe that from 2006 to 2008, the rankings within this segment are quite erratic, but which became much more consistent from 2008 to 2010. While we can speculate that perhaps a shift of some sort occurred in 2008, we are unable to scientifically pinpoint why this pattern has emerged without conducting further analysis. As such, we note this observation as is and look to extend our research into this interesting observation in the near future.
2006 2007 2008 2009 20100
2
4
6
8
10
12
14
16
18
20
22
24
26
28
30
32
M&SOMORMSTSPOMMORMPJOMNRLDSIIEORLCORIJOCJOSNETAORIFACEEJORJOHOMEGAJORSIJPECIEIJOPMIJPRJCOJGODSSJMSMCM
Year
Rank
Figure 2. Ranking trends of the selected 31 OR/MS journals for 2006 to 2010. All rank values used are generated with self-citation parameterβ and external-citation parameter γ both equal to 0.
Next, we look at Figure 3, which illustrates the shifts in rankings of the top 31 OR/MS journals with the self-citation parameter β and external-citation parameter γ both equal to 1. The
/tt/file_convert/5ae158367f8b9ad47c8bb217/document.docx 5/7/2023 2:38 PM 14
numeric rank values for each journal can be found in Appendix B.
2006 2007 2008 2009 20100
2
4
6
8
10
12
14
16
18
20
22
24
26
28
30
32
MSMPORTSM&SOMMORPOMJOMDSNETEJORORLIIEJGONRLIFACEIJOCCORAORDSSOMEGAJOHIJPEJOSJORSIJOPMJCOMCMCIEIJPRJMS
Year
Rank
Figure 3 Ranking trends of the selected 31 OR/MS journals for 2006 to 2010. All rank values used are generated with self-citation parameterβ and external-citation parameter γ both equal to 1.
With the exception of the Journal of Heuristics (JOH), the rankings of the top and bottom five journals are rather consistent; much like when (β = 0.0, γ = 0.0). However, the pattern of the rankings of the bulk of the middle tier journals appears to be more volatile than (β = 0.0, γ = 0.0). We believe that a plausible explanation for this volatility is that journal influence for when (β =
/tt/file_convert/5ae158367f8b9ad47c8bb217/document.docx 5/7/2023 2:38 PM 15

1.0, γ = 1.0) is computed based on the universal journal list, which is well over 10,000 journals. Therefore, we postulate that the share of journal influence per journal is significantly lesser when (β = 1.0, γ = 1.0). This means that the QI of journals is extremely close, and the tiniest gap would significantly affect a journal’s placement. This is unlike the ranking criteria of (β = 0.0, γ = 0.0), where a journal’s influence is computed based on a journals set list specifically within the OR/MS discipline.
Overall, the mid tier patterns that have emerged when (β = 0.0, γ = 0.0) and (β = 1.0, γ = 1.0) are very interesting. These patterns could very well indicate that (1) expert perceptions are muddied after the top five journals or so, and/or that (2) newly appointed editors have tremendous influence on the structure of the journals, such that they subsequently attract or repel certain scholars to publish their research in those journals. There could very well be other explanations apart from those we have suggested. It is our intention to extend our research into these interesting observations in the near future.
Next, in Figure 4, we discuss the shifts in rankings of the selected 31 journals based on Eigenfactor’s AI method from 2006 to 2010. Unsurprisingly, the patterns observed in Figure 4 are similar to those in Figure 3. The ranks of top and bottom journals are relatively stable. Mid-tier journals vary largely with rankings. With that said, there are still some differences between these two methods. In particular, in Figure 3, MS is consistently ranked 1st while MSOM is ranked 1st for 2008 and 2009 in Figure 4. This reinforces our previous conclusion that the AI and QI share similar methodological roots but hold their own characteristics in terms of implementation.
Last but not least, we present Figure 5, which illustrates the shifts in rankings of the same 31 OR/MS journals based on JCR’s IF from 2006 to 2010. We observe that there are no discernable patterns; every segment of IF’s rankings is volatile. This is not domain-specific. In fact, Gorraiz, Gumpenberger, Schloegl and Wieland (2012) reported similar findings in domains such as Polymer Science, Nanoscience and Nanotechnology, Political Science, and Library and Information Science. Gorraiz et al. (2012) contend that this is possibly due to the shorter citation time window that the IF is based on (2 years). However, Eigenfactor’s AI uses a five-year time window while Xu et al.’s QI uses a ten-year time window. All in all, we posit that an article’s impact may not be fully realized within the timeframe because articles can take longer than two years for their influence to be observed since journals typically have lengthy submission-review-revision-acceptance cycles (see Feng & Chen, 2011). That as a result, the influence of articles cited after their two-year rolling timeframe is not only ignored, it appears to favor journals that have faster turnaround cycles, and also ignores articles that have longitudinal impact. These results strengthen our argument that not only is the IF method flawed because it does not differentiate among the citations, the fact that the method only considers a journal’s impact factor for two rolling years would significantly affect the rankings of journals (positively for fast turnaround journals and negatively for slow turnaround journals). Apart from these observations, results derived via the IF method also do not correlate with expert opinions (see
/tt/file_convert/5ae158367f8b9ad47c8bb217/document.docx 5/7/2023 2:38 PM 16

Table 5). Finally, the numeric rank values for each journal can be found in Appendix C for those who are curious about ranking comparisons between the QI and IF’s five-year reviews.
2006 2007 2008 2009 20100
2
4
6
8
10
12
14
16
18
20
22
24
26
28
30
32
M&SOM
MS
MP
OR
TS
MOR
IJOC
JOM
DS
POM
JOS
ORL
OMEGA
NET
IIE
COR
JGO
JOH
EJOR
IJPE
NRL
DSS
JCO
AOR
JORS
CIE
IJOPM
IFACE
IJPR
MCM
JMS
Year
Rank
Figure 4 Shifts in ranking of 31 OR/MS journals based on Eigenfactor’s Article Influence method from 2006 to 2010.
/tt/file_convert/5ae158367f8b9ad47c8bb217/document.docx 5/7/2023 2:38 PM 17

2006 2007 2008 2009 20100
2
4
6
8
10
12
14
16
18
20
22
24
26
28
30
32
JOMOMEGADSMSEJORDSSM&SOMORIJPEMPPOMCORJOHCIETSJOSIIEIJOPMIJOCJGOMORJORSMCMIJPRNETNRLJCOIFACEORLAORJMS
Year
Rank
Figure 5 Shifts in ranking of 31 OR/MS journals derived via JCR’s IF from 2006 to 2010.
/tt/file_convert/5ae158367f8b9ad47c8bb217/document.docx 5/7/2023 2:38 PM 18

5 Conclusions
This study not only presents an updated review of 31 selected OR/MS journals indexed by SCI, it also presents an emerging journals evaluation approach based on a refined PageRank method which differentiates the impacts of journals by citation types. Additionally, four longitudinal reviews are also provided to establish the trends or shifts in the rankings from 2006 to 2010.
In our 2010 cross-sectional analysis, we find that M&SOM, indexed by the SCI only in 2008, is a specialized journal that is consistently highly regarded within the discipline. The results also suggest that MS is more established as a generalized journal as it has more external impact compared to M&SOM. Additionally, not only do our results correlate better with expert opinions, but based on the Kendall Rank-Order Correlation coefficients, we also found that the results generated by Eigenfactor’s AI method are significantly closer to ours than the results generated by SCI’s IF. This is likely due to the fact that Eigenfactor’s AI and the method we use (Xu et al.’s QI) share similar methodological roots.
As for the longitudinal analyses we conducted, we also observe some interesting patterns over the past five years (from 2006 to 2010). In particular, even though they have dissimilar characteristics in terms of implementation, we found that the patterns observed between the AI and QI are similar. This is likely because they share similar methodological roots. Nevertheless, the results of both methods show volatility in the mid-tier journals despite our results correlating with expert opinions. As for SCI’s IF, there appears to be no discernable patterns; that every segment of IF’s rankings is volatile. On that note, we intend to further our research to identify or determine the cause(s) for the volatility.
Finally, the findings, shifts and patterns observed in the selected OR/MS journal rankings lead us to affirm that cross-sectional and longitudinal analyses are essential to more comprehensively evaluate a journal’s impact/quality. We also believe that with time and greater exposure, the proposed approach to evaluate journals based on more than one perspective could facilitate academic stakeholders in formulating and strengthening their opinions of journals of interest because they can refer to quantitatively derived information rather than rely on subjective perceptions. Summarily, we contend that this proposed model with further refinements paves the way for further research exploration and development in this relatively new research domain.
/tt/file_convert/5ae158367f8b9ad47c8bb217/document.docx 5/7/2023 2:38 PM 19

Appendix A: Ranks of OR/MS Journals Based on PageRank (β = 0.0, γ = 0.0) (From 2006 to 2010)
The following table lists the ranking of the top 31 OR/MS journals from 2006 to 2010. Columns 1 and 2 show the acronym and full name of the journals, respectively. Columns 3 – 7 show their rankings from 2006 to 2010. The self-citation parameter β and the external-citation parameter γ are both equal to 0. Columns 8 and 9 are the average rank and the rank value’s standard deviation, respectively.
Journal Citation YearAverage
RankStandardDeviationAcronym Full Name
2006 2007 2008 2009 2010AOR Annals of Operations Research 25 17 17 17 23 19.8 3.49CIE Computers and Industrial Engineering 24 23 24 27 25 24.6 1.36COR Computers and Operations Research 12 16 13 13 13 13.4 1.36DS Decision Sciences 8 9 10 12 7 9.2 1.72DSS Decision Support Systems 23 28 29 25 27 26.4 2.15EJOR European Journal of Operations Research 15 18 19 16 19 17.4 1.62IFACE Interfaces 5 15 18 18 21 15.4 5.54IIE IIE Transactions 16 12 11 11 14 12.8 1.94IJOC Informs Journal on Computing 9 6 14 10 10 9.8 2.56
IJOPMInternational Journal of Operations and Production Management 22 24 25 24 20 23 1.79
IJPE International Journal of Production Economics 20 20 23 23 24 22 1.67IJPR International Journal of Production Research 26 25 26 28 28 26.6 1.20JCO Journal of Combinatorial Optimization 28 26 27 29 29 27.8 1.17JGO Journal of Global Optimization 27 27 28 26 26 26.8 0.75JMS Journal of Manufacturing Systems 29 30 30 30 30 29.8 0.40JOH Journal of Heuristics 18 11 20 22 18 17.8 3.71JOM Journal of Operations Management 4 14 8 8 4 7.6 3.67JORS Journal of the Operational Research Society 10 21 22 21 22 19.2 4.62JOS Journal of Scheduling 17 7 15 14 12 13 3.41
M&SOMM&SOM-Manufacturing & Service Operations Management 1 1 1 1 0.00
MCM Mathematical and Computer Modeling 30 29 31 31 31 30.4 0.80MOR Mathematics of Operations Research 11 4 6 5 9 7 2.61MP Mathematical Programming 13 8 7 7 8 8.6 2.25MS Management Science 2 3 3 4 6 3.6 1.36NET Networks 21 19 16 19 16 18.2 1.94NRL Naval Research Logistics 14 10 9 9 11 10.6 1.85OMEGA Omega 7 22 21 20 17 17.4 5.46OR Operations Research 1 1 2 3 2 1.8 0.75ORL Operations Research Letters 19 13 12 15 15 14.8 2.40POM Production and Operations Management 6 5 5 2 3 4.2 1.47TS Transportation Science 3 2 4 6 5 4 1.41
/tt/file_convert/5ae158367f8b9ad47c8bb217/document.docx 5/7/2023 2:38 PM 20

Appendix B: Ranks of OR/MS Journals Based on PageRank (β = 1.0, γ = 1.0) (From 2006 to 2010)
The following table lists the ranking of the top 31 OR/MS journals from 2006 to 2010. Columns 1 and 2 show the acronym and full name of the journals, respectively. Columns 3 – 7 show their rankings from 2006 to 2010. The self-citation parameter β and the external-citation parameter γ are both equal to 1. Columns 8 and 9 are the average rank and the rank value’s standard deviation, respectively.
Journal Citation YearAverage
RankStandardDeviationAcronym Full Name
2006 2007 2008 2009 2010AOR Annals of Operations Research 25 16 19 19 24 20.6 3.38CIE Computers and Industrial Engineering 27 27 29 30 28 28.2 1.17COR Computers and Operations Research 18 18 18 15 14 16.6 1.74DS Decision Sciences 11 6 9 9 11 9.2 1.83DSS Decision Support Systems 22 22 20 16 19 19.8 2.23EJOR European Journal of Operations Research 15 12 11 11 10 11.8 1.72IFACE Interfaces 8 11 16 23 23 16.2 6.11IIE IIE Transactions 21 14 13 12 13 14.6 3.26IJOC Informs Journal on Computing 9 7 17 18 15 13.2 4.40
IJOPMInternational Journal of Operations and Production Management 26 26 26 26 25 25.8 0.40
IJPE International Journal of Production Economics 19 21 23 20 21 20.8 1.33IJPR International Journal of Production Research 28 28 30 29 30 29 0.89JCO Journal of Combinatorial Optimization 24 25 27 25 26 25.4 1.02JGO Journal of Global Optimization 20 19 14 13 20 17.2 3.06JMS Journal of Manufacturing Systems 30 30 31 31 31 30.6 0.49JOH Journal of Heuristics 16 17 22 27 27 21.8 4.71JOM Journal of Operations Management 4 13 8 8 6 7.8 2.99JORS Journal of the Operational Research Society 7 23 25 24 22 20.2 6.68JOS Journal of Scheduling 17 9 24 21 16 17.4 5.08
M&SOMM&SOM-Manufacturing & Service Operations Management 5 3 4 4 0.82
MCM Mathematical and Computer Modeling 29 29 28 28 29 28.6 0.49MOR Mathematics of Operations Research 3 3 6 5 5 4.4 1.20MP Mathematical Programming 5 2 2 2 2 2.6 1.20MS Management Science 1 1 1 1 1 1 0.00NET Networks 13 10 10 17 17 13.4 3.14NRL Naval Research Logistics 23 20 15 14 12 16.8 4.07OMEGA Omega 12 24 21 10 8 15 6.32OR Operations Research 6 4 3 4 3 4 1.10ORL Operations Research Letters 14 15 12 22 18 16.2 3.49POM Production and Operations Management 10 8 7 6 7 7.6 1.36TS Transportation Science 2 5 4 7 9 5.4 2.42
/tt/file_convert/5ae158367f8b9ad47c8bb217/document.docx 5/7/2023 2:38 PM 21
APPENDIX C: Ranking Comparisons between Quality Index (QI) and SCI’s JCR IF (IF) (From 2006 to 2010)
JournalAcronym
QI2006
IF2006
QI2007
IF 2007
QI 2008
IF 2008
QI2009
IF 2009
QI 2010
IF2010
AOR 25 24 16 27 19 28 19 25 24 30CIE 27 19 27 25 29 18 30 13 28 14COR 18 11 18 9 18 13 15 7 14 12DS 11 4 6 6 9 4 9 4 11 3DSS 22 8 22 10 20 8 16 3 19 6EJOR 15 10 12 11 11 10 11 8 10 5IFACE 8 29 11 22 16 30 23 28 23 28IIE 21 20 14 18 13 22 12 23 13 17IJOC 9 12 7 15 17 20 18 17 15 19IJOPM 26 22 26 12 26 9 26 16 25 18IJPE 19 7 21 14 23 6 20 10 21 9IJPR 28 14 28 24 30 25 29 29 30 24JCO 24 21 25 23 27 27 25 26 26 27JGO 20 25 19 17 14 17 13 15 20 20JMS 30 30 30 30 31 31 31 31 31 31JOH 16 17 17 20 22 16 27 19 27 13JOM 4 2 13 3 8 1 8 1 6 1JORS 7 23 23 19 25 23 24 24 22 22JOS 17 13 9 13 24 19 21 18 16 16M&SOM N/A N/A N/A N/A 5 14 3 6 4 7MCM 29 27 29 28 28 21 28 21 29 23MOR 3 15 3 16 6 15 5 22 5 21MP 5 9 2 4 2 3 2 11 2 10MS 1 3 1 2 1 2 1 5 1 4NET 13 26 10 21 10 29 17 20 17 25NRL 23 28 20 26 15 26 14 27 12 26OMEGA 12 18 24 8 21 5 10 2 8 2OR 6 6 4 5 3 12 4 12 3 8ORL 14 16 15 29 12 24 22 30 18 29POM 10 1 8 1 7 7 6 9 7 11TS 2 5 5 7 4 11 7 14 9 15
/tt/file_convert/5ae158367f8b9ad47c8bb217/document.docx 5/7/2023 2:38 PM 22

References
Agrawal, V. K., Agrawal, V., & Rungtusanatham, M. (2011). Theoretical and interpretation challenges to using the author affiliation index method to rank journals. Production and Operations Management, 20(2), 280-300.
Barman, S., Hanna, M. D., & LaForge, R. L. (2001). Perceived relevance and quality of POM journals: a decade later. Journal of Operations Management, 19(3), 367-385.
Barman, S., Tersine, R. J., & Buckley, M. R. (1991). An empirical assessment of the perceived relevance and quality of POM-related journals by academicians. Journal of Operations Management, 10(2), 194-212.
Bressan, M., & Peserico, E. (2010). Choose the damping, choose the ranking?. Journal of Discrete Algorithms, 8(2), 199-213.
Brin, S., & Page, L. (1998). The anatomy of a large-scale hypertextual Web search engine. Computer networks and ISDN systems, 30(1), 107-117.
Butler, D. (2008). Free journal-ranking tool enters citation market. Nature, 451(7174), 6.
Cheang, B., Chu, S. K. W., Li, C., & Lim, A, (2013). A Multidimensional Approach to Evaluating Management Journals: Refining PageRank via the Differentiation of Citation Types and Identifying the Roles that Management Journals Play. Journal of American Society for Information Science and Technology, Accepted, forthcoming.
Chen, C. R., & Huang, Y. (2007). Author Affiliation Index, finance journal ranking, and the pattern of authorship. Journal of Corporate Finance, 13(5), 1008-1026.
Colquitt, L. L. (1997). Relative significance of insurance and actuarial journals and articles: A citation analysis. Journal of Risk and Insurance, 505-527.
DuBois, F. L., & Reeb, D. (2000). Ranking the international business journals. Journal of International Business Studies, 31(4), 689-704.
Feng, Y., & Chen, Y. F. (2011). TECHNICAL NOTE—A Computational Approach for Optimal Joint Inventory-Pricing Control in an Infinite-Horizon Periodic-Review System. Operations Research, 59(5), 1297-1303.
Glanzel, W., & Moed, H. F. (2002). Journal impact measures in bibliometric research. Scientometrics, 53(2), 171-193.
Goh, C. H., Holsapple, C. W., Johnson, L. E., & Tanner, J. (1996). An empirical assessment of influences on POM research. Omega, 24(3), 337-345.
/tt/file_convert/5ae158367f8b9ad47c8bb217/document.docx 5/7/2023 2:38 PM 23

Goh, C. H., Holsapple, C. W., Johnson, L. E., & Tanner, J. R. (1997). Evaluating and classifying POM journals. Journal of Operations Management,15(2), 123-138.
Gonzalez-Pereira, B., Guerrero-Bote, V. P., & Moya-Anegón, F. (2010). A new approach to the metric of journals’ scientific prestige: The SJR indicator. Journal of Informetrics, 4(3), 379-391.
Gorman, M. F., & Kanet, J. J. (2005). Evaluating Operations Management–Related Journals via the Author Affiliation Index. Manufacturing & Service Operations Management, 7(1), 3-19.
Gorman, M. F., & Kanet, J. J. (2007). Note—“OM Forum: Evaluating Operations Management–Related Journals via the Author Affiliation Index”—Do Professors at Top US Business Schools Do What They Say?. Manufacturing & Service Operations Management, 9(1), 51-53.
Gorraiz, J., Gumpenberger, C., Schloegl, C., & Wieland, M. (2012, September). On the temporal stability of Garfield’s impact factor and its suitability to identify hot papers. In 17th International Conference on Science and Technology Indicators (STI) (pp. 5-8).
Guerrero-Bote, V. P., & Moya-Anegón, F. (2012). A further step forward in measuring journals’ scientific prestige: The SJR2 indicator. Journal of Informetrics, 6(4), 674-688.
Harless, D., & Reilly, R. (1998). Revision of the journal list for doctoral designation. Unpublished report, Virginia Commonwealth University, Richmond, VA.
Harzing, A. (2007). Publish or Perish. Available from her website at http://www.harzing.com/pop.htm
Leydesdorff, L. (2008). Caveats for the use of citation indicators in research and journal evaluations. Journal of the American Society for Information Science and Technology, 59(2), 278-287.
Lim, A., Ma, H., Wen, Q., Xu, Z., & Cheang, B. (2009). Distinguishing citation quality for journal impact assessment. Communications of the ACM, 52(8), 111-116.
Lim, A., Ma, H., Wen, Q., Xu, Z., Cheang, B., Tan, B., & Zhu, W. (2007). Journal-Ranking. com: an online interactive journal ranking system. In Proceeding of the National Conference on Artificial Intelligence (Vol. 22, No. 2, p. 1723). Menlo Park, CA; Cambridge, MA; London; AAAI Press; MIT Press; 1999.
Moed, H., Colledge, L., Reedijk, J., Moya-Anegon, F., Guerrero-Bote, V., Plume, A., & Amin, M. (2012). Citation-based metrics are appropriate tools in journal assessment provided that they are accurate and used in an informed way. Scientometrics, 92, 367-376.
Monastersky, R. (2005). The Number That's Devouring Science. The Chronicle.
/tt/file_convert/5ae158367f8b9ad47c8bb217/document.docx 5/7/2023 2:38 PM 24
Olson, J. E. (2005). Top-25-business-school professors rate journals in operations management and related fields. Interfaces, 35(4), 323-338.
Page, L., Brin, S., Motwani, R., & Winograd, T. (1999). The PageRank citation ranking: bringing order to the web. Technical Report. Stanford InfoLab
Palacios‐Huerta, I., & Volij, O. (2004). The measurement of intellectual influence. Econometrica, 72(3), 963-977.
Pendlebury, D. A. (2009). The use and misuse of journal metrics and other citation indicators. Archivum immunologiae et therapiae experimentalis, 57(1), 1-11.
Pinski, G., & Narin, F. (1976). Citation influence for journal aggregates of scientific publications: Theory, with application to the literature of physics. Information Processing & Management, 12(5), 297-312.
Robey, D., & Markus, M. L. (1998). Beyond rigor and relevance: producing consumable research about information systems. Information Resources Management Journal, 11(1), 7-16.
Rousseau, R. (2002). Journal evaluation: technical and practical issues. Library Trends, 50(3), 418-439.
Saladin, B. (1985). Operations management research: Where should we publish. Operations Management Review, 3(4), 3-9.
Seglen, P. O. (1997). Why the impact factor of journals should not be used for evaluating research. BMJ: British Medical Journal, 314(7079), 498.
Smith, R. (2006). Commentary: The power of the unrelenting impact factor—Is it a force for good or harm?. International Journal of Epidemiology, 35(5), 1129-1130.
Theoharakis, V., Voss, C., Hadjinicola, G. C., & Soteriou, A. C. (2007). Insights into factors affecting Production and Operations Management (POM) journal evaluation. Journal of Operations Management, 25(4), 932-955.
Vastag, G., & Montabon, F. (2002). Journal characteristics, rankings and social acculturation in operations management. Omega, 30(2), 109-126.
Vokurka, R. J. (1996). The relative importance of journals used in operations management research a citation analysis. Journal of Operations Management,14(4), 345-355.
Weingart, P. (2005). Impact of bibliometrics upon the science system: Inadvertent consequences?. Scientometrics, 62(1), 117-131.
/tt/file_convert/5ae158367f8b9ad47c8bb217/document.docx 5/7/2023 2:38 PM 25

Wen, Q. (2008). Journal Impact Assessment: Methodology and Experiments. PhD Thesis, Chapter 2. The Hong Kong University of Science and Technology, Hong Kong).
West, J., Althouse, B., & Rosvall, M. (2008). EigenfactorTM Score and Article InfluenceTM
Score: Detailed Methods, Available at [http://www.eigenfactor.org/methods.pdf]
West, J., & Bergstrom, C.T. (2008). Pseudocode for calculating EigenfactorTM Score and Article InfluenceTM Score using data from Thomson-Reuters Journal Citations Reports, Available at
[http://octavia.zoology.washington.edu/people/jevin/Documents/JournalPseudocode_EF.pdf]
Xu, Z., Cheang, B., Lim, A., & Wen, Q. (2011). Evaluating OR/MS Journals via PageRank. Interfaces, 41(4), 375-388.
/tt/file_convert/5ae158367f8b9ad47c8bb217/document.docx 5/7/2023 2:38 PM 26