the impact of intellectual capital on companies ...web.hku.hk/~samchu/docs/li 2016 the impact of...
TRANSCRIPT

LI Zhicheng, CHEN Zhuoer, LUI Trevor Tin Shing, Dr. CHU Samuel Kai Wah / Procedia Computer Science 00 (2016) 000–000 1
I:\Sam-publications\published materials\conference papers\Li 2016 The Impact of Intellectual Capital on Companies’ Performances-2016-08-
05.docx 8/8/2016 4:13 PM 1
Citation: Li, Z., & Chen, Z., & Lui, T.T.S., & Chu, S.K.W. (2016). The Impact of Intellectual Capital on Companies’ Performances: A Study Based on MAKE Award Winners and Non-MAKE Award Winner Companies. International Conference on Knowledge Management, ICKM 2016, Vienna, Austria.
The Impact of Intellectual Capital on Companies’ Performances:
A Study Based on MAKE Award Winners and Non-MAKE Award
Winner Companies
LI Zhicheng
a, CHEN Zhuoer
b, LUI Trevor Tin Shing
c, Dr. CHU Samuel Kai Wah
d*
a,b,c,dFaculty of Education, The University of Hong Kong, Pok Fu Lam Road, Hong Kong
Abstract
Organizations believe that obtaining a knowledge management award will not only promote their brands but also
enhance their business performance. However, this may or may not be the case as there is no definitive evidence that
winning such an award would improve an organization’s business performance. The purpose of this study is to explore
whether companies that have received the Most Admired Knowledge Enterprise (MAKE) Award boast a better business performance than those that did not get the award (non-MAKE winner companies).
This research involves a quantitative analysis of business performance conducted based on the data collected from
fifty-nine previous MAKE winners and fifty-nine comparable non-MAKE winner companies according to their market
capitalization to identify similarities and differences. This study is limited by its small sample size and the difficulty of
identifying the comparable companies as many award winning companies already receive world-class recognition.
Based on the data analysis, capital efficiency (CEE) shows much higher explanatory power in the regression among
MAKE award winners than their counterparts. Human capital efficiency (HCE) and value added intellectual capital
(VAIC) are negatively correlated with ATO in non-MAKE winner companies. However, such correlation is not found in MAKE-award winners. Further implications are discussed in this paper.
© 2016 The Authors. Published by Elsevier B.V.
Peer-review under responsibility of the Organizing Committee of ICKM 2016.
Keywords: MAKE Award, Knowledge Management, Intellectual Capital, VAIC, Organizational Performance.
1. Introduction
An increasing number of companies put more emphasis on their intangible assets as they are regarded as a
company’s core competencies, as well as the main source of competitive advantage, in today’s business context
(Talukdar, A, 2008). In the literature, various models and methods have been built to measure one of the components
* Corresponding author. Tel.: +852-2241-5894; fax: +852-2241-5894.
E-mail address: [email protected]

LI Zhicheng, CHEN Zhuoer, LUI Trevor Tin Shing, Dr. CHU Samuel Kai Wah / Procedia Computer Science 00 (2016) 000–000 2
I:\Sam-publications\published materials\conference papers\Li 2016 The Impact of Intellectual Capital on Companies’ Performances-2016-08-
05.docx 8/8/2016 4:13 PM 2
of such intangible assets – intellectual capital (IC). However, a universally acceptable measure is still absent (Leon,
2012). As IC is hard to be quantified, traditional methods may not be suitable (Bismuth & Tojo, 2008; Zéghal &
Maaloul, 2010). Among the IC-measuring models developed, the Value Added Intellectual Coefficient (VAIC)
model created by Public in 2000, is one of the most widely adopted, thanks to its ease of calculation and
objectiveness (Chan, 2009; Firer & Williams, 2003).
Meanwhile, in order to “identify organizations which are outperforming their peers by above average growth in
intellectual capital and wealth creation”, Teleos and The KNOW Network established the Global Most Admired
Knowledge Enterprises (MAKE) research program in 1998 (MAKE, 2015). It has become an effective award system
on the regional, national and global levels.
1.1. Problem Statement
Thomas Stewart (1998, p.56), a pioneer in the field of intangible assets, defined IC as “intellectual material -
knowledge, information, intellectual property, experience - that can be put to use to create wealth”. Today, IC plays
an increasingly crucial role in knowledge management and a growing number of scholars and practitioners
concentrate on both practical and theoretical aspects of IC due to its increasing significance in survival and growth
of corporations (Bismuth & Tojo, 2008).
However, a universally acceptable measure of IC is still absent and there is no definite conclusion about the
association between IC and companies’ performance. Thus it raises a problem whether those companies which win
MAKE award perform better than Non-MAKE award companies.
Based on previous studies, this study will employ four accounting ratios: market valuation (MB), profitability
(ROA), return on equity (ROE) and productivity (ATO) as the four proxies of corporate business performance to dig
out the potential relationship between intellectual capital and performance. The analysis will be carried out in the
context of listed MAKE award recipients and their comparable non-MAKE award recipients.
1.2. Purpose of this Study
This study aims to empirically gauge the impact of IC as measured by VAIC and its components on business
performance in the context of selected listed MAKE-award winners and their comparable Non-MAKE recipient
counterparts from 2009 to 2014. Besides, by comparing the IC utilization between MAKE award corporations and
non-MAKE recipient counterparts, this study will try to examine the relationship between VAIC and the four
proxies of business performance. Moreover, the value of IC components and how synergies contribute in the value
creation process will be explored in this paper.
1.3. Significance of the Study
This paper provides a further empirical evidence about the IC utilization of MAKE winners and the non-MAKE
award corporations, which may inspire some insights for the KNOW Network. In addition, it could provide
empirical evidence of the dependability and reliability of using VAIC as an IC-measuring model to testify the
performance of both IC management and utilization of an organization.

LI Zhicheng, CHEN Zhuoer, LUI Trevor Tin Shing, Dr. CHU Samuel Kai Wah / Procedia Computer Science 00 (2016) 000–000 3
I:\Sam-publications\published materials\conference papers\Li 2016 The Impact of Intellectual Capital on Companies’ Performances-2016-08-
05.docx 8/8/2016 4:13 PM 3
2. Literature Review
There has not been a great deal of research conducted on the validity of the MAKE Award, though examining the
results of the preexisting studies could prove valuable. This study provides empirical evidence of the dependability
and reliability of using VAIC as an IC-measuring model to testify the performance of both IC management and
utilization of an organization. This part reviews the definition of IC and its qualitative and quantitative
measurements. Then we review and discuss the VAIC model and its shortcomings and performance.
2.1 Intellectual Capital
Along with the advancement of technology, the world is entering into the Information Era where knowledge is
now recognized as the driver of productivity and economic growth while information, technology, and learning have
taken a vital role in the establishment of a knowledge-based economy (OECD, 1996). Under this situation, the
concept of Intellectual Capital (IC), which was often undervalued by companies before has started to play an
increasingly important part in the business world recently.
As an important concept, however, the framework, management method and even definition of IC vary in
different research. For instance, the term ‘IC’ is not fixed and sometimes used interchangeably with ‘intangible
assets’, ‘intellectual assets’ and ‘knowledge assets’ (Dalkir, 2011). Although it is generally agreed that IC refers to a
series of intangible resources of an organization which can be used to create value for the company (Al-Ali, 2003; J.
Roos, 1998; Rumizen, 2002; Stewart, 1997), the content of IC remains different. Various models were designed
based on different points of view of the scholars and were used to demonstrate the components of IC and the
relationship between these elements for further explanations and investigation. These frameworks differ since the
focus and assumptions behind are not the same. For instance, the model put forward by Sullivan (Sullivan, 1998)
was considered as a model which mainly stressed on human resources (Jashapara, 2004) whereas Carucci focuses
more on maintaining companies’ competitive advantages (Carlucci, Schiuma, & AB, 2004).
Although there have been many IC models introduced recently, it can be observed that all these models consist of
three common core elements namely ‘Human Capital’, ‘Structural Capital’ and ‘Customer Capital’. ‘Human
Capital’ refers to the ability, knowledge, skills of every individual such as one’s commodity, leveraged and
proprietary skills, ‘Structural Capital’ refers to the capability and competency of the organisation in gathering
knowledge such as strategy, systems, and culture, and ‘Customer Capital’ refers to the tie between the company and
its target customer such as customers’ loyalty (Dalkir, 2011). In the light of these capitals or assets, administrators
would be in a better position to identify the capacities of individuals or the company as a whole and formulate
appropriate plans and strategies to cater for the needs of customers. Senior came up with the notion of intellectual
capital in 1836 and held the view that intellectual capital includes the knowledge and skills owned by individuals.
Edvinsson and Malone (1997) claimed that human capital (HC) and structural capital (SC) are different from
intellectual capital. Stewart (1997) divided IC into three basic forms: HC, SC and customer capital (CC). Leliaert et
al. in 2003 proposed a 4-Leaf Model and added the strategic alliance capital (SA) alongside. Bernard and Karim
utilized (2010) a systematic review process and provided a three-dimensional model--component parts of the
construct; role IC will take in an organization; and disciplinary perspective, to define IC.
2.2 Measurements of IC
Though there are various methods for measuring IC, a universally acknowledged measure is still absent. There
are several researchers have categorized the methods of IC measurements by a different way. For instance, Sveiby
(2010) has categorized forty-two methodologies for valuing intangible assets into four groups: direct IC methods,
LI Zhicheng, CHEN Zhuoer, LUI Trevor Tin Shing, Dr. CHU Samuel Kai Wah / Procedia Computer Science 00 (2016) 000–000 4
I:\Sam-publications\published materials\conference papers\Li 2016 The Impact of Intellectual Capital on Companies’ Performances-2016-08-
05.docx 8/8/2016 4:13 PM 4
Return-on-assets method, market capitalization methods and scorecard methods. And in this paper, we separated
them into qualitative and quantitative methods.
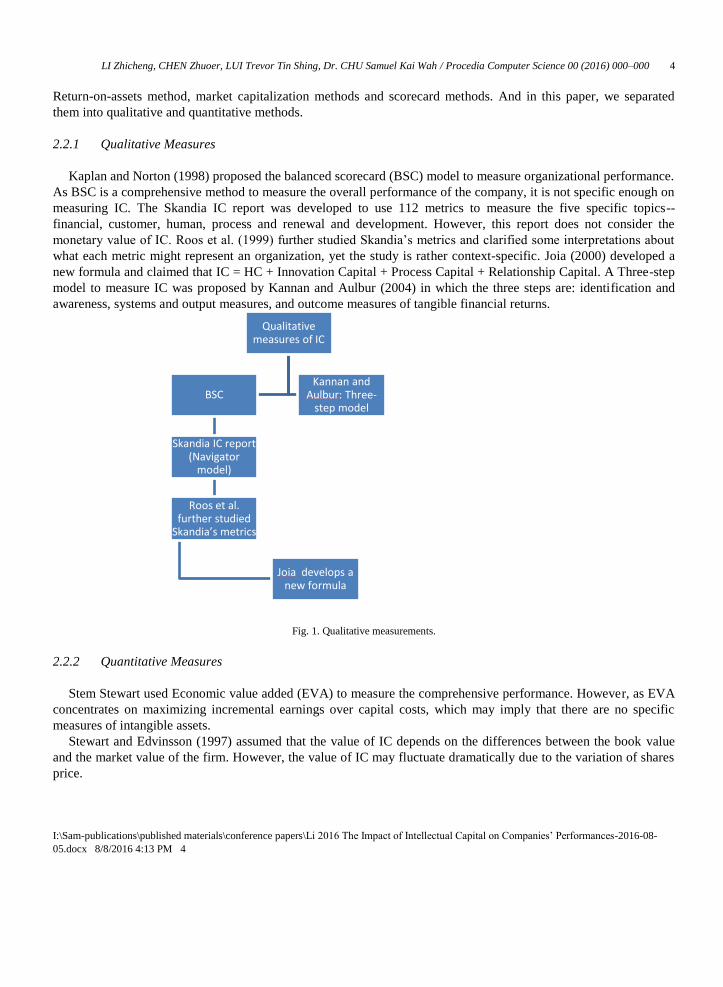
2.2.1 Qualitative Measures
Kaplan and Norton (1998) proposed the balanced scorecard (BSC) model to measure organizational performance.
As BSC is a comprehensive method to measure the overall performance of the company, it is not specific enough on
measuring IC. The Skandia IC report was developed to use 112 metrics to measure the five specific topics--
financial, customer, human, process and renewal and development. However, this report does not consider the
monetary value of IC. Roos et al. (1999) further studied Skandia’s metrics and clarified some interpretations about
what each metric might represent an organization, yet the study is rather context-specific. Joia (2000) developed a
new formula and claimed that IC = HC + Innovation Capital + Process Capital + Relationship Capital. A Three-step
model to measure IC was proposed by Kannan and Aulbur (2004) in which the three steps are: identification and
awareness, systems and output measures, and outcome measures of tangible financial returns.
Fig. 1. Qualitative measurements.
2.2.2 Quantitative Measures
Stem Stewart used Economic value added (EVA) to measure the comprehensive performance. However, as EVA
concentrates on maximizing incremental earnings over capital costs, which may imply that there are no specific
measures of intangible assets.
Stewart and Edvinsson (1997) assumed that the value of IC depends on the differences between the book value
and the market value of the firm. However, the value of IC may fluctuate dramatically due to the variation of shares
price.
Qualitative measures of IC
BSC
Skandia IC report (Navigator
model)
Roos et al. further studied
Skandia’s metrics
Joia develops a new formula
Kannan and Aulbur: Three-
step model

LI Zhicheng, CHEN Zhuoer, LUI Trevor Tin Shing, Dr. CHU Samuel Kai Wah / Procedia Computer Science 00 (2016) 000–000 5
I:\Sam-publications\published materials\conference papers\Li 2016 The Impact of Intellectual Capital on Companies’ Performances-2016-08-
05.docx 8/8/2016 4:13 PM 5
Luthy (1998) used Tobin’s Q to measure IC. Tobin’s Q is essentially the same as the market-to-book ratio except
that it uses replacement cost of tangible assets rather than book value of tangible assets in the calculation. Under
these circumstances, IC will be affected by the stock price.
Public (1998, 2000) used the “Value Added Intellectual Coefficient” (VAIC) to measure IC and believed that the
company’s ability to create value is a crucial factor to measure the value of IC. Lev and Feng’s (2001) methodology
was based on the concept of “production function”. However, this model requires the earnings of firms in the
calculations.
Fig. 2. Quantitative measures.
2.3 VAIC Model and Limitations
Public (2000) firstly came up with the notion of VAIC in 2000. As one of the promising approaches, VAIC has
been widely used not only for academic purposes but also in the business context (Chan, 2009; Firer & Williams,
2003).
2.3.1 The VAIC model
VAIC consists of three elements: human capital efficiency (HCE), structural capital efficiency (SCE) and capital
efficiency (CEE) (Public, 2006). Within the context of VAIC, these components help organizations to interpret the
value added process. An organization with high VAIC indicates a high-level of value creation.
Measuring different firms under various contexts was impossible before the VAIC approach emerged. The VAIC
model is broadly used as its calculation is simple and all necessary information could be easily obtained in
companies’ financial reports. Moreover, the approach is standardized and consistent so that comparing different
companies from various sectors becomes possible (Sabolovic, 2009).
2.3.2 Limitations of the VAIC model
One of the limitations of the VAIC model is the impact of negative values which the model is incapable of the
handle. Furthermore, the VAIC model could not depict the interaction between the three components in the value
Quantitavie measures of IC
Stem Stewart : EVA
Stewart and Edvinsson: Market
value= Book value + IC
Luthy: Tobin Q Pulic: VAIC Lev and Feng
LI Zhicheng, CHEN Zhuoer, LUI Trevor Tin Shing, Dr. CHU Samuel Kai Wah / Procedia Computer Science 00 (2016) 000–000 6
I:\Sam-publications\published materials\conference papers\Li 2016 The Impact of Intellectual Capital on Companies’ Performances-2016-08-
05.docx 8/8/2016 4:13 PM 6
creation process (Chu, 2011). In addition, as the utilization of capital differs from different sectors, comparing
capital intensive and non-capital intensive industries is not reasonable (Pirjo, 2011)
In order to overcome these limitations, Gianpaolo offered the idea to measure IC by combining EVA and VAIC
as EVA corresponds to the shareholders’ side and VAIC corresponds to the stakeholders’ side (Gianpaolo, 2013).
However, as the structure of company could fluctuate dramatically and the exact amount of investment is hard to
determine, it does not substitute the VAIC model.
2.4 IC and Business Performance
Investigating the correlation between IC and business performance measured by VAIC and the performance
indicators ROA and ATO in South African companies, Firer and Williams (2003) found that physical and financial
capital play pivotal roles in corporate business performance. During 1992-2002, Chen (2005) observed 4254 listed
companies and found that IC is positively associated with a market value. This is supported by Shiu (2006)’s
research which shares similar findings with Firer and Williams.
A study on the impact of IC on business performance was conducted by Chan (2009) based on the listed
companies of the Hang Seng Index from 2001 to 2005. The results showed that there is no correlation between IC
and financial performance. Similar research was carried out by Chu (2011), who used data from all listed companies
of Hang Seng Index in Hong Kong from 2001-2009 to observe the association between VAIC and profitability. Chu
claimed that VAIC and profitability are positively correlated.
In the United Kingdom, Zeghal and Maaloul (2010) observed 300 UK firms in 2005 to study the impact of IC on
financial performance. VAIC model was also applied in the banking sector in Austria (Pulic, 1997), Japan
(Mavridis, 2004), Thailand (Appuhami, 2007) and Malaysia (Goh, 2005). However, as the circumstances of these
banks vary greatly, the correlation between IC and performance indicators needs further study.
3. Methodology
This paper employed a quantitative method, regression models, to identify a potential correlation between IC and
business performance. IC is measured by VAIC and business performance is represented by its four proxies: MB,
ROA, ROE, and ATO. Several regression models are designed to determine the association between VAIC and four
proxies and the potential relationship between the components of VAIC and the four indicators.
3.1 Sample Selection
Fifty-nine listed MAKE award companies and 59 comparable non-MAKE award recipient counterparts (118 in
total) composed the sample size of this paper. The 59 listed MAKE award companies were selected according to the
following criteria:
Financial data publicly available from 2009-2014 (company listed before 2009);
Could be compared with a non-MAKE award recipient counterpart with similar market capitalization in the
same industrial sector.
The 59 comparable non-MAKE award recipient counterparts were selected according to the following criteria:
Financial data publicly available from 2009-2015 (company listed before 2009);
Could be compared with a MAKE award company with similar market capitalization in the same industrial
sector.
There are three limitations of the above criteria:
As market capitalization varies from industry to industry, a consistent standard range of market capitalization
for selecting the counterpart companies is not possible.

LI Zhicheng, CHEN Zhuoer, LUI Trevor Tin Shing, Dr. CHU Samuel Kai Wah / Procedia Computer Science 00 (2016) 000–000 7
I:\Sam-publications\published materials\conference papers\Li 2016 The Impact of Intellectual Capital on Companies’ Performances-2016-08-
05.docx 8/8/2016 4:13 PM 7
Shares of market capitalization fluctuate frequently so the compatibility of counterpart companies could change.
Selecting counterparts’ criteria for comparison mainly relies on the similar sector and market capitalization
which may not be objective enough. Some other factors such as earning before interests and taxes (EBIT) or the
number of employees would be added for consideration. However, as the comparable data is hard to be attained,
this paper does not include such criteria.
3.2 Research Questions and Hypothesis
Three research questions were developed to identify the association between IC (measured by VAIC) and
business performance (measured by the four proxies) in MAKE award companies and their comparable non-MAKE
award recipient counterparts.
Research questions:
Q1. Do MAKE award winners exhibit higher VAIC than non-MAKE award recipients?
Q2. Do MAKE award winners exhibit better performance than non-MAKE award recipients?
Q3. Which IC components are associated with four proxies of performance as measured by MB, ROA, ROE and
ATO in MAKE award recipients and non-MAKE award recipients?
Based on the research questions, three research hypotheses are raised.
Research Hypothesis:
Companies with higher VAIC may indicate that they are efficient in using IC (Public, 2000). Therefore, H1.
MAKE award winners have higher VAIC than non-MAKE award counterparts.
Along with the previous studies, which show different opinions about the relationship between IC components
and corporate business performance (Chan, 2009; Shiu, 2006), this paper assumes that there could be potential
associations between IC and performances.
H2a. MAKE award winners with higher VAIC generate higher MB, ROA, ROE, and ATO.
H2b. Non-MAKE award winners with higher VAIC generate higher MB, ROA, ROE, and ATO.
MAKE award
winnersVAIC
MB
ROA
ROE
ATO
+
+
+
+
VAIC
MB
ROA
ROE
ATO
+
+
+
+
Non-MAKE
award winners
Figure. 3. Hypothesis 2
VAIC is composited with HCE, SCE, and CEE. ICE is the sum of HCE and SCE (Public, 2000). It is reasonable
to investigate which components may affect the performance.
H3a.HCE is positively associated with MB, ROA, ROE, and ATO in MAKE award winners.
H3b.SCE is positively associated with MB, ROA, ROE, and ATO in MAKE award winners.
H3c.CEE is positively associated with MB, ROA, ROE, and ATO in MAKE award winners.

LI Zhicheng, CHEN Zhuoer, LUI Trevor Tin Shing, Dr. CHU Samuel Kai Wah / Procedia Computer Science 00 (2016) 000–000 8
I:\Sam-publications\published materials\conference papers\Li 2016 The Impact of Intellectual Capital on Companies’ Performances-2016-08-
05.docx 8/8/2016 4:13 PM 8
MAKE award
winners
VAIC
MB ROA ROE ATO
HCE SCE CEE
+ + + ++ + + ++ + + +
Figure. 4. Hypothesis 3
H4a.HCE is positively associated with MB, ROA, ROE, and ATO in non-MAKE award winners.
H4b.SCE is positively associated with MB, ROA, ROE, and ATO in non-MAKE award winners.
H4c.CEE is positively associated with MB, ROA, ROE, and ATO in non-MAKE award winners.
Non-MAKE
award winners
VAIC
MB ROA ROE ATO
HCE SCE CEE
+ + + ++ + + ++ + + +
Figure. 5. Hypothesis 4
H5a.ICE is positively associated with MB, ROA, ROE, and ATO in MAKE award winners.
H5b.ICE is positively associated with MB, ROA, ROE, and ATO in non-MAKE award winners.

LI Zhicheng, CHEN Zhuoer, LUI Trevor Tin Shing, Dr. CHU Samuel Kai Wah / Procedia Computer Science 00 (2016) 000–000 9
I:\Sam-publications\published materials\conference papers\Li 2016 The Impact of Intellectual Capital on Companies’ Performances-2016-08-
05.docx 8/8/2016 4:13 PM 9
Non-MAKE
award winners
VAIC
MB ROA ROE ATO
ICE CEE
+ + + ++ + + +
MAKE award
winners
VAIC
MB ROA ROE ATO
ICE CEE
+ + + ++ + + +
Figure. 6. Hypothesis 5
3.3 Data Collection and Analysis
Data is collected from the 118 listed companies’ annual financial reports from 2009-2015. All of the data are
collected from financial annual reports in uniform and traceable. The data are proved to be valid and reliable. After
collecting the raw data, the values will be calculated strictly from the equations which will be clarified later. Then
those values will be inputted into the models to run the analysis. The total of twelve regression models are
developed to examine the association between VAIC and its components with the four proxies.
Table 1. Regression Models
Model Regression Equation
1 MBi = β1 VAIC + β2 FSIZEi + β3 DEBTi + μi
2 ROAi = β1 VAIC + β2 FSIZEi + β3 DEBTi + μi
3 ROEi = β1 VAIC + β2 FSIZEi + β3 DEBTi + μi
4 ATOi = β1 VAIC + β2 FSIZEi + β3 DEBTi + μi
5 MBi = β1 HCEi + β2 SCEi + β3 CEEi + β4 FSIZEi + β5 DEBTi + μi
6 ROAi = β1 HCEi + β2 SCEi + β3 CEEi + β4 FSIZEi + β5 DEBTi + μi
7 ROEi = β1 HCEi + β2 SCEi + β3 CEEi + β4 FSIZEi + β5 DEBTi + μi
8 ATOi = β1 HCEi + β2 SCEi + β3 CEEi + β4 FSIZEi + β5 DEBTi + μi
9 MBi = β1 ICEi + β2 CEEi + β3 FSIZEi + β4 DEBTi + μ
10 ROAi = β1 ICEi + β2 CEEi + β3 FSIZEi + β4 DEBTi + μ
11 ROEi = β1 ICEi + β2 CEEi + β3 FSIZEi + β4 DEBTi + μ
12 ATOi = β1 ICEi + β2 CEEi + β3 FSIZEi + β4 DEBTi + μ
Note. In these models, firm size (FSIZE) and firm leverage (DEBT) are controlled. Models 1 to 4 is designed to test the hypotheses H2a to H2b.
Models 5 to 8 are designed to test the hypotheses H3a to H4c. Models 9 to 12 are designed to test the hypotheses H5a to H5b.
3.3.1 Variables
Dependent variables

LI Zhicheng, CHEN Zhuoer, LUI Trevor Tin Shing, Dr. CHU Samuel Kai Wah / Procedia Computer Science 00 (2016) 000–000 10
I:\Sam-publications\published materials\conference papers\Li 2016 The Impact of Intellectual Capital on Companies’ Performances-2016-08-
05.docx 8/8/2016 4:13 PM 10
The four proxies serve as the dependent variables: dimensions of profitability (ROA), productivity (ATO),
market valuation (MB) and return on equity (ROE) of a company’s business performance (Chan, 2009; Chu, Chan,
2011).
Independent variables
The independent variables are HCE, SCE, and CEE. According to Public (2000), the values of the independent
variables could be calculated from financial reports as follows:
Step 1. Identifying a company’s value creation competence.
VA=revenue-cost of products-operational cost-employee cost
Step 2. Calculating HCE, SCE, and CEE
HCE= VA/ total employee costs
SCE= (VA-total employee costs)/VA
CEE= VA/ book value of physical and financial assets
ICE = HCE + SCE
Step 3. Calculating VAIC
VAIC=HCE+SCE+CEE
Control variables
The two control variables are firm size (FSIZE) and firm leverage (DEBT).
Table 2. Variables
Variable Type Dimension Computation
MB Dependent variable Market valuation MB = market capitalization/ equity (Chu et al., 2011)
ROA Dependent variable Profitability ROA= Net income (NI) / book value of assets (Firer, 2003)
ROE Dependent variable Return on equity ROE= NI / book value of equity (Chan, 2009)
ATO Dependent variable Productivity ATO= Total revenue/ total book value of assets (Chan, 2009)
HCE Independent variable Human capital efficiency HCE= VA/ total employee costs (Public, 2000)
SCE Independent variable Structure capital efficiency SCE= (VA-total employee costs)/ VA (Public, 2000)
ICE Independent variable Intellectual capital efficiency ICE = HCE + SCE = VA/ total employee costs + (VA-total
employee costs)/ VA (Public, 2000)
CEE Independent variable Capital efficiency
CEE= VA / book value of physical and financial assets (Public,
2000)
VAIC Independent variable Value added by intellectual
capital
VAIC=HCE+SCE+CEE (Public, 2000)
FSIZE Control variable Company size Market capitalization
DEBT Control variable Leverage Total debt

LI Zhicheng, CHEN Zhuoer, LUI Trevor Tin Shing, Dr. CHU Samuel Kai Wah / Procedia Computer Science 00 (2016) 000–000 11
I:\Sam-publications\published materials\conference papers\Li 2016 The Impact of Intellectual Capital on Companies’ Performances-2016-08-
05.docx 8/8/2016 4:13 PM 11
3.4 Results
3.4.1 MAKE award companies
R Square tells how much of the variance in the dependent variable is explained by the model (Pallant, 2010).
From the analysis, the R square in each model is not significantly large. It may hint that those models do not
perfectly match the associations between different indicators. Though it could not be a respectable value, it explains
the relationship to some extents. It proves that those components will exert influence on the performance.
In addition, some positive correlations are detected. CEE is proved to be positively associated with ROA, ROE,
and ATO. SCE is positively associated with ROA and ROE. Because the Sig. values of them are less than 0.005,
which indicates the variables is making a significant unique contribution to the prediction of the dependent variable
(Pallant, 2010).

LI Zhicheng, CHEN Zhuoer, LUI Trevor Tin Shing, Dr. CHU Samuel Kai Wah / Procedia Computer Science 00 (2016) 000–000 12
I:\Sam-publications\published materials\conference papers\Li 2016 The Impact of Intellectual Capital on Companies’ Performances-2016-08-
05.docx 8/8/2016 4:13 PM 12
Though HCE is irrelevant with all four proxies, the p-value between HCE and ROE is slightly higher than the
required p-value. It may indicate HCE could make a contribution to the prediction of ROE, through the effect may
be not significant.
Table 3. Summary of Regression Model on MAKE award companies
Model Independent
variables
Dependent
variables
Results Conclusion
R square P-value
1 VAIC MB 0.064 VAIC: 0.423 Irrelevant.
2 VAIC ROA 0.011 VAIC: 0.707 Irrelevant.
3 VAIC ROE 0.022 VAIC: 0.14 Irrelevant.
4 VAIC ATO 0.049 VAIC: 0.409 Irrelevant.
5 SCE, CEE, HCE MB 0.069 SCE:0.355;CEE:0.428;
HCE:0.743
Irrelevant.
6 SCE, CEE, HCE ROA 0.193 SCE:0.00001;CEE:0.00001;
HCE:0.054
Both SCE and CEE are positively
associated with ROA.
7 SCE, CEE, HCE ROE 0.100 SCE:0.000257;CEE:0.00001;H
CE:0.009
Both SCE and CEE are positively
associated with ROE.
8 SCE, CEE, HCE ATO 0.165 SCE:0.044;CEE:0.0004;
HCE:0.186
CEE is positively associated with ATO.
9 CEE, ICE MB 0.067 ICE:0.455; CEE:0.319 Irrelevant.
10 CEE, ICE ROA 0.141 ICE:0.982; CEE:0.00003 CEE is positively associated with ROA.
11 CEE, ICE ROE 0.068 ICE:0.196; CEE:0.00003 CEE is positively associated with ROE.
12 CEE, ICE ATO 0.156 ICE:0.599; CEE:0.00002 CEE is positively associated with ATO.

LI Zhicheng, CHEN Zhuoer, LUI Trevor Tin Shing, Dr. CHU Samuel Kai Wah / Procedia Computer Science 00 (2016) 000–000 13
I:\Sam-publications\published materials\conference papers\Li 2016 The Impact of Intellectual Capital on Companies’ Performances-2016-08-
05.docx 8/8/2016 4:13 PM 13
3.4.2 Non-MAKE award companies
Though the values of R square in different models are not at a high level among Non-MAKE companies, they are
higher than MAKE award companies, which may indicate that those models work better in Non-MAKE companies.
From model 1-4, it shows that VAIC is negatively associated with ATO. However, contrary to the previous
assumption, the relationship is negative rather than positive.
From model 5-8, the results indicate that SCE, CEE are positively correlated with ROA. CEE is positively
associated with ATO. HCE is negatively correlated with ATO.
In the model 9-12, CEE is proved to be positively correlated with ATO and ROA as well. Moreover, ICE inserts
negative impact on ATO.
Table 4. Summary of Regression Model on Non-MAKE award companies
Mode
l
Independent
variables
Dependent
variables
Results Conclusion
R square P-value
1 VAIC MB 0.037 VAIC: 0.938 Irrelevant.
2 VAIC ROA 0.109 VAIC: 0.190 Irrelevant.
3 VAIC ROE 0.034 VAIC: 0.398 Irrelevant.
4 VAIC ATO 0.114 VAIC: 0.000 VAIC is negatively related ATO
5 SCE, CEE, HCE MB 0.041 SCE:0.219;CEE:0.729; HCE:0.493 Irrelevant.
6 SCE, CEE, HCE ROA 0.261 SCE:0.00001;CEE:0.00001; HCE:0.032 SCE & CEE are positively related to
ROA
7 SCE, CEE, HCE ROE 0.038 SCE:0.272;CEE:0.0972;HCE:0.626 Irrelevant.
8 SCE, CEE, HCE ATO 0.242 SCE:0.485; CEE:0.0000;
HCE:0.000
CEE is positively related to ATO
and HCE is negatively related to
ATO
9 CEE, ICE MB 0.037 ICE:0.887; CEE:0.716 Irrelevant.
10 CEE, ICE ROA 0.218 ICE:0.962; CEE:0.000 CEE is positively related to ROA
11 CEE, ICE ROE 0.035 ICE:0.269; CEE:0.469 Irrelevant.
12 CEE, ICE ATO 0.241 ICE:0.000; CEE:0.000 CEE is positively related to ATO
and ICE is negatively related to
ATO
3.5 Limitations
One of the potential limitations is that VAIC model has its own shortcomings and may not be the best model to
measure IC. As the correlation between IC and performance could be not linear, the regression models which are
generated in this paper may be not suitable and need to be further tested.
4. Discussion
Among MAKE award companies, CEE is proved to be positively correlated with ROA, ROE, and ATO. This
finding is consistent with Chu et al.’s research, which shows that the components of VAIC demonstrate a much

LI Zhicheng, CHEN Zhuoer, LUI Trevor Tin Shing, Dr. CHU Samuel Kai Wah / Procedia Computer Science 00 (2016) 000–000 14
I:\Sam-publications\published materials\conference papers\Li 2016 The Impact of Intellectual Capital on Companies’ Performances-2016-08-
05.docx 8/8/2016 4:13 PM 14
higher explanatory power in predicting business performance than aggregated VAIC and CEE is the strongest
predictor amongst them.
The positive relationship may indicate that MAKE award companies are efficient in managing their capital so
that they could create substantial value. As CEE mostly refers to the financial assets (Pulic, 2000), a proper use of
financial assets will improve the efficiency of assets turnover (ATO), which will finally increase the net income and
lead to higher ROA and ROE. Corporate should focus more on managing financial assets because CEE is the
strongest predictor among all indicators.
In addition, SCE is found to be positively correlated with ROE and ROA. As a symbol of structure efficiency,
SCE is assumed to be associated with ATO. However, by analysis, a higher SCE leads to higher ROA and ROE
rather than ATO. It may indicate that controlling human cost does not improve the efficiency of assets turnover.
Instead, it will improve the ROA and ROE by reducing the cost. Thus when a corporate aims at improving the
efficiency of using assets, it needs to consider taking more financial assets, which will improve ATO, rather than
simply controlling personnel cost.
In Non-MAKE award companies, the higher R square may indicate that IC could insert higher influence on the
performance than MAKE-award companies. This assumption is coordinated with the law of diminishing marginal
utility. To those MAKE award companies, they have been in a high level of IC so that the utility of IC won’t be as
the same as those Non-MAKE award companies, which are at the primary level and could be easily affected.
The findings of CEE and SCE are the same in MAKE award companies. Thus paying more attention to CEE is
also useful for Non-MAKE companies. However, VAIC and ICE are found to be negatively associated with ATO. It
indicates that in Non-MAKE award companies, the higher IC, the lower asset turnover. However, no similar
relationship is found in MAKE award companies. This may suggest there is inefficiency in managing IC among
Non-MAKE award companies so that it reduces the rate of asset turnover.
Based on the above-mentioned findings, we propose some suggestions for both MAKE award companies and
Non-MAKE award companies to consider:
For both kinds of companies, they may need to focus on improving CEE by managing financial assets efficiently.
For Non-MAKE companies, it may be better for them to consider the efficiency of IC and control human cost.
Simply pouring down money on intangible assets or human cost does not ensure a higher return for those
companies. From this point of view, some merge or combination activities should be discussed because it will
induce unnecessary intellectual capital such as goodwill. That capital may reduce the rate of asset turnover.

LI Zhicheng, CHEN Zhuoer, LUI Trevor Tin Shing, Dr. CHU Samuel Kai Wah / Procedia Computer Science 00 (2016) 000–000 15
I:\Sam-publications\published materials\conference papers\Li 2016 The Impact of Intellectual Capital on Companies’ Performances-2016-08-
05.docx 8/8/2016 4:13 PM 15
Appendix A. Glossary
Table 5. Glossary
Concept Definition
ATO Asset Turn Over (Productivity)
BSC Balanced Sore Card Model
CC Customer Capital
CEE Capital Efficiency
DEBT Firm Leverage
EBIT Earnings Before Interest and Taxes
EVA Economic Value Added
FSIZE Company Size
HC Human Capital
HCE Human Capital Efficiency
IC Intellectual Capital
ICE Intellectual Capital Efficiency
MAKE Most Admired Knowledge Enterprise
MB Market Valuation
Non-MAKE Non Most Admired Knowledge Enterprise
ROA Return on Assets (Profitability)
ROE Return on Equity
R Square Regression Square
SC Structural Capital
SCE Structural Capital Efficiency
Reference
Al-Ali, N. (2003). Comprehensive Intellectual Capital Management: Step-by-step. Hoboken, N.J.: Wiley.
Benchmarking: the search for industry best practices that lead to superior performance. (1989). Choice Reviews Online, 27(04), 27-2173.
Brooking, A. (1996). Intellectual Capital: Core Assets for The Third Millennium Enterprise, London: International Thomson Business Press.
Bontis, N. (2002). World Congress on Intellectual Capital readings. Boston: KMCI Press.
Carlucci, D., Schiuma, G., & AB, G. S. (2004). Managing knowledge assets for Business performance improvement.
Carlucci, D., Marr, B., & Schiuma, G. (2004). The knowledge value chain: how intellectual capital impacts on business performance.
International Journal Of Technology Management, 27(6/7), 575.
Chan, K. H. (2009a). Impact of intellectual capital on organizational performance: an empirical study of companies in the Hang Seng Index (part
1). Learning Organization, 16(1), 4-21
Chan, K. H. (2009a). Impact of intellectual capital on organizational performance: an empirical study of companies in the Hang Seng Index (part

LI Zhicheng, CHEN Zhuoer, LUI Trevor Tin Shing, Dr. CHU Samuel Kai Wah / Procedia Computer Science 00 (2016) 000–000 16
I:\Sam-publications\published materials\conference papers\Li 2016 The Impact of Intellectual Capital on Companies’ Performances-2016-08-
05.docx 8/8/2016 4:13 PM 16
2). Learning Organization, 16(1), 22-39
Chen Goh, P., & Pheng Lim, K. (2004). Disclosing intellectual capital in company annual reports: Evidence from Malaysia. Journal Of
Intellectual Capital, 5(3), 500-510.
Chen, J., Zhu, Z., & Yuan Xie, H. (2004). Measuring intellectual capital: a new model and empirical study. Journal Of Intellectual Capital, 5(1),
Chen, M., Cheng, S., & Hwang, Y. (2005). An empirical investigation of the relationship between intellectual capital and firms’ market value and
financial performance. Journal Of Intellectual Capital,6(2), 159-176.
Chu, S., Chan, K., Yu, K., Ng, H., & Wong, W. (2011). An Empirical Study of the Impact of Intellectual Capital on Business
Performance. Journal Of Information & Knowledge Management,10(01), 11-21.
Dalkir, K. (2011). Knowledge Management in Theory and Practice. Cambridge, Mass.: Cambridge, Mass. : MIT Press.
Edvinsson, L. and Malone, M.S. (1997). Intellectual Capital: Realising Your Company’s True Value by Finding its Hidden Brainpower, Harper
Business, New York, NY.
Edvinsson, L., & Bounfour, A. (2004). Assessing national and regional value creation. Measuring Business Excellence, 8(1), 55-61.
Fijałkowska, J. (2014). Value Added Intellectual Coefficient (VAIC™) as a Tool of Performance Measurement. Przedsiebiorczosc I
Zarzadzanie, 15(1).
Firer, S., & Mitchell Williams, S. (2003). Intellectual capital and traditional measures of corporate performance. Journal Of Intellectual
Capital, 4(3),
Harrison, S. and Sullivan. (2001). Profiting from Intellectual Capital: Learning from Leading Companies. Journal of Intellectual Capital (1): 33-
46
Iazzolino, G., & Laise, D. (2013). Value added intellectual coefficient (VAIC). Journal Of Intellectual Capital, 14(4), 547-563.
J. Roos, G. R., L. Edvinsson, and N. Dragonetti. (1998). Intellectual capital: Navigating the New Business Landscape. New York: New York
University Press.
Jashapara, A. (2004). Knowledge management : an integrated approach. Harlow: Harlow : Prentice Hall.
Kakabadse, N., Kakabadse, A., & Kouzmin, A. (2003). Reviewing the knowledge management literature: towards a taxonomy. Journal Of
Knowledge Management, 7(4), 75-91.
Kannan, G., & Aulbur, W. (2004). Intellectual capital: Measurement effectiveness. Journal Of Intellectual Capital, 5(3), 389-413.
Kai Wah Chu, S., Hang Chan, K., & Wu, W. (2011). Charting intellectual capital performance of the gateway to China. Journal Of Intellectual
Capital, 12(2), 249-276.
Lee, M., & Chang, T. (2007). Linking knowledge management and innovation management in e-business. Journal of Intellectual Capital, 4(2),
145.
Lerro, A., Iacobone, F., & Schiuma, G. (2012). Knowledge assets assessment strategies: organizational value, processes, approaches and
evaluation architectures. Journal Of Knowledge Management, 16(4), 563-575.
Li, S., Tsai, M., & Lin, C. (2009). Building a taxonomy of a firm's knowledge assets: A perspective of durability and profitability. Journal Of
Information Science, 36(1), 36-56.
Knowledgebusiness.com. (2015). MAKE. [online] Available at:
http://www.knowledgebusiness.com/knowledgebusiness/templates/Catindex.aspx?siteId=1&menuItemId=28 [Accessed 16 Jun.
2016].
Mavridis, D. (2004). The intellectual capital performance of the Japanese banking sector. Journal Of Intellectual Capital, 5(1), 92-115.
Nonaka, I. (2005). The theory of the knowledge-creating firm: subjectivity, objectivity and synthesis. Industrial And Corporate Change, 14(3),
419-436.
Nonaka, I., & Takeuchi, H. (1996). The knowledge-creating company: How Japanese companies create the dynamics of innovation. Long Range

LI Zhicheng, CHEN Zhuoer, LUI Trevor Tin Shing, Dr. CHU Samuel Kai Wah / Procedia Computer Science 00 (2016) 000–000 17
I:\Sam-publications\published materials\conference papers\Li 2016 The Impact of Intellectual Capital on Companies’ Performances-2016-08-
05.docx 8/8/2016 4:13 PM 17
Planning, 29(4), 592.
Organisation for Economic Cooperation and Development. (1996). The Knowledge-Based Economy. OCDE/GD(96), 102.
Pallant, J. (2010). SPSS survival manual. Maidenhead: Open University Press/McGraw-Hill.
Person, R. (2013). Balanced Scorecards and Operational Dashboards with Microsoft Excel. Hoboken: Wiley.
Pew Tan, H., Plowman, D., & Hancock, P. (2007). Intellectual capital and financial returns of companies. Journal Of Intellectual Capital, 8(1),
76-95.
Pew Tan, H., Plowman, D., & Hancock, P. (2008). The evolving research on intellectual capital. Journal Of Intellectual Capital, 9(4), 585-608.
Pulic, A. (2000). VAIC™ an accounting tool for IC management. International Journal Of Technology Management, 20(5/6/7/8), 702.
Roos, J. (1997). Intellectual capital. Houndmills, Basingstoke, Hampshire: Macmillan Business.
Rumizen, M. C. (2002). The complete idiot's guide to knowledge management. Indianapolis, IN: Indianapolis, IN : Alpha.
Spendolini, M. J. (1992). The benchmarking process. (generic process model). Compensation and Benefits Review, 24(5), 21.
Stewart, T., & Ruckdeschel, C. (1998). Intellectual capital: The new wealth of organizations. Performance Improvement, 37(7), 56-59.
Ståhle, P., Ståhle, S., & Aho, S. (2011). Value added intellectual coefficient (VAIC): a critical analysis. Journal Of Intellectual Capital, 12(4),
531-551.
Stewart, T.A. (1997). Intellectual Capital: The New Wealth of Organization. New York: Doubleday/ Currency.
Sullivan, P. H. (1998). Profiting from intellectual capital: extracting value from innovation. New York: New York : J. Wiley.
Sveiby, K.E. (2010), “Method of measuring intangible assets”, available at: www.sveiby.com/articles /intangibleMethods.htm (accessed August
9, 2010).
Sveiby.com,. (2016). Methods for Measuring Intangible Assets. Retrieved 12 February 2016
Wall, A., Kirk, R., & Martin, G. (2003). Intellectual Capital: Measuring the Immeasurable? : Elsevier.
Wang, W., & Chang, C. (2005). Intellectual capital and performance in causal models. Journal Of Intellectual Capital, 6(2), 222-236.
Zéghal, D., & Maaloul, A. (2010). Analysing value added as an indicator of intellectual capital and its consequences on company
performance. Journal Of Intellectual Capital, 11(1), 39-60.