weather windows for oil spill countermeasures
TRANSCRIPT

Weather Windows for Oil Spill Countermeasures
for
Prince William Sound Regional Citizens’ Advisory Council (PWSRCAC)Anchorage, Alaska
by
Merv FingasEnvironmental Technology Centre
Environment Canada
January, 2004

iii
AbstractOil spill countermeasures are affected by weather such that, in some cases, these
countermeasures cannot continue under adverse weather conditions. A literature review wascarried out to determine if there were data related to the performance of all countermeasuretechniques under varying weather conditions. Although the literature did not provide anyquantitative guides for the performance of countermeasures under varying weather conditions,data could be extracted to enable assessment of changes in their performance related to weatherconditions. Many estimates or traditional limits are found in the literature, but these varyconsiderably and may not be useful.
Wind and wave height are the most important factors influencing countermeasures. Thesetwo factors are related and, given sufficient time for the sea to become ‘fully-arisen’, can beinter-converted. These factors must sometimes be considered separately, however, so thatspecific weather effects can be examined. Other weather conditions affecting countermeasuresinclude currents and temperature. Currents are the critical factor for certain countermeasures suchas booms. Temperature primarily affects the performance of dispersants and has been shown tohave only minimal effect on other countermeasures. Formation of ice, however, is a problemwith most countermeasures.
Booms are the type of countermeasures most susceptible to weather conditions.Conventional booms will fail at a current of 0.5 m/s (1 knot) regardless of the boom’s design orother conditions. This is due to inherent hydrodynamic limitations. There is wave-associateddegradation of this value which is dependent on design. Failure data for some typical booms aresummarized.
Skimmers show degradation of recovery potential with increasing wave height and alsowith relative current. Skimmer performance is very specific to a given skimmer. A number ofskimmer performance curves have been developed for this study. Some skimmers only functioneffectively in absolutely calm waters while others have recovered oil in sea states of up to 5 or 6(wave heights of up to 3 m or 10 feet with corresponding winds of up to 15 m/s or 30 knots).Sufficient data exist to predict performance with waves and currents for over 30 specificskimmers and over 10 generic types. Advancing skimmers often recover more oil with increasingtow rate as this increases the encounter rate with the oil.
The weather affects dispersant application and effectiveness in three ways: the amount ofdispersant that contacts the target is highly wind-dependent; the amount of oil dispersed is verydependent on ocean turbulence and other energy; and the amount of oil remaining in the watercolumn is dependent on the same energy. Nomograms for relative dispersant effectiveness havebeen created. At high sea energies, natural dispersion is very much a factor for lighter oils.
The weather affects in-situ burning in two ways: the ability to ignite oil in a given windand the ability to sustain ignition in a given wind. While there are few data on these, theprobability of ignition was estimated based on prior experience.
The effects of weather on other countermeasure methods have been summarized.

iv

v

vi
List of Acronyms
ANS Alaska North Slope - Usually refers to the crude oil mixture at the end ofthe pipeline
APSC Alyeska Pipeline Service Company - The company that operates theAlyeska pipeline and the Valdez terminal
ASMB Alberta Sweet Mixed Blend - A crude oil consisting of various low-in-sulphur crude oils
Corexit 9527 Brand name of a dispersant from Exxon
Corexit 9500 Brand name of a dispersant from Exxon
EPA United States Environmental Protection Agency
IFO Intermediate Fuel Oil - A mixture of Bunker C and diesel used for shippropulsion
IFP The French Petroleum Institute - Usually used here as a description of theirlaboratory test
NOAA National Oceanic and Atmospheric Administration (U.S.)
ORR Oil recovery rate - The total oil recovered by a skimmer in a specifiedperiod of time, usually one hour
PWSRCAC Prince William Sound Regional Citizens’ Advisory Council
RE Recovery efficiency - The amount of oil recovered by a skimmer as apercent of the total fluid recovered
SERVS Ship Escort Response Vessel System - A co-op operating in PrinceWilliam Sound
TE Throughput efficiency - The percentage of oil recovered by a skimmercompared to the oil presented to the skimmer

vii
Summary and IssuesSpill countermeasures are affected by weather conditions, often adversely. A literature
review was carried out to determine if there were data related to the performance of allcountermeasures under varying weather conditions. Although the literature did not show anyquantitative guides for the performance of countermeasure techniques or equipment undervarying weather conditions, data could be extracted to provide assessment of changes inperformance with weather conditions. Many estimates or traditional limits are found in theliterature, but these vary considerably and may not be useful. Examples of these estimatesinclude statements that skimmers will not work in waves over 1 or 6 m (3 to 20 ft) and thatburning cannot be carried out in winds over 10 m/s (20 knots). Many of these statements arecompletely without basis.
Wind and wave height are the most important factors influencing countermeasures. Thesetwo factors are related and, given a typical sea, can be inter-converted. Sometimes they must beconsidered separately, however, so that specific weather effects can be examined. Other weatherconditions include currents and temperature. Currents are the critical factor for countermeasuressuch as booms. Temperature primarily affects dispersants and has been shown to have onlyminimal effect on other countermeasures, other than if icing occurs.
For each countermeasure, it was possible to find some performance data as it related towind and waves. These data then allow for calculation of how the relative performancedeteriorates or changes with increasing wind or relative current. These factors are then averagedto yield curves of performance change with increasing wind or current. This data is then used topredict when the performance of a particular technique reaches 50 or 25% of its initial value.These performance curves are summarized in Table 1. It should be emphasized that this tablegives overall averages only and not specific unit performance, a factor that varies widely.
Booms are the countermeasures most susceptible to weather conditions. Booms will fail ata current of 0.5 m/s (1 knot) regardless of design, due to inherent hydrodynamic limitations. Thereis wave-associated degradation of this value which is dependent on design.

viii
Skimmers show degradation of recovery potential with increasing wave height and alsowith relative current. Skimmer performance is very individual and a number of skimmerperformance curves have been developed for this study. Some skimmers can only functioneffectively in absolutely calm waters while others have recovered oil in sea states of up to 5 or 6(wave heights of up to 3 m or 18 feet with corresponding winds of up to 15 m/s or 30 knots).Sufficient data exist to predict performance with waves and currents for over 30 specific skimmersand over 10 generic types.
The weather affects dispersant application and effectiveness in three ways: the amount ofdispersant that contacts the target is highly wind-dependent; the amount dispersed on the surface isvery dependent on ocean turbulence and other energy; and the amount remaining in the watercolumn is dependent on the same energy. Nomograms for relative effectiveness have been created.At high sea energies, many lighter oils can disperse naturally.
The weather affects in-situ burning in two ways: the ability to ignite oil in a given wind andthe ability to sustain ignition in a given wind. Estimates were made based on prior experience.
Figure 1 shows the overall effects of wind on oil spill countermeasures. All values shownin the figure are relative values. Under optimal conditions, the relative value would be 100% timesthe specific effectiveness to yield an actual working effectiveness. Generally, increasing winddecreases relative effectiveness, although the relative chemical dispersion rises as more energy isavailable to disperse oil. When winds increase to over approximately 10 m/s (20 knots), chemicaldispersion decreases as more and more dispersants are lost rather than deposited on the oil surface.Booms are the most affected by winds and current. Skimmers vary widely in their susceptibility towind and waves.

ix
AcknowledgementsThe author thanks Lisa Ka’aihue of the Regional Citizens’ Advisory Council of Prince
William Sound, the contract manager for this project. The author also thanks Jennifer Charles forperforming a ‘rush’ edit on this document. The reviewers provided several helpful comments.

x

xi

xii
Table of Contents
Abstract . . . . . . . . . . . . . . . . . . . . . . . . . . . . . . . . . . . . . . . . . . . . . . . . . . . . . . . . . . . . . . . . . . . . . iiiWind and Wave Conversion Nomogram . . . . . . . . . . . . . . . . . . . . . . . . . . . . . . . . . . . . . . . . . . ivWater and Velocity Conversion Nomogram . . . . . . . . . . . . . . . . . . . . . . . . . . . . . . . . . . . . . . . . vList of Acronyms . . . . . . . . . . . . . . . . . . . . . . . . . . . . . . . . . . . . . . . . . . . . . . . . . . . . . . . . . . . . . viSummary and Issues . . . . . . . . . . . . . . . . . . . . . . . . . . . . . . . . . . . . . . . . . . . . . . . . . . . . . . . . . . viiAcknowledgements . . . . . . . . . . . . . . . . . . . . . . . . . . . . . . . . . . . . . . . . . . . . . . . . . . . . . . . . . . . ix
1. Introduction . . . . . . . . . . . . . . . . . . . . . . . . . . . . . . . . . . . . . . . . . . . . . . . . . . . . . . . . . . . . 11.1 Objectives . . . . . . . . . . . . . . . . . . . . . . . . . . . . . . . . . . . . . . . . . . . . . . . . . . . . . . . . . . 11.2 Scope . . . . . . . . . . . . . . . . . . . . . . . . . . . . . . . . . . . . . . . . . . . . . . . . . . . . . . . . . . . . . . 11.3 Organization . . . . . . . . . . . . . . . . . . . . . . . . . . . . . . . . . . . . . . . . . . . . . . . . . . . . . . . . 1
2. Review of Effectiveness of Countermeasures with Variations in Weather and OtherEnvironmental Factors . . . . . . . . . . . . . . . . . . . . . . . . . . . . . . . . . . . . . . . . . . . . . . . . . . . 22.1 Introduction . . . . . . . . . . . . . . . . . . . . . . . . . . . . . . . . . . . . . . . . . . . . . . . . . . . . . . . . . 22.2 Spreading Compared to Weathering . . . . . . . . . . . . . . . . . . . . . . . . . . . . . . . . . . . . . . 22.3 Important Components of Weather . . . . . . . . . . . . . . . . . . . . . . . . . . . . . . . . . . . . . . . 32.4 Oil Properties Regardless of Weathering . . . . . . . . . . . . . . . . . . . . . . . . . . . . . . . . . . 32.5 Review of Booms and Boom Testing . . . . . . . . . . . . . . . . . . . . . . . . . . . . . . . . . . . . . 4
2.5.1 Types of Booms . . . . . . . . . . . . . . . . . . . . . . . . . . . . . . . . . . . . . . . . . . . . . . . 42.5.2 Uses of Booms . . . . . . . . . . . . . . . . . . . . . . . . . . . . . . . . . . . . . . . . . . . . . . . . 52.5.3 Boom Failure . . . . . . . . . . . . . . . . . . . . . . . . . . . . . . . . . . . . . . . . . . . . . . . . . 6
2.6 Review of Skimmers and Skimmer Testing . . . . . . . . . . . . . . . . . . . . . . . . . . . . . . . . 62.6.1 Skimmer Performance . . . . . . . . . . . . . . . . . . . . . . . . . . . . . . . . . . . . . . . . . . 72.6.2 Effect of Weather Conditions on Skimmers . . . . . . . . . . . . . . . . . . . . . . . . . . 72.6.3 Types of Skimmers . . . . . . . . . . . . . . . . . . . . . . . . . . . . . . . . . . . . . . . . . . . . . 72.6.4 Other Devices . . . . . . . . . . . . . . . . . . . . . . . . . . . . . . . . . . . . . . . . . . . . . . . . 11
2.7 Sorbents . . . . . . . . . . . . . . . . . . . . . . . . . . . . . . . . . . . . . . . . . . . . . . . . . . . . . . . . . . . 142.8 Dispersants and Other Chemical Treating Agents . . . . . . . . . . . . . . . . . . . . . . . . . . 15
2.8.1 Application of Dispersants . . . . . . . . . . . . . . . . . . . . . . . . . . . . . . . . . . . . . . 162.9 In-situ Burning . . . . . . . . . . . . . . . . . . . . . . . . . . . . . . . . . . . . . . . . . . . . . . . . . . . . . 17
2.9.1 Ignition of Oil . . . . . . . . . . . . . . . . . . . . . . . . . . . . . . . . . . . . . . . . . . . . . . . . 172.9.2 Use of Containment . . . . . . . . . . . . . . . . . . . . . . . . . . . . . . . . . . . . . . . . . . . 17
2.10 Shoreline Cleanup . . . . . . . . . . . . . . . . . . . . . . . . . . . . . . . . . . . . . . . . . . . . . . . . . . . 182.10.1 Recommended Cleanup Methods . . . . . . . . . . . . . . . . . . . . . . . . . . . . . . . . . 192.10.2 Types of Shoreline . . . . . . . . . . . . . . . . . . . . . . . . . . . . . . . . . . . . . . . . . . . . 19
3. Review of Literature on Spill Countermeasures and Weather . . . . . . . . . . . . . . . . . . 213.1 A priori Decision Guides . . . . . . . . . . . . . . . . . . . . . . . . . . . . . . . . . . . . . . . . . . . . . 213.2 General Countermeasures . . . . . . . . . . . . . . . . . . . . . . . . . . . . . . . . . . . . . . . . . . . . . 223.3 Booms . . . . . . . . . . . . . . . . . . . . . . . . . . . . . . . . . . . . . . . . . . . . . . . . . . . . . . . . . . . . 22
3.3.1 Typical Booms . . . . . . . . . . . . . . . . . . . . . . . . . . . . . . . . . . . . . . . . . . . . . . . 24

xiii
3.3.2 Special and High Current Booms . . . . . . . . . . . . . . . . . . . . . . . . . . . . . . . . . 243.4 Skimmers . . . . . . . . . . . . . . . . . . . . . . . . . . . . . . . . . . . . . . . . . . . . . . . . . . . . . . . . . 25
3.4.1 Harbour/Small Skimmers . . . . . . . . . . . . . . . . . . . . . . . . . . . . . . . . . . . . . . . 263.4.2 Offshore/Larger Skimmers . . . . . . . . . . . . . . . . . . . . . . . . . . . . . . . . . . . . . . 263.4.3 Special/High Current Skimmers . . . . . . . . . . . . . . . . . . . . . . . . . . . . . . . . . . 273.4.4 Skimming Ships . . . . . . . . . . . . . . . . . . . . . . . . . . . . . . . . . . . . . . . . . . . . . . 27
3.5 Dispersants . . . . . . . . . . . . . . . . . . . . . . . . . . . . . . . . . . . . . . . . . . . . . . . . . . . . . . . . 273.5.1 Other Agents . . . . . . . . . . . . . . . . . . . . . . . . . . . . . . . . . . . . . . . . . . . . . . . . . 30
3.6 In-situ Burning . . . . . . . . . . . . . . . . . . . . . . . . . . . . . . . . . . . . . . . . . . . . . . . . . . . . . 303.6.1 Ignition . . . . . . . . . . . . . . . . . . . . . . . . . . . . . . . . . . . . . . . . . . . . . . . . . . . . . 313.6.2 Fire-resistant Boom . . . . . . . . . . . . . . . . . . . . . . . . . . . . . . . . . . . . . . . . . . . . 32
3.7 Others . . . . . . . . . . . . . . . . . . . . . . . . . . . . . . . . . . . . . . . . . . . . . . . . . . . . . . . . . . . . 323.8 Ice Conditions . . . . . . . . . . . . . . . . . . . . . . . . . . . . . . . . . . . . . . . . . . . . . . . . . . . . . . 32
4. Development of Models for Effectiveness of Countermeasures . . . . . . . . . . . . . . . . . . 334.1 Overall . . . . . . . . . . . . . . . . . . . . . . . . . . . . . . . . . . . . . . . . . . . . . . . . . . . . . . . . . . . . 334.2 Booms . . . . . . . . . . . . . . . . . . . . . . . . . . . . . . . . . . . . . . . . . . . . . . . . . . . . . . . . . . . . 334.3 Skimmers . . . . . . . . . . . . . . . . . . . . . . . . . . . . . . . . . . . . . . . . . . . . . . . . . . . . . . . . . 334.4 Dispersants . . . . . . . . . . . . . . . . . . . . . . . . . . . . . . . . . . . . . . . . . . . . . . . . . . . . . . . . 514.5 In-situ Burning . . . . . . . . . . . . . . . . . . . . . . . . . . . . . . . . . . . . . . . . . . . . . . . . . . . . . 604.6 Others . . . . . . . . . . . . . . . . . . . . . . . . . . . . . . . . . . . . . . . . . . . . . . . . . . . . . . . . . . . . 60
5. Overview of Weather Limitations . . . . . . . . . . . . . . . . . . . . . . . . . . . . . . . . . . . . . . . . . 62
6. Summary and Conclusions . . . . . . . . . . . . . . . . . . . . . . . . . . . . . . . . . . . . . . . . . . . . . . . 65
7. Recommendations . . . . . . . . . . . . . . . . . . . . . . . . . . . . . . . . . . . . . . . . . . . . . . . . . . . . . . 69
8. References . . . . . . . . . . . . . . . . . . . . . . . . . . . . . . . . . . . . . . . . . . . . . . . . . . . . . . . . . . . . . 70
List of Tables1 Summary Table of Performance Changes with Weather . . . . . . . . . . . . . . . . . . . . . . . . . . vii2 Performance of Typical Skimmers . . . . . . . . . . . . . . . . . . . . . . . . . . . . . . . . . . . . . . . . . . . . 93 Tests of Boom Performance with Changing Weather Conditions . . . . . . . . . . . . . . . . . . . 344 Tests of Skimmer Performance with Changing Weather Conditions . . . . . . . . . . . . . . . . 375 Correlation of Performance and Test Parameters for Booms . . . . . . . . . . . . . . . . . . . . . . 446 Summary Skimmer Performance with Changing Weather Conditions . . . . . . . . . . . . . . . 457 Tests of Skimmer Performance with Changing Ice Conditions . . . . . . . . . . . . . . . . . . . . . 478 Cross Correlation Matrix for Factors Influencing Performance for
All Skimmers in this Study . . . . . . . . . . . . . . . . . . . . . . . . . . . . . . . . . . . . . . . . . . . . . . . . 489 Cross Correlation Matrix for Factors Influencing Performance for
the Marco Belt Skimmer . . . . . . . . . . . . . . . . . . . . . . . . . . . . . . . . . . . . . . . . . . . . . . . . . . 4910 Cross Correlation Matrix for Factors Influencing Performance for
the Veegarm System . . . . . . . . . . . . . . . . . . . . . . . . . . . . . . . . . . . . . . . . . . . . . . . . . . . . . 5011 Dispersant Spray Trials at Alpine, TX . . . . . . . . . . . . . . . . . . . . . . . . . . . . . . . . . . . . . . . . 56

xiv
12 Dispersant Effectiveness Measured by Moles et al., 2001 . . . . . . . . . . . . . . . . . . . . . . . . . 6013 Tests of Burning Performance with Changing Weather Conditions . . . . . . . . . . . . . . . . . 6214 Summary of Weather Limits or Functions Noted in this Report . . . . . . . . . . . . . . . . . . . . 66
List of Figures1 Summary of Wind Effects on Countermeasures . . . . . . . . . . . . . . . . . . . . . . . . . . . . . . . viii2 Oleophilic Skimmers . . . . . . . . . . . . . . . . . . . . . . . . . . . . . . . . . . . . . . . . . . . . . . . . . . . . . . 83 Weir Skimmer . . . . . . . . . . . . . . . . . . . . . . . . . . . . . . . . . . . . . . . . . . . . . . . . . . . . . . . . . . 124 Suction Skimmers . . . . . . . . . . . . . . . . . . . . . . . . . . . . . . . . . . . . . . . . . . . . . . . . . . . . . . . 125 Elevating Skimmers . . . . . . . . . . . . . . . . . . . . . . . . . . . . . . . . . . . . . . . . . . . . . . . . . . . . . . 136 Submersion Skimmer . . . . . . . . . . . . . . . . . . . . . . . . . . . . . . . . . . . . . . . . . . . . . . . . . . . . . 147 A Classic Weather Windows Diagram . . . . . . . . . . . . . . . . . . . . . . . . . . . . . . . . . . . . . . . 218 Effect of Waves on Boom Performance . . . . . . . . . . . . . . . . . . . . . . . . . . . . . . . . . . . . . . 529 Relationship Between ORR (Oil Recovery Rate) and Wave Height . . . . . . . . . . . . . . . . . 5210 Effect of Waves on Skimmer Performance . . . . . . . . . . . . . . . . . . . . . . . . . . . . . . . . . . . . 5311 Performance of Specific Skimmers in Waves . . . . . . . . . . . . . . . . . . . . . . . . . . . . . . . . . . 5312 Effect of Waves on Throughput Efficiency (TE) . . . . . . . . . . . . . . . . . . . . . . . . . . . . . . . . 5413 Effect of Waves on Recovery Efficiency (RE) . . . . . . . . . . . . . . . . . . . . . . . . . . . . . . . . . 5414 Effect of Current or Tow Speed on Recovery Efficiency (RE) . . . . . . . . . . . . . . . . . . . . . 5515 Correlation of Wind, Droplet Size and Deposition . . . . . . . . . . . . . . . . . . . . . . . . . . . . . . 5516 Correlation of Dose (dispersant to oil ratio) and Dispersant Effectiveness . . . . . . . . . . . . 5817 Correlation of Wind Speed and Wave Height . . . . . . . . . . . . . . . . . . . . . . . . . . . . . . . . . . 5818 Model of Relative Dispersion with Wind . . . . . . . . . . . . . . . . . . . . . . . . . . . . . . . . . . . . . 5919 Effect of Temperature on Dispersion . . . . . . . . . . . . . . . . . . . . . . . . . . . . . . . . . . . . . . . . . 5920 Probability of Ignition with Wind Speed . . . . . . . . . . . . . . . . . . . . . . . . . . . . . . . . . . . . . . 6121 Success of Decanting with Wave Height . . . . . . . . . . . . . . . . . . . . . . . . . . . . . . . . . . . . . . 6122 Relative Performance of Countermeasures with Wave Height . . . . . . . . . . . . . . . . . . . . . 6323 Relative Performance of Countermeasures with Wind Speed . . . . . . . . . . . . . . . . . . . . . . 6324 Relative Performance of Booms and Skimmers with Current or Tow Speed . . . . . . . . . . 6425 Relative Performance of Various Countermeasures with Wind Speed . . . . . . . . . . . . . . . 64

1
1. Introduction1.1 Objectives
The objectives of this report are to review the literature and develop an assessment of theeffectiveness of oil spill countermeasures in relation to variations in weather and otherenvironmental conditions.
1.2 ScopeThis review covers the literature published up to November 2003. The study focuses
primarily on literature related to issues of the effectiveness of oil spill countermeasures in relationto variations in weather and other environmental conditions.
1.3 OrganizationThe report begins with a summary of oil spill countermeasures and how they might be
affected by weather. This is followed in turn with a specific review of data that is available. InSection 3, a summary is given of the development of simple models or estimation techniques forsummarizing and predicting relative performance with weather conditions.

2
2. Review of Effectiveness of Countermeasures with Variations in Weather and OtherEnvironmental Factors
2.1 IntroductionWeather has been recognized as one of the most important factors in predicting oil spill fate
and behaviour (Lehr et al., 1999). Weather has not, however, been well recognized in designing oilspill countermeasures (API, 2000; Pearson, 2000).
The traditional concept of ‘Windows of Opportunity’, or other concepts similarly named,began with the topic of dispersants in about the mid-1990s. This concept largely related to thewindow of opportunity for dispersal as time progressed and the oil became more weathered andless dispersible. As time progresses, the window of opportunity to disperse closes (Fiocco andLessard, 1997). Thus, the prime variable for generating the window was weathering with time.Subsequently, some of the same concepts, but only including the same parameters, were extendedto physical recovery and containment (Nordvik, 1995, 1999; Nordvik et al., 2002; Champ et al.,1997; Champ, 2002). The windows of opportunity for ANS oil, based on weathering only, werestated by Champ et al. (1997) to be 0 to 36 hours for burning, 0 to 36 hours for dispersing, 0 to 18hours for oil-water separator, and 26 to 120 hours for reduced dispersant effectiveness.
Before the publication of the window of opportunity concept, it was not included in logisticplanning nor was weather considered essential in planning oil spill countermeasures (Hann, 1979).
Historically, most references to ‘windows of opportunity’ were to the time factor. Thebiggest concern was the evaporation of the oil which leads to large increases in viscosity andtherefore increased difficulty in recovery and other countermeasures. The secondary time windowis that of spreading. A typical crude oil can spread over dozens of square kilometres on the first dayafter the spill (Jeffery, 1971; Thalich and Xizobo, 2001). Furthermore, once spreading progresses,the thickness approaches or is less than 1 :m, a thickness which cannot be dealt with by any formof countermeasure. Oil that had been at sea for a period of time was sometimes thought to be lostand countermeasures were hopeless (Beynon, 1969). It has only recently been recognized thatmany of these problems do not occur with heavy oils (Dicks et al., 2002).
The presence of ice, although not strictly a weather condition, can severely affect therecovery of standard equipment (Lamp, 1971) The ability to perform multiple tasks at sea is typically recognized, although the ability touse chemical dispersants and mechanical recovery are not compatible with one another (Harris,1999). The costs of spills have not been evaluated in terms of weather conditions (Etkin, 1999,2001; Etkin and Tebeau, 2003). There is insufficient information in the literature with which tojudge the effect of weather conditions on the costs and general progress of oil spill cleanup. Harperet al. (1995) reviewed costs and did not include the effects of weather. Harper et al. also noted thatthe costs of offshore cleanup are less by a factor of 2.5 to 4 than shoreline cleanup. In-situ burningis estimated to be about 5 times cheaper than offshore recovery and 10 times cheaper thanshoreline cleanup.
2.2 Spreading Compared to Weathering Spreading, which is a function of time and oil properties, will result in thin slicks, which
may not be recoverable, burnable, or dispersible (Lystad and Martinson, 1981). Oceanic processesincluding Langmuir circulation and the presence of ocean fronts may result in the collection of

3
material, thus reversing the effects of spreading to a certain degree (Thorpe, 2000; McWilliams andSullivan, 2000; Lehr and Simecek-Beatty, 2000; Simecek-Beatty and Lehr, 2000). Initial spreadingequations such as those by Fay do not consider weather factors such as wind and waves andconsequently under-predict the spreading when wind is a factor (Brown and Goodman, 1995).
2.3 Important Components of WeatherA review of factors relevant to the effectiveness of countermeasures in relation to changes
in weather shows that wind speed and the resulting wave heights are the most important factors.Current or speed of water movement is not usually the result of changing weather, but will becovered briefly in this report. Temperature affects countermeasures such as dispersion but is not assignificant in terms of other countermeasures. Temperature can be significant if it results in icing.The relevant temperature changes at sea are only from 5 to 20°C. This spread in water temperaturein North America does not cause viscosity changes that are significant in relation to skimmers andespecially not to booms.
Wind is the component that generates waves and by itself can cause significant changes inoil behaviour (Bayoumi and Ghalwash, 1999). Wind can also change the rate of surface drift of oil.Youssef and Spaulding (1994) found through modelling that the drift factor (normally taken as3.5%) varies with wind. In shallow water, the drift factor increases with increasing wind speed.The deflection angle, however, was found to be insensitive to variations in depth, but increasingslightly as wind speed increases.
For waves, the most important component to consider is the type of wave (Shonting, 1979;Fredriksson et al., 1996). A regular wave does not impose as great a constraint on performance asdoes an irregular wave. This will be considered here as a large amount of data was generated in theOHMSETT facility with regular waves as well as ‘harbour chop’, and the difference can be shownin performance degradation. At sea, many different types of wave energies have been recognized.For example, breaking waves display more energy than non-breaking waves (Boumeester andWallace, 1985, 1986). Goodman (1994) noted that wave energy was a most important factor, butone that was not understood. Cheng et al. (1998) designed waves for a test tank and noted thatwave shape was an important factor. Payne et al. (1991a) studied the weathering of the ExxonValdez oil in the field and in test tanks. They note that weather, especially the waves, is animportant factor in the fate and behaviour of the oil. Simecek-Beatty et al. (2002) developed amodel of chemical dispersion and use the fact that the mixing layer is 1.5 times the wave height.This shows that wave height is a strong predictor of dispersion amount.
Weather data is stated by some to be a very important factor as it relates to spillcountermeasures (Simecek-Beatty and Timmons, 1995; Webb, 1995). Elliot and Jones (2000)review the prediction of oil spill behaviour and fate during the Sea Empress incident and note thatthe use of coarse-grid, non-operational data resulted in prediction errors. They note that accuracycould be improved by using high quality and high resolution weather data.
2.4 Oil Properties Regardless of WeatheringOil properties play a large role in the behaviour and fate of oil at sea, including how the oil
relates to changes in the weather. Buist et al. (1989) studied waxy crudes from Eastern Canada andfound that, from a countermeasures perspective, they behaved differently than other oils, regardlessof small differences in temperature. Fingas et al. (2003) noted that the dynamics of Orimulsion

4
were changed by variations in temperature. The lower the temperature, the more Orimulsionsurfaced.
2.5 Review of Booms and Boom TestingBooms are very susceptible to winds, currents, and waves, probably more so than any other
oil spill equipment or technique (Fingas, 2000a).A boom is a floating mechanical barrier designed to stop or divert the movement of oil on
water. Booms resemble a vertical curtain with portions extending above and below the water line.Most commercial booms consist of four basic components: a means of flotation, a freeboardmember (or section) to prevent oil from flowing over the top of the boom, a skirt to prevent oilfrom being swept underneath the boom, and one or more tension members to support the entireboom.
Most booms are also fitted with one or more tension members which run along the bottomof the boom and reinforce it against the horizontal load imposed by waves and currents. Tensionmembers are usually made of steel cables or chains but sometimes consist of nylon or polyesterropes. The boom fabric itself is not strong enough to withstand the powerful forces to which boomsare subjected, except in protected waters. For example, the force on a 100-m long section of boomcould be as much as 10,000 kg, depending on sea conditions and the construction of the boom.
2.5.1 Types of BoomsThe three basic types of booms are fence and curtain booms, which are common, and
external tension member booms, which are relatively rare. Booms are also classified according towhere they are used, i.e., offshore, inshore, harbour, and river booms, based on their size andruggedness of construction. The fence boom is constructed with a freeboard member above thefloat. Although relatively inexpensive, these booms are not recommended for use in high winds orstrong water currents. Curtain booms are constructed with a skirt below the floats and no freeboardmember above the float. Curtain booms are most suitable for use in strong water currents. Externaltension member booms, which are constructed with a tension member outside the main structure,are used in strong currents and in water containing ice or debris.
The characteristics of booms that are important in determining their operating ability are thebuoyancy-to-weight ratio or reserve buoyancy, the heave response, and the roll response. Thebuoyancy-to-weight ratio or reserve buoyancy is determined by the amount of flotation and theweight of the boom. This means that the float must provide enough buoyancy to balance the weightof the boom with the force exerted by currents and waves, thereby maintaining the boom's stability.The greater a boom's reserve buoyancy, the greater its ability to rise and fall with the waves andremain on the surface of the water. The heave response is the boom's ability to conform to sharpwaves. It is indicated by the reserve buoyancy and the flexibility of the boom. A boom with goodheave response will move with the waves on the surface of the water and not be alternatelysubmerged and thrust out of the water by the wave action. The roll response refers to the boom'sability to remain upright in the water and not roll over.
Sorbent booms are specialized containment and recovery devices made of porous sorbentmaterial such as woven or fabric polypropylene, which absorbs the oil while it is being contained.Sorbent booms are used when the oil slick is relatively thin, i.e., for the final 'polishing' of an oilspill, to remove small traces of oil or sheen, or as a backup to other booms. Sorbent booms require

5
considerable additional support to prevent breakage under the force of strong water currents. Theyalso require some form of flotation so they won't sink once saturated with oil and water.
Fire-resistant booms are used when oil is burned on site. These booms are made ofspecialized materials that withstand high heat fluxes. They are subject to the same current andwave limitations as other booms. Often they are of heavy construction and lack much reservebuoyancy and thus may be more subject to waves and currents.
2.5.2 Uses of BoomsBooms are used primarily to contain oil, although they are also used to deflect oil. When
used for containment, booms are often arranged in a U, V, or J configuration. The U configurationis the most common and is achieved by towing the boom behind two vessels, anchoring the boom,or by combining these two techniques. The U-shape is created by the current pushing against thecentre of the boom. The critical requirement is that the current in the apex of the U does not exceed0.5 m/s or 1 knot, which is referred to as the critical velocity. This is the speed of the currentflowing perpendicular to the boom, above which oil will be lost from the boom.
In open water, the U configuration can also be achieved by allowing the entire boom systemto move down-current so that the velocity of the current, as opposed to that of the boom, does notexceed the critical velocity. If this velocity is exceeded, first small amounts of oil and then massiveamounts will be lost. This leads to several types of boom failure which are described in Section2.5.3.
If used in areas where the currents are likely to exceed 0.5 m/s or 1 knot, such as in riversand estuaries, booms are often used in the deflection mode. It is relatively well-known that currentsin estuaries such as would be found in Prince William Sound can exceed 3 m/s (6 knots). Theboom is then deployed at various angles to the current, so that the critical velocity is not exceeded.The oil can then be deflected either to areas where it can be collected or to less sensitive areas.
2.5.3 Boom FailureA boom's performance and its ability to contain oil are affected by water currents, waves,
and winds. Either alone or in combination, these forces often lead to boom failure and loss of oil.Eight common ways in which booms fail are summarized here.
Entrainment Failure - This type of failure is caused by the speed of the water current andis more likely to happen with a lighter oil. When oil is being contained by a boom in moving water,if the current is fast enough, the boom acts as a dam and the surface water being held back isdiverted downwards and accelerates in an attempt to keep up with the water flowing directly underthe boom. The resulting turbulence causes droplets to break away from the oil that has built up infront of the boom, referred to as the oil headwave, pass under the boom, and resurface behind it.The water speed at which the headwave becomes unstable and the oil droplets begin to break awayis referred to as the critical velocity. It is the speed of the current flowing perpendicular to theboom, above which oil losses occur. For most booms riding perpendicular to the current, thiscritical velocity is about 0.5 m/s (about 1 knot).
Drainage Failure - Similar to entrainment, this type of failure is related to the speed of thewater current, except that it affects the oil directly at the boom. After critical velocity is reached,large amounts of the oil contained directly at the boom can be swept under the boom by the

6
current. Both entrainment and drainage failure are more likely to occur with lighter oils. One orboth of these two types of failure can occur, depending on the currents and the design of the boom.
Critical Accumulation - This type of failure usually occurs when heavier oils, which arenot likely to become entrained in water, are being contained. Heavier oils tend to accumulate closeto the leading edge of the boom and are swept underneath the boom when a certain criticalaccumulation point occurs. This accumulation is often reached at current velocities approachingthe critical velocities, but can also be reached at lower current velocities.
Splashover - This failure occurs in rough or high seas when the waves are higher than theboom's freeboard and oil splashes over the boom's float or freeboard member. It can also occur as aresult of extensive oil accumulation in the boom compared to the freeboard.
Submergence Failure - This type of failure occurs when water goes over the boom. Oftenthe boom is not buoyant enough to follow the wave motion and some of the boom sinks below thewater line and oil passes over it. Submergence failure is usually the result of poor heave response,which is measured by both the reserve buoyancy and the flexibility of the boom. Failure due tosubmergence is not that common as other forms of failure, such as entrainment, usually occur first.Submergence is increased as waves and current increase.
Planing - Planing occurs when the boom moves from its designed vertical position toalmost a horizontal position on the water. Oil passes over or under a planing boom. Planing occursif the tension members are poorly designed and do not hold the boom in a vertical position or if theboom is towed in currents far exceeding the critical velocity. The potential for planing alsoincreases as waves and currents increase.
Structural Failure - This occurs when any of the boom's components fail and the boomlets oil escape. Sometimes structural failure is so serious that the boom is carried away by thecurrent. This does not happen often in normal currents and conditions. Floating debris, such as logsand ice, can contribute to structural failure.
2.6 Review of Skimmers and Skimmer TestingSkimmers are mechanical devices designed to remove oil from the water surface. They vary
greatly in size, application, and capacity, as well as in recovery efficiency (Fingas, 2000a).Skimmers are classified according to the area where they are used, for example, inshore, offshore,in shallow water, or in rivers, and by the viscosity of the oil they are intended to recover, that isheavy or light oil. Skimmers are available in a variety of forms, including independent units builtinto a vessel or containment device and units that operate in either a stationary or mobile(advancing) mode. Some skimmers have storage space for the recovered oil and some of these alsohave other equipment such as separators to treat the recovered oil.
The effectiveness of a skimmer is rated according to the amount of oil that it recovers, aswell as the amount of water picked up with the oil. Removing water from the recovered oil can beas difficult as the initial recovery. Effectiveness depends on a variety of factors including the typeof oil spilled, the properties of the oil such as viscosity, the thickness of the slick, sea conditions,wind speed, ambient temperature, and the presence of ice or debris.
2.6.1 Skimmer PerformanceA skimmer's performance is affected by a number of factors including the thickness of the
oil being recovered, the extent of weathering and emulsification of the oil, the presence of debris,and weather conditions at the time of recovery operations.

7
A skimmer's overall performance is usually determined by a combination of its recoveryrate and the percentage of oil recovered. The oil recovery rate (ORR) is the volume of oil recoveredunder specific conditions. It is measured as volume per unit of time, e.g., m /h, and is usually given3
as a range. If a skimmer takes in a lot of water, it is detrimental to the overall efficiency of an oilspill recovery operation. The results of recent performance testing on various types of skimmersare given in Table 2. The change in performance with weather is not given in this table, but will beaddressed in Sections 2.6.2 and 3.4 of this report. Other factors that are measured are thethroughput efficiency (TE), which is the percentage of the oil recovered compared to the amount ofoil presented to a skimmer, and the recovery efficiency (RE), which is the amount of oil in therecovered fluid. The recovery efficiency is important as extra water in the recovered product willnecessitate handling and separation.
In addition to these characteristics, other important measures of a skimmer's performanceinclude the amount of emulsification caused by the skimmer, its ability to deal with debris, ease ofdeployment, ruggedness, applicability to specific situations, and reliability.
2.6.2 Effect of Weather Conditions on SkimmersWeather conditions at a spill site have a major effect on the efficiency of skimmers. Most
skimmers work best in calm waters. Depending on the type of skimmer, some will not workeffectively in waves greater than 1 m or in currents exceeding 1 knot. Most skimmers do notoperate effectively in waters with ice or debris such as branches, seaweed, and floating waste.Some skimmers have screens around the intake to prevent debris or ice from entering, conveyors orsimilar devices to remove or deflect debris, and cutters to deal with sea weed. Very viscous oils, tarballs, or oiled debris can clog the intake or entrance of skimmers and make it impossible to pumpoil from the skimmer's recovery system.
2.6.3 Types of SkimmersSkimmers are classified according to their basic operating principles: oleophilic surface
skimmers; weir skimmers; suction skimmers or vacuum devices; elevating skimmers; submersionskimmers; and vortex or centrifugal skimmers. Each type of skimmer has distinct advantages anddisadvantages.
Oleophilic surface skimmers, sometimes called sorbent surface skimmers, use a surface towhich oil can adhere to remove the oil from the water surface. This oleophilic surface can be in theform of a disc, drum, belt, brush, or rope, which is moved through the oil on the top of the water. Awiper blade or pressure roller removes the oil and either deposits it into an onboard container or theoil is directly pumped to storage facilities on a barge or on shore. The oleophilic surface itself canbe steel, aluminum, fabric, or plastics such as polypropylene and polyvinyl chloride. Oleophilicskimmer concepts are illustrated in Figure 2.

8

9
Oleophilic skimmers pick up very little water compared to the amount of oil recovered,which means they have a high oil-to-water recovery ratio. They therefore operate efficiently onrelatively thin oil slicks. They are not as susceptible to ice and debris as the other types ofskimmers. These skimmers are available in a range of sizes and work best with light crude oils,although their suitability for different types of oil varies with the design of the skimmer and thetype of oleophilic surface used.
The disc skimmer is a common type of oleophilic surface device. The discs are usuallymade of either polyvinyl chloride or steel. Disc skimmers work best with light crude oil and arewell suited to working in waves and among weeds or debris.

10
The drum skimmer is another type of oleophilic surface skimmer. The drums are made ofeither a proprietary polymer or steel. The drum skimmer works relatively well with fuels and lightcrude, but is ineffective with heavy oils.
Belt skimmers are constructed of a variety of oleophilic materials ranging from fabric toconveyor belting. Most belt skimmers function by lifting oil up from the water surface to arecovery well. As the motion of the belt through the water drives oil away from the skimmer,however, oil must be forced to the belt manually or with a water spray. Belt skimmers have beendesigned to overcome this problem, including one that pumps the oily water through a porous beltand the inverted belt skimmer which carries the oil under the water. The oil is subsequentlyremoved from the belt by scrapers and rollers after the belt returns to a selected position at thebottom of the skimmer. Belt skimmers of all types work best with heavier crudes. Belt skimmersare large and are usually built into a specialized cleanup vessel.
Brush skimmers use tufts of plastic attached to drums or chains to recover the oil from thewater surface. The oil is usually removed from the brushes by wedge-shaped scrapers. Brushskimmers are particularly useful for recovering heavier oils, but are ineffective for fuels and lightcrudes. Some skimmers include a drum for recovering light fuels and a brush for use with heavieroils. These skimmers can also be used with limited amounts of debris or ice. Brush skimmers areavailable in a variety of sizes, from small portable units to large units installed on specializedvessels or barges.
Rope skimmers remove oil from the water surface with an oleophilic rope of polymer,usually polypropylene. Some skimmers have one or two long ropes which are held in the slick by afloating, anchored pulley. Others use a series of small ropes that hang down to the water surfacefrom a suspended skimmer body. The rope skimmer works best with medium viscosity oils and isparticularly useful for recovering oil from debris- and ice-laden waters. Rope skimmers vary in sizefrom small portable units to large units installed on specialized vessels or barges.
Weir skimmers are a major group of skimmers that use gravity to drain the oil from thesurface of the water into a submerged holding tank. In their simplest form, these devices consist ofa weir or dam, a holding tank, and a connection to an external or internal pump to remove the oil.Many different models and sizes of weir skimmers are available. A weir skimmer is illustrated inFigure 3.
A major problem with weir skimmers is their tendency to rock back and forth in choppywater, alternately sucking in air above the slick and water below. This increases the amount ofwater and reduces the amount of oil recovered. Some models include features for self-levelling andadjustable skimming depths so that the edge of the weir is precisely at the oil-water interface,minimizing the amount of water collected. Offshore weir skimmers have been constructed andthese usually divert the top surface of the water and oil to a calm area. This can increase the weirskimmer’s capability to very high sea states.
Weir skimmers do not work well in ice and debris or in rough waters and they are noteffective for very heavy oils or tar balls. Weir skimmers have also been built into booms and havebeen moderately successful in providing high recovery rates of lighter crudes.
Suction or vacuum skimmers use a vacuum or slight differential in pressure to remove oilfrom the water surface. Often the 'skimmer' is only a small floating head connected to an externalsource of vacuum, such as a vacuum truck. The head of the skimmer is simply an enlargement ofthe end of a suction hose and a float. Two suction skimmers are illustrated in Figure 4.

11
Suction skimmers are similar to weir skimmers in that they sit on the water surface,generally use an external vacuum pump system such as a vacuum truck, and are adjusted to float atthe oil-water interface. They also tend to be susceptible to the same problems as weir skimmers.They are prone to clogging with debris which can stop the oil flow and damage the pump. Theyalso experience the problem of rocking in choppy waters which causes massive water intake,followed by air intake. Their use is restricted to light to medium oils.
Despite their disadvantages, suction skimmers are the most economical of all skimmers.Their compactness and shallow draft make them particularly useful in shallow water and inconfined spaces. They operate best in calm water with thick slicks and no debris. Very largevacuum pumps, called air conveyors, and suction dredges have been used to recover oil, sometimesdirectly without a head. Both these adaptations, however, have the same limitations as smallersuction skimmers.
Elevating skimmers or devices use conveyors to lift oil from the water surface into arecovery area. A paddle belt or wheel or a conveyor belt with ridges is adjusted to the top of thewater layer and oil is moved up the recovery device on a plate or another moving belt. Theoperation is similar to removing liquid from a floor with a squeegee. The oil is usually removedfrom the conveyer by gravity. When operating these skimmers, it is difficult to maintain theconveyor at the water line. In addition, they cannot operate in rough waters or in waters with largepieces of debris, and cannot deal with light or very heavy oils. Elevating skimmers work best withmedium to somewhat heavy oils in calm waters. They are generally large and are sometimes builtinto specialized vessels. Two concepts for elevating skimmers are shown in Figure 5.
Submersion skimmers use a belt or inclined plane to force the water beneath the surface.The belt or plane forces the oil downward toward a collection well where it is removed from thebelt by a scraper or by gravity. The oil then flows upward into the collection well, and is removedby a pump. Submersion skimmers move faster than other skimmers and can therefore cover a largearea, making them suitable for use at larger spills. They are most effective with light oils with alow viscosity and when the slick is relatively thin. Disadvantages include a poor tolerance to debriscompared to other skimmers and they cannot be used in shallow waters. Submersion skimmers arelarger than other types of skimmers and are usually mounted on a powered vessel. The submersionskimmer concept is shown in Figure 6.
2.6.4 Other DevicesMany other devices are used to recover oil. Several skimmers combine some of the
principles of operation already discussed. For example, one skimmer uses an inverted belt both asan oleophilic skimmer and a submersion skimmer. A fish trawl has been modified by adding an oiloutlet. Once the trawl is filled, however, usually with water, it is almost impossible to maintain adynamic balance in the trawl so that further oil can enter. Regular fishing nets and fishing boatshave been used to recover extremely large tar balls, but the oil fouls the nets, making disposal orexpensive cleanup necessary. Garbage-collecting vessels have been successfully used to removeoiled debris or tar balls.

12
Special purpose ships have been built specifically to deal with oil spills. Several ships havebeen built with a hull that splits to form a V-shaped containment boom with skimmers built intothe hull, although this requires very expensive design features so the ship can withstand severeweather conditions. Other ships have been built with holes in the hull to hold skimmers, withsweeps mounted on the side to direct oil to the skimmer area. Many small vessels have beencustom-built to hold skimmers.

13

14
2.7 SorbentsSorbents are materials that recover oil through either absorption or adsorption. They play an
important role in oil spill cleanup and are used in the following ways: to clean up the final traces ofoil spills on water or land; as a backup to other containment means, such as sorbent booms; as aprimary recovery means for very small spills; and as a passive means of cleanup. An example ofsuch passive cleanup is when sorbent booms are anchored off lightly oiled shorelines to absorb anyremaining oil released from the shore and prevent further contamination or re-oiling of theshoreline.
The performance of sorbents is measured in terms of total oil recovery and water pickup,similar to skimmers. "Oil recovery" is the weight of a particular oil recovered compared to theoriginal weight of the sorbent. For example, highly efficient synthetic sorbent may recover up to 30times its own weight in oil and an inorganic sorbent may recover only twice its weight in oil. The amount of water picked up is also important, with an ideal sorbent not recovering any water.

15
The effect of weather on sorbents is unclear as sorbents are typically used as a finalpolishing tool. As this task is critical under most circumstances, sorbent use could wait until theweather allowed.
2.8 Dispersants and Other Chemical Treating AgentsDispersant is a common term used to label chemical spill-treating agents that promote the
formation of small droplets of oil which 'disperse' throughout the top layer of the water column.Dispersants contain surfactants, chemicals like those in soaps and detergents, that have moleculeswith both a water-soluble and oil-soluble component. Depending on the nature of thesecomponents, surfactants cause oil to behave in different ways in water. Surfactants or surfactantmixtures used in dispersants have approximately the same solubility in oil and water, whichstabilizes oil droplets in water so that the oil will disperse into the water column. This can bedesirable when an oil slick is threatening a particularly sensitive shoreline.
The effectiveness of a dispersant is determined by measuring the amount of oil that it putsinto the water column and comparing it to the amount of oil that remains on the water surface.When a dispersant is working, a white to coffee-coloured plume of dispersed oil appears in thewater column and can be seen from ships and aircraft. This plume can take up to half an hour toform. If there is no such plume, it indicates little or no effectiveness.
Effectiveness is influenced by many factors, including the composition and degree ofweathering of the oil, the amount and type of dispersant applied, sea energy, salinity of the water,and water temperature. The composition of the oil is the most important of these factors, followedclosely by sea energy and the amount of dispersant applied. Dispersion is not likely to occur whenoil has spread to thin sheens. Below a certain thickness, the applied dispersant will interact with thewater and not the oil.
Weather affects dispersant application and effectiveness in three ways: the amount ofdispersant that contacts the target is highly wind-dependent; the amount of oil dispersed is verydependent on ocean turbulence and other energy; and the amount of oil remaining in the watercolumn is dependent on the same energy. The higher the wind, the less dispersant will be appliedto the oil from an aerial platform. The greater the sea energy, the more oil will be disperseddownwards and the more that will stay dispersed.
Some oils are prone to natural dispersion, particularly those that contain large amounts ofsaturates. For example, diesel fuel which contains mostly saturates, disperses both naturally andwhen dispersant is added. The amount of diesel that disperses when dispersants are used comparedto the amount that would disperse naturally depends primarily on the amount of dispersant enteringthe oil. On the other hand, oils that consist primarily of resins, asphaltenes, and larger aromatics orwaxes will disperse poorly even when dispersants are applied and will in fact separate to somedegree and remain on the surface. For this reason, certain products such as Bunker C are verydifficult or impossible to disperse with chemical treating agents available today. The major factorin natural dispersion is sea energy in the form of waves and turbulence.
Laboratory studies have found that there is a trade-off between the amount (or dose) ofdispersant applied and the sea energy at the time of application. In general, it was found that moredispersant is needed when the sea energy is low to yield the same amount of dispersion as when thesea energy is high.
The relationship between the amount of dispersant applied and the sea energy has beenstudied. A very large amount of dispersant is required when sea energy is low. In fact, this amount

16
of dispersant would be very difficult to get into oil under most normal circumstances. At low seaenergies and with oils that disperse poorly, more dispersant is required at the interface between theoil and the water, to the point that a typical application of surfactant would not be adequate.
2.8.1 Application of DispersantsDispersants are applied either 'neat' (undiluted) or diluted in sea water in the case of many
boat and ship application systems. Aerial spraying, which is done from small and large fixed-wingaircraft as well as from helicopters, is the most popular application method. Spray systems onsmall aircraft used to spray pesticides on crops can be modified to spray dispersant. Such aircraftcan perform many flights in one day and in many different conditions. Their capacities vary fromabout 250 to 1,000 L of dispersant. Transport aircraft with internal tanks can carry from 4,000 to12,000 L of dispersant.
Large transport aircraft such as Hercules fitted with portable spray systems can carry about20,000 L which could treat 400,000 L of oil at a dispersant-to-oil ratio of 1:20. At a thickness of0.5 mm, this oil would cover about 400,000 m or 0.4 km . This treatment could be applied in as2 2
little as an hour after loading the dispersant and as many as eight flights could be flown in a day,depending on the distance from the airport to the spill.
Spray systems are available for boats, varying in size from 10- to 30-m wide spray boomsto tanks from 1,000 to 10,000 L. As dispersant is almost always diluted with sea water to maintaina proper flow through the nozzle, extra equipment is required on the vessel to control dilution andapplication rates. About 10,000 to 100,000 L of dispersant can be applied a day, which wouldcover an area of 1,000,000 m or 1 km . As this is substantially less than could be sprayed from a2 2
single aircraft, spray boats are rarely used for a large spill. Smaller spray vessels are rarely used. The essential elements in applying dispersant are to supply enough dispersant to a givenarea in droplets of the correct size and to ensure that the dispersant comes into direct contact withthe oil. Droplets larger than 1,000 :m will break through the oil slick and cause the oil to collect insmall ribbons, which is referred to as herding. This can be detected by the rapid clearance of the oilin the dispersant drop zone without the formation of the usual white to coffee-coloured plume inthe water column. This is very detrimental and wastes the dispersant. Herding can also occur onthinner slicks when the droplets of dispersant are smaller. The distribution of smaller droplets ofdispersant is not desirable especially when spraying from the air as small droplets will blow awaywith the wind and probably not land on the intended oil slick.
Finally, it is very difficult with aerial equipment to spray enough dispersant on a given areato yield a dispersant-to-oil ratio of about 1:20. The rate at which the dispersant is pumped and theresulting droplet size are critical and a slick must often be under-dosed with dispersant rather thancreating very small droplets. Tests have shown that re-applying dispersant to the same area severaltimes is one way of ensuring that enough dispersant is applied to the oil.
Dispersants must always be applied with a system designed specifically for the purpose. Ifpesticide spray equipment is used, small droplets form that may blow away and not enoughdispersant is deposited onto the oil slick. Unless suitably modified, fire monitors or regular hosesfrom ships may not result in correct droplet sizes or quantities of dispersant per unit area.Furthermore, the high velocity of the water/dispersant mixture can herd the oil away, resulting inthe loss of dispersant to the water column, where it has little effect on oil floating on top of thewater.
17
2.9 In-Situ BurningIn-situ burning is an oil spill cleanup technique that involves controlled burning of the oil at
or near the spill site. The major advantage of this technique is its potential for removing largeamounts of oil over an extensive area in less time than other techniques. The technique has beenused at actual spill sites for some time, especially in ice-covered waters where the oil is containedby the ice.
The most obvious disadvantage of burning oil is concerns about toxic emissions from thelarge black smoke plume produced. The second disadvantage is that the oil will not ignite and burnunless it is thick enough. Most oils spread rapidly on water and the slick quickly becomes too thinfor burning to be feasible. Fire-resistant booms are used to concentrate the oil into thicker slicks sothat the oil can be burned. This is then subject to the same wind and wave limitations as physicalrecovery.
2.9.1 Ignition of OilEarly studies of in-situ burning focussed on ignition as being the key to successful burning
of oil on water. It has since been found that ignition can be difficult under high winds (Fingas andPunt, 2000). More recent studies have shown that slick thickness is actually the most importantfactor required for oil to burn and that almost any type of oil will burn on water or land if the slickis thick enough. Ignition may be difficult, however, at winds greater than 20 m/s (40 knots). Theweather thus becomes a key factor in a successful burn operation.
In general, heavy oils and weathered oils take longer to ignite and require a hotter flamethan lighter oils. This is also the case for oil that contains water, although oil that is completelyemulsified with water may not ignite at all. While the ignitability of emulsions with varying waterconcentrations is not well understood, oil containing some emulsion can be ignited and burned.Several burns have been conducted in which some emulsion or high water content in the oil did notaffect either the ignitability of the oil or the efficiency of the burn. Chemical emulsion breakers canbe used to break down enough of the emulsion to allow the fire to get started. As it is suspectedthat fire breaks down the water-in-oil emulsion, water content may not be a problem once the fireis actually burning.
Most ignition devices burn long enough and generate enough heat to ignite most oils.Several igniters have been developed, ranging from simple devices made of juice cans andpropellant to sophisticated helicopter-borne devices. The state of the art in ignition technology isthe helitorch, a helicopter-slung device which dispenses packets of burning, gelled fuel thatproduce a flame of 800 C lasting for up to 6 minutes. The device was developed to start back-fireso
for the forestry industry. It must be added, however, that many of these devices have not beentested under high wind conditions. Simple home-made devices have functioned relatively wellunder higher wind conditions given that they sheltered the initial flame.
2.9.2 Use of ContainmentOil can be burned on water without using containment booms if the slick is thick enough (2
to 3 mm) to ignite. For most crude oils, however, this thickness is only maintained for a few hoursafter the spill occurs. Oil on the open sea rapidly spreads to an equilibrium thickness, which isabout 0.01 to 0.1 mm for light crude oils and about 0.05 to 0.5 mm for heavy crudes and residualoils. Such slicks are too thin to ignite and containment is required to concentrate the oil so it isthick enough to ignite and burn efficiently.

18
Special fire-resistant booms are available to contain oil when using burning as a spillcleanup technique. As they must be able to withstand heat for long periods of time, these boomsare constantly being tested for fire resistance and containment capability and designs are modifiedin response to test results. Fire-resistant booms require special handling, especially stainless steelbooms because of their size and weight. Furthermore, these booms are more subject to wind andwaves than the best regular booms.
Booms are also used by spill responders to isolate the oil from the source of the spill. Whenconsidering burning as a spill cleanup technique, the integrity of the source of the spill and thepossibility of further spillage is always a priority. If there is any possibility that the fire could flashback to the source of the spill, such as an oil tanker, the oil is usually not ignited. Oil is sometimescontained by natural barriers such as shorelines, offshore sand bars, or ice. Several successfulexperiments and burns of actual spills have shown that ice acts as a natural boom so that in-situburning can be carried out successfully for spills in ice. Oil against a shoreline can be burned if theshoreline is in a remote area and consists of cliffs, rock, gravel, or sandy slopes and is a safedistance from any combustible material, such as forests, grass cover, or wooden structures. Thisthen makes burning much more feasible under adverse weather conditions.
2.10 Shoreline Cleanup The fate and behaviour of oil on shorelines is influenced by many factors, some of which
relate to the oil itself, some to characteristics of the shoreline, and others to conditions at the timethe oil is deposited on the shoreline, such as weather and waves (Fingas, 2000a). These factorsinclude the type and amount of oil, the degree of weathering of the oil, both before it reaches theshoreline and while on the shoreline, the temperature, the state of the tide when the oil washesonshore, the type of beach substrate, i.e., its material composition, the type and sensitivity of biotaon the beach, and the steepness of the shore.
Other important factors are the existence of a high tide berm on the beach, if the oil isdeposited in the intertidal zone, and whether the particular length of shoreline is exposed to orsheltered from wave action. An exposed beach will often 'self-clean' before a cleanup crew canperform the task, which can result in the released oil being transported to other beaches or evenback to the same beach. The extent of oil coverage often depends on the stage of the tide when the oil is depositedon the shoreline. At high tide, oil can be deposited above the normal tide line and often spreadsover a broad intertidal area. The least amount of oiling occurs when the oil is deposited on theshoreline during the falling tide, although this is less likely to occur as the water is moving awayfrom the shoreline. The nature of the intertidal zone, i.e., its composition and slope, will oftendictate the fate of the oil. If large amounts of oil are not retained in the intertidal zone, then the oilwill have less impact on the area.
The fate of oil on shorelines also depends on the wave regime. Oil can be removed andcarried away by energetic waves within days, whereas it can remain for decades in sheltered areas.For example, some of the oil spilled from the Arrow in 1970 remains in the sheltered coves ofNova Scotia to this day. Similarly, a significant amount of oil spilled from the Metula in 1974remains on sheltered beaches in Chile. In both cases, the oil was Bunker C and weatheringproduced a crust on top of the oil. Under this crust, the oil is still relatively fresh, even afterdecades.

19
Beaches are a dynamic environment that change in profile during seasonal storms. This canresult in oil being buried on the beach in layers, often as deep as 1 metre, or buried oil can bebrought to the surface.
Oil stranded on shorelines, especially above the high tide line, weathers with time andbecomes more adhesive, viscous, and difficult to remove. If nutrients are present and the oil iscrude, limited biodegradation can take place, but this occurs slowly and only a small percentage ofthe oil may be removed in one to two years. As oil stranded above the high tide line is above thelimit of normal wave action, physical removal can occur only during storm events.
2.10.1 Recommended Cleanup MethodsSome recommended shoreline cleanup methods are natural recovery, manual removal,
flooding or washing, use of vacuums, mechanical removal, tilling and aeration, sedimentreworking or surf washing, and the use of sorbents or chemical cleaning agents. Many of thesemethods are only practical if weather conditions permit.
Sometimes the best response to an oil spill on a shoreline may be to leave the oil andmonitor the natural recovery of the affected area. This would be the case if more damage would becaused by cleanup than by leaving the environment to recover on its own. This option is suitablefor small spills in sensitive environments and on a beach that will recover quickly on its own suchas on exposed shorelines.
2.10.2 Types of ShorelineThe type of shoreline is crucial in determining the fate and effects of an oil spill as well as
the cleanup methods to be used (Environment Canada, 1998). In fact, the shoreline's basic structureand the size of material present are the most important factors in terms of oil spill cleanup. Thereare many types of shorelines, all of which are classified in terms of sensitivity to oil spills and easeof cleanup. The types discussed here are: bedrock, man-made solid structures, boulder beaches,pebble-cobble, mixed sand-gravel beaches, sand beaches, sand tidal flats, mud tidal flats, marshes,peat and low-lying tundra, and mangrove.
Bedrock shorelines consist of rock that is largely impermeable to oil, although oil canpenetrate through crevices or fractures in the rock. For this reason and because plant and animallife is scarce, bedrock shorelines are not particularly vulnerable to oil spills. Oil is more likely to bedeposited in the upper tidal zone. If the shore is exposed to wave action, a significant amount of oilis likely to be removed after each tidal cycle.
Shorelines consisting of man-made solid structures include retaining walls, harbour walls,ramps, and docks and are generally made of rocks, concrete, steel, and wood. This type of shorelineis usually considered impermeable to oil. Man-made structures are very similar to bedrock and arethe least sensitive of any shoreline to oil.
Boulder beaches consist primarily of materials that are more than 256 mm in diameter.These beaches are not altered by any conditions other than ice, human activity, or extreme waveconditions. Boulder beaches often give way to mud or sand tidal flats in the lower intertidal zone.Because of the large spaces between individual boulders, oil can be carried down to the sedimentsand remain there for years. Boulder beaches are considered to be moderately sensitive to oil and donot recover rapidly from oiling.
Pebble-cobble beaches consist of materials ranging in size from 2 to 256 mm. Some finematerials may be present in the interstitial areas between pebbles and there may also be large

20
boulders in the area. Oil readily penetrates pebble-cobble beaches through the open spaces betweenthe rocks. Retention of the oil may be low as it is often flushed out from the interstitial areas bynatural tide or wave action. Oil will likely concentrate on the upper reaches, however, where thereis little flushing action. As wave action constantly rearranges or reworks the sediments, fewanimals and plants are present, especially in the middle intertidal zone.
A mixed sand-gravel beach consists of a variety of materials from 0.1 to 64 mm in size.These beaches are often called gravel beaches, because the larger gravel appears to predominate.
Sand beaches are what most people envision as a 'beach' and they are found in every part ofNorth America. On many coasts, they are often located between other types of beaches. Sand isdefined as a particle 0.1 to 2 mm in diameter, consisting of several different sizes and types ofminerals. Coarse sand is usually defined as 0.5 to 2 mm in size and fine sand is less than 0.5 mm.Oil can easily become buried in sand and over time this can result in layers of sand and oil, referredto as 'chocolate layer cake'. This is particularly true in the case of frequent storms.
Sand tidal flats consist of material similar to sand beaches but are at shallow angles andnever drain completely. They contain a lot of silt or very fine material. The surface layer of sandflats, which consists of a few centimetres, is dynamic and unstable.
Peat and low-lying tundra are similar types of shoreline found in the Arctic regions.Although different, they have similar sensitivity and cleanup methodologies. Peat is a spongy,fibrous material formed by the incomplete decomposition of plant materials. Peat erodes fromtundra cliffs and often accumulates in sheltered areas, as does oil. Oil does not penetrate wet peat,but dry peat can absorb large amounts of oil. Low-lying tundra is normally dry land but is floodedby the sea at certain times of the year.

21
3. Review of Literature on Spill Countermeasures and Weather3.1 A priori Decision Guides
A number of ‘a priori’ guides have been issued. A classic and very good a priori guide isdescribed by Al Allen in 1988, the concept of which is summarized in Figure 7. As shown in thefigure, the guide is meant to be used as an intermediate in calculating volume rates for eachcountermeasure analyzed.
The logic that Allen (1988) uses is summarized here. For burning, it is assumed that asufficient thickness (2 to 3 mm) is needed for oil to burn and that ignition cannot be carried out atwinds greater than about 10 m/s (20 knots) but that, once ignited, burns can be sustained much pastthis value. Allen notes that mechanical cleanup techniques typically work best on thick oil layers incalm seas and that this drops off quickly at winds of 7 to 10 m/s (Beaufort 3 to 4). The thicknessrelationships are also crucial as shown in Figure 7. High-seas skimming equipment may have anextended envelope, but this is not defined. Allen notes that, as short-period wind-waves build to0.6 to 0.9 m (2 to 3 feet), booms will suffer significant losses due to entrainment and splashover.
The lower bound of dispersant use was estimated to be a wind of about 5 m/s (Beaufort 2)on the basis of the mixing required. The upper limit of dispersant application was estimated to beabout 12 to 14 m/s wind (Beaufort 5 to 6) on the basis of the benefits compared to naturaldispersion which should be great at this sea level. These weather options are later combined byAllen (1988) with a volume recovery versus spill thickness to provide an assessment basis foroffshore countermeasures.
Figure 7 A Classic Weather Windows Diagram (Allen, 1988)

22
ExxonMobil (2000) lists the weather limitations (upper limit) for dispersant application as:work boats (tugboat type) - wind speed 3 to 11 m/s (7 to 21 knots), significant wave height 0 to3 m (1 to 9 feet); single-engine airplanes - wind speed 8 to 11 m/s (17 to 21 knots), significantwave height 2 to 3 m (6 to 9 feet); medium-sized helicopters - wind speed 9 to 11 m/s (17 to27 knots, significant wave height 2 to 8 m (6 to 17 feet); and large multiple-engine airplanes - windspeed 15 to 18 m/s (30 to 35 knots), significant wave height 9 to 12 m (17 to 23 feet).
DeCola (2003) presents a survey of world guidelines and decision trees for dispersant use.Of the about 30 guides or decision trees presented, only two decision trees note restrictions onweather conditions. The US EPA Region 6 guideline indicates an upper limit of 13 m/s (25 knots)on dispersant use and the Washington/Oregon guidelines specify a lower limit of a sea state of 1and an upper sea state of 4 (1 to 10 m/s winds). The latter guideline also specifies an upper limit of0.5 m/s current for mechanical countermeasures.
Koops and Huisman (2002) give a priori limits of Beaufort 6 for skimmers and othermechanical recovery, a limit between 2 to 8 Beaufort (2 to 20 m/s wind) for dispersion, and a lowerthreshold of greater than 3 Beaufort for natural dispersion. Koops (1988) gives the limit ofskimmers as 1.5 m wave heights and notes that swell has no effect on the capability tomechanically recover.
The Mechanical Equipment Calculator, part of NOAA’s Spill Tools on the internet, doesnot include the effects of weather on containment and recovery, although effectiveness iscalculated in the program (Gregory et al., 1999).The program includes primarily the inputs of slickthickness and efficiency.
Dempsey (2002) suggests a limit of a wind speed of 12 m/s (25 knots) and a sea state with awave height not exceeding 3 m for offshore work.
Reed (Reed et al., 1995, a,b,c) described the OSCAR spill model and noted the mechanicalrecovery efficiencies in the model were set as 80% with a 5 m/s wind and 60% with a 10 m/s wind. 3.2 General Countermeasures
Most authors presume low limits for at-sea countermeasures. The presumption is typicallythat countermeasures cannot be conducted if the sea is not dead calm (O’Brien, 2002; Steen et al.,2002). Steen et al. suggest a limit of 1 m waves, while at the same symposium, Koops andHuisman (2002) suggest a limit of five times that amount.
Det Norske Veritas in co-operation with the Norwegian Pollution Authority has developedstandards for the certification of oil spill recovery technologies (Johanesson and Mjelde, 2001).The certification focusses on test methods specifically geared to smaller test tanks as exist inNorway and not on developing minimum specifications for such equipment.
3.3 BoomsSchulze and Lane (2001) and Schulze (2003) review the performance of booms and
summarize 20 years of testing. They note that it is important to relate first-loss velocity as well astest oil viscosity, freeboard, boom draft, and boom buoyancy-to-weight ratio. Much of the boomtesting was conducted in OHMSETT where the results of boom testing have varied over the years.Devitis and Hannon (1995) note that the results of testing have gone up over the years, that is thefirst-loss tow velocity has increased. Particularly, Devitis and Hannon note that there was a jump

23
between the 1982 and 1992 results. During that period, no testing was conducted in OHMSETTand, when it resumed, the first loss failures jumped from about 0.5 to 0.6 m/s. However, Devitisand Hannon note that the range of results are about the same and the differences may stem from thefact that the earlier results were conservative and, secondly, that boom designs have improvedsomewhat. The results of testing from 1975 to 1982 and the procedures for offshore testing for oilspill containment booms were reviewed by Nash and Hillger (1988). The first loss speed rangedfrom 0.1 to 0.57 m/s for a calm situation and from 0 to 0.56 m/s for regular waves and 0 to 0.38m/s for chop. Testing results from OHMSETT are summarized in Table 3.
The classic failure of oil spill containment booms at currents of about 0.4 m/s (0.8 knots) iswell established by hydrodyamic models and tests. Much of this theory was established by Wicks(1969). Milgram and van Houten (1978) summarized the classic theories and demonstrated these ina test tank. Delvigne (1989) described boom failure by critical accumulation of viscous oils.Delvigne also noted that the classical droplet breakaway failure varied as a square of the currentvelocity. Tedeschi (1999) reviews booms and notes that the typical failure is at winds of 8 to 9 m/s(15 to 18 knots). Fitzmaurice (1993) reviews containment and failure modes and suggests thatmultiple boom configurations might be used to avoid critical accumulation. Van Dyck (1994),Clavelle and Rowe (1993), An et al. (1997), Goodman et al. (1997); Brown et al. (1997), Fang andWong (2000), Swift et al. (2000a), and Grilli et al. (2000) utilized models to study failure modes.None included waves as a failure mode. Chen (1998) also reviews containment and proposed toraise containment limits by using porous nets in front of the booms to slow the currents. Johnstonet al. (1993) identified a boom failure mechanism just before critical accumulation occurs withheavy oils. This mode is characterized by a surging under the boom. Zhu and Strunin (2002)propose a new containment model utilizing the Froude number submergence depth and the amountof oil trapped by the barrier.
The effect of waves has been studied by Van Dyck and Bruno (1995). They conducted aseries of tow tank tests which show that short wavelength waves are the most difficult seaconditions for a floating boom to follow, even at optimum tow speeds or relative currents. It wasfound that wave height was not the limiting parameter, provided the wave length/height ratio is12:1 or greater. Short length/height ratios lead to breaking waves where the height of the breakermust not exceed the available freeboard of the floating boom or there will be significant oil loss.Optimum catenary tow speeds are verified to be near 0.5 knot full scale for all wave sizes tested.
Lee and Kang (1997) review the performance of booms in currents and waves. Theysuggest that the effect of waves is to increase the horizontal current velocity. They present agraphical algorithm to predict the failure resulting from symmetrical waves. Kordyban (1992)developed a model to examine the effect of waves on boom failure. His approach is similar to Leeand Kang and a sinusoidal wave increases the effective velocity. Marks et al. (1971) analyzed theforces on a boom and calculated the total force was directly related to the wave amplitude as wellas 12 other factors.
Milgram (1977) reviewed the specific mechanical design features of booms. He derived thefollowing relationship to predict fabric tearing force as:
r rf = (C Dg(d+b) lH )/10 (1)2 1/3
rwhere: f = tearing force, C = flow around the boom,

24
D = density of oil or contained product,g = gravitational constant,d and b = constants related to fabric strength, andH = the significant wave height.
Milgram notes that fabric tearing is the most significant type of physical damage to theboom and that it relates to the one-third power of the significant wave height.
Several workers have noted that the wave period is a serious factor in determining boomcapabilities in waves (Oebius, 1999). Oebius noted that a height-to-period ratio of 0.04 is optimalfor boom containment, but that shorter periods such as 0.056 would result in loss of containment.
Potter et al. (1999) studied the towing forces on booms. The first formulation that they
review has the wave height as a direct and linear factor. The second formulation has the waveheight as a constant that varies with boom and wave type. A typical constant for wave height isabout 2 for a calm condition, 3.5 for regular waves, and 4 for harbour chop. Allen-Jones (1997)reviewed the towing forces and suggested that the direct use of significant wave height might beappropriate. Schulze and Potter (2002) subsequently conducted a series of tests in OHMSETT tomeasure the tow forces. This resulted in a new estimator of tow force which includes the tensioncaused by the force of water being directly proportional to the significant wave height.
Several attempts have been made to increase the containment capability of booms in fastwaters using energy dissipative devices (Wooten, 1973; Dorrler et al., 1975; Jensen et al., 1975;Zhang et al., 1999). Wong and Witmer (1995) used an elliptical shape to increase containmentcapability. Fang and Wong (2001) used a ramp and a series of vertical barriers to create a calmrecovery area.
Sloan et al. (1994) and Nordvik et al. (1995a, b) tested several booms offshore in the NewYork/New Jersey area. Findings included the result that many of the booms tested were notsuitable for the conditions encountered in offshore waters, and that the wave height was only oneof the factors that caused an excess of tow forces for the boom designs. It was also noted that therewas a strong relationship between tow speed submergence initiation and reserve buoyancy and thatthe calculation methods for tow force underestimated the tow force. It was suggested that thismight be a result of not adding the second tow vessel’s acceleration. Nash and Molsberry (1995)discuss the offshore testing and note that the size of the system is a factor. They observed thatlarger booms performed better in an offshore environment.
Suzuki et al. (1985) tested booms in ice and found that the ice presence actually increasedthe critical tow speed. The critical tow speed with ice present generally increased from 0.4 to0.5 m/s depending on a variety of conditions.
3.3.1 Typical Booms Yazaki (1983) described the Japanese government requirements for two types of booms asbeing able to contain oil in winds of 10 or 20 m/s (type C, small harbour, or type D, larger, boom);wave heights of 1 and 1.5 m, and 0.25 and 0.5 m/s current.
Brown et al. (1993) noted that booms would fail at tow velocities of 0.25 m/s if the oil washeavier.
3.3.2 Special and High Current Booms

25
Getman (1977) reports on the tests of three fast current oil recovery devices - the ShellZRV skimmer, the Seaward streaming fibre skimmer, and the French Cyclonet 050. Getman notedthat the Shell ZRV performed well in a high current and in a wave train and the other two devicesperformed poorly in a wave train.
Bitting (1993) reports on the testing of the NOFI Vee-Sweep system noting that this deviceretains oil at higher speeds than most other devices. Hansen (2000a, 2001) measured theperformance of a number of devices including sorbent booms in fast water. The JBF 6001 andCurrent Buster worked up to 3 and 3.5 m/s currents respectively. Hansen (2002) described a seriesof tests to measure the performance of fast water booms and deflectors.
Brekne et al. (2003) describe a boom designed to work in up to 2.5 m significant waveheight and 20 m/s winds (50 knots). This new specialized boom, known as the Uniboom, uses a netfor the lower portion of the skirt and is self-inflating. No subsequent data was actually provided onmeasured performance.
Williams and Cooke (1985) studied and tested bubble barriers for containing and burningoil. They found that the depth of slick contained varied as the square of the current velocity. Forexample, in 8 to 10 m/s wind, the floating bubble barrier held a 3.2 cm slick several metres away.
Eryuzlu and Hauser (1977) describe the use of floating deflectors to move oil out ofcurrents to calm areas. A prototype deflector was tested in currents from 0.8 to 2.1 m/s andsuccessfully deflected oil simulant to a calm area.
Folsom and Johnson (1977) describe a streamlined boom which was claimed to contain ordeflect oil at currents up to 3 m/s.
Nash and Johnson (1981) report on the use of plunging water jets to converge oil slicks.They found they could converge slicks at current speeds of up to 3 m/s using this technology.
Brown et al. (1992, 1993) and Brown and Goodman (1998) report on the study and testingof several high-speed containment concepts including vertical cylinders, vertical slats with andwithout a back wall, vertical walls with fins at an angle, a hydrofoil, and horizontal structuresincluding inclined screens and a variety of filters. Several of these innovations improved thecontainment ability, but no single system was recommended.
Swift et al. (2000b) reported on tests of an inclined submergence bow plane device whichretained oil at currents up to 1.03 m/s.
3.4 Skimmers Extensive testing of skimmers has been conducted in the OHMSETT facility. Tests fromthe 1970s are summarized in Smith and Lichte (1981) and Farlow and Griffiths (1981). Additionaldata are given in Lichte et al. (1981) and Lichte (1979). These tests are summarized again inSchulze (1998). Schulze is used as the prime source of data here, as summarized in Table 4.
Watkins (1995) notes that a measure of the effectiveness of a skimmer is the ability torecover the most oil in the least time. Suzuki et al. (1989) tested model skimmers at scale modelsand described the flow mathematically. Guenette and Buist (1993) reported on extensive testing ofthe Lori brush skimmer. While it is acknowledged that skimmers may have similar limits as booms [about 0.5 m/s(1 knot)], these limitations can be overcome by several means, most typically by moving theskimmer at a lesser relative velocity to the oil on the sea. Several workers have proposed skimmerdesigns to overcome these limitations. Several earlier works used air herding or sheltering of therecovery area (Ayers et al., 1975; Freestone et al., 1975; Neal et al., 1975; Widawsky, 1975).

26
Clauss and Kühnlein (1991) proposed and demonstrate the use of massive wave-shielding hullsand energy-absorbing designs to allow at-sea recovery. Ueda et al. (2001) tested a model skimmerthat avoids the effects of waves by diverting oil into a calm area. Hara et al. (2002) propose to usea moon pool inside a vessel to increase the wave limit from 1 to 2 or 3 m wave height. Akahoshi etal. (2002) suggest the current limit of sea recovery is a wave height of 2.5 m and propose to use acompensating float-pump system to deal with motion of the recovery platform. Hvidbak andGunter (2002a) note that heavy oil imposes additional restrictions on recovery at sea.
Provant (1992) described the capabilities of the recovery equipment for the weatherconditions of Prince William Sound. Provant provides tables of expected wave heights with windsin the sound. The degradation of performance of skimmers is given as: sea height up to 0.9 m,80%; 1 to 2 m, 70%; 2.1 to 2.7 m, 50%; and over 2.8 m, 10%.
Nordvik (1999b) described modifications of the Transrec oil recovery system to improve itsrecovery efficiency and to enable high seas recovery. The unit recovered 15 to 85% of the oilpresented to it during individual tests in 1.5 m waves and was thought to be capable of operating inwaves up to 4 m.
Nordvik (1995) suggested limits for windows of opportunity for skimmers based onviscosity increase. Nordvik suggested a limit of 3 to 10 hours for a disc skimmer and 10 hours for abrush skimmer for the heavy oil BCF 17. For BCF 24, the window was estimated to be 2 to 3 daysfor a disk skimmer and after 3 days for a brush skimmer. These limits were based on the viscositynumber generated from an oil viscosity model.
A test of skimmers and booms in cold weather conditions showed no differences fromwarmer weather tests of the same skimmers (Environment Canada, 1984). Shum and Borst (1985)tested a rope-mop skimmer in a test tank with ice and found that the recovery rates were notaffected by up to 50% ice concentration. After 50% ice concentration, the mouth of the skimmerbecame jammed with ice. These tests show that the most significant factor in temperature is theformation of ice.
Gates and Corradino (1985) described a test of a weir skimmer in a test tank. The recoverydid not deteriorate significantly when waves were increased from .18 to .47 m.
3.4.1 Harbour/Small SkimmersThe standard specifications for a harbour skimmer are that they should be able to achieve
the specified performance with a 0.3 m wave (Smith et al., 1989). Velocity of the skimmingsurface is important and studies have shown that significant performance improvements in askimmer can be achieved if the rotation speed is slowed (Christodoulou and Turner, 1987). Yazaki(1983) noted that the government of Japan specified that small skimmers must be able to operate atwinds of 10 m/s and up to 0.5 m wave height and larger skimmers at winds of up to 15 m/s andwave heights of up to 1.2 m.
3.4.2 Offshore/Larger SkimmersNordvik (1995) noted successful recoveries on the open seas at up to 10 to 13 m/s winds
and in waves up to 2.5 m/s. Peigne (1985) reports on the test of the Sirene and ESCA offshoreskimming systems. Both systems were able to recover oil during offshore tests in winds up to 10m/s and the accompanying waves of 1 to 2 m. Leigh (1973) described efforts to build and test twoskimming devices to withstand sea state 5 (equivalent to winds of 10 to 14 m/s and wave heights of

27
about 2 m). The two devices were a disc-drum skimmer and a weir basin that sheltered the basinface from oncoming waves.
Wilson (1981) reported on the testing of a high seas weir boom and noted that highrecoveries were obtained in seas with up to 3 m waves and winds of up to 15 m/s. Up to 7,500 tonsof oil or emulsion were collected in high seas.
3.4.3 Special/High Current Skimmers Schwartz (1979) describes some of the first tests on higher-speed skimmers, noting theperformance decrease with both waves and tow speed. Hansen (2002) described a series of tests tomeasure the performance of fast-water skimmers. The “Ocean Buster” skimmer, a unit using a weirand calm area behind the weir, has been successfully tested at tow speeds up to 2 m/s (4 knots)(Brekne et al., 2003). The same skimmer was tested in seas up to 3 m significant wave height at atow speed of 0.8 m/s (1.5 knots). Coe (1999) describes a similar effort in which the USCG high-speed skimmer capability was increased up to 3 m/s (6 knots) by using a deflector. 3.4.4 Skimming Ships Several Dutch efforts have taken place over the past 20 years to use dredger vessels withtheir systems for the recovery of oil (Ouwerkerk et al., 1995). Recent efforts have focussed onmodifications to the input system to allow the dredger vessels to use their own pumps, therebyutilizing this enormous capacity. The heart of the system is the floating unit known as a dredgeskimmer, which replaces the regular draghead. This skimmer follows the wave movements and thesuction pipeline is kept in position about 2 m under the water level by the suction tube gantries. Asweeping arm is connected to the skimmer through a double hinge, allowing the arm freedom ofmovement horizontally and vertically. Koops et al. (1985) describe the use of the earlier versionsof these skimming vessels to recover the heavy oil during the Katina oil spill. The modifieddredges recovered oil in waves of up to 2 m, at which point the sweeping operation was stopped toavoid damage. Recent versions of the vessel recovered up to 13,000 L of pure heavy oil during a 3-month period at the Prestige spill.
3.5 DispersantsOver 10 years ago, neither weathering of the oil nor weather itself were considered in
planning for dispersant application (Lindstedt-Siva, 1987). More recently, dispersant applicationshave been assessed using only weathering and not weather as a criterion for results (Scholz et al.,1999; Lewis and Aurand, 1997; Aurand, 1995; Trudel et al., 2001, 2003). Nordvik (1995)proposed a weathering-based window of 26 hours for ANS crude and 2 hours for Bonnie Light. Aperiod of reduced dispersibility was estimated to be 26 to 120 hours for ANS crude and 2 to4 hours for Bonnie Light. After 4 hours, Bonnie Light was deemed not dispersible. Several workers(Lewis et al, 1994, 1995a, b, 1998a, b) noted that the weathering of the oil itself was a major factorin dispersant effectiveness.
Martinelli and Lynch (1980) reviewed the factors affecting chemical dispersion and notedthat the two most important factors are the oil composition and sea energy. Martinelli and Lynchconcluded that temperature was semi-important and several other factors were not investigated.Farmwald and Nelson (1982) tested the effect of temperature on dispersibility of Prudhoe Baycrude and found a variable temperature effect. Daling (1988), Daling et al. (1995), and Brandvik etal. (1991) measured dispersant effectiveness in the laboratory and found that, as temperature was

28
lowered, effectiveness fell by as much as 20%. The researchers also noted that photolysis of the oilresulted in less effectiveness.
Salt (2001) reviews the use of dispersant application aircraft at night and concludes thatonly daylight operations would be safe.
Lunel and Lewis (1999) propose that the bottom threshold for dispersibility be establishedas 15% for moderate sea conditions and 30% for calm sea conditions. Lunel et al. (1995a) suggestthat winds of 0 to 5 m/s be classified as low energy and winds of 6 to 10 m/s be classified as highenergy. The natural dispersion on a medium fuel oil was 0.8% at low energy and 3% at highenergy. The dispersion for the medium fuel oil for Slickgone was 8% at low energy and 17% athigh energy. Scholz et al. (1999) suggest a minimum threshold of energy of a sea state of 1 to 5(corresponding to winds of 2.5 to 12 m/s and waves of 0.1 to 2 m).
At higher sea states, many crude oils will disperse naturally. Most of the oil spilled duringthe Braer incident, which was a Gulfaks crude oil, dispersed naturally (Thomas and Lunel, 1993;Lunel 1995a, b). Lunel noted that the winds were of force 8 to 10 (16 to 26 m/s, yielding waves ofabout 6 to 12 m and gusts of wind up to 35 m/s) during that incident. It is important to note that theoil, Gulfaks, was dispersible and that the same conditions applied to a Bunker C, for example,would not result in significant dispersion. Lunel also stated that natural dispersion is slower andmoves only to about 1 m depth. This had been stated earlier by Cormack and Nichols (1977).Fuentes et al. (1995) studied natural dispersion in a turbulent laboratory apparatus and found thatnatural dispersion increased with increased oil weathering. The oil was a lighter Arabian crude.The winds during the Sea Empress incident were up to 20 m/s and thus much of the dispersion thatoccurred during that incident may have been natural (Lunel et al., 1996).
Natural dispersion has been studied and described by several other workers (Reed et al.,1995c; Sebastiao and Soares, 1995). Mackay et al. (1980) described the natural dispersion of oil as:
tFraction dispersed = 0.11(W+1) (1 + 50: ds )-1 (2)2 1/2
where W is the wind speed in m/s,: is the viscosity in mPa.s,d is the slick thickness in cm, and
tS is the oil-water interfacial tension in dyne cm .-1
Most recent models use the equations of Delvigne and Sweeney (1988):
Q = C D S F d )d (3)0.57 0.7
where Q is the entrainment rate of oil droplets,C is an empirical constant dependent on oil type,D is the dissipated breaking wave energy,S is the fraction of the sea surface covered by the oil,F is the fraction of the sea hit by breaking waves,d is the oil particle diameter, and )d is the oil particle diameter interval.
The wave energy, D is given by:
D = 0.0034DgH (4)2

29
where D is the energy in J/m ,2
D is the density of seawater,g is the gravitational constant, andH is the rms value of wave height.
Thus in both the Mackay and the Delvigne formulation, the amount of oil that enters thewater varies as the square of the wave height. Delvigne and Hulsen (1994) subsequently developeda small laboratory method to measure the dispersibility of an oil.
Koops (1988) also presents a formulation for natural dispersion:
dispV = Vo(1 - e Ht/Vo ) (5)-7.6 10-5 0.62
dispwhere V is the volume of oil dispersed naturally,Vo is the initial oil volume,H is the significant wave height, andt is the time.
In the Koops formulation, the oil dispersion varies linearly with the wave height.Mackay (1985) later developed a relationship for breaking waves only and the parameter
that determined the rate of dispersion was only the amount of dispersant applied.The effectiveness of Corexit 9500 and Corexit 9527 was tested on Alaska North Slope
crude oil at various salinities and temperatures representative of conditions found in SouthernAlaskan waters (Moles et al., 2001). The oil was weathered to different degrees. Tests wereconducted in a swirling flask at temperatures of 3, 10, and 22 C with salinities of 22 and 32 /oo.o o
Analysis was by GC. The authors concluded that, at the common temperatures found in theestuaries and marine waters of Alaska, the dispersants were largely ineffective. They also foundthat there was an interactive effect between temperature and salinity. A high effectiveness for‘emulsion’, an uncharacterized mixture of oil and water, was attributed to ‘osmotic shock’ becauseof the difference in the salinity of preparation (33 /oo) and the test salinity.o
Deposition of dispersant droplets depends on the droplet sizes discharged from the nozzles.Lindblom and Cashion (1983) presented a relationship that describes the droplet sizes:
VMD = k (:a F D V D ) (6)b c d e
where VMD is the droplet volume mean diameter,: is the dispersant viscosity,F is the surface tension,D is the density of the dispersant,V is the exit velocity relative to the surrounding airstream,D is the nozzle diameter, andk, a, b, c, d, e are empirical constants.
It should be noted that d varies from -0.6 to -1.3 depending on dispersant, thus the effect ofincreasing wind velocity is to decrease the droplet diameter discharged.
Smedley (1981) studied the deposition of dispersants from DC-4 and Canadair sprayaircraft. Smedley noted that droplets less than 100 µm and sometimes up to 500 µm may beentrained in aircraft vortices and may not be deposited near the intended target. Tests also showedthat crosswinds cause poor deposition.

30
Fay (1993) reported on a series of tests on the MASS spray system at Crosbytown, Texas.Fay notes that 20 to 80% of the dispersant was lost and did not hit the targeted area. Giammona etal. (1994) conducted a major campaign to measure the deposition of dispersant from severalaircraft platforms near Alpine, Texas. These data have been used here to provide prediction of therelation of wind to deposition efficiency and thus weather cutoffs.
Lewis (1995) calibrated a helicopter bucket system finding that the standard conditions of30 m/s (60 knots) forward speed and altitude of 14 m (50 feet) resulted in about 70% deposition. Aforward speed of 8 m/s (15 knots) and 6 m (12 feet) resulted in better or optimal deposition,although the ground effect of the helicopter rotors was extreme. A deposition of about 3 to6 mL/m was obtained at the standard conditions, with a loss of about 20% of the material due to2
wind drift under the prevailing weather conditions of 2 to 5 m/s winds. At this wind speed thedeposition was about 3.4 mL/m (about 3.5 US gal/acre) with a swath width of about 21 m.2
Reducing the air speed to 15 m/s (30 knots) and an altitude of 7 m (25 feet) increased the dosagerate to 14 mL/m (about 14 US gal/acre) with a deposition rate of at least 70%. Brandvik et al.2
(1997) tested a new helicopter bucket but did not gauge the effect of wind.Payne et al. (1991b) studied the use of dispersant on the Pac Baroness and noted that winds
of 7 to10 m/s caused problems in deposition. Furthermore, it was impossible to tell if thedispersant hit the slick or was blown off by the cross wind. Payne et al. (1993) studied the testapplication of dispersant on the Mega Borg spill and noted that there was significant wind drift ofthe dispersants. Lunel (1994a; 1994b; 1995a; 1995b; 1995c; 1995d; 1998; Lunel et al. 1995a, b;1996; 1997; Lunel, 2001; Lunel and Davies, 1996: Lunel and Wood, 1996) noted in several seatrials that winds of 5 to 10 m/s were not a problem for aerial application, although targeting is aproblem and that this is best done with the aid of remote sensing. Guyomarch et al. (2002) describea field experiment in which the wind ranged from 3 to 20 m/s. This wind was not noted as a factor.
Several workers noted that dispersion using spray booms on vessels was relativelyunaffected by winds up to 15 m/s (Lichtenthaler and Daling, 1983). 3.5.1 Other Agents
Pope et al. (1985) tested surface collecting agents and evaluated them over a range oftemperatures. The efficiencies of the agents only decreased slightly with air temperatures down toless than 0 C. The effect of wind of 2 to 3 m/s was to assist in herding. o
3.6 In-situ BurningBuist et al. (2003) studied the burn rates and conditions of some Alaskan oils with and
without ice. Buist (2003) discussed the windows of opportunity for in-situ burning. He proposesthat the maximum wind speed for successful ignition is 10 to 12 m/s, although no basis for this isgiven. Later in the paper, Buist also proposes a series of weathering percentages and water contentfor which oils would or would not burn or where efficiency is severely hampered. Furtherlimitations discussed include operational limits and that VFR flying rules for the helicopter wouldrequire greater than 4 km visibility and a minimum 300 m ceiling. Buist et al. (1998) studied in-situ burning in a test tank on the North Slope of Alaska and found that the wave steepness reducedboth the burn rate and effectiveness. Bech et al. (1993) found that increasing wave action reducedefficiency.

31
Thornborough (1997) described a series of in-situ burns conducted off the United Kingdomin 1996. The trial was specifically designed to examine the limits of ignition and combustion undersea conditions. Burn 1 was ignited using a small hand-held unit with a sea state of 4/5 (waves of 1to 2 m), wind of 10 to 13 m/s (20 to 25 knots), and a current speed of 0.9 m/s (1.8 knots). Theboom and the ignition were successful and were not significantly hampered by the prevalentweather conditions. The second burn was ignited using a Helitorch at sea state of 4 (waves about1.5 m), wind of 10 m/s (20 knots), a current of 0.9 m/s (1.8 knots) and again at 120 degrees fromthe current direction and that of the towing vessel. The second burn involved oil containing 25%water. The burning fuel from the Helitorch reached the sea surface from a height of 60 to 70 feet(20 to 25 m) and a helicopter speed of 10 to 13 m/s (20 to 25 knots). Above this height and speed,the gelled gasoline did not stay ignited.
Nordvik et al. (2002; 2003) reviewed windows of opportunity for burning, noting that thelower flammability limit and weathering of the oil are important. This paper also proposes an upperwind limit of 10 to 12 m/s (20 knots) for the ignition of the oil. The source of this limit, other thana related report, is not given. A weathering diagram generated from the IKU model is given as themeans for estimating the weathering time at which the flash point is reasonable, given a certainwind velocity. Nordvik (1995) had proposed a window based on formation of emulsion for ANScrude of 36 hours and of 1 hour for Bonnie Light crude. 3.6.1 Ignition
Farmwald and Nelson (1982) tested the effect of temperature on flammability and ignitionof Prudhoe Bay crude and found temperature had little effect. Guenette and Wighus (1996)reported that ignition was difficult when winds exceeded 10 m/s. Bech et al. (1993) found thatignition was difficult with emulsified oils. D’Atri and King (1993) conducted a burn in coldconditions and found that gelled gasoline did not work, however, a propane weed-burner workedwell.
Guenette and Thornborough (1997) reported on the use of two types of igniters used off thecoast of the United Kingdom. Burn 1 was ignited using a small hand-held unit with a sea state of4/5 (waves of 1 to 2 m), wind of 10 to 13 m/s (20 to 25 knots), and a current speed of 0.9 m/s (1.8knots). The boom and the ignition were successful and not significantly hampered by the prevalentweather conditions. The second burn was ignited using a Helitorch at sea state of 4 (waves about1.5 m), wind of 10 m/s (20 knots), a current of 0.9 m/s (1.8 knots), and again at 120 degrees fromthe current direction and that of the towing vessel. The hand-held unit consisted of a jar of gelledgasoline and a flare. The unit is floated out to the oil after lighting the flare, the flame from theflare melts the wall of the plastic and then ignites the gelled gasoline. The second device used amodified helitorch in which the fluid included an emulsion breaker as well as the usual gelled fuel.
Moffat and Hankins (1997) tested a flare-type igniter specially built for oil spills. The flaresshowed a temperature of 1370 C at the centre and this was maintained for a 3-minute burn. Theo
igniter was used to ignite diesel fuel in ambient temperatures of 3 C with winds of 8 to 10 m/s.o
Burns certainly could be ignited at higher wind speeds given that the initial burn issheltered from the wind. It is known, that once ignited, fires can burn at very high wind velocities(Fingas and Punt, 2000). In fact, a device for performing this feat was built and tested in the early1980s (Fingas and Punt, 2000).

32
3.6.2 Fire-resistant BoomMeikle (1983) reported on the test of a ceramic fire-resistant boom. Measurements were
taken of the loss rate versus tow speed, as well as the rate of burning at different tow speeds. Theseare reported in Table 3. Buist et al. (1983) also reported on the testing of a fire-resistant boom. Theboom was successfully tested in a towing mode up to wave heights of 4 m and contained oil incurrents up to 0.4 m/s.
Bitting and Coyne (1997) and Hansen (2000b) reported on the tests on fire-resistant boomsas containment booms. Many of the booms showed performance near that of conventional booms.The first loss and critical failure velocities were reported. McCourt et al. (1997) tested a series offire-resistant booms for ruggedness while exposed to a propane fire and found that most boomscould tolerate the propane fires.
3.7 OthersPumps and transfer devices are not really limited by the weather, but are significantly
affected by viscosity which increases as the oil weathers. Lower temperatures would, of course,increase viscosity and make pumping more difficult. Cooper and Mackay (2002) and Hvidbak andGunter (2002b) review viscous pumping technologies.
Nordvik (1995) proposed a window of opportunity limit for using sorbents based onweathering and increased viscosity of oil. Nordvik suggested a viscosity of 15,000 mPa.s wouldconstitute a reasonable upper limit. The window of opportunity for heavy oil such as BCF-17 andBCF-24 became 4 and 10 days respectively. The effectiveness was felt to be reduced to 50% after36 hours.
Nordvik (1995) also proposed a window of opportunity limit for centrifugal separatorsbased on the closing density gap between oil and seawater. This limit was calculated to be 18 hoursfor ANS and 24 hours for Bonnie Light. Provant (1992) studied the effects of wave height onseparation by decanting. Provant rated the decrease in performance with wave height as: waveheight up to 0.9 m, 0.8 decanting factor (eg. 80% effective); waves of 1 to 2 m, 0.8; waves of 2.1 to2.7 m, 0.7; and over 2.8 m, 0.6.
McCourt and Shier (1998) studied the sediment interaction on the Yukon River and foundin laboratory experiments that there were temperature and energy relationships. The mean oilloading was 0.006 goil/gsolids at an arc (shaking angle) of 4 degrees, 0.1 at 7 degrees, and 0.11 at10 degrees. This is explained by increasing contact and coalescence. The loading went from the0.11 noted at 15°C up to 0.26 goil/gsolids at 2°C.
3.8 Ice ConditionsWhile it was not one of the purposes of this study to examine the cleanup efficiencies with
ice as this is more than a factor of weather, some data were found that make it possible to calculatethe degradation of certain recovery techniques with increasing ice concentrations (Grenon, 2000).Abdlenour et al. (1985) summarized tests of a water-spray boom/weir combination in increasingice conditions. Shum and Borst (1985) tested a rope mop in ice-infested conditions and found asharp drop off in effectiveness.
Several workers have noted that ice, not temperature is an issue (Arita et al, 1998; Grenon,2000). Tsang and Vanderkooy (1979) describe the development of an ice boom which shows thecapability of deflecting ice floes on rivers and allowing oil to pass through. The boom wassuccessfully tested in heavy ice concentrations and with currents up to 0.2 m/s.

33
4. Development of Models for Effectiveness of Countermeasures4.1 Overall
The basic procedure to develop a model for countermeasures effectiveness was to useliterature data on testing of examples of the particular countermeasure and then correlate this datawith the weather factor. The main advantage of this method is that it yields a relatively realisticoutlook on the actual relationship between performance and the weather factor underconsideration. The main disadvantage is that often there are no data on the performance of oil spillcountermeasures at high winds, waves, or extreme temperatures. Thus, to a certain extent, theexisting quantitative data may be extrapolated past the typical measurement points.
4.2 BoomsThe quantitative data obtained for boom performance with weather is summarized in Table
3. The variance of critical velocity and wave height can be seen in the table. An analysis of thevariation of critical loss rate and wave height shows some correlation. This allows one to use thevalues presented in Table 3 directly to predict the decrease in first loss and critical velocities.Figure 8 shows the decrease in first loss and critical tow velocities with increasing wave height,using the averages of all booms and then the average of fire-resistant booms. The decrease inperformance of booms with increasing wave height as shown in Figure 8 is expected and has beenrelatively well known for several years. The correlation between various performance parametersfor booms is shown in Table 5. It can be seen that there is a poor correlation between viscosity,wave height, and first loss speed.
4.3 SkimmersThe quantitative data obtained for skimmer performance with weather is summarized in
Table 4. These data largely come from Schulze (1998) and represent data collected over 25 years ofskimmer testing.
Table 4 shows the three most important values of skimmer performance, ORR, TE, and RE.The Oil Recovery Rate (ORR) is the quantitative rate in volume per unit time, usually m /hour and3
is corrected for water recovery. The throughput efficiency (TE) is applicable only to advancingskimmers. The throughput efficiency is the percentage of oil presented to a skimmer versus thatrecovered, in percent. The recovery efficiency (RE) is the percent of oil recovered out of the totaloil and water recovered.
Table 4 also shows the calculations of the rate of change of the ORR, TE, and RE withincreasing current and wave height. These are calculated directly from the data shown in Table 4.The rate of change is taken when other parameters of the test including viscosity and oil type, towrate, and wave height and type, are held constant.
Table 6 shows the summary and calculated averages of the data from Table 4. There issome change in the performance of skimmers with ice concentration.
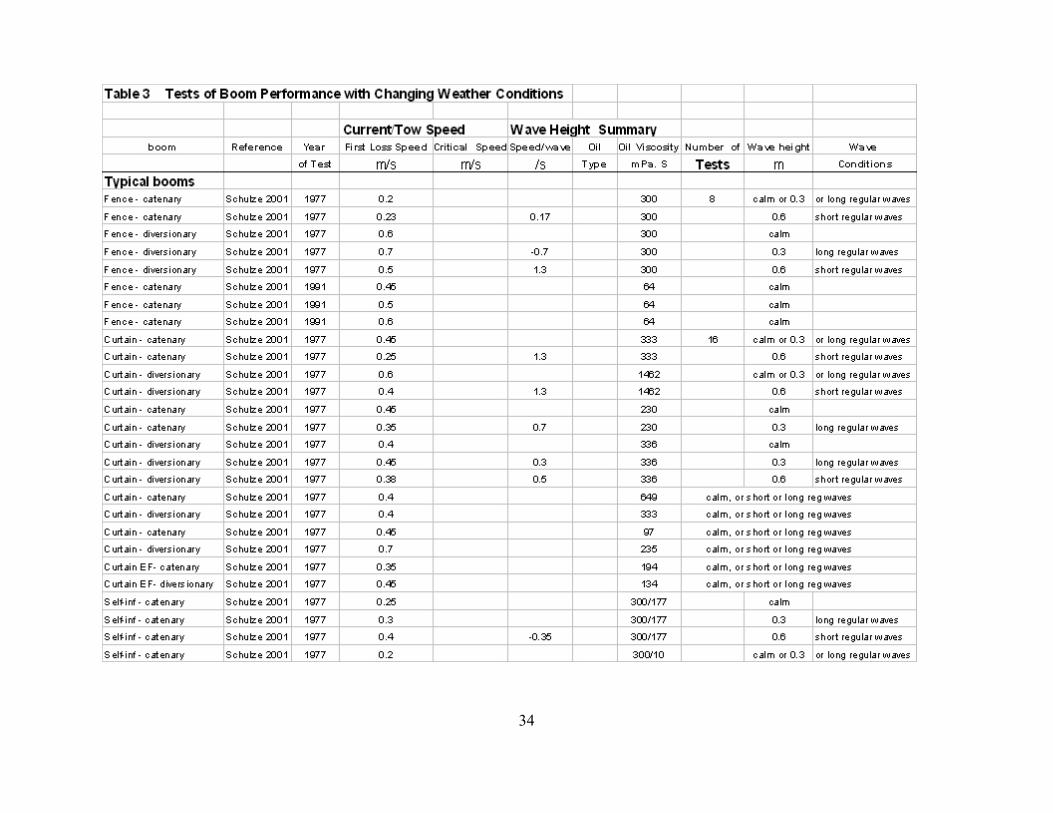
34

35
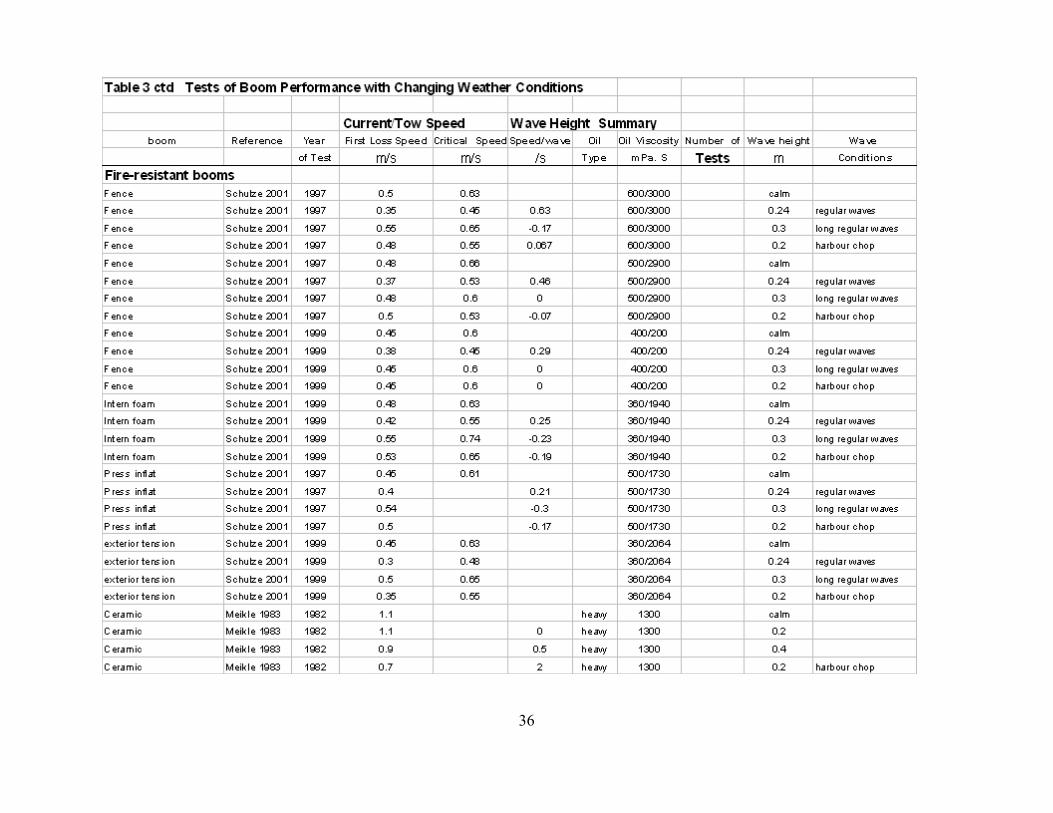
36

37

38

39

40

41

42

43

44
Table 5 Correlation of Performance and Test Parameters for
Booms
First Loss Speed Critical speed/wave Oil Viscosity Wave height
First Loss Speed 1.00 -0.01 0.39 -0.40Critical/wave -0.01 1.00 0.55 -0.05Oil Viscosity 0.39 0.55 1.00 -0.13Wave height -0.40 -0.05 -0.13 1.00
--those items noted in bold show somewhat significant correlation
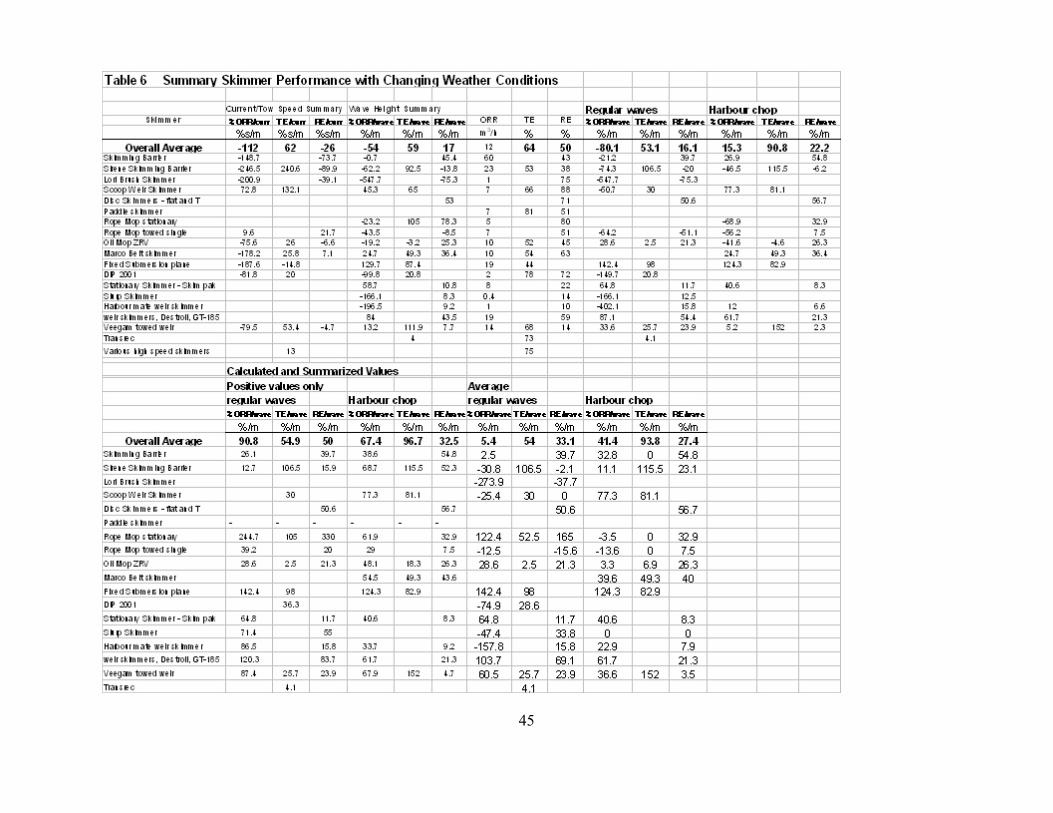
45

46
The following points must be made about skimmer test data.1. The most important point is that most skimmers show unique data and response to
current or tow speed. It is difficult to generalize about skimmers without making the point thatthere are many exceptions. In this report, some generalizations are made but the author is fullyaware of the difficulty of doing so.
2. The test data presented in Tables 4 and 6 are summarized from a variety of literaturesources. The accuracy of these sources is unknown in every case, although Schulze (1998) isbelieved to be a highly accurate summary. Several of the literature sources behind this referencewere checked and no errors were noted. It should also be recognized that the accuracy andprecision of some of the data are questionable. Furthermore, many data points were collected in the1970s.
3. The variability of the data may no doubt be due to the variability in test conditions andalso in the capability to measure the necessary parameters. Some of the data summarized here areactually estimates.
4. It will be noted very readily that the change rate of skimmer effectiveness, particularlyORR, will usually increase with increasing tow speed. Schulze (1998) had noted this. The reason,as Schulze also noted, is no doubt the increased oil encounter rate when tow speed increases. Thiscomplicates calculations of the ‘decrease’ in ORR with increasing tow speed.
5. The effect noted in point 4 above also occurs with some increasing wave activity. Thesame reason is probably pertinent here as well. This also complicates calculations for decline inrecovery with wave height, however, as the wave increases, the performance generally falls andone can use these values separately.
6. Some skimmers may show unusually high or low performance in these data. This islargely due to the test conditions. For example, if a skimmer is not tested at a high tow speed or ahigh wave, its performance may appear to be very good compared to a similar skimmer that istested under more rigorous conditions. There is no easy way to deal with these variances.
7. The effect of ice on performance is shown in Table 7. The average ORR declinessomewhat with increasing ice percentage. Both TE and RE appear, on average, to be unaffected byice concentration.
8. There are many other factors that influence oil recovery for a skimmer. These include oilviscosity and thickness of oil presented to a skimmer. These factors were kept constant throughoutthis exercise by taking the same conditions with only the variable of interest, tow speed, or waveheight as a variable. The cross correlation matrix for all skimmers in this study is given in Table 8,for the Marco belt skimmer in Table 9, and for the Veegarm system, an advancing weir, in Table10. These tables show that combining data such as is done in Table 8 results in little, if any,correlation between different factors. The reason for this is that different factors influence differentskimmer systems differently. For example, an increasing viscosity positively affects the ORR ofthe Marco skimmer (as can be seen in Table 9) and negatively affects a disk skimmer. Thesecorrelations show that many of the common-sense relationships do hold true as long as individualskimmers or skimming principles are examined.

47

48

49

50

51
Another question that arises is the relationship between the decrease in performance and theparameter that is being examined. As with booms described above, it was found that the generalrelationship with performance and waves is a square root one. A typical analysis is shown in Figure8. Models then used to predict the performance of skimmers were based on the square rootfunction and the decreases in performance from empirical data as summarized in Table 4.
Figure 10 shows the oil recovery rate (ORR) change for groups of skimmers and theaverage of all the skimmer data. This shows that the recovery is significantly decreased by harbourchop more than by regular waves. Figure 11 shows the ORR for a variety of specific skimmers. Itcan be seen from this figure that ORR changes significantly between specific skimmers. Similarlythe change in TE and RE are shown in Figures 12 and 13, respectively. The differences betweenindividual units will again be noted.
The change in the performance indicators with increasing current or tow speed were alsoexamined. As was noted earlier and can be seen in Tables 4 and 6, often the ORR increases withincreasing tow speed. This is because the oil encounter rate is increased, at least up to the point thatthe skimmer can handle the increased velocity. Often skimmers show an increase up to a point andthen show a decrease. This was handled in averaging the decrease in performance with current bylooking at the positive values (decrease in performance only). The change in ORR with increasingcurrent or tow speed cannot be shown because generally it is an increase. The TE does generallydecrease with increasing tow speed as seen in Figure 14. One sees a significant different in thethroughput efficiency of the different types of skimmers with the changing speed or current.
In conclusion, the use of the average decrease in performance (ORR, TE, or RE) withincreasing current appears to yield a reasonable estimate of performance with increased waveenergy.
4.4 DispersantsThe variance of dispersant effectiveness with wind speed is not a simple linear function
(Fingas, 2000b). It is known from the literature that effectiveness goes down with decreasingdispersant but goes up with increasing energy. The deposition is known to vary with wind speed(Giamona et al., 1994). The empirical data in Table 11 from various sources, but mainly Giamonaet al. (1994), was correlated to observe whether simple relationships could predict the relationshipbetween wind and deposition. Included in the correlation were aircraft speed, head wind, crosswind, measured droplet diameters, and altitude with the deposition percentage. Surprisingly, it wasfound that altitude had little relation to the deposition percentage, but the others did. Dropping allparameters except wind speed and the particle average volume diameter, it was found that arelatively simple relationship could be established for deposition with wind speed. Thisrelationship is shown in Figure 15. This figure shows the three-way correlation between VolumeMean Diameter (VMD), wind, and the percent deposition. The VMD here is the actual value lessthe optimal diameter of 300 µm . The correlations had shown that the best deposition was obtainedwith this VMD and lesser VMD would result in poorer deposition. The correlation achieved was0.54, which is rather good considering the many variables in deposition, including those mentionedearlier. From this, a simple correlation for deposition with wind relationship was derived:
Deposition (%) = (80 - 3 X Wind Speed) (6)
This was used in subsequent calculations for relative dispersant effectiveness.

52
Figure 8 Effect of Waves on Boom Performance
Figure 9 Relationship between ORR (Oil Recovery Rate) andWave Height (m)

53
Figure 10 Effect of Waves on Skimmer Performance
Figure 11 Performance of Specific Skimmers in Waves

54
Figure 12 Effect of Waves on Throughput Efficiency (TE)
Figure 13 Effect of Waves on Recovery Efficiency (RE)

55
Figure 14 Effect of Current or Tow Speed on Recovery Efficiency (RE)
Figure 15 Correlation of Wind, Droplet Size and Deposition The VolumeMean Diameter (VMD) is the particle size smaller than 300 :m, the threedimensional view also shows the fit surface. The circles above and below the fitsurface show data scatter.

56

57
The final model to be achieved should conceptually consist of the deposition times thedecrease in dispersion caused by the decrease in deposition, then times the increase in dispersioncaused by the increasing wave energy. The next step is to separate natural and chemical dispersionso that the effect of dispersants alone can be estimated. The first step is to calculate the fall off indeposition with wind speed, which was done with the formula illustrated in Figure 15. Then thedrop in chemical dispersion effectiveness with decreasing dispersant amount was calculated usingthe square root function as determined from empirical data as illustrated in Figure 16 (Fingas,2000b). Then the natural dispersion was calculated using the Delvigne and Mackay naturaldispersion approximations in which the natural dispersion varies as the square of the wave height.It is then presumed that a light oil would disperse naturally nearly completely by the wave height ofabout 25 m or a wind of about 25 m/s as was observed during the Braer incident. See Section 3.5for discussion on this issue.
Figure 17 shows the standard wind-wave conversion (Hunt and Groves, 1976).Using thisconversion the total dispersant effectiveness model was created as shown in Figure 18. It isimportant to stress that what is shown here is relative effectiveness, that is the rationalizedeffectiveness with the maximum set to 100%. The value typically measured in laboratory tests orother such similar effectiveness tests is absolute effectiveness. Thus, if one wanted to know theeffectiveness percent at a particular wind or wave condition, then the relative effectiveness ismultiplied by the absolute effectiveness. For example, if a dispersant has a value of 40% in thelaboratory, then at a wind speed of about 12 m/s (25 knots), the relative effectiveness is 60% andthe effectiveness then becomes the two factors multiplied or 0.4 × 0.6 or 24%.
The dispersion model will be described in greater detail in this section. The naturaldispersion follows Delvigne and Mackay approximations, specifically:
Natural dispersion % (wave height + 1.2) /5 (7)2
Chemical dispersion is modelled using a 4-step process. The first step is to calculate theloss in effectiveness with deposition. The deposition was calculated as above using empirical dataas shown in Figure 15.
The loss in effectiveness with deposition % %(80-%dep) (8)
This value is rationalized then to be a relative number, that is starting from a maximum of100%.
The next step is to bring in the wave height as well as the wind with a Delvigne-likerelationship.
Relative dispersion % (loss with wind) * wave height (9)2
The relative dispersion was then averaged over immediate increments to ensure that it wentin smoother increments with increasing wind and wave height.
Chemical dispersion is also known to vary with temperature (Fingas, 2000b; Fingas et al.,2003). Table 12 shows the collection of data on some recent temperature and salinity variances(Moles et al., 2001). The graph of the temperature versus effectiveness of these is shown in Figure 19. On average, the effectiveness decreases as the square root of the temperature between 3 and22 C.o

58

59
Figure 18 Model of Relative Dispersion with Wind
Figure 19 Effect of Temperature on Dispersion (after Moles et. al., 2001)

60
4.5 In-situ BurningThe relation between burning and weather conditions noted that there were several
components. If containment is involved, the limitations are those of the containment boom, alreadydiscussed in Section 4.2. The relationships are shown in Figure 8. Whether or not containment isrequired, there are two factors important to burning: the ability to ignite and the ability to maintainburning in a wind. The latter part of this, the ability to maintain burning in wind, is probably not ofconcern. The limitation on burning may be the ability to ignite in a wind. As noted in Section 3.6,no specific tests were conducted on ignition limits. However, there are some pieces of informationthat can be used to make an estimate on igniting using current techniques. It should be noted thattechniques which involve some form of sheltering may increase the limits of ignition in wind.Thornborough (1997) noted a success in ignition at 13 m/s (25 knots) winds. Discussions withGuenette and Allen indicated that this burn might have a probability of 0.8 at 13 m/s and that itcertainly had a probability of 1 at 10 m/s or about 20 knots. There are no known data on highervelocity winds. If ignition is assigned a probability of 0.8 and 10 m/s is assigned a probability of 1,since this has been performed several times, one can extrapolate a probability of ignition using alinear form as shown in Figure 20.
The burning of oil in ice reduces the efficiency somewhat (Buist et al., 2003). This data canbe used to show the decrease in effectiveness. Table 13 shows that on average, Frazil or slush iceslows burning by 0.45 mm/min and brash ice, by 0.8 mm/min.
4.6 OthersProvant (1992) rated the decrease in performance of decanting (gravity separation) with
wave height as: wave height up to 0.9 m, 0.8 decanting factor (e.g., 80% effective); waves of 1 to 2m, 0.8; waves of 2.1 to 2.7 m, 0.7; and over 2.8 m, 0.6. These data result in a simple nomogram asshown in Figure 20.

61

62
5. Overview of Weather LimitationsThe changes in the effectiveness of countermeasures with waves are shown in Figure 22.
This figure shows the plots of typical skimmers, booms, and the decanting estimation. This showsthat there is a wide discrepancy between the capability of various skimmers to deal with waveheight but that booms are fixed and have limitations at the lower end of the wave scale.
Figure 23 summarizes the wind speed limitations of several countermeasures. The waveshave been equated to wind for this diagram. This shows how booms are limited by wind speed (andthe resulting waves), to a low wind speed of about 3 m/s. Harbour skimmers are limited to similarwind/wave regimes. High speed skimmers can deal with great wind/wave systems. Chemicaldispersion peaks at winds of about 12 m/s as this is the point at which decreasing deposition ismatched by increasing sea energy. The probability of ignition persists throughout the diagram toyield a lower probability at winds of about 25 m/s.
Figure 24 shows the current or tow speed limitations of several countermeasures. Theaverage skimmer and boom is limited to below about 1 m/s, while high speed and zero relativevelocity skimmers (ZRV) have potentially much greater potentials. Figure 25 shows an overallview of the effect of wind on several countermeasures.
Temperature does not limit most physical recovery or burning. It does, however, limitdispersion to a certain degree.

63
Figure 22 Relative Performance of Countermeasures with Wave Height
Figure 23 Relative Performance of Countermeasures with Wind Speed

64
Figure 24 Relative Performance of Booms and Skimmers with Current orTow Speed
Figure 25 Relative Performance (points at which 25% and 50% of maximumperformance are achieved) of Various Countermeasures with WindSpeed

65
6. Summary and Conclusions Spill countermeasures are affected by weather conditions such that, in some cases, they
cannot continue under adverse weather conditions. The literature did not show any quantitativeguides for the performance of countermeasures under varying weather conditions, however, manya priori estimates are available. These a priori guides may not be useful as they lack quantitativebacking. Data could be extracted from a large number of papers to enable assessment of changes inthe performance of countermeasures related to weather conditions. Many estimates or traditionallimits are found in the literature, but these vary considerably and may not be useful. Table 14summarizes the many limits found in the literature, as well as the numerical findings of this report.Table 14 shows the high scatter of the a priori limits around the 25 and 50% performance limitsdeveloped in this report.
The most important factors that influence the performance of countermeasures are the windand wave height. These two factors are related and, given a typical sea, can be inter-converted.These factors must sometimes be considered separately, however, so that specific weather effectscan be examined. Other weather conditions affecting countermeasures include currents andtemperature. Currents are important in that they become the critical factor for certaincountermeasures such as booms. Temperature primarily affects dispersants and has been shown tohave only minimal effect on other countermeasures.
Booms are the countermeasures most susceptible to weather conditions. Booms will fail ata current of 0.5 m/s (1 knot) regardless of design or other conditions. This is due to inherenthydrodynamic limitations. There is wave-associated degradation of this value and this is dependenton design. Nomograms for some typical booms are given.
Skimmers show degradation of recovery potential with increasing wave height and alsowith relative current. Skimmer performance is very individual and a number of skimmerperformance curves have been developed for this study. Some skimmers can only functioneffectively in absolutely calm waters while others have recovered oil in sea states of up to 5 or 6(wave heights of up to 3 m or 18 feet with corresponding winds of up to 15 m/s or 30 knots).Sufficient data exist to predict performance with waves and currents for over 30 specific skimmersand 10 generic types. Advancing skimmers generally show an increase in oil recovery withincreasing current or tow speed because this presents more oil to them or increases the encounterrate.
The weather affects dispersant application and effectiveness in three ways: the amount ofdispersant that contacts the target is highly wind-dependent; the amount of oil dispersed on thesurface is very dependent on ocean turbulence and other energy; and the amount of oil remaining inthe water column is dependent on the same energy. Nomograms for effectiveness have beencreated. At high sea energies, many lighter oils can disperse naturally.
The weather affects in-situ burning in two ways: the ability to ignite oil in a given wind andthe ability to sustain ignition in a given wind. While there are few data on these, estimates ofignition success can be made based on prior experience.

66

67
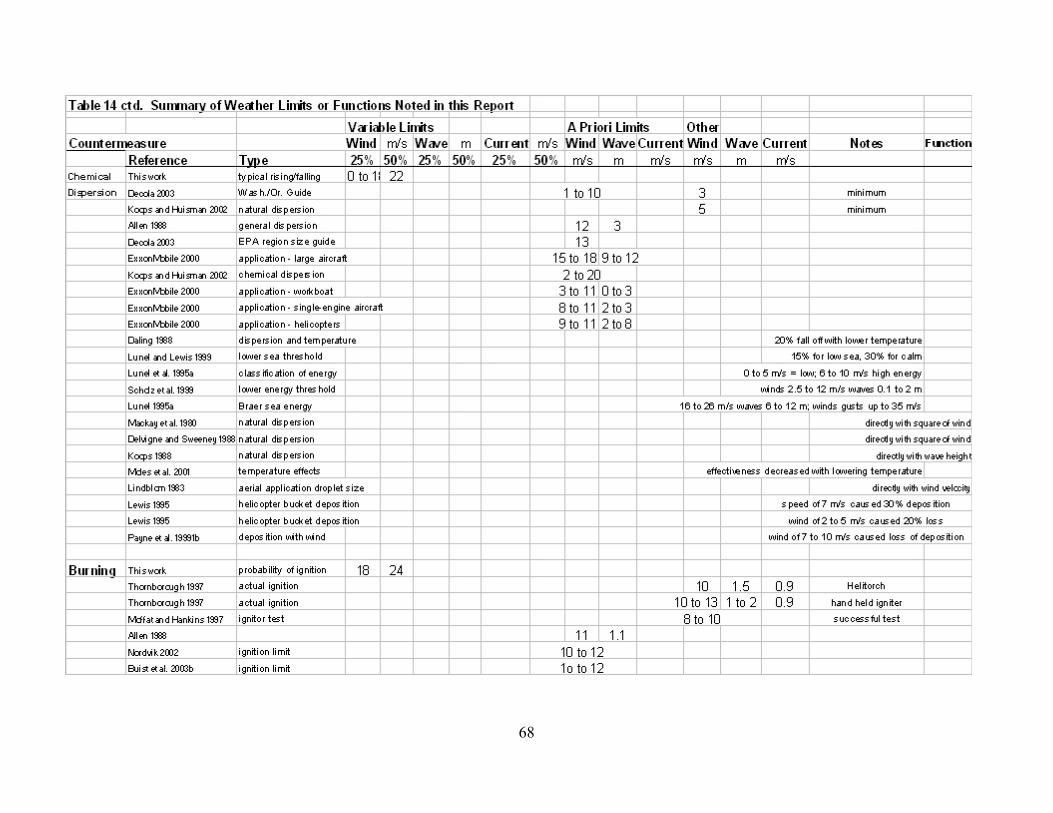
68

69
7. RecommendationsThe following three recommendations might be considered: further work on techniques that
take weather conditions into account; further development of equipment that is appropriate fordifficult weather conditions; and improvements in understanding how weather affects situations.
A factor that should be considered is the way in which countermeasures are applied asweather conditions may dictate against that specific countermeasure. It is suggested that moreemphasis be placed on ‘hit and run’ tactics, that is tactics that can be deployed and withdrawn veryquickly. This would take advantage of the narrow weather windows that often occur during a spillsituation. Examples of this are the use of rapid-deployment side-sweeps which can be deployedwithin 30 minutes. Most systems require anywhere from hours to days to fix and deploy.
The situation during the Prestige spill highlights the utility of this tactic. Several largerecovery ships were in the area and recovered a total of 13,000 tons of oil. One Dutch vessel alonerecovered 9,000 tons. This vessel had a rapidly deployable sweep arm, which was put on deckwhen sea conditions dictated and then rapidly deployed back on the sea when recovery waspossible. Such successes should be studied and the results widely published. As it stands now,most of the information on this recovery was presented verbally at the last oil spill conference.
The work on ‘Windows of Opportunity’ as presented in papers by Champ and Nordviksuggests that most of the opportunity lies at the beginning of a spill when the oil is more readilyrecovered, dispersed or burned. While this is true to a certain extent, more emphasis and studies arenecessary on situations in which this is not the case. Furthermore, the ‘Windows of Opportunity’approach did not fully consider weather and focussed more on time and the change in oil propertieswith time. More work needs to be done on considering weather conditions in the context of bothtactics and strategies to deal with oil spills.
The second recommendation is that promising technologies should be further pursued.Skimmers that show promise of working in faster currents have been developed and tested at veryhigh speeds. These include zero-relative velocity skimmers, such as the Oil Mop ZRV whichshows ability to recover at high speed and was relatively unaffected by small waves. The Veegarmskimmer (predecessor to the skimmer used by the Dutch at the Prestige spill) shows a highthroughput efficiency under a variety of sea conditions. The skimmer barriers, particularly the onedubbed ‘skimming barrier’, show great potential for large oil recoveries, up to 75 m /h under a3
variety of sea conditions. The ‘Fixed Submerged Plane’ showed similar characteristics, but wasalso never pursued to a commercial stage. The new high-speed skimmers show very good promiseat recovering at speeds of up to 3 m/s (6 knots) with waves. The most promising of these are theOcean Buster, USCG HSS, Steam Stripper, and Nofo units. This work is ongoing, so there may beprogress on these.
There will not be great progress in booming, simply because there are hydrodynamic limits.With dispersants, the weather limits are similarly fixed by natural processes. For burning, thedevelopment of sheltered ignition devices, similar to one noted in the text, could extend ignitionout to very high winds ! possibly as high as 30 m/s (60 knots). This technology is simple and aprototype unit has already been developed and tested.
For the third recommendation, some research might be devoted to improving ourunderstanding of how weather affects countermeasures. This is the first comprehensive report onweather effects on countermeasures, despite the fact that it is a serious issue. In particular, themodel for predicting dispersant effectiveness as presented here requires improvement and moreextensive data-backing. This would involve more extensive work, such as that done by Delvigne,on measuring the effect of waves and sea energy on dispersion to form a quantitative measure. In

70
addition, the effect of windrowing of oil at sea by higher winds needs to be examined. There aremany data gaps in the areas of dispersants and weather.
8. ReferencesAbdelnour, R., T. Johnstone, and D. Howard, “Laboratory Testing of an Oil Skimmer Boom inBroken Ice Fields” in Proceedings of the Eighth Arctic and Marine Oil Spill Program TechnicalSeminar, Environment Canada, Ottawa, ON, pp. 131-148, 1985.
Akahoshi, S., S. Ono, T. Iwasaki, and E. Kobayashi, “Study of Large Oil Recovery System for UseUnder Rough Sea Weather Conditions”, in Proceedings of the Third Research and DevelopmentForum on High-Density Oil Spill Response, International Maritime Organization, London, UK,2002.
Allen, A.A., “Comparison of Response Options for Offshore Oil Spills”, in Proceedings of theEleventh Arctic and Marine Oil Spill Program Technical Seminar, Environment Canada, Ottawa,ON, pp. 289-306, 1988.
Allen-Jones, J., “Design and Hydrodynamic Testing of an Oil Slick Containment System”, inProceedings of the Twentieth Arctic and Marine Oil Spill Program Technical Seminar,Environment Canada, Ottawa, ON, pp. 469-497, 1997.
An, C.F., H.M. Brown, R.H. Goodman, and E.J. Clavelle, “Animation of Boom Failure Processes”,in Proceedings of the Twentieth Arctic and Marine Oil Spill Program Technical Seminar,Environment Canada, Ottawa, ON, pp. 1181-1185, 1997.
API, Environmental Considerations for Marine Oil Spill Response, American Petroleum Institute,Publication Number 4706, Washington, DC, 291 pp., 2001.
Arita, M., M. Yamaguchi, S. Narita, K. Koyama, K. Ueda, and K. Izumiyama, “Countermeasuresfor Oil Spills in Cold Water - In the Case of Japan”, in Proceedings of the Twenty-first Arctic andMarine Oil Spill Program Technical Seminar, Environment Canada, Ottawa, ON, pp. 265-270,1998.
Aurand, D., “The Application of Ecological Risk Assessment Principles to Dispersant UsePlanning”, in Spill Science and Technology Bulletin, Vol. 2, pp. 241-247, 1995.
Ayers, R.R., J.P. Fraser, and L.J. Kazmierczak, “Developing an Open-Seas Skimmer”, inProceedings of the 1975 International Oil Spill Conference, American Petroleum Institute,Washington, DC, pp. 401-408, 1975.
Bayoumi, M. and G. Ghalwash, “Estimating Rates of Oil Spills in the Egyptian Ports andApplication of the Technology of ‘Windows-of-Opportunity’”, in Water Pollution, Wit PressSouthhampton, UK, pp. 538-543, 1999.

71
Bech, C., P. Sveum, and I. Buist, “The Effect of Wind, Ice and Waves on the In-Situ Burning ofEmulsions and Aged Oils”, in Proceedings of the Sixteenth Arctic and Marine Oil Spill ProgramTechnical Seminar, Environment Canada, Ottawa, ON, pp. 735-748, 1993.
Beynon, L.R. “Codes of Practice for Dealing with Oil Spills at Sea and on Shore: A EuropeanView”, in Proceedings of the 1969 International Oil Spill Conference, American PetroleumInstitute, Washington, DC, pp. 617-626, 1969.
Bitting, K.R., “NOFI Oil Vee-Sweep and Extension Boom Test at OHMSETT”, in Proceedings ofthe Sixteenth Arctic and Marine Oil Spill Program Technical Seminar, Environment Canada,Ottawa, ON, pp. 173-187, 1993.
Bitting, K.R. and P.M. Coyne, “Oil Containment Tests of Fire Booms”, in Proceedings of theTwentieth Arctic and Marine Oil Spill Program Technical Seminar, Environment Canada, Ottawa,ON, pp. 735-754, 1997.
Boumeester, R.J.B. and R.B. Wallace, “The Break-up of an Oil Film due to Wind-Wave Action”,in Proceedings of the Eighth Arctic and Marine Oil Spill Program Technical Seminar,Environment Canada, Ottawa, ON, pp. 14-25, 1985.
Boumeester, R.J.B. and R.B. Wallace, “Oil Entrainment by Breaking Waves”, in Proceedings ofthe Ninth Arctic and Marine Oil Spill Program Technical Seminar, Environment Canada, Ottawa,ON, pp. 39-49, 1986.
Brandvik, P.J., P.S. Daling, and K. Aareskjold, Chemical Dispersability Testing of Fresh andWeathered Oils - An Extended Study With Eight Oil Types, Report No. 02.0786.00/12/90, IKUSINTEF Group, Norway, (DIWO Rep. 12), 78 p., 1991.
Brandvik, P.J., A. Lewis, P.S. Daling, and T. Strøm-Kristiansen, “On-Land and Offshore Testingof a New Helicopter Bucket for Dispersant Application - Response 3000D”, in Proceedings of theTwentieth Arctic and Marine Oil Spill Program Technical Seminar, Environment Canada, Ottawa,ON, pp. 499-519, 1997.
Brekne, T.M., S. Holmemo, and G.M. Skeie, “Optimizing Offshore Combat of Oil Spills -Development of New Booms and Helicopter-Base Application of Dispersants”, in Proceedings ofthe 2003 International Oil Spill Conference, American Petroleum Institute, Washington, DC, 2003.
Brown, H.M. and R.H. Goodman, “Initial Dynamics of Oil on Water”, in Proceedings of theEighteenth Arctic and Marine Oil Spill Program Technical Seminar, Environment Canada,Ottawa, ON, pp. 61-68, 1995.
Brown, H.M. and R.H. Goodman, “Development of Containment Booms for Oil Spills in FastFlowing Water”, in Proceedings of the Twenty-second Arctic and Marine Oil Spill ProgramTechnical Seminar, Environment Canada, Ottawa, ON, pp. 823-823, 1998.

72
Brown, H.M., R.H. Goodman, and P. Nicholson, “The Containment of Heavy Oil in FlowingWater”, in Proceedings of the Sixteenth Arctic and Marine Oil Spill Program Technical Seminar,Environment Canada, Ottawa, ON, pp. 457-465, 1992.
Brown, H.M., P. Nicholson, R.H. Goodman, B.A. Berry, and B.R. Hughes, “Novel Concepts forthe Containment of Oil in Flowing Water”, in Proceedings of the Sixteenth Arctic and Marine OilSpill Program Technical Seminar, Environment Canada, Ottawa, ON, pp. 485-496, 1993.
Brown, H.M., R.H. Goodman, C.F. An, and J. Bitner, “Boom Failure Mechanisms: Comparison ofChannel Experiments with Computer Modeling Results”, in Proceedings of the Twentieth Arcticand Marine Oil Spill Program Technical Seminar, Environment Canada, Ottawa, ON, pp. 457-467, 1997.
Buist, I.A., “Window-of-Opportunity for In Situ Burning”, in Spill Science & Technology Bulletin,Vol. 6, pp. 341-346, 2003.
Buist, I.A., W.M. Pistruzak, S.G. Potter, N. Vanderkooy, and I.R. McAllister, “The Developmentand Testing of a Fireproof Boom”, in Proceedings of the 1983 International Oil Spill Conference,American Petroleum Institute, Washington, DC, pp. 43-51, 1983.
Buist, I., S. Potter, D. Mackay, and M. Charles, “Laboratory Studies on the Behaviour and Cleanupof Waxy Crude Oil Spills”, in Proceedings of the 1989 International Oil Spill Conference,American Petroleum Institute, Washington, DC, pp. 105-113, 1989.
Buist, I, J. McCourt, J. Mullin, N. Glover, C. Hutton, and J. McHale, “Mid-Scale Tests of In-SituBurning in a New Wave Tank at Prudhoe Bay, AK”, in Proceedings of the Twenty-first Arctic andMarine Oil Spill Program Technical Seminar, Environment Canada, Ottawa, ON, pp. 399-622,1998.
Buist, I., L. Majors, K. Linderman, D. Dickins, J. Mullin, and C. Owens, “Tests to Determine theLimits of In-Situ Burning of Thin Oil Slicks in Brash and Frazil Ice”, in Proceedings of theTwenty-sixth Arctic and Marine Oil Spill Program Technical Seminar, Environment Canada,Ottawa, ON, pp. 629-648, 2003.
Champ, M.A., “The Technology Windows-of-Opportunity Oil Spill Response Strategy”, in OilSpills First Principles: Prevention and Best Response, B.E. Ornitz and M.A. Champ (eds.),Chapter 7, Elsevier Publishing, Amsterdam, Holland, pp. 289-324, 2002.
Champ, M.A., A.B. Nordvik, and J.K. Simmons, “Utilization of Technology Windows ofOpportunity in Marine Oil Spill Contingency Planning, Response and Training”, in Proceedings ofthe 1997 International Oil Spill Conference, American Petroleum Institute, Washington, DC, pp.993-994, 1997.
Chen, A., “Development of a High-Current Velocity Oil Containment System”, Unpublishedpaper, Exxon Production Research Company, Houston, TX, 1998.

73
Cheng, C-Y., A. Ernest, R. Aguilar, and J. Bonner, “Hydrodynamic Characterization of COSS(Coastal Oil-Spill Simulation System) Wave Tank”, in Proceedings of the Twenty-first Arctic andMarine Oil Spill Program Technical Seminar, Environment Canada, Ottawa, ON, pp. 89-98, 1998.
Christodoulou, M.S. and J.T. Turner, “Experimental Study and Improvement of the Rotating DiscSkimmer”, in Proceedings of the 1987 International Oil Spill Conference, American PetroleumInstitute, Washington, DC, pp. 101-108, 1987.
Clauss, G.F. and W.L. Kühnlein, “Efficiency of Selected Oil Skimming Systems in Irregular Seas”,in Proceedings of the 1991 International Oil Spill Conference, American Petroleum Institute,Washington, DC, pp 115-124, 1991.
Clavelle, E.J. and R.D. Rowe, “Numerical Simulation of Oil Boom Failure”, in Proceedings of theSixteenth Arctic and Marine Oil Spill Program Technical Seminar, Environment Canada, Ottawa,ON, pp. 409-418, 1993.
Coe, T., “Control of Oil Spills in Fast Water Currents - A Technology Assessment”, inProceedings of the 1999 International Oil Spill Conference, American Petroleum Institute,Washington, DC, 1999.
Cooper, D. and R. Mackay, “Assisted Viscous Oil Pumping”, in Proceedings of the ThirdResearch and Development Forum on High-Density Oil Spill Response, International MaritimeOrganization, London, UK, 2002.
Cormack, D. and J.A. Nichols, “The Concentrations of Oil in Sea Water Resulting from Naturaland Chemically Induced Dispersion of Oil Slicks”, in Proceedings of the 1977 International OilSpill Conference, American Petroleum Institute, Washington, DC, pp. 381-385, 1977.
Daling, P.S., “A Study of the Chemical Dispersibility of Fresh and Weathered Crude Oils”, inProceedings of the Eleventh Arctic and Marine Oil Spill Program Technical Seminar,Environment Canada, Ottawa, ON, pp. 481-499, 1988.
Daling, P.S., P.J. Brandvik, and I. Singsaas, “Weathering of Oil and Use of Dispersants: Methodsfor Assessing Oils’ Properties at Sea and the Feasibility of Oil Spill Dispersants”, in NOSCASeminar on Oil Pollution Control, 7 p., 1995.
D’Atri, B. and T. King, “Flicking Your Bic at Twenty-five Below”, in Proceedings of the SixteenthArctic and Marine Oil Spill Program Technical Seminar, Environment Canada, Ottawa, ON,pp. 669-677, 1993.
DeCola, E., Dispersant Use in Oil Spill Response: A Worldwide Legislative and Practical Update,Aspen Law and Business, New York, NY, 314 p., 2003.

74
Delvigne, G.A.L., “Barrier Failure by Critical Accumulation of Viscous Oil”, in Proceedings of the1989 International Oil Spill Conference, American Petroleum Institute, Washington, DC, pp. 143-148, 1989.
Delvigne, G.A.L. and C.E. Sweeney, “Natural Dispersion of Oil”, Oil and Chemical Pollution,Vol. 4, pp. 281-310, 1988.
Delvigne, G.A.L. and L.J.M. Hulsen, “Simplified Laboratory Measurement of Oil DispersionCoefficient - Application in Computations of Natural Oil Dispersion”, in Proceedings of theSeventeenth Arctic and Marine Oil Spill Program Technical Seminar, Environment Canada,Ottawa, ON, pp. 173-187, 1994.
Dempsey, J., “First Response to Oil Spills in the Grand Banks Production Area”, in Proceedings ofthe Third Research and Development Forum on High-Density Oil Spill Response, InternationalMaritime Organization, London, UK, 2002.
Devitis, D.S. and L. Hannon, “Resolving the Tow Speed that Causes Boom Oil Loss”, inProceedings of the 1995 International Oil Spill Conference, American Petroleum Institute,Washington, DC, 1995.
Dicks, B., D.V. Ansell, C.C. Guenette, T.H. Moller, R.S. Santner, and I.C. White, “A Review ofthe Problems Posed by Spills of Heavy Fuel Oils”, in Proceedings of the Third Research andDevelopment Forum on High-Density Oil Spill Response, International Maritime Organization,London, UK, 2002.
Dorrler, J.S., R. Ayers, and D.C. Wooten, “High Current Control of Floating Oil”, in Proceedingsof the 1975 International Oil Spill Conference, American Petroleum Institute, Washington, DC,pp. 347-353, 1975.
Elliot, A.J. and B. Jones, “The Need for Operational Forecasting during Oil Spill Response”,Marine Pollution Bulletin, Vol. 40, pp. 110-121, 2000.
Environment Canada, “A Winter Evaluation of Oil Skimmers and Booms”, EnvironmentalProtection Service, EPS 4-EP-84-1, 109 p., 1984.
Environment Canada, Field Guide for the Protection and Cleanup of Oiled Shorelines, SecondEdition, Environment Canada, Atlantic Region, Environmental Emergencies Section, Dartmouth,NS, 201 pp., 1998.
Eryuzlu, N.E. and R. Hauser, “Use of Floating Deflectors for Oil Spill Control in Fast FlowingWaters”, in Proceedings of the 1977 International Oil Spill Conference, American PetroleumInstitute, Washington, DC, pp. 335-340, 1977.
Etkin, D.S., “Estimating Cleanup Costs for Oil Spills”, in Proceedings of the 1999 InternationalOil Spill Conference, American Petroleum Institute, Washington, DC, 1999.

75
Etkin, D.S., “Comparative Methodologies for Estimating On-Water Response Costs for Marine OilSpills”, in Proceedings of the 2001 International Oil Spill Conference, American PetroleumInstitute, Washington, DC, pp. 1281-1289, 2001.
Etkin, D.S. and P. Tebeau, “Assessing Progress and Benefits of Oil Spill Response TechnologyDevelopment Since Exxon Valdez”, in Proceedings of the 2003 International Oil SpillConference, American Petroleum Institute, Washington, DC, 2003.
ExxonMobil, Dispersant Guidelines, Exxon Mobil Corp., Alexandria, VA, 2000.
Fang, J. and K-F. Wong, “Instability of Oil Slicks Contained by a Single Boom”, in Proceedings ofthe Twenty-third Arctic and Marine Oil Spill Program Technical Seminar, Environment Canada,Ottawa, ON, pp. 447-468, 2000.
Fang, J. and K-F. Wong, “Optimization of an Oil Boom Arrangement”, in Proceedings of the 2001International Oil Spill Conference, American Petroleum Institute, Washington, DC, pp. 1367-1374, 2001.
Farlow, J.S. and R.A. Griffiths, “OHMSETT Research Overview, 1979-1980”, in Proceedings ofthe 1981 International Oil Spill Conference, American Petroleum Institute, Washington, DC,pp.661-666, 1981.
Farmwald, J.W. and W.G. Nelson, “Dispersion Characteristics and Flammability of Oil Under LowAmbient Temperatures Conditions”, in Proceedings of the Fifth Arctic and Marine Oil SpillProgram Technical Seminar, Environment Canada, Ottawa, ON, pp. 217-238, 1982.
Fay, R.R., “Measuring the Aerial Application of Oil Dispersant from Very Large Aircraft atModerate Altitude”, in Proceedings of the Sixteenth Arctic and Marine Oil Spill ProgramTechnical Seminar, Environment Canada, Ottawa, ON, pp. 1057-1063, 1993.
Fingas, M.F., The Basics of Oil Spill Cleanup: Second Edition, CRC Press, Boca Raton, FL,256 p., 2000a.
Fingas, M.F., “Use of Surfactants for Environmental Applications”, Chapter 12, in Surfactants:Fundamentals and Applications to the Petroleum Industry, Laurier L. Schramm (ed.), CambridgeUniversity Press, pp. 461-539, 2000b.
Fingas, M.F. and M. Punt, In-Situ Burning: A Cleanup Technique for Oil Spills on Water,Environment Canada, Ottawa, ON, 214 p., 2000.
Fingas, M.F., Z. Wang, M. Landriault, J. Noonan, and R. Mackay, “The Effect of Varying Salinityand Temperature on the Dynamics of Orimulsion in Water”, in Proceedings of the 2003International Oil Spill Conference, American Petroleum Institute, Washington, DC, pp. 419-427,2003.

76
Fiocco, R.J. and R.R. Lessard, “Demulsifying Dispersant for an Extended Window of Use”, inProceedings of the 1997 International Oil Spill Conference, American Petroleum Institute,Washington, DC, pp. 1015-1016, 1997.
Fitzmaurice, M.R., “Can Oil Slicks be Contained?”, Proceedings of the 11 Australianth
Conference, pp. 683-688, 1993.
Folsom, B.A. and C. Johnson, “Development of a High Current Steamlined Oil Boom/Skimmer forInland Waterways”, in Proceedings of the 1977 International Oil Spill Conference, AmericanPetroleum Institute, Washington, DC, pp. 323-327, 1977.
Fredriksson, D.W., C.S. Albro, and S.A. Ostrazeski, “Hydrodynamic Calibration of a Meso-ScaleWind-Wave Flume Basin for the Study of Spilled Oil”, in Proceedings of the Nineteenth Arcticand Marine Oil Spill Program Technical Seminar, Environment Canada, Ottawa, ON, pp. 1541-1553, 1996.
Freestone, F.J., R.A Anderson, and N.P. Trentacoste, “United States Environmental ProtectionAgency Research in High-Speed Devices for the Recovery of Thin-Film Oil Spills”, inProceedings of the 1975 International Oil Spill Conference, American Petroleum Institute,Washington, DC, pp. 409-414, 1975.
Fuentes, H.R., R. Jaffe, V.A. Tsihrintzis, and D. Boye, “In-water Natural Dispersion”, WaterResources, Vol. I, pp. 638-642, 1995.
Gates, D.C. and K.M. Corradino, “OHMSETT Tests of the Toscon Weir Skimmer and GravityDifferential Separator”, in Proceedings of the 1985 International Oil Spill Conference, AmericanPetroleum Institute, Washington, DC, pp. 35-40, 1985.
Getman, J.H., “Performance Tests of Three Fast Current Oil Recovery Devices”, in Proceedings ofthe 1977 International Oil Spill Conference, American Petroleum Institute, Washington, DC,pp. 341-346, 1977.
Giammona, C., K. Binkley, R. Fay, G. Denoux, M. Champ, R. Geyer, F. Bouse, I. Kirk, D.Gardisser, and R. Jamail, Aerial Dispersant Application: Field Testing Research Program, Alpine,Texas, MSRC Technical Report Series 94-019, Marine Spill Response Corporation, Washington,DC, 54 p, 1994.
Goodman, R.H., “Limited Data Sets and the Statistical Validity of Oil Spill Response Data”, inProceedings of the Seventeenth Arctic and Marine Oil Spill Program Technical Seminar,Environment Canada, Ottawa, ON, pp. 895-903, 1994.
Goodman, R.H., H.M. Brown, C.F. An, and R.D. Rowe, “Dynamic Modeling of Oil Boom FailureUsing Computational Fluid Dynamics”, in Proceedings of the Twentieth Arctic and Marine OilSpill Program Technical Seminar, Environment Canada, Ottawa, ON, pp. 437-455, 1997.

77
Gregory, G.L., A.A. Allen, and D.H. Dale, “Assessment of Potential Oil Spill RecoveryCapabilities”, in Proceedings of the 1999 International Oil Spill Conference, American PetroleumInstitute, Washington, DC, pp. 1367-1374, 1999.
Grenon, S., “How to Prioritize Numerous Environmental Issues? Case Study of the Havre-Saint-Pierre Spill”, in Proceedings of the Twenty-third Arctic and Marine Oil Spill Program TechnicalSeminar, Environment Canada, Ottawa, ON, pp. 943-951, 2000.
Grilli, S.T., T. Fake, and M. Spaulding, “SlickMap: An Interactive Computer Model of OilContainment by a Boom”, in Proceedings of the Twenty-third Arctic and Marine Oil SpillProgram Technical Seminar, Environment Canada, Ottawa, ON, pp. 953-986, 2000.
Guenette, C.C. and I.A. Buist, “Testing of the Lori ‘Stiff Brush’ Skimmer Sweep System”, inProceedings of the Sixteenth Arctic and Marine Oil Spill Program Technical Seminar,Environment Canada, Ottawa, ON, pp. 451-476, 1993.
Guenette, C.C. and J. Thornborough, “An Assessment of Two Off-shore Igniter Concepts”, inProceedings of the Twentieth Arctic and Marine Oil Spill Program Technical Seminar,Environment Canada, Ottawa, ON, pp. 795-808, 1997.
Guenette, C.C. and R. Wighus, “In-Situ Burning of Crude Oil and Emulsions in Broken Ice”, inProceedings of the Ninteenth Arctic and Marine Oil Spill Program Technical Seminar,Environment Canada, Ottawa, ON, pp. 895-906, 1996.
Guyomarch, J., E. Mamaca, M. Champs, and F-X. Merlin, “Oil Weathering and DispersibilityStudies: Laboratory, Flume, Mesocosms and Field Experiments”, in Proceedings of the ThirdResearch and Development Forum on High-Density Oil Spill Response, International MaritimeOrganization, London, UK, pp. 166-177, 2002.
Hann, R.W., “Unit Operations, Unit Processes and Level of Resource Requirements for theCleanup of the Oil Spill from the Supertanker Amoco Cadiz”, in Proceedings of the 1979International Oil Spill Conference, American Petroleum Institute, Washington, DC, pp.147-161,1979.
Hansen, K.A., “Equipment Evaluation of Fast-Water Oil Recovery Equipment”, in Proceedings ofthe Twenty-third Arctic and Marine Oil Spill Program Technical Seminar, Environment Canada,Ottawa, ON, pp. 367-384, 2000a.
Hansen, K.A., “Second Phase Evaluation of Fire Resistant Booms: Containment Performance”, inProceedings of the Twenty-third Arctic and Marine Oil Spill Program Technical Seminar,Environment Canada, Ottawa, ON, pp. 429-445, 2000b.
Hansen, K.A. “Development of a Fast-Water Field Guide”, in Proceedings of the Twenty-fourthArctic and Marine Oil Spill Program Technical Seminar, Environment Canada, Ottawa, ON,pp. 237-273, 2001.

78
Hansen, K.A. “Fast Water Oil Spill Response ”, in Proceedings of the Twenty-fifth Arctic andMarine Oil Spill Program Technical Seminar, Environment Canada, Ottawa, ON, pp. 169-179, 2002.
Hara, S., K. Yamakawa, K. Hoshino, K. Yukawa, K. Hikida, H. Kagemoto, T. Kinoshita, andC. Marugame, “Improvement of Performance on Multi-purpose Work Vessel”, in Proceedings ofthe Third Research and Development Forum on High-Density Oil Spill Response, InternationalMaritime Organization, London, UK, 2002.
Harper, J., A. Godon, and A.A. Allen, “Costs Associated with the Cleanup of Marine Oil Spills”,in Proceedings of the 1995 International Oil Spill Conference, American Petroleum Institute,Washington, DC, 1995.
Harris, C., “The Sea Empress Incident: Overview and Response at Sea”, in Proceedings of the1997 International Oil Spill Conference, American Petroleum Institute, Washington, DC, pp. 177-184, 1999.
Hvidbak, F. and P.A. Gunter, “Preparation for Recovery of Heavy Oil Spills, with Emphasis onMechanical Feeder Skimmers”, in Proceedings of the Third Research and Development Forum onHigh-Density Oil Spill Response, International Maritime Organization, London, UK, 2002a.
Hvidbak, F. and P.A. Gunter, “The Development and Test of Techniques for Emergency Transferof Extreme Viscosity Oil (Refloated Bitumen)”, in Proceedings of the Third Research andDevelopment Forum on High-Density Oil Spill Response, International Maritime Organization,London, UK, 2002b.
Hunt, L.M and D.G. Groves, A Glossary of Ocean Science and Undersea Technology Terms,Compass Publications, Arlington, VA, 1976.
Jeffery, P.G., “Large-Scale Experiments on the Spreading of Oil at Sea and Its Disappearance byNatural Factors”, in Proceedings of the 1971 International Oil Spill Conference, AmericanPetroleum Institute, Washington, DC, pp. 469-374, 1971.
Jensen, D.S., W. Lindenmuth, R.L. Beach, and D.J. Norton, “Energy Dissipative Devices toControl Oil Slicks in Fast-Current Environments”, in Proceedings of the 1975 International OilSpill Conference, American Petroleum Institute, Washington, DC, pp. 355-362, 1975.
Johannessen, B.O. and A. Mjelde, “Certification of Oil Spill Response Equipment”, inProceedings of the Twenty-fourth Arctic and Marine Oil Spill Program Technical Seminar,Environment Canada, Ottawa, ON, pp. 295-301, 2001.
Johnston, A.J., M.R. Fitzmaurice, and R.G.M. Watt, “Oil Spill Containment: Viscous Oils”, inProceedings of the 1993 International Oil Spill Conference, American Petroleum Institute,Washington, DC, pp. 89-94, 1993.

79
Koops, W., “A Discussion of Limitations on Dispersant Application”, Oil and Chemical Pollution,Vol. 4, pp. 139-153, 1988.
Koops, W. and S. Huisman, “Let the Oil Wash Ashore - In Case of Heavy Oil Spills”, inProceedings of the Third Research and Development Forum on High-Density Oil Spill Response,International Maritime Organization, London, UK, 2002.
Koops, W., F.J. Sanders, and J.M. Gubbens, “The Katina Oil Spill 1982, Combatting Operation atSea”, in Proceedings of the 1985 International Oil Spill Conference, American Petroleum Institute,Washington, DC, pp. 299-306, 1985.
Kordyban, E., “The Effects of Waves on the Oil Slick Retention at a Retention Boom”, Journal ofEnergy Resources Technology, Vol. 114, pp. 31-37, 1992.
Lamp, H.J., “Lake Champlain: A Case History on the Cleanup of #6 Fuel Through Five Feet ofSolid Ice at Near-Zero Temperatures”, in Proceedings of the 1971 International Oil SpillConference, American Petroleum Institute, Washington, DC, pp. 579-582, 1971.
Lee, C.M. and K.H. Kang, “Prediction of Oil Boom Performance in Currents and Waves”,Advanced Fluids Engineering Research Centre, Phang, Korea, 24 p., 1997 also in Spill Science &Technology Bulletin, Vol. 4, pp. 257-266, 1997.
Lehr, W., C. Barker, and D. Simecek-Beatty, “New Developments in the Use of Uncertainty in OilSpill Forecasts”, in Proceedings of the Twenty-second Arctic and Marine Oil Spill ProgramTechnical Seminar, Environment Canada, Ottawa, ON, pp. 271-284, 1999.
Lehr, W.J. and D. Simecek-Beatty, “The Relation of Langmuir Circulation Processes to theStandard Oil Spill Spreading, Dispersion and Transport Algorithms”, Spill Science & TechnologyBulletin, Vol. 6, pp. 247-253, 2000.
Leigh, J.T., “Oil Recovery on the High Seas”, in Proceedings of the 1973 International Oil SpillConference, American Petroleum Institute, Washington, DC, pp. 351-360, 1973.
Lewis, A., “Calibration and Use of a Helicopter Bucket to Apply Oil Spill Dispersants”, inProceedings of the Eighteenth Arctic and Marine Oil Spill Program Technical Seminar,Environment Canada, Ottawa, ON, pp. 505-517, 1995.
Lewis, A. and D. Aurand, Putting Dispersants to Work: Overcoming Obstacles, Technical ReportIOSC-004, American Petroleum Institute, Washington, DC, 78 p, 1997.
Lewis, A., P.S. Daling, T.S. Kristiansen, I. Singsaas, R.J. Fiocco, and A.B. Nordvik, “ChemicalDispersion of Oil and Water-in-Oil Emulsions: A Comparison of Bench Scale Test Methods andDispersant Treatment in Meso-Scale Flume”, in Proceedings of the Seventeenth Arctic MarineOilspill Program Technical Seminar, Environment Canada, Ottawa, ON, pp. 979-1010, 1994.

80
Lewis, A., P.S. Daling, T. Strom-Kristiansen, and P.J. Brandvik, “The Behaviour of Sture BlendCrude Oil Spilled at Sea and Treated With Dispersant”, in Proceedings of the Eighteenth ArcticMarine Oilspill Program Technical Seminar, Environment Canada, Ottawa, ON, pp 453-469,1995a.
Lewis, A., P.S. Daling, and A.B. Nordvik, “The Effect of Oil Weathering on the LaboratoryDetermined Effectiveness of Oil Spill Dispersants”, Marine Spill Response CorporationWorkshop, Marine Spill Response Corporation, Washington, DC, 28 p, 1995b.
Lewis, A., A. Crosbie, L. Davies, and T. Lunel, “Large Scale Field Experiments Into OilWeathering at Sea and Aerial Application of Dispersants”, in Proceedings of the Twenty-firstArctic Marine Oilspill Program Technical Seminar, Environment Canada, Ottawa, ON, pp 319-344, 1998a.
Lewis, A., A. Crosbie, L. Davies, and T. Lunel, “The AEA ‘97 North Sea Fields Trials on OilWeathering and Aerial Application of Dispersants”, in Dispersant Application in Alaska: ATechnical Update, Prince William Sound Oil Spill Recovery Institute (OSRI), Cordova, AK,pp. 78-109, 1998b.
Lichte, H.W., “Skimming Barrier Performance Evaluation: Offshore Version and HarbourVersion”, in Proceedings of the 1979 International Oil Spill Conference, American PetroleumInstitute, Washington, DC, pp.489-492, 1979.
Lichte, H.W., M.K. Breslin, G.F. Smith, D.J. Graham, and R.W. Urban, Performance Testing ofFour Skimming Systems, EPA report number EPA-600/2-81-189, Cincinnati, OH, 1981.
Lichtenthaler, R.G. and P.S. Daling, “Dispersion of Chemically Treated Crude Oil in NorwegianOffshore Waters”, in Proceedings of the 1983 International Oil Spill Conference, AmericanPetroleum Institute, Washington, DC, pp. 7-14, 1983.
Lindblom, G.P. and B.S. Cashion, “Operational Considerations for Optimum DepositionEfficiency in Aerial Application of Dispersants”, in Proceedings of the 1983 International Oil SpillConference, American Petroleum Institute, Washington, DC, pp. 53-60, 1983.
Lindstedt-Siva, J., “Advance Planning for Dispersant Use”, in Proceedings of the 1987International Oil Spill Conference, American Petroleum Institute, Washington, DC, pp. 329-332,1987.
Lunel, T., “Dispersion of a Large Experimental Slick by Aerial Application of Dispersant”, inProceedings of the Seventeenth Arctic Marine Oilspill Program Technical Seminar, EnvironmentCanada, Ottawa, ON, pp. 951-977, 1994a.
Lunel, T., “Field Trials to Determine Quantitative Estimates of Dispersant Efficiency at Sea”, inProceedings of the Seventeenth Arctic Marine Oilspill Program Technical Seminar, EnvironmentCanada, Ottawa, ON, pp. 1011-1021, 1994b.

81
Lunel, T., “Dispersant Effectiveness at Sea”, in Proceedings of the 1995 International Oil SpillConference, American Petroleum Institute, Washington, DC, pp. 147-155, 1995a.
Lunel, T., “The Braer Spill: Oil Fate Governed by Dispersion”, in Proceedings of the 1995International Oil Spill Conference, American Petroleum Institute, Washington, DC, 1995b.
Lunel, T., “Research Requirements to Determine Dispersant Effectiveness at Sea”, in SecondInternational Oil Spill Research and Development Forum, Vol. 1, International MaritimeOrganization, London, UK, pp. 271-285, 1995c.
Lunel, T., “Understanding the Mechanism of Dispersion through Oil Droplet Size Measurements atSea”, in The Use of Chemicals in Oil Spill Response, STP 1252, American Society for Testing andMaterials, Philadelphia, PA, pp. 240-285, 1995d.
Lunel. T., “Sea Empress Spill: Dispersant Operations, Effectiveness and EffectivenessMonitoring”, in Dispersant Application in Alaska: A Technical Update, Prince William Sound OilSpill Recovery Institute (OSRI), Cordova, AK, pp. 59-77, 1998.
Lunel, T., “Dispersant Pre-Approvals: Best Practice”, in Proceedings of the 2001 International OilSpill Conference, American Petroleum Institute, Washington, DC, pp. 441-444, 2001.
Lunel, T. and L. Davies, “Dispersant Effectiveness in the Field on Fresh Oils and Emulsions”, inProceedings of the Nineteenth Arctic Marine Oilspill Program Technical Seminar, EnvironmentCanada, Ottawa, ON, pp. 1355-1393, 1996.
Lunel, T. and P. Wood, “A Laboratory Dispersant Effectiveness Test which Reflects DispersantEfficiency in the Field”, in Proceedings of the Nineteenth Arctic Marine Oilspill ProgramTechnical Seminar, Environment Canada, Ottawa, ON, pp 461-480, 1996.
Lunel, T. and A. Lewis, “Optimisation of Oil Spill Dispersant Use”, in Proceedings of the 1999International Oil Spill Conference, American Petroleum Institute, Washington, DC, pp. 187-193,1999.
Lunel, T., G. Baldwin, and F. Merlin, “Comparison of Meso-Scale and Laboratory DispersantTests with Dispersant Effectiveness Measured at Sea”, in Proceedings of the Eighteenth ArcticMarine Oilspill Program Technical Seminar, Environment Canada, Ottawa, ON, pp. 629-651,1995a.
Lunel, T., L. Davies, and P.J. Brandvik, “Field Trials to Determine Dispersant Effectiveness atSea”, in Proceedings of the Eighteenth Arctic Marine Oilspill Program Technical Seminar,Environment Canada, Ottawa, ON, pp 603-627, 1995b.
Lunel, T., J. Russin, N. Bailey, C. Halliwell, and L. Davies, “A Successful at Sea Response to theSea Empress Spill”, in Proceedings of the Nineteenth Arctic and Marine Oil Spill ProgramTechnical Seminar, Environment Canada, Ottawa, ON, pp. 1499-1519, 1996.

82
Lunel, T., J. Rusin, N. Bailey, C. Halliwell, and L. Davies, “The Net Environmental Benefit of aSuccessful Dispersant Operation at the Sea Empress Incident”, in Proceedings of the 1997International Oil Spill Conference, American Petroleum Institute, Washington, DC, pp. 185-194,1997.
Lystad, M. and E.A. Martinson, “Currents Computed with a Barotropic Ocean Model: Applicationto Simulation of Oil Slick Movements in Actual Weather Conditions”, in Mechanics of Oil Slicks,Ancient Editions, Paris, France, pp. 133-148, 1981.
Marks, W., G.R. Geiss, and J. Hirschman, “Theoretical and Experimental Evaluation of Oil SpillControl Devices”, in Proceedings of the 1971 International Oil Spill Conference, AmericanPetroleum Institute, Washington, DC, pp. 393-404, 1971.
Mackay, D., “Effectiveness of Chemical Dispersants Under Breaking Wave Conditions”, in TheUse of Chemicals in Oil Spill Response, STP 1252, American Society for Testing and Materials,Philadelphia, Pennsylvania, pp. 310-340, 1985.
Mackay, D., I. Buist, R. Mascarenhas, and S. Petersen, “Oil Spill Processes and Models”,Manuscript Report EE-8, Environmental Protection Service, Ottawa, ON, 1980.
Martinelli, F.N. and B.W.J. Lynch, Factors Affecting the Efficiency of Dispersants, LR 363 (OP),Warren Spring Laboratory, Stevenage, 18 p, 1980.
McCourt, J. and L. Shier, “Interaction between Oil and Suspended Particulate Material in theYukon River”, in Proceedings of the Twenty-first Arctic and Marine Oil Spill Program TechnicalSeminar, Environment Canada, Ottawa, ON, pp. 79-87, 1998.
McCourt, J., I. Buist, B. Pratte, W. Jamieson, and J. Mullin, “Testing Fire Resistant Booms inWaves and Flames”, in Proceedings of the Twentieth Arctic and Marine Oil Spill ProgramTechnical Seminar, Environment Canada, Ottawa, ON, pp. 823-839, 1997.
McWilliams, J.C. and P.P. Sullivan, “Vertical Mixing by Langmuir Circulations”, Spill Science &Technology Bulletin, Vol. 6, pp. 225-237, 2000.
Meikel, K.M., “An Effective Low-Cost Fireproof Boom”, in Proceedings of the 1983 InternationalOil Spill Conference, American Petroleum Institute, Washington, DC, pp. 9-42, 1983.
Milgram, J.H. and R.J. van Houten, “Mechanics of a Restrained Layer of Floating Oil Above aWater Current”, Journal of Hydronautics, Vol. 12, pp. 93-108, 1978.
Milgram, J.H., “Physical Requirements for Oil Pollution Barriers”, in Proceedings of the 1977International Oil Spill Conference, American Petroleum Institute, Washington, DC, pp. 375-381,1977.

83
Moffatt, C. and P. Hankins, “Results of Experiments with Flare Type Igniters on Diesel Fuel andCrude Oil Emulsions”, in Proceedings of the Twentieth Arctic and Marine Oil Spill ProgramTechnical Seminar, Environment Canada, Ottawa, ON, pp. 1197-1214, 1997.
Moles, A., L. Holland, and J. Short, The Effectiveness of Corexit 9527 and 9500 in DispersingFresh, Weathered and Emulsion of Alaska North Slope Crude Oil Under Subarctic Conditions,Prince William Sound Regional Citizens’ Advisory Council, Anchorage, AK, 24 p., 2001.
Nash, J.H. and M.G. Johnson, “Coherent, Plunging Water Jets for Oil Spill Control”, inProceedings of the 1981 International Oil Spill Conference, American Petroleum Institute,Washington, DC, pp. 655-660, 1981.
Nash, J.H. and R.W. Hillger, “Preliminary Results of the Verification of Offshore Oil SpillContainment Boom Performance Evaluation Protocol”, in Proceedings of the Eleventh Arctic andMarine Oil Spill Program Technical Seminar, Environment Canada, Ottawa, ON, pp. 267-276,1988.
Nash, J.H. and D.D. Molsberry, “The Performance of Booms in an Offshore Environment”, inProceedings of the 1995 International Oil Spill Conference, American Petroleum Institute,Washington, DC, 1995.
Neal, R.W., R.A. Bianchi, and E.E. Johanson, “The Design and Demonstration of a Remotely-Controlled High-Seas Oil Recovery System”, in Proceedings of the 1975 International Oil SpillConference, American Petroleum Institute, Washington, DC, pp. 395-399, 1975.
Nordvik, A.B., “The Technology Windows-of-Opportunity for Marine Oil Spill Response asRelated to Oil Weathering and Operations”, Spill Science & Technology Bulletin, Vol. 2, pp. 17-46,1995.
Nordvik, A.B., “Time Window-of-Opportunity for Oil Spill Planning and Response”, Pure andApplied Chemistry, Vol. 71, pp. 5-16, 1999a.
Nordvik, A.B., “Summary of Development and Field Testing of the Transrec Oil RecoverySystem”, Spill Science & Technology Bulletin, Vol. 5, pp. 309-322, 1999b.
Nordvik, A.B., S.L. Sloan, J. Stahovec, K. Bitting, and D.F. Pol, “Phase 3: Oil Containment Boomat Sea Performance Tests”, MSRC Technical Report Series 95-003, Marine Spill ResponseCorporation, Washington, DC, 86 p, 1995a.
Nordvik, A., K. Bitting, P. Hankins, L. Hannon, and R. Urban, “Full Scale Oil Containment BoomTesting at Sea”, in Proceedings of the 1995 International Oil Spill Conference, AmericanPetroleum Institute, Washington, DC, 1995b.
Nordvik, A.B., M.A. Champ, and K.R. Bitting, “Review of the Processes for Estimating TimeWindows for In-Situ Burning of Spilled Oil at Sea”, in Oil Spills First Principles: Prevention and

84
Best Response, B.E. Ornitz and M.A. Champ (eds.), Elsevier Publishing, Amsterdam, Holland,Appendix V., pp. 573-601, 2002.
Nordvik, A.B., M.A. Champ, and K.R. Bitting, “Estimating Time Windows for Burning Oil at Sea:Processes and Factors”, Spill Science & Technology Bulletin, Vol. 6, pp. 347-3359, 2003.
O’Brien, M.L., “At-Sea Recovery of Heavy Oils - A Reasonable Response Strategy?”, inProceedings of the Third Research and Development Forum on High-Density Oil Spill Response,International Maritime Organization, London, UK, 2002.
Oebius, H.U., “Physical Properties and Process that Influence the Cleanup of Oil Spills in theMarine Environment”, Spill Science & Technology Bulletin, Vol. 5, pp. 177-289, 1999.
Ouwerkerk, M.R., P.R.H. Verbeek, and T. Schut, “A New Tool for Large-Scale Oil Combat”, inProceedings of the 1995 International Oil Spill Conference, American Petroleum Institute,Washington, DC, 1995.
Payne, J.R., J.R., Clayton, G.D. McNabb, and B.E. Kirstein, “Exxon Valdez Oil Weathering Fateand Behaviour: Model Predictions and Field Observations”, in Proceedings of the 1991International Oil Spill Conference, American Petroleum Institute, Washington, DC, pp. 641-654,1991a.
Payne, J.R., J.R., Clayton, C.R. Phillips, J.U. Robinson, D. Kennedy, J. Talbot, G. Petrae,J. Michel, T. Ballou, and S. Onstad, “Dispersant Trials Using the Pac Baroness, A Spill ofOpportunity”, in Proceedings of the 1991 International Oil Spill Conference, American PetroleumInstitute, Washington, DC, pp. 427-433, 1991b.
Payne, J.R., T.J. Reilly, R.J. Martrano, G.P. Lindblom, M.C. Kennicutt, and J.M. Brooks, “Spill-of-Opportunity Testing of Dispersant Effectiveness at the Mega Borg Oil Spill”, in Proceedings ofthe 1993 International Oil Spill Conference, American Petroleum Institute, Washington, DC, pp. 791-793,1993.
Pearson, L.A., “Opinions on the Use of Oil Spill Response Methods in Prince William Sound andCook Inlet, Alaska”, in Proceedings of the Twenty-third Arctic and Marine Oil Spill ProgramTechnical Seminar, Environment Canada, Ottawa, ON, pp. 191-202, 2000.
Peigne, G., “Ecumoire II: Evaluation of Three Oil Recovery Devices Offshore”, in Proceedings ofthe 1985 International Oil Spill Conference, American Petroleum Institute, Washington, DC, pp. 13-18, 1985.
Pope, P., A. Allen, and W.G. Nelson, “Assessment of Three Surface Collecting Agents duringTemperature and Arctic Conditions”, in Proceedings of the 1985 International Oil SpillConference, American Petroleum Institute, Washington, DC, 1985.

85
Potter, S., J. McCourt, and R. Smith, “Estimation of Towing Forces on Oil Spill ContainmentBooms”, in Proceedings of the Twenty-second Arctic and Marine Oil Spill Program TechnicalSeminar, Environment Canada, Ottawa, ON, pp. 825-832, 1999.
Provant, S.G., “Assessment of the Transrec-350 Mechanical Recovery Capacity of the Oil SpillResponse Equipment in Prince William Sound”, in Proceedings of the Fifteenth Arctic and MarineOil Spill Program Technical Seminar, Environment Canada, Ottawa, ON, pp. 219-237, 1992.
Reed, M., O.M. Aamo, and P. Daling, “Quantiative Analysis of Alternate Oil Spill StrategiesUsing OSCAR”, Spill Science & Technology Bulletin, Vol. 2, pp. 67-94, 1995a.
Reed, M., O.M. Aamo, and P.S. Daling , “OSCAR, A Model System for Quantitative Analysis ofAlternate Oil Spill Response Strategies”, in Proceedings of the Eighteenth Arctic and Marine OilSpill Program Technical Seminar, Environment Canada, Ottawa, ON, pp. 815-835, 1995b.
Reed, M., C. Turner, and A. Odulo, “The Role of Wind and Emulsification in Modelling Oil Spilland Surface Drifter Trajectories”, Spill Science & Technology Bulletin, Vol. 2, pp. 143-157, 1995c.
Salt, D., “Aerial Dispersant Spraying: A Daylight-Only Tool?”, in Proceedings of the 2001International Oil Spill Conference, American Petroleum Institute, Washington, DC, pp. 1223-1225, 2001.
Scholz, D.K., J.H. Kucklick, R. Pond, A.H. Walker, A. Bostrom, and P. Fischbeck, A Decision-Maker’s Guide to Dispersants: A Review of the Theory and Operational Requirements, AmericanPetroleum Institute, Publication Number 4692, Washington, DC, 1999.
Schulze, R. Oil Spill Response Performance Review of Skimmers, ASTM Manual Series, ASTM,West Conshohocken, PA, 1998.
Schulze, R., Oil Spill Response Performance Review of Booms, MMS Internal Report,Washington, DC, 2003.
Schulze, R. and J. Lane, “A Performance Review of Oil Spill Containment Booms”, inProceedings of the Twenty-fourth Arctic and Marine Oil Spill Program Technical Seminar,Environment Canada, Ottawa, ON, pp. 285-293, 2001.
Schulze, R. and S. Potter, “Estimating Forces on Oil Spill Containment Booms”, Spill TechnologyNewsletter, Vol. 27, pp. 1-10, 2002.
Schwartz, S.H., “Performance Tests of Four Selected Oil Spill Skimmers”, in Proceedings of the1979 International Oil Spill Conference, American Petroleum Institute, Washington, DC, pp. 493-496, 1979.
Sebastiao, P. and C.G. Soares, “Modeling the Fate of Oil Spills at Sea”, Spill Science &Technology Bulletin, Vol. 2, pp. 121-131, 1995.

86
Shonting, D., A. Petrillo, and P. Temple, “Wind Wave and Turbulence Observations Related to OilMixing Parameters”, in Proceedings of the Workshop on the Physical Behaviour of Oil in theMarine Environment, Princeton University, Princeton, NJ, pp. 6.63-6.88, 1979.
Shum, J.S. and M. Borst, “OHMSETT Tests of a Rope-Mop Skimmer in Ice-Infested Waters”, inProceedings of the 1985 International Oil Spill Conference, American Petroleum Institute,Washington, DC, pp. 31-33, 1985.
Simecek-Beatty, D. and D. Timmons, “The Use of Real-Time Water Level Measurements inEmergency Operations”, in Proceedings of the Eighteenth Arctic and Marine Oil Spill ProgramTechnical Seminar, Environment Canada, Ottawa, ON, pp. 287-295, 1995.
Simecek-Beatty, D. and W.J. Lehr, “NOAA-MMS Joint Langmuir Circulation and Oil SpillTrajectory Models Workshop”, in Proceedings of the Twenty-third Arctic and Marine Oil SpillProgram Technical Seminar, Environment Canada, Ottawa, ON, pp. 601-610, 2000.
Simecek-Beatty, D., C. O’Connor, and W.J. Lehr, “3-D Modeling of Chemically Dispersed Oil”, inProceedings of the Twenty-fifth Arctic and Marine Oil Spill Program Technical Seminar,Environment Canada, Ottawa, ON, pp. 1149-1159, 2002.
Sloan, S.L., K.R. Bitting, and A.B. Nordvik, Phase 1: Oil Containment Boom at Sea PerformanceTests, MSRC Technical Report Series 94-007, Marine Spill Response Corporation, Washington,DC, 85 p., 1994.
Smedley, J.B., “Assessment of Aerial Application of Oil Spill Dispersants”, in Proceedings of the1981 International Oil Spill Conference, American Petroleum Institute, Washington, DC, pp. 253-257, 1981.
Smith, G.F. and H.W. Lichte, Summary of U.S. Environmental Protection Agency’s OHMSETTTesting, 1974-1979, EPA report number EPA-600/9-81-007, Cincinnati, OH, 1981.
Smith, J.B.H., C. McLellan, and L.R. Pintler, “Development of an Oil Skimming System to MeetNavy Specifications”, in Proceedings of the 1989 International Oil Spill Conference, AmericanPetroleum Institute, Washington, DC, pp. 91-94, 1989.
Steen, A. W. Konkel, W. Lerch, D. Lessard, and J. Clark, “Realities of Physical Encounter Ratesfor Mechanical Response at Sea”, in Proceedings of the Third Research and Development Forumon High-Density Oil Spill Response, International Maritime Organization, London, UK, 2002.
Suzuki, I., Y. Tsukino, and M. Yanagisawa, “Simulation Tests of Portable Oil Booms in BrokenIce”, in Proceedings of the 1985 International Oil Spill Conference, American Petroleum Institute,Washington, DC, pp. 25-30, 1985.
Suzuki, I., R. Tasaki, K. Miki, E. Kajita, and T. Yagi, “Oil Layer Flow Around SkimmingVessels”, in Proceedings of the 1989 International Oil Spill Conference, American PetroleumInstitute, Washington, DC, pp. 167-173, 1989.

87
Swift, M.R., J. Belanger, B. Celikkol, R.R. Steen, and D. Michelin, “Observations of ConventionalOil Boom Failure” in Proceedings of the Twenty-third Arctic and Marine Oil Spill ProgramTechnical Seminar, Environment Canada, Ottawa, ON, pp. 481-482, 2000a.
Swift, M.R., B. Celikkol, R.R. Steen, W. DiProfio, and S.E. Root, “A Flexible Submergence PlaneBarrier for Fast Current Applications”, in Proceedings of the Twenty-third Arctic and Marine OilSpill Program Technical Seminar, Environment Canada, Ottawa, ON, pp. 401-414, 2000b.
Tedeschi, E., “Booms”, in Pure and Applied Chemistry, Vol. 71, pp 17-25, 1999.
Thalich, P and C. Xizobo, “Accurate Simulation of Oil Slicks”, in Proceedings of the 2001International Oil Spill Conference, American Petroleum Institute, Washington, DC, pp. 1133-1137, 2001.
Thomas, D. and T. Lunel, “The Braer Incident: Dispersion in Action”, in Proceedings of theSixteenth Arctic and Marine Oil Spill Program Technical Seminar, Environment Canada, Ottawa,ON, pp. 843-859, 1993.
Thornborough, J., “United Kingdom In-Situ Burn Trials, Lowenstoft, 1996”, in Proceedings of the1997 International Oil Spill Conference, American Petroleum Institute, Washington, DC, pp. 131-136, 1997.
Thorpe, S.A., “Langmuir Circulation and the Dispersion of Oil Spills in Shallow Seas”, SpillScience & Technology Bulletin, Vol. 6, pp. 213-223, 2000.
Trudel, K., S. Ross, R. Belore, S. Buffington, and G. Rainey, “Technical Assessment of the Use ofDispersants on Spills from Drilling and Production Facilities in the Gulf of Mexico OuterContinental Shelf”, in Proceedings of the Twenty-fourth Arctic and Marine Oil Spill ProgramTechnical Seminar, Environment Canada, Ottawa, ON, pp. 531-549, 2001.
Trudel, K., S. Ross, R. Belore, S. Buffington, G. Rainey, C. Ogawa, and D. Panzer, “TechnicalAssessment of Using Dispersants on Marine Oil Spills in the U.S. Gulf of Mexico and California”,in Proceedings of the 2003 International Oil Spill Conference, American Petroleum Institute,Washington, DC, pp. 1-8, 2003.
Tsang, G. and N. Vanderkooy, “Development of a Novel Ice Oil Boom for Flowing Waters”, inProceedings of the 1979 International Oil Spill Conference, American Petroleum Institute,Washington, DC, pp. 377-385, 1979.
Ueda, K., H. Yamanouchi, and K. Hikida, “Recovery of Spilled Oil in Waves”, in Proceedings ofthe Twenty-fourth Arctic and Marine Oil Spill Program Technical Seminar, Environment Canada,Ottawa, ON, pp. 275-283, 2001.
Van Dyck, Improving the Performance of Oil Spill Containment Booms in Waves: Part I -Literature Review, Part II - Physical Model Study: Procedure and Results, Report Number SIT-DL-94-9-2-2700, Stevens Institute of Technology, Hoboken NJ, 20 p., 1994.
88
Van Dyck, R.L. and M.S. Bruno, “Effect of Waves on Containment Boom Response”, inProceedings of the 1995 International Oil Spill Conference, American Petroleum Institute,Washington, DC, 1995.
Watkins, R.L., “The Effectiveness of Oil Spill Recovery Systems”, in Proceedings of the 1995International Oil Spill Conference, American Petroleum Institute, Washington, DC, 1995.
Webb, R., “Sea-Ice Over-Flooding: A Challenge to Oil Spill Countermeasures Planners in theOuter Mackenzie Delta, N.W.T.”, in Proceedings of the Eighteenth Arctic and Marine Oil SpillProgram Technical Seminar, Environment Canada, Ottawa, ON, pp. 671-677, 1995.
Wicks, M., “Fluid Dynamics of Floating Oil Containment by Mechanical Barriers in the Presenceof Water Currents”, in Proceedings of the 1969 International Oil Spill Conference, AmericanPetroleum Institute, Washington, DC, pp. 55-101, 1969.
Widawsky, A., “Development of Harbor Oil Spill Removal-Recovery Systems: Phase I”, inProceedings of the 1975 International Oil Spill Conference, American Petroleum Institute,Washington, DC, pp. 379-386, 1975.
Williams, R.E. and T.S. Cooke, “Feasibility of Using a Bubble Barrier for theContainment/Incineration of Spilled Oil”, in Proceedings of the Eighth Arctic and Marine Oil SpillProgram Technical Seminar, Environment Canada, Ottawa, ON, pp. 212-227, 1985.
Wilson, H.B., “Development and Testing of a Weir Boom for Oil Recovery at Sea”, inProceedings of the 1981 International Oil Spill Conference, American Petroleum Institute,Washington, DC, pp. 643-648, 1981.
Wong, K.-F., and M. Witmer, “Flow Around an Oil Boom System”, in Proceedings of theEighteenth Arctic and Marine Oil Spill Program Technical Seminar, Environment Canada,Ottawa, ON, pp. 671-677, 1995.
Wooten, D.C., “Mechanical Control of Oil Spills Utilizing a Streamlined Boom”, in Proceedingsof the 1973 International Oil Spill Conference, American Petroleum Institute, Washington, DC, pp. 383-389, 1973.
Yazaki, A., “Research and Development in the Institute of Ocean Environmental Technology”, inProceedings of the 1983 International Oil Spill Conference, American Petroleum Institute,Washington, DC, pp. 95-103, 1983.
Youssef, M. and M.L. Spaulding, “Drift Current Under the Combined Action of Wind and Wavesin Shallow Water”, in Proceedings of the Seventeenth Arctic and Marine Oil Spill ProgramTechnical Seminar, Environment Canada, Ottawa, ON, pp. 767-783, 1994.

89
Zhang, Z., C.F. An, R.M. Brown, H.M Brown, and R.H. Goodman, “Numerical Study on (Porous)Net Boom Systems - Front Net Inclined Angle Effect”, in Proceedings of the Twenty-second Arcticand Marine Oil Spill Program Technical Seminar, Environment Canada, Ottawa, ON, pp. 903-919, 1999.
Zhu, S-P. and D. Strunin, “A Numerical Model for the Confinement of Oil Spill with Floating OilBooms”, Spill Science & Technology Bulletin, Vol. 7, pp. 249-255, 2002.