weather extremes and climate change - cawcr · extreme hot weather figure 1: the effects of changes...
TRANSCRIPT

AustralianClimateChange
ScienceProgramme
Weather extremes and climate changeThe science behind the attribution of climatic events
Julie Arblaster, Imogen Jubb, Karl Braganza, Lisa Alexander, David Karoly and Robert Colman
Department of the Environment
The Australian Climate Change Science Programme – An Australian Government Initiative

At a glanceExtreme weather and climate •events have serious impacts on our economy society and environment.
Climate change most clearly •influences the frequency of extreme events, such as more frequent fire weather, more frequent and longer heatwaves, and more frequent extreme rainfall.
Climate change also influences •the severity of individual extreme events.
Some changes to extreme events •have already been observed in Australia—notably an increase in fire weather, record-breaking temperatures and heatwaves.
Understanding what causes •individual extreme events is difficult, and is a field of active research. Improved understanding of the causes of extreme weather events helps to plan for future impacts in Australia.
Events relating to warm •temperatures, such as the severity of individual heatwaves, are more easily attributed to recent climate change than rainfall events.
The Australian Climate Change •Science Programme, which involves researchers from CSIRO and the Bureau of Meteorology in collaboration with universities, provides information on the causes, nature, timing and consequences of climate change.
EXTREME WEATHER AND CLIMATE EVENTS
Extreme weather and climate events often have a serious impact on our economy environment and society, and can cause loss of life, property and livelihoods. Researching extremes and understanding their causes is crucial for increasing our ability to help manage and predict their impacts.1
Extreme weather events are, by definition, events that are rare at a particular place and time of year. What is considered rare will vary from place to place. For example, an average daily temperature in Alice Springs in the middle of summer would be considered an extreme summer’s day in Hobart. Similarly, the impact of certain extreme events will also vary with location. While extreme events can be defined for any climate variable, reliable Australian weather observations go back only 100 years or so, limiting our ability to examine changes to some types of extremes.2,3
Extremes can be characterised by the severity, duration and spatial extent of the event. Extreme weather that persists for some time, such as a season is often called an extreme climate event.
Examples of recent extreme eventsFrom 27 January to 8 February 2009, a severe and prolonged heatwave •(12–15 °C above the seasonal average of 28–32 °C) resulted in 374 more deaths in Victoria than would normally be expected during this time.4
Black Saturday bushfires on 7 February 2009 ravaged Victoria, causing the •loss of 173 lives, destroying more than 2000 homes and burning more than 430,000 hectares of land. These impacts cost about $4.4 billion and were more severe than any previous fire event in the recorded history of Australia.5
Heavy rainfall in Queensland in 2010–11 resulted in extensive flooding, •impacting more than 78% of the state and over 2.5 million people, and leading to the loss of 33 lives. Around 29,000 homes and businesses suffered some form of inundation with a cost in excess of $5 billion.6
Tropical cyclone • Yasi made landfall on Mission Beach in Queensland on 3 February 2011 and was one of the most powerful cyclones (rated category 5 with wind speeds of up to 205 km per hour, gusts up to 285 km per hour, and a 5 m tidal surge) to be recorded since 1918.
Australian maximum temperature (averaged over the whole country) reached •40.3 °C on 7 January 2013, setting a new record. This was the hottest day of a national heatwave that was significant for its coverage across the continent.
The January 2013 national heatwave was also exceptional in duration, •spanning more than two weeks. It was the warmest such period on record and included a sequence of seven days where the Australian average temperature exceeded 39 °C. The previous record sequence for national temperatures above 39 °C was four days, and had only occurred once before, in 1972. This heatwave contributed to January being Australia’s hottest month on record and December 2012 to February 2013 being the hottest summer on record.
A significant multi-day heatwave affected south-east Australia in January •2014. Victoria recorded its hottest four-day period on record and Adelaide had a record five consecutive days over 42 °C. The extreme heat experienced in Melbourne between 14 and 17 January 2014 is estimated to have cost businesses approximately $37 million in lost revenue.7
page 1
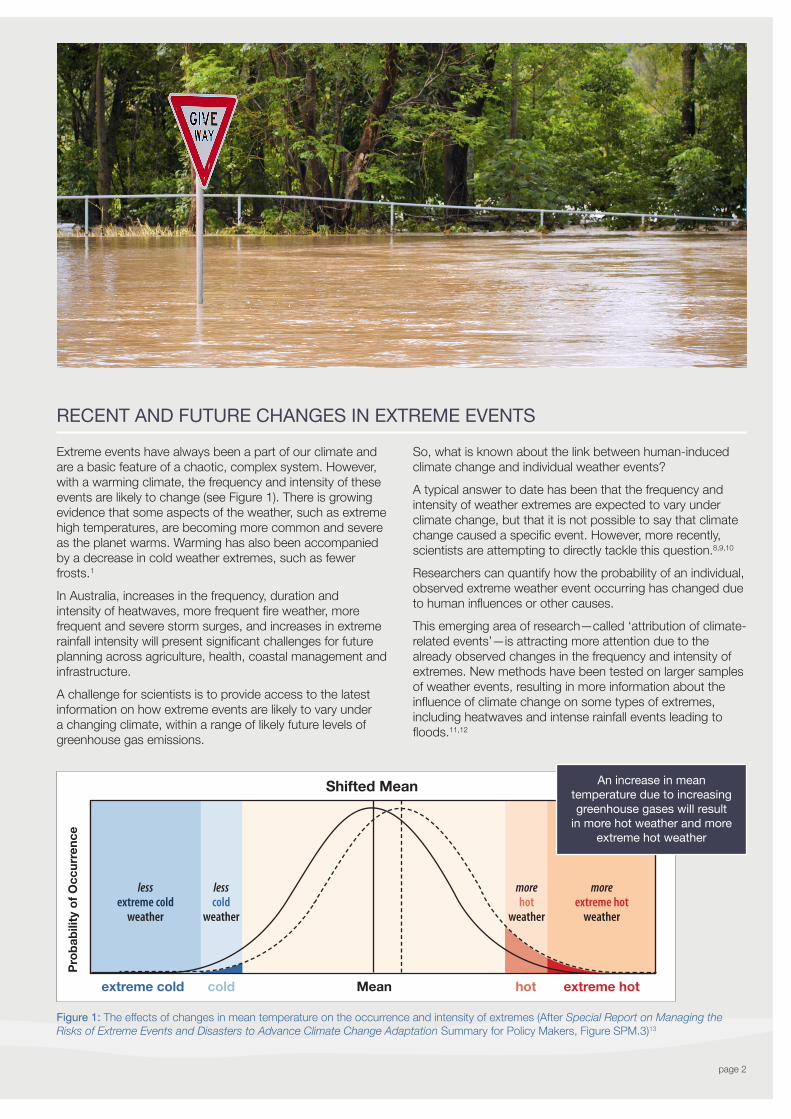
Extreme events have always been a part of our climate and are a basic feature of a chaotic, complex system. However, with a warming climate, the frequency and intensity of these events are likely to change (see Figure 1). There is growing evidence that some aspects of the weather, such as extreme high temperatures, are becoming more common and severe as the planet warms. Warming has also been accompanied by a decrease in cold weather extremes, such as fewer frosts.1
In Australia, increases in the frequency, duration and intensity of heatwaves, more frequent fire weather, more frequent and severe storm surges, and increases in extreme rainfall intensity will present significant challenges for future planning across agriculture, health, coastal management and infrastructure.
A challenge for scientists is to provide access to the latest information on how extreme events are likely to vary under a changing climate, within a range of likely future levels of greenhouse gas emissions.
So, what is known about the link between human-induced climate change and individual weather events?
A typical answer to date has been that the frequency and intensity of weather extremes are expected to vary under climate change, but that it is not possible to say that climate change caused a specific event. However, more recently, scientists are attempting to directly tackle this question.8,9,10
Researchers can quantify how the probability of an individual, observed extreme weather event occurring has changed due to human influences or other causes.
This emerging area of research—called ‘attribution of climate-related events’—is attracting more attention due to the already observed changes in the frequency and intensity of extremes. New methods have been tested on larger samples of weather events, resulting in more information about the influence of climate change on some types of extremes, including heatwaves and intense rainfall events leading to floods.11,12
page 2
RECENT AND fuTuRE CHANGES IN EXTREME EVENTS
extreme cold cold Mean hot extreme hot
Shifted Mean
Prob
abili
ty o
f Occ
urre
nce
less extreme cold
weather
less cold
weather
more hot
weather
more extreme hot
weather
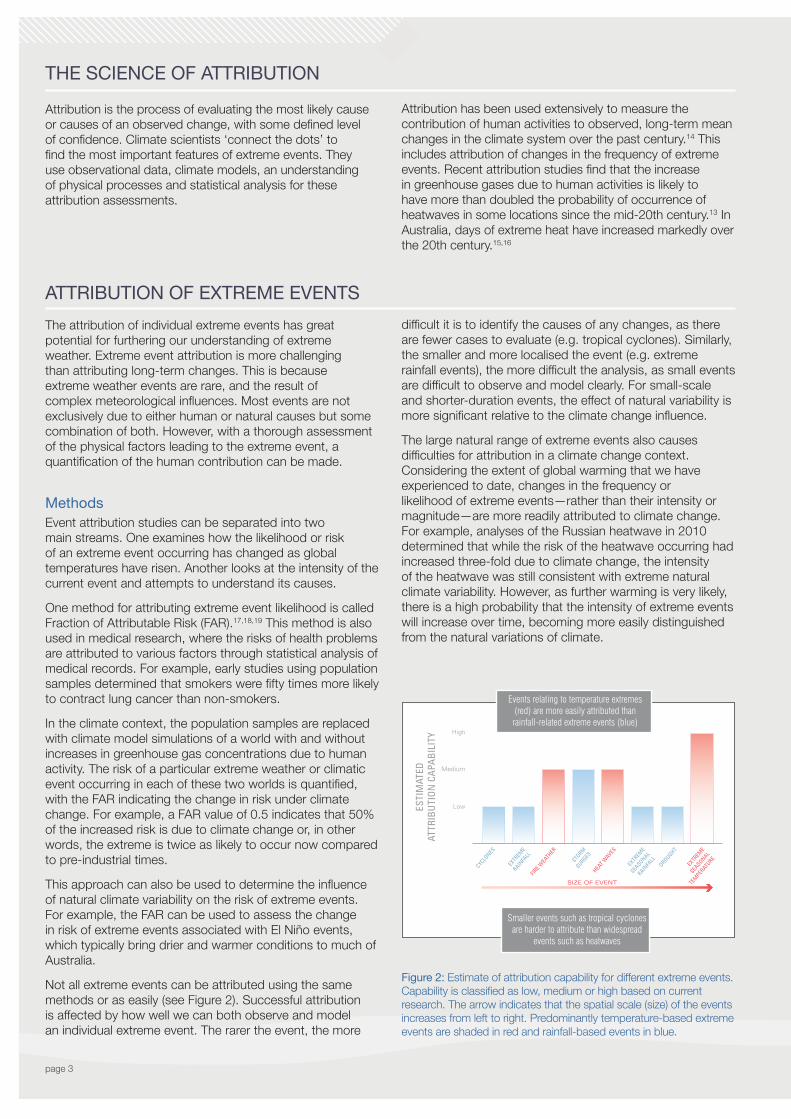
An increase in mean temperature due to increasing greenhouse gases will result
in more hot weather and more extreme hot weather
figure 1: The effects of changes in mean temperature on the occurrence and intensity of extremes (After Special Report on Managing the Risks of Extreme Events and Disasters to Advance Climate Change Adaptation Summary for Policy Makers, Figure SPM.3)13
ATTRIbuTIoN of EXTREME EVENTS The attribution of individual extreme events has great potential for furthering our understanding of extreme weather. Extreme event attribution is more challenging than attributing long-term changes. This is because extreme weather events are rare, and the result of complex meteorological influences. Most events are not exclusively due to either human or natural causes but some combination of both. However, with a thorough assessment of the physical factors leading to the extreme event, a quantification of the human contribution can be made.
MethodsEvent attribution studies can be separated into two main streams. One examines how the likelihood or risk of an extreme event occurring has changed as global temperatures have risen. Another looks at the intensity of the current event and attempts to understand its causes.
One method for attributing extreme event likelihood is called Fraction of Attributable Risk (FAR).17,18,19 This method is also used in medical research, where the risks of health problems are attributed to various factors through statistical analysis of medical records. For example, early studies using population samples determined that smokers were fifty times more likely to contract lung cancer than non-smokers.
In the climate context, the population samples are replaced with climate model simulations of a world with and without increases in greenhouse gas concentrations due to human activity. The risk of a particular extreme weather or climatic event occurring in each of these two worlds is quantified, with the FAR indicating the change in risk under climate change. For example, a FAR value of 0.5 indicates that 50% of the increased risk is due to climate change or, in other words, the extreme is twice as likely to occur now compared to pre-industrial times.
This approach can also be used to determine the influence of natural climate variability on the risk of extreme events. For example, the FAR can be used to assess the change in risk of extreme events associated with El Niño events, which typically bring drier and warmer conditions to much of Australia.
Not all extreme events can be attributed using the same methods or as easily (see Figure 2). Successful attribution is affected by how well we can both observe and model an individual extreme event. The rarer the event, the more
difficult it is to identify the causes of any changes, as there are fewer cases to evaluate (e.g. tropical cyclones). Similarly, the smaller and more localised the event (e.g. extreme rainfall events), the more difficult the analysis, as small events are difficult to observe and model clearly. For small-scale and shorter-duration events, the effect of natural variability is more significant relative to the climate change influence.
The large natural range of extreme events also causes difficulties for attribution in a climate change context. Considering the extent of global warming that we have experienced to date, changes in the frequency or likelihood of extreme events—rather than their intensity or magnitude—are more readily attributed to climate change. For example, analyses of the Russian heatwave in 2010 determined that while the risk of the heatwave occurring had increased three-fold due to climate change, the intensity of the heatwave was still consistent with extreme natural climate variability. However, as further warming is very likely, there is a high probability that the intensity of extreme events will increase over time, becoming more easily distinguished from the natural variations of climate.
page 3
figure 2: Estimate of attribution capability for different extreme events. Capability is classified as low, medium or high based on current research. The arrow indicates that the spatial scale (size) of the events increases from left to right. Predominantly temperature-based extreme events are shaded in red and rainfall-based events in blue.
THE SCIENCE of ATTRIbuTIoN
Attribution is the process of evaluating the most likely cause or causes of an observed change, with some defined level of confidence. Climate scientists ‘connect the dots’ to find the most important features of extreme events. They use observational data, climate models, an understanding of physical processes and statistical analysis for these attribution assessments.
Attribution has been used extensively to measure the contribution of human activities to observed, long-term mean changes in the climate system over the past century.14 This includes attribution of changes in the frequency of extreme events. Recent attribution studies find that the increase in greenhouse gases due to human activities is likely to have more than doubled the probability of occurrence of heatwaves in some locations since the mid-20th century.13 In Australia, days of extreme heat have increased markedly over the 20th century.15,16
High
Medium
Low
CYCLONES
EXTREME
RAINFA
LLFIR
E WEATHER
STORMSURGES
HEAT WAVES
EXTREME
SEASONALRAIN
FALL
DROUGHT
EXTREME
SEASONAL
TEMPERATURE
ESTI
MAT
EDAT
TRIB
UTI
ON
CA
PAB
ILIT
Y
SIZE OF EVENT
Events relating to temperature extremes (red) are more easily attributed than rainfall-related extreme events (blue)
Smaller events such as tropical cyclones are harder to attribute than widespread
events such as heatwaves

WHAT CAN WE NoW SAy AbouT THE LINk bETWEEN CLIMATE CHANGE AND EXTREME EVENTS?
page 4
The Australian Climate Change Science Programme has been investigating extreme events to improve understanding of their nature and consequences. Collectively, scientists at the Bureau of Meteorology, CSIRO and Australian universities, including the ARC Centre of Excellence for Climate System Science, are examining changes in, and the causes of, individual extreme events in Australia and other parts of the world. Reflecting the increased interest in extreme weather attribution, the Bulletin of the American Meteorological Society now publishes an annual collection of research articles explaining the significant extremes of the previous year.11,12,20
TemperatureAn increasing number of studies have attributed periods of extreme heat around the world to increasing greenhouse gases. Studies on the European heatwave of 20038, the Russian heatwave of 201021,22,23 and record temperatures in the USA during 201124,25 demonstrate a much higher risk of such temperatures occurring due to human-induced warming. In Australia, the record hot summer of 2012–13 was examined using the FAR method. The odds of this event occurring were found to have increased five-fold due to human influences.26 2013 also saw record-breaking September and spring temperatures and was the warmest calendar year on record. Using the FAR method, it was found to be virtually impossible to achieve the 2013 calendar year
Australian-average temperatures without the presence of human influences on the climate.27 Additional studies, using various methods, also found that human influences have increased the likelihood and strength of the Australian heat events in 2013.15,28,29,30
RainfallRainfall extremes are harder to attribute than temperature extremes due to the relatively small scale of the events and the large range of natural variability (see Figure 2). A number of attribution studies investigated the cause of the heavy rainfall events in eastern Australia from 2010–11 through various methods.31,32,33,34
Australia experienced its wettest spring on record in 2010 leading to extensive flooding in eastern Australia the following summer. The spring and summer of the following year (2011–12) also had above-normal rainfall. These exceptionally wet periods coincided with two consecutive La Niña phases of the El Niño-Southern Oscillation (ENSO), which are typically associated with cool, wet summers in eastern Australia.
The October 2011–March 2012 extreme rainfall over south-east Australia was studied using various attribution methods in separate studies. These found that the record rainfall was most likely attributable to natural variability associated with La Niña32, with a small contribution from human influences on the climate system.33,34

page 5
HoW CAN WE uSE THIS INfoRMATIoN?An understanding of how climate change may have influenced extreme or severe weather has the potential to help planners provide for a variety of adaptation activities throughout Australia, and across sectors including local government, emergency services, tourism, finance and infrastructure. Such research could also lead to increased skill in the prediction of extreme events for improved prevention, preparedness, response and recovery.
The attribution of climate-related events is a rapidly evolving area of research and new methods and applications continue to be developed. As this research grows, so too will our understanding of the capability of, and challenges involved in, event attribution for our region.
WHAT DoES THIS MEAN foR fuTuRE EVENTS?Climate model projections indicate an additional warming of between 1 and 5°C for Australia by the end of this century, depending on the emissions scenario.11,31 As a result, high temperature extremes will increase in frequency, duration and intensity in the future.
The projections also show that the record heat observed during 2013 is likely to become the norm by the mid-21st century, following a mid-range greenhouse gas emissions
scenario. For rainfall extremes, projections for 2100 show longer dry spells interspersed with periods of increased extreme rainfall over much of Australia. Extreme fire weather will become more frequent and intense in the south and east, with a shorter period for controlled fuel-reduction burning. Droughts will be more frequent in the south. Tropical cyclones will occur less often but with a greater proportion of high intensity storms.31

IPCC, 2012, 1. Managing the Risks of Extreme Events and Disasters to Advance Climate Change Adaptation. A Special Report of Working Groups I and II of the Intergovernmental Panel on Climate Change [Field, C.B., V. Barros, T.F. Stocker, D. Qin, D.J. Dokken, K.L. Ebi, M.D. Mastrandrea, K.J. Mach, G.-K. Plattner, S.K. Allen, M. Tignor, and P.M. Midgley (eds.)]. Cambridge University Press, Cambridge, UK, and New York, NY, USA, 582 pp.http://www.bom.gov.au/climate/change/acorn-sat2. Jones, D.A., W. Wang and R. Fawcett, 2009, High-quality spatial 3. climate data-sets for Australia, Australian Meteorological and Oceanographic Journal, 58, 233–248Victorian Department of Human Services, 2009, 4. January 2009 heatwave in Victoria: an assessment of health impacts, Victorian Government Department of Human Services Melbourne, Victoria, 16 pp.Victorian Bushfires Royal Commission, 2010, Final Report, Volume 5. 1. Government Printer for the State of Victoria, Melbourne, 361 pp. Available at http://www.royalcommission.vic.gov.auQueensland Floods Commission of Inquiry, 2011, Interim Report, 6. 262 pp. Available at http://www.floodcommission.qld.gov.au/publications/interim-report/Sweeney Research, 2014, 2014 7. Heatwave Business Impacts - Social Research. Report for the City of Melbourne, available at http://www.melbourne.vic.gov.au/AboutCouncil/MediaReleases/Pages/Citycombattingheatwavestoprotecteconomy.aspx Stott, P.A., D.A. Stone and M.R. Allen, 2004, Human contribution to 8. the European heatwave of 2003, Nature, 432, 610–614WCRP Grand Challenges white paper on the ‘Science underpinning 9. the prediction and attribution of extreme events’. First draft available from http://www.wcrp-climate.org/documents/GC_Extremes.pdfStott, P.A. 10. et al., 2013, Attribution of weather and climate-related events. In: Climate Science for Serving Society: Research, Modelling and Prediction Priorities [G.R. Asrar and J. W. Hurrell (eds.)]. Springer Science+Business Media, Dordrecht, Netherlands, 477 pp. Available at http://www.wcrp-climate.org/conference2011/documents/Stott.pdfPeterson, T.C., P.A. Stott and S. Herring, 2012, Explaining extreme 11. events of 2011 from a climate perspective, Bulletin of the American Meteorological Society, 94 (9), 1041–1067Peterson, T.C., M.P. Hoerling, P.A. Stott and S. Herring (eds.), 2013, 12. Explaining extreme events of 2012 from a climate perspective, Bulletin of the American Meteorological Society, 94 (9), S1–S74IPCC, 2012, Summary for Policymakers. In: 13. Managing the Risks of Extreme Events and Disasters to Advance Climate Change Adaptation [Field, C.B., V. Barros, T.F. Stocker, D. Qin, D.J. Dokken, K.L. Ebi, M.D. Mastrandrea, K.J. Mach, G.-K. Plattner, S.K. Allen, M. Tignor, and P.M. Midgley (eds.)]. A Special Report of Working Groups I and II of the Intergovernmental Panel on Climate Change. Cambridge University Press, Cambridge, UK, and New York, NY, USA, pp. 3–21IPCC, 2013, Summary for Policymakers. In: 14. Climate Change 2013: The Physical Science Basis. Contribution of Working Group I to the Fifth Assessment Report of the Intergovernmental Panel on Climate Change [Stocker, T.F., D. Qin, G.-K. Plattner, M. Tignor, S.K. Allen, J. Boschung, A. Nauels, Y. Xia, V. Bex and P.M. Midgely (eds.)]. Cambridge University Press, Cambridge, UK and New York, NY, USAPerkins, S.E., S.C. Lewis, A.D. King and L.V. Alexander, 2014, 15. Anthropogenic activity increased risk in Australian heatwave frequency and intensity during 2012–2013 [in ‘Explaining Extreme Events of 2013 from a Climate Perspective’], Bulletin of the American Meteorological Society, 95 (9), S34–S37Bureau of Meteorology and CSIRO, 2014, 16. State of the Climate 2014. Available at http://www.bom.gov.au/state-of-the-climate/Allen, M., 2003, Liability of climate change, 17. Nature, 421, 891–892Stone, D.A. and M.R. Allen, 2005, The end-to-end attribution 18. problem: From emissions to impacts, Climate Change, 71, 303–318
Christidis, N., P.A. Stott, A.A. Scaife, A. Arribas, G.S. Jones, D. 19. Copsey, J.R. Knight, W.J. Tennant, 2013, A New HadGEM3-A-Based System for Attribution of Weather- and Climate-Related Extreme Events. Journal of Climate, 26, 2756–2783, doi:10.1175/JCLI-D-12-00169.1Herring, S.C., M.P. Hoerling, T.C. Peterson and P.A. Stott, 2014, 20. Explaining extreme events of 2013 from a climate perspective, Bulletin of the American Meteorological Society, 95 (9), S1–S96Dole, R. 21. et al., 2011, Was there a basis for anticipating the 2010 Russian heat wave? Geophysical Research Letters, 38, L06702Otto, F.E.L., N. Massey, G.J. van Oldenborgh, R.G. Jones and M.R. 22. Allen, 2012, Reconciling two approaches to attribution of the 2010 Russian heatwave. Geophysical Research Letters, 39, L04702Rahmstorf, S. and D. Coumou, 2011, Increase of extreme events in 23. a warming world, Proceedings of the National Academy of Sciences USA, 108, 17905–17909Hansen, J., M. Sato and R. Ruedy, 2012, Perception of climate 24. change, Proceedings of the National Academy of Sciences, 109, 14726–14727, E2415–E2423, doi:10.1073/pnas.1205276109Hoerling, M. 25. et al., 2013, Anatomy of an extreme event. Journal of Climate, 26, 2811–2832Lewis, S.C. and D.J. Karoly, 2013, Anthropogenic contributions 26. to Australia’s record summer temperatures of 2013, Geophysical Research Letters, 40, 3705–3709, doi:10.1002/grl.50673Lewis, S.C. and D.J. Karoly, 2014, The role of anthropogenic forcing 27. in the record 2013 Australia-wide annual and spring temperatures [in ‘Explaining Extreme Events of 2013 from a Climate Perspective’], Bulletin of the American Meteorological Society, 95 (9), S31–S34Arblaster, J.M., E.-P. Lim, H.H. Hendon, B.C. Trewin, G. Luo, K. 28. Braganza, 2014, Understanding Australia’s record September heat [in ‘Explaining Extreme Events of 2013 from a Climate Perspective’], Bulletin of the American Meteorological Society, 95 (9), S37–S41Knutson, T.R., F. Zeng and A. Wittenberg, 2014, Multimodel 29. assessment of extreme annual-mean warm anomalies during 2013 over regions of Australia and the western tropical Pacific [in ‘Explaining Extreme Events of 2013 from a Climate Perspective’], Bulletin of the American Meteorological Society, 95 (9), S26–S30King, A.D., D.J. Karoly, M.G. Donat and L.V. Alexander, 2014, 30. Climate change turns Australia’s 2013 Big Dry into a year of record-breaking heat [in ‘Explaining Extreme Events of 2013 from a Climate Perspective’], Bulletin of the American Meteorological Society, 95 (9), S41–S45Evans J.P. and I. Boyer-Souchet, 2012, Local sea surface 31. temperatures add to extreme precipitation in northeast Australia during La Niña, Geophysical Research Letters, 39, L10803, doi:10.1029/2012GL052014King, A.D., S.C. Lewis, S.E. Perkins, L.V. Alexander, M.G. 32. Donat, D.J. Karoly and M.T. Black, 2013, Limited Evidence of Anthropogenic Influence on the 2011-12 Extreme Rainfall over Southeast Australia [in ‘Explaining Extreme Events of 2012 from a Climate Perspective’]. Bulletin of the American Meteorological Society, 94 (9), S55–S58Christidis, N., P.A. Stott, D.J. Karoly and A. Ciavarella, 2013, An 33. attribution study of the heavy rainfall over eastern Australia in March 2012 [in ‘Explaining Extreme Events of 2012 from a Climate Perspective’]. Bulletin of the American Meteorological Society, 94 (9), S58–S61Hendon H.H., E.P. Lim, J.M. Arblaster, D. Anderson, 2014, Causes 34. and predictability of the record wet East Australian spring 2010, Climate Dynamics, 42 (5-6), 1155–1174CSIRO and Bureau of Meteorology, 2015, 35. Climate Change in Australia, Information for Australia’s Natural Resource Management Regions: Technical Report, CSIRO and Bureau of Meteorology, Australia, in press.
page 6
REfERENCES

© Australian Climate Change Science Programme 2015
The results and analyses contained in this publication are based on a number of technical, circumstantial or otherwise specified assumptions and parameters. To the extent permitted by law, the Bureau of Meteorology and CSIRO exclude all liability to any party for expenses, losses, damages and costs arising directly or indirectly from using this publication.
Author affiliations: Julie Arblaster, Karl Braganza and Robert Colman (Bureau of Meteorology), Imogen Jubb (Australian Climate Change Science Programme), Lisa Alexander (University of New South Wales), David Karoly (University of Melbourne).
For further information:
bureau of [email protected]