2017: a year of weather extremes across new zealand
TRANSCRIPT
1
2017: A year of weather extremes across New Zealand
Temperature Annual temperatures were near average (within 0.5°C of the annual average) for much of the South Island and lower and western North Island. Above average temperatures (>0.50°C above the annual average) occurred in the Bay of Plenty, Gisborne, Hawke’s Bay and in parts of Northland, Waikato, Manawatu-Whanganui, Nelson, Marlborough, Buller, upper Canterbury, interior Otago, and along the West Coast. 2017 was the 5th warmest on record for New Zealand, based on NIWA’s seven-station series which began in 1909.
Rainfall
Yearly rainfall in 2017 was above normal (120-149% of the annual normal) for parts of Auckland, Waikato, Bay of Plenty, coastal Canterbury, and north coastal Otago. In contrast, rainfall was below normal (50-79% of the annual normal) in much of Southland and interior Otago. Rainfall was near normal (80 to 119% of the annual normal) for the remainder of New Zealand.
Soil moisture The start to 2017 had below or well below normal soil moisture in the northern and eastern North Island, which was then alleviated by several rainstorms that occurred from mid-February through April. During April, above normal soil moisture developed in the eastern South Island and persisted through much of the winter and spring. From October through the end of the year, below normal soil moisture levels occurred in the western South Island from the development of La Niña. Very low rainfall during November and December led to below or well below normal soil moisture nationwide. 11 of New Zealand’s 16 geographical regions experienced meteorological drought, according to the New Zealand Drought Index by the end of the year.
Sunshine Annual sunshine was mainly near normal (90-109% of the annual normal) or above normal (110-124% of the annual normal) throughout New Zealand. The wider Nelson region experienced New Zealand’s highest annual sunshine total during 2017 (2633 hours).
Click on the following links to jump to the information you require:
Overview
The year in review
Temperature anomaly maps
Rainfall anomaly maps
The numbers
Annual temperature
Annual rainfall
Annual sunshine
2017 climate in the six main centres
Significant weather and climate events in 2017
Overview Annual mean sea level pressures for 2017 were slightly higher than normal to the south and east of New
Zealand, primarily over and to the east of the Chatham Islands. This atmospheric pressure pattern produced
slightly more northerly wind flows than normal for the year as a whole. Many months were characterised by
high pressure anomalies either east or south of New Zealand, with the months of January and September
New Zealand Climate Summary: 2017 Issued: 9 January 2018
2
2017 being notable exceptions. The last quarter of the year was marked by easterly flow anomalies over the
country and progressively increasing temperature anomalies, ending with the second warmest December on
record.
Sea surface temperatures (SSTs) around New Zealand were below normal during the beginning of 2017, but
rebounded to near or above average levels during mid-2017. From November into December, a “marine
heatwave” was observed across the Tasman Sea and in New Zealand coastal waters when SSTs were 2°C to
4°C above average. La Niña conditions in the equatorial Pacific quickly faded to neutral at the beginning of
2017 and remained neutral through much of the year. Then, in November-December 2017, La Niña
conditions re-emerged in the tropical Pacific Ocean and were accompanied by higher than normal air
pressure across New Zealand.
During 2017, temperatures were near average (within 0.5°C of the annual average1) across much of the
South Island and lower and western North Island. Above average temperatures (0.51°C to 1.20°C above the
annual average) occurred in Bay of Plenty, Gisborne, Hawke’s Bay and in parts of Northland, Waikato,
Manawatu-Whanganui, Nelson, Marlborough, Buller, upper Canterbury, interior Otago, and along the West
Coast. Several locations, particularly in the North Island, observed record or near-record high mean, mean
maximum, and mean minimum temperatures.
From month-to-month, January saw a nationwide temperature 0.7°C below the long-term average. This was
the only month of the year that had below average temperatures. Five months, including February, March,
May, June and July, had near average temperatures (-0.5°C to 0.5°C of the 1981–2010 monthly average). Six
months, including April (0.7°C above average), August (1.3°C above average), September (0.7°C above
average), October (1.0°C above average), November (1.1°C above average), and December (2.4°C above
average) recorded above average temperatures. The warmer than average run between August and
October was the warmest-equal August-October period (equal with 1988) on record since 1909 for New
Zealand using the NIWA’s seven-station temperature series.
The nation-wide average temperature for 2017, calculated using stations in NIWA’s seven-station
temperature series, was 13.15°C (0.54°C above the 1981–2010 annual average). The four years 2016, 2013,
1999, and 1998 were warmer than 2017 according to the NIWA seven-station series, thus making 2017 the
5th warmest on record.
For rainfall, 2017 was a year of two halves. The year started off on a rather wet and stormy note for the
South Island in January, a theme that expanded to include the North Island during March and April as the
“Tasman Tempest”, Ex-Tropical Cyclone Debbie, and Ex-Tropical Cyclone Cook contributed to record or near-
record amounts of rain and flooding for some areas. Drought conditions in Northland during February were
quickly erased due to these storms. During late 2017, significant dryness emerged about the South Island
and the lower North Island. Christchurch observed 1 mm of rain during November, the driest November on
record. By the end of the month, the city had a 35-day dry spell, which increased to 47 days before ending in
December. Oamaru also recorded its driest November on record (6 mm), just four months after observing its
wettest July on record (224 mm of rain fell), which also happened to be its second wettest month, overall,
on record. Furthermore, Oamaru recorded its wettest winter on record during 2017. During December,
meteorological drought emerged in the western and lower North Island around the Wellington-Wairarapa
1 Note all temperature, rainfall and sunshine anomalies reported in this document are relative to the 1981-2010 average/normal.
3
region following a near-record 30-day dry spell in Wellington city. The drought was then classified by MPI as
a medium-scale adverse event in Taranaki and western parts of the Manawatu-Whanganui region and in
Wellington.
By the end of September 2017, all six main centres had already recorded their normal annual rainfall.
However, a drier than normal end to the year meant that only a handful of locations saw record or near-
record rainfall for the year as a whole.
Annual rainfall totals for 2017 were above normal (120-149% of the annual normal) for parts of Auckland,
Waikato, Bay of Plenty, and coastal Canterbury, and north coastal Otago. In contrast, rainfall was below
normal (50-79% of the annual normal) in most of Southland, interior Otago, and in the Southern Alps.
Rainfall was near normal (80 to 119% of the annual normal) for the remainder of New Zealand.
It was an especially wet year in Oamaru which had its 2nd wettest year on record (813 mm of rain). On 21
July, 161 mm of rain fell, making it the wettest day in the town on record since records began in 1950;
thereafter, Oamaru recorded just 163 mm during the following five months combined (August-December
2017). Meanwhile, Tiwai Point (Southland) had its driest year on record (731 mm of rain recorded at that
site).
Soil moisture levels began the year drier than normal across much of the North Island, particularly in
Northland, following a dry end to 2016 and start to 2017. Early in February, Northland’s dry conditions were
classified as a medium-scale adverse event under MPI’s Primary Sector Recovery Policy. A heavy rain event
in mid-February relieved soils of their significant dryness there, and this was followed by several more
rainstorms (including rain from ex-tropical cyclones) during March and April. During November 2017, very
dry weather across the country led to major decreases in soil moisture, especially across the South Island
and lower North Island. This led to the issuing of a ban on residential sprinklers and irrigation systems in the
Wellington area. Dry conditions persisted during December and led to the emergence of meteorological
drought in Wellington-Wairarapa, Manawatu-Whanganui, and Taranaki. Thus, water restrictions were put in
place across the western and lower North Island as well as Tasman, Nelson, parts of Otago, the Coromandel,
the Bay of Plenty, and Hawke’s Bay.
Annual sunshine was mainly near normal (90-109% of the annual normal) or above normal (110-124% of the
annual normal) throughout New Zealand. The greater Nelson region experienced New Zealand’s highest
annual sunshine total during 2017 (2633 hours).
Section 1: The year in review The monthly sequence of New Zealand climate (with some exceptions) was as follows:
January 2017: Cool for many and very dry in the eastern North Island
January temperatures were well below average (< -1.20°C below average) or below average (-1.20°C to -
0.51°C below average) for most of the South Island and the south and west of the North Island.
Temperatures were near average (-0.50°C to +0.50°C of average) for eastern areas and well above average
(>1.20°C above average) for a small number of locations in Hawke’s Bay. Rainfall was well below normal
(<50% of normal) in Gisborne, Hawke’s Bay and Northland. Above normal (120-149% of normal) or well
above normal (>149% of normal) rainfall occurred in the West Coast, middle and south-coastal Canterbury,
Otago, inland Southland, Wellington and Manawatu-Whanganui. Sunshine was near (90-110% of normal) or
above normal (110-125% of normal) in eastern areas of the North Island and for parts of eastern

4
Canterbury. Sunshine was below normal (75-89% of normal) or well below normal (<75% of normal) in the
west and south of both the North and South Island.
February 2017: Wet for some of the North Island, dry for the South Island
February temperatures were near average (-0.50°C to +0.50°C of average) for most of the South Island
except in western Southland and northern Tasman where below average temperatures (-0.51°C to -1.20°C
below average) and well below average (<-1.2°C below average) were experienced, respectively. Near
average temperatures occurred for the south and west of the North Island while above average (+0.51 to
+1.20°C above average) and well above average (>1.2°C above average) temperatures occurred in the north
and eastern North Island. Rainfall for February was above normal (120-149% of normal) or well above
normal (>149% of normal) for central and southeastern parts of the North Island, as well in the Far North.
The rest of the North Island experienced mostly near normal (80 to 119% of normal) rainfall. Much of the
eastern South Island experienced below normal (50-79% of normal) or well below normal (<50% of normal)
rainfall totals while areas of near normal (80-119% of normal) rainfall were recorded to the west. Sunshine
was below normal (75-89% of normal) through much of the western and central North Island. Sunshine
hours were near normal (90-110% of normal) in Northland, Wellington, and Taumarunui. Above (110-125%
of normal) or well above normal (>125% of normal) sunshine hours occurred for much of the eastern and
central South Island. The exception to this was Christchurch which, along with Nelson, experienced near
normal sunshine hours.
March 2017: The Tasman Tempest causes downpours in the upper North Island
March temperatures were well above average (>1.20°C above average) or above average (0.51 to 1.20°C
above average) across the North Island. The South Island was an island of two halves, with the north and
west recording above or well above average temperatures and the south and east recording near (-0.50 to
0.50°C of average) or below average (-1.20 to -0.51°C below average) temperatures. Significant rainfall totals
were experienced across the upper North Island, with over 300% of normal March rainfall recorded in some
places. This was due in large part to the “Tasman Tempest”, a prolific rain storm that occurred between 7-12
March. The remainder of the North Island had a wet month, with most locations recording above normal
rainfall or more (>120% of normal March rainfall). Parts of the northern and eastern South Island also
recorded above normal or well above normal (>149% of normal) rainfall. In contrast, the west and south of
the South Island was much drier – some locations recorded well below normal rainfall (<50% of normal) and
many locations recorded below normal rainfall (50-79% of normal). Below normal (75-89% of normal) or
well below normal (<75% of normal) sunshine hours were recorded for most of the North Island and parts of
the northern South Island. In contrast, parts of Otago and Southland recorded well above normal (>125% of
normal) sunshine. Soils were much wetter than normal in the upper half of the North Island and much drier
than normal across the lower half of the South Island.
April 2017: Tropical moisture brings abundant rainfall to the North Island and eastern South
Island
April temperatures were well above average (>1.20°C above average) or above average (0.51 to 1.20°C
above average) across most of the North Island. Isolated locations in the central and southern North Island,
as well as the northern and eastern South Island, recorded near average (-0.50 to 0.50°C of average)
temperatures. Temperatures were primarily well above average (>1.20°C above average) or above average
(0.51 to 1.20°C above average) in the western and southern South Island. Prolific rainfall totals were
observed across nearly the entire North Island. Many locations recorded more than twice the normal April
rainfall (>200% of normal) and only northern and western Northland received near normal rainfall (80-119%
of normal). The northern and eastern South Island also received widespread rainfall more than 200% of the
April normal. Conversely, much of the West Coast saw near normal (80-119% of normal) to above normal
(120-149% of normal) rainfall. Meanwhile, much of Southland and Queenstown-Lakes received below
5
normal rainfall (50-79% of normal). Near normal (90-109% of normal) to below normal (75-89% of normal)
sunshine hours were recorded for most locations around New Zealand.
May 2017: Cool and dry for much of the South Island, wet for inland parts of the North Island
May temperatures were below average (-0.51 to -1.20°C) for eastern and inland parts of the South Island,
southern Hawke’s Bay and Wairarapa. Pockets of well below average temperatures (< -1.20 °C) were
observed in Tasman, south Canterbury, Mt Cook and southern Central Otago. May temperatures were
typically near average (-0.50°C to +0.50°C) for the remainder of the country. Rainfall was well above normal
(>149% of normal) for large parts of the South Island. The exceptions were parts of central and eastern
Canterbury where below normal (50-79% of normal) and well below normal (<50% of normal) rainfall was
recorded. In the North Island, rainfall was well above normal in Taranaki, Manawatu and Whanganui as well
as the western portion of the Wellington region. Well below normal rainfall was recorded along the coastal
fringes of Gisborne, Hawke’s Bay and eastern Wellington. Soil moisture levels were below normal for the
time of year for large parts of Gisborne, Hawke’s Bay, the Wairarapa as well as central and northern parts of
Canterbury. Sunshine was below normal (75-89% of normal) in Southland, the West Coast, Tasman,
Manawatu, Whanganui and Taranaki. Above normal sunshine (110-125% of normal) was recorded along the
eastern portions of Gisborne, Hawke’s Bay and eastern Wellington.
June 2017: Record-dry June for parts of the North Island
June temperatures were near average for most of the country (-0.50°C to +0.50°C of average). Pockets of
above average temperatures (0.51°C to 1.20°C above average) occurred in the Bay of Plenty, West Coast,
and inland Otago. Below average temperatures (-0.51°C to -1.20°C below normal) were observed in parts of
the Wellington Region and the central North Island. Rainfall was well below normal (<50% of normal) for
many locations in the North Island south of Auckland city, particularly in the central and western parts of the
Island. Rainfall was also well below normal for some parts of the northern and central South Island, and
below normal rainfall (50-79% of normal) was observed in the southern and western South Island. Rainfall
was near normal (80-119% of normal) in Hawke’s Bay and near normal or above normal (120-149% of
normal) in Northland. Sunshine was well above normal (> 125% of normal) in Auckland, Waikato, Kapiti
Coast, Taranaki, and parts of Southland. Above normal sunshine (110-125% of normal) was recorded in
Marlborough, Nelson and West Coast. Sunshine was typically near normal (90-109% of normal) for the
remainder of the country.
July 2017: Record breaking rainfall for the eastern South Island
July temperatures were near average (-0.50°C to +0.50°C of average) for much of the country. Temperatures
were below average (-0.51°C to -1.20°C below average) about the districts of Hurunui, Mackenzie, Waitaki,
Dunedin and Clutha as well as eastern Southland. Pockets of above average temperatures (0.51°C to 1.20°C
above average) were observed in Waikato and Manawatu-Whanganui. July rainfall was well above normal
(>150% of normal) for the Greater Wellington Region, Otago and mid to south Canterbury. Rainfall was
above normal (120-149% of normal) for large parts of the North Island and Nelson. Below normal rainfall
(50-79% of normal) was observed in parts of Northland, the West Coast, western Southland and western
Otago. July sunshine hours were near normal (90-109% of normal) for much of the country.
August 2017: A warm end to winter
August temperatures were above average (0.51°C to 1.20°C above average) or well above average (> 1.20°C
above average) temperatures for almost the entire country, making it the third-warmest August on record in
New Zealand. Rainfall was well above normal (> 149% of normal) in central and western areas of the North
Island, with below normal rainfall (50-79% of normal) for the east. In the South Island, rainfall was well
below normal (< 50% of normal) in eastern Otago and Southland, but above normal (120-149% of normal) in
Fiordland and central parts of the West Coast and Canterbury. Sunshine hours were near normal (90-109%

6
of normal) or above normal (110-125% of normal) for much of the country. Below normal sunshine (75-89%
of normal) occurred in central and southern parts of the North Island, and the far northern portion of the
South Island.
September 2017: A wet month for many and warm on the eastern coasts
September temperatures were near average (-0.50°C to +0.50°C of average) across large swaths of the
country. Temperatures were above average (0.51°C to 1.20°C above average) in parts of Auckland,
Coromandel, northern and central Waikato, Gisborne, Hawke’s Bay, southern Manawatu-Whanganui,
northern Marlborough, northern Canterbury, and much of Otago. September rainfall was well above normal
(>149% of normal) or above normal (120-149% of normal) for large areas of the North Island and much of
the upper the South Island, along with eastern Otago and western Southland. Below normal rainfall (50-79%
of normal) was observed in central and southern Hawke’s Bay, central Otago, and eastern Southland.
September sunshine hours were near normal (90-109% of normal) for much of the country.
October 2017: A very dry and warm month for the South Island interior
October temperatures were well above average (>1.20°C of average) in parts of Auckland, Coromandel,
Manawatu-Whanganui, Kapiti Coast, Nelson, Canterbury, Otago, Southland, and Fiordland. Temperatures
were above average (0.51-1.20°C above average) for much of the rest of the country. Rainfall was well
below normal (<50% of normal) for most of Otago as well as parts of Northland, Gisborne, Kapiti Coast,
Marlborough, southern Canterbury, and Southland. Rainfall was below normal (50-79% of normal) for parts
of Northland, Auckland, Manawatu-Whanganui, Wellington, Wairarapa, Canterbury, Southland, and the
West Coast. Rainfall was well above normal (>149% of normal) for parts of western Bay of Plenty, Waikato,
and the east coast of the South Island. Thus, soils were much drier than normal for the time of year for
interior Otago and interior Southland, Tasman, Kapiti Coast, Taranaki, Gisborne, and Northland. Sunshine
was well above normal (>125% of normal) or above normal (110-125% of normal) for Otago and Southland
as well as parts of the Wellington and Taranaki regions and near normal (90-110% of normal) for most other
parts of the country.
November 2017: Hot in the south and dry countrywide to end spring
Rainfall was well below normal (<50% of normal) for much of Canterbury, the West Coast, Tasman, Nelson,
Marlborough, Wellington, Wairarapa, Manawatu-Whanganui, parts of Hawke’s Bay, Auckland, and Bay of
Plenty. Isolated pockets of above normal (120-149% of normal) rainfall occurred in Northland, the
Queenstown-Lakes District, and near Roxburgh (Central Otago). Rainfall was below normal (50-79% of
normal) or near normal (80-119%) elsewhere. Temperatures were well above average (>1.20°C of average)
in parts of Southland, interior Otago, interior Canterbury, the West Coast, and interior Waikato.
Temperatures were above average (0.51-1.20°C above average) for most of the rest of the country. By the
end of November, soils were significantly drier than normal for the time of year across a large portion of the
South Island, particularly in the west, as well as the lower and western North Island.
December 2017: A very hot and dry start to summer
Rainfall was below normal (50-79% of normal) or well below normal (<50% of normal) for large swaths of
New Zealand, including Northland, Auckland, Waikato, Bay of Plenty, Taranaki, coastal Manawatu-
Whanganui to Wellington, Nelson, Tasman, interior Canterbury, much of the West Coast, Otago, and parts
of Southland. Meanwhile, isolated pockets of near normal (80-119% of normal) to above normal (120-149%
of normal) rainfall was observed from coastal Hawke’s Bay to Wairarapa, coastal northern and southern
Canterbury, and Fiordland. Temperatures were well above average (>1.20°C of average) nearly everywhere
in New Zealand. Isolated above average (0.51-1.20°C of average) temperatures were observed in Gisborne,
inland Hawke’s Bay, and a small area of the Far North. By the end of 2017, soils were significantly drier than
7
normal for the time of year across a large portion of the North Island, Tasman and northern West Coast,
interior Canterbury, and much of Southland and interior Otago.

8
Section 2: Monthly temperature (in °C, as a departure from the 1981-2010 monthly
averages)
January
February
March
April
May
June
July
August
September
October
November
December
Figure 1: Monthly temperature anomalies (compared to the 1981-2010 monthly averages) for each month of 2017.

9
Section 3: Monthly rainfall (as a percentage of the 1981-2010 monthly normals)
January
February
March
April
May
June
July
August
September
October
November
December
Figure 2: Monthly rainfall as a percentage of the 1981-2010 monthly normals for each month of 2017.

10
Section 4: Observations and statistics
Based on data available at the time of writing, NIWA analyses of month-by-month records show:
• The nation-wide average temperature for 2017 was 13.15°C (0.54°C above the 1981–2010 annual
average). Using NIWA’s seven-station temperature series, 2017 was the 5th warmest year on record since
1909.
• Leigh recorded the highest annual average temperature for 2017 with 17.0°C, followed by Whangarei
with 16.6°C, and Kaitaia with 16.5°C.
• The highest air temperature of the year was 35.5°C recorded at Wairoa and Ashburton on 6 February,
followed by 34.9°C at Maraekakaho (inland from Hastings) on 6 February and 34.7°C at Waiau on 5
February and 8 December.
• The lowest air temperature of the year was recorded at Lake Tekapo; -14.6°C on 29 July. The second
lowest air temperature of 2017 occurred at Mt Cook (Airport) on 29 July; -13.7°C.
• The top three daily rainfall totals from regularly reporting gauges in 2017 were 316 mm at Castle Mount
on 24 September, 309 mm at Milford Sound on 31 January, and 260 mm at North Egmont on 8 August.
• Of all of the regularly reporting gauges, the wettest locations in 2017 were: Cropp River (West Coast, 975
metres above sea level) with 8662 mm, Tuke River (West Coast, 975 metres above sea level) with
8097 mm, and North Egmont with 7082 mm.
• Of the regularly reporting gauges, the wettest locations in 2017 excluding high elevation stations were:
Milford Sound with 60002 mm, Secretary Island with 4385 mm, and Franz Josef with 3587 mm.
• The lowest rainfall recording locations for 2017 were Clyde with 278 mm, followed by Cromwell with 280
mm, then Alexandra with 297 mm.
• The sunniest region3 during 2017 was the wider Nelson region with 26334 hours, followed by
Marlborough (2605 hours) and Hawke’s Bay (2504 hours).
• The highest confirmed wind gust for 2017 was recorded at Cape Turnagain; 198 km/h observed on 13
June.
• Of the six main centres for 2017: Auckland was the warmest, Dunedin was the coldest and driest,
Tauranga was the wettest and sunniest, and Wellington was least sunny.
2 Missing 2 days of data 3 For 2017 NIWA has created a new regional sunshine ranking. This considers the differences between the data recorded by our new high precision electronic sensors and the historic method of recording, using a Campbell Stokes sunshine instrument, which burns a hole in a sun card. The regional sunshine ranking reflects the highest sunshine hours in local authority regions, except for Nelson which has been extended to include the wider Nelson urban area (i.e. including Richmond).
The manual Campbell Stokes recorders are gradually being replaced, and the main table this year primarily contains data from stations with electronic sensors. Three manual sites have been included – Tauranga, Wellington, and Christchurch. They have been included only because they are main centres and there are no electronic sensors nearby. The comparison of data using the different recorders is currently being assessed. 4 Missing 1 day of data

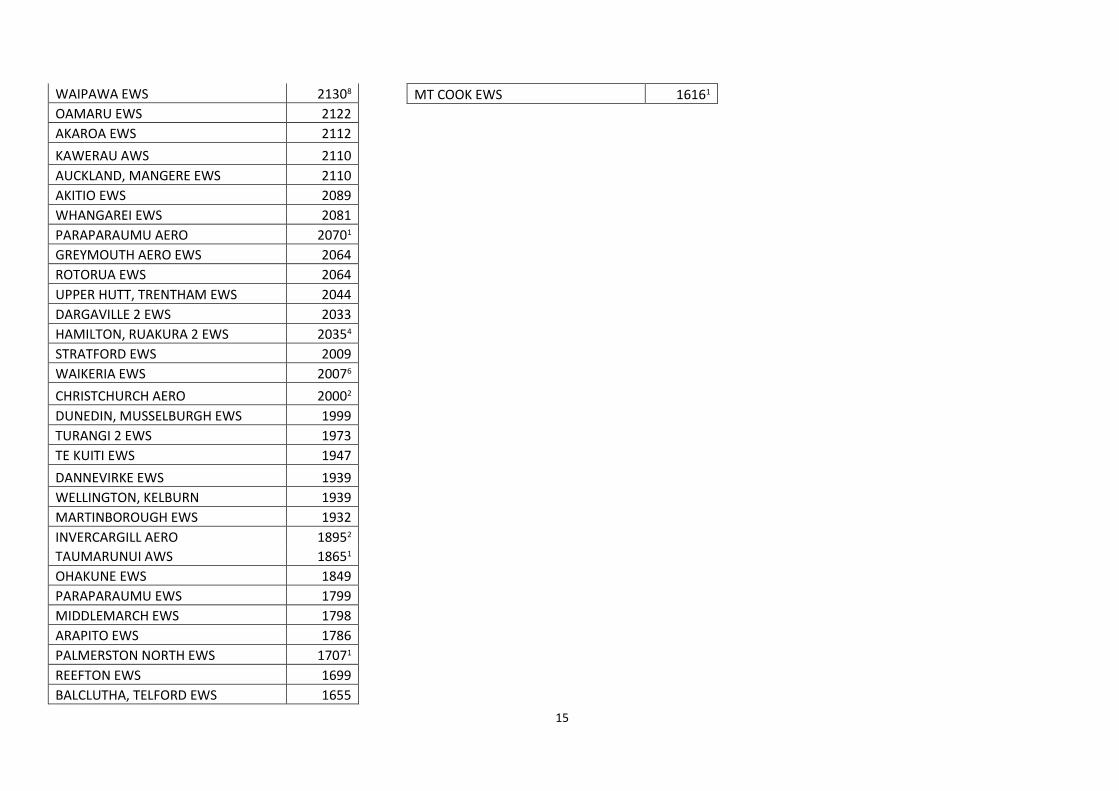
11
Ranked annual total rainfall, mean temperatures and sunshine hours for the stations available at time of
writing are displayed on the following four pages. Some sites have missing days of data. The number of
missing days is indicated by a superscript number next to the annual value in the tables below.

12
Location Rainfall
(mm)
CROPP AT WATERFALL 8662
TUKE AT TUKE HUT 8097
CROPP AT CROPP HUT 7387
NORTH EGMONT SRIG 70823
HAAST AT CRON CK 6748
DOON AT MIDDLE ARM 6445
MILFORD SOUND 60002
HOKITIKA AT PRICES FLAT 5847
HOKITIKA AT COLLIERS CK 5812
HAAST AT ROARING BILLY 4355
ARTHURS PASS AWS 39468
FRANZ JOSEF EWS 3587
MANAPOURI, WEST ARM JETTY EWS 3308
MT COOK EWS 3265
MUELLER HUT EWS 3052
HOKITIKA AWS 28941
MURCHISON MTNS EWS 2480
WHITIANGA EWS 2426
GREYMOUTH AERO EWS 2309
MT COOK AERO AWS 21252
MAHANGA EWS 2114
TAKAKA EWS 2110
STRATFORD EWS 2110
PUYSEGUR POINT AWS 20815
ARAPITO EWS 2066
WESTPORT AERO AWS 1964
ROTORUA AERO AWS 19533
WHITIANGA AERO AWS 18857
UPPER RAKAIA EWS 18831
ROTORUA EWS 1855
KERIKERI AERODROME AWS 18092
KAIKOHE AWS 1774
TURANGI 2 EWS 1756
REEFTON EWS 1712
TAURANGA AERO AWS 1687
WARKWORTH EWS 1654
EGLINTON, KNOBS FLAT CWS 1591
OHAKUNE EWS 1571
TAUMARUNUI AWS 15383
KAITAIA AERO EWS 1528
HAMILTON AWS 15283
PUKEKOHE EWS 1502
WAIROA AERO AWS 14842
HAMILTON, RUAKURA 2 EWS 14661
GALATEA AWS 14543
WHAKATANE AERO AWS 1440
WAIROA, NORTH CLYDE EWS 1398
WHANGAPARAOA AWS 13925
PAEROA AWS 138113
FIRTH OF THAMES EWS 13802
AUCKLAND, NORTH SHORE ALBANY
EWS 1378
FAREWELL SPIT AWS 1372
AKAROA EWS 1358
WHANGAREI EWS 1356
WELLINGTON, KELBURN AWS 1349
AKITIO EWS 1337
HAWERA AWS 13141
AUCKLAND, MANGERE EWS 1308
NEW PLYMOUTH AWS 1298
TAUPO AWS 12851
UPPER HUTT, TRENTHAM EWS 1277
PAHIATUA EWS 1259
LEIGH 2 EWS 1252
PORT TAHAROA AWS 123714
MT POTTS EWS 1227
DARGAVILLE 2 EWS 1189
AUCKLAND AERO 1188
GISBORNE AWS 1179
WAIOURU AIRSTRIP AWS 11601
TAKAPAU PLAINS AWS 1157
PARAPARAUMU AERO AWS 11351
LEVIN AWS 1125
DANNEVIRKE EWS 1084
PALMERSTON NORTH EWS 1053
APPLEBY 2 EWS 1051
HANMER FOREST EWS 10472
MT PHILISTINE EWS 1033
PALMERSTON NORTH AWS 10121
RICHMOND EWS 987
NELSON AWS 9762
ASHBURTON AERO AWS 930
WHANGANUI, SPRIGGENS PARK EWS 928
MANA ISLAND AWS 9142
MANAPOURI AERO AWS 9072
MASTERTON AERO AWS 899
MASTERTON EWS 888
NAPIER AERO AWS 887
MT LARKINS EWS 882
MARTINBOROUGH EWS 848
GORE AWS 8311

13
WAIPAWA EWS 8285
HASTINGS AWS 8202
OAMARU AWS 813
CHRISTCHURCH AERO 804
CHATHAM ISLAND EWS 791
DUNEDIN, MUSSELBURGH EWS 784
CHRISTCHURCH, KYLE ST EWS 7643
KAIKOURA AWS 7631
FIVE RIVERS CWS 762
INVERCARGILL AERO AWS 7541
TIWAI POINT EWS 731
WHAKATU EWS 7153
BALCLUTHA, TELFORD EWS 705
CAPE REINGA AWS 70112
OAMARU AIRPORT AWS 680
CAPE CAMPBELL AWS 6761
WAIPARA WEST EWS 646
BLENHEIM AERO AWS 6412
NUGGET POINT AWS 6393
BARING HEAD 636
TIMARU EWS 632
WAIMATE CWS 618
OAMARU EWS 612
LINCOLN, BROADFIELD EWS 609
LAKE TEKAPO EWS 579
FAIRLIE AWS 5775
QUEENSTOWN AERO AWS 561
WINDSOR EWS 560
CULVERDEN AWS 5463
TARA HILLS AWS 5394
WANAKA AERO AWS 5161
MIDDLEMARCH EWS 484
HAKATARAMEA VALLEY CWS 3868
LAUDER EWS 347
RANFURLY EWS 3449
ALEXANDRA CWS 297
CROMWELL EWS 280
CLYDE 2 EWS 2781
Location Mean
temp (°C)
LEIGH 2 EWS 17.0
WHANGAREI AERO AWS 16.6
KAITAIA AERO EWS 16.5
WHANGAPARAOA AWS 16.4
AUCKLAND, MANGERE EWS 16.1
AUCKLAND AERO 16.1
CAPE REINGA AWS 16.1
PURERUA AWS 16.1
DARGAVILLE 2 EWS 16.0
NORTH SHORE, AUCKLAND 15.9
KERIKERI AERODROME AWS 15.8
TAURANGA AERO AWS 15.7
HICKS BAY AWS 15.7
WAIROA, NORTH CLYDE EWS 15.6
AUCKLAND, WHENUAPAI AWS 15.5
WHITIANGA AERO AWS 15.4
GISBORNE EWS 15.3
PORT TAHAROA AWS 15.3
KAIKOHE AWS 15.2
TE PUKE EWS 15.2
PUKEKOHE EWS 15.1
TOENEPI EWS 15.1
NGAWI AWS 14.9
WARKWORTH EWS 14.8
WHAKATANE AERO AWS 14.8
HASTINGS AWS 14.8
NAPIER AERO AWS 14.7
FAREWELL SPIT AWS 14.7
MAHIA AWS 14.7
FIRTH OF THAMES EWS 14.7
WANGANUI, SPRIGGENS PARK 14.7
WHANGANUI 2 AWS 14.6
HAMILTON, RUAKURA 2 EWS 14.5
HAMILTON AWS 14.3
NEW PLYMOUTH AWS 14.1
WELLINGTON AERO 14.1
MATAMATA, HINUERA EWS 14.1
TE KUITI EWS 14.0
MASTERTON, TE ORE ORE CWS 13.8
PALMERSTON NORTH AWS 13.8
LEVIN AWS 13.7
BLENHEIM RESEARCH EWS 13.7
NELSON AERO 13.7
PARAPARAUMU AERO 13.6
PARAPARAUMU AERO AWS 13.6
AKAROA EWS 13.5
GALATEA AWS 13.5
ROTORUA EWS 13.5
ARAPITO EWS 13.5
RICHMOND EWS 13.5
WHAKATU EWS 13.5
WELLINGTON, KELBURN AWS 13.4

14
MOTUEKA, RIWAKA EWS 13.3
WESTPORT AERO AWS 13.3
BARING HEAD 13.2
TAUMARUNUI EWS 13.2
HAWERA AWS 13.2
CHRISTCHURCH, KYLE ST EWS 13.1
DANNEVIRKE EWS 13.1
PAHIATUA EWS 13.0
KAIKOURA AWS 12.9
MARTINBOROUGH EWS 12.9
WAIPARA WEST EWS 12.7
CHATHAM ISLAND AERO AWS 12.7
GREYMOUTH AERO EWS 12.6
DIAMOND HARBOUR EWS 12.5
TAUPO AWS 12.4
HOKITIKA AERO 12.4
REEFTON EWS 12.4
UPPER HUTT, TRENTHAM EWS 12.3
TAKAKA EWS 12.3
LINCOLN, BROADFIELD EWS 12.3
STRATFORD EWS 12.3
WAIAU SCHOOL CWS 12.3
HOKITIKA AWS 12.3
RANGIORA EWS 12.0
CHRISTCHURCH AERO 12.0
APPLEBY 2 EWS 12.0
CROMWELL EWS 12.0
TAKAPAU PLAINS AWS 11.9
HAAST AWS 11.9
CULVERDEN AWS 11.8
TURANGI 2 EWS 11.8
FRANZ JOSEF EWS 11.7
PUYSEGUR POINT AWS 11.7
LE BONS BAY AWS 11.6
DUNEDIN, MUSSELBURGH EWS 11.6
MEDBURY 11.6
WANAKA AERO AWS 11.5
ALEXANDRA CWS 11.5
ASHBURTON AERO AWS 11.4
LAUDER EWS 11.2
OAMARU AWS 11.1
MILFORD SOUND 11.1
TIWAI POINT EWS 11.1
CLYDE 2 EWS 10.9
TIMARU EWS 10.9
HANMER FOREST EWS 10.9
OHAKUNE EWS 10.8
FAIRLIE AWS 10.8
WINDSOR EWS 10.8
DUNEDIN AERO AWS 10.7
INVERCARGILL AERO 10.6
GORE AWS 10.4
NUGGET POINT AWS 10.4
QUEENSTOWN AERO AWS 10.3
TE ANAU AT PARK HQ CWS 10.3
MIDDLEMARCH EWS 10.2
BALCLUTHA, TELFORD EWS 10.2
TARA HILLS AWS 10.1
LUMSDEN AWS 10.0
FIVE RIVERS CWS 9.9
MANAPOURI AERO AWS 9.8
RANFURLY EWS 9.8
MANAPOURI, WEST ARM JETTY 9.5
WAIOURU AIRSTRIP AWS 9.4
LAKE TEKAPO EWS 9.0
MT COOK AERO AWS 9.0
ARTHURS PASS EWS 8.7
Location Sunshine
(hours)
RICHMOND EWS 26331
BLENHEIM RESEARCH EWS 2605
NAPIER EWS 2504
LAKE TEKAPO EWS 2500
NEW PLYMOUTH AWS 2490
APPLEBY 2 EWS 2490
WAIPARA WEST EWS 24581
GISBORNE AWS 2420
RAOUL ISLAND AWS 2413
AUCKLAND, MOTAT EWS 2400
CROMWELL EWS 2338
QUEENSTOWN AERO AWS 23241
LEVIN EWS 2284
DIAMOND HARBOUR EWS 2276
WESTPORT EWS 2260
TAKAKA EWS 22591
ASHBURTON AERO AWS 22241
RANGIORA EWS 22191
HOKITIKA AWS 22072
CHEVIOT EWS 220215
KAITAIA EWS 2167
MASTERTON EWS 2157
15
WAIPAWA EWS 21308
OAMARU EWS 2122
AKAROA EWS 2112
KAWERAU AWS 2110
AUCKLAND, MANGERE EWS 2110
AKITIO EWS 2089
WHANGAREI EWS 2081
PARAPARAUMU AERO 20701
GREYMOUTH AERO EWS 2064
ROTORUA EWS 2064
UPPER HUTT, TRENTHAM EWS 2044
DARGAVILLE 2 EWS 2033
HAMILTON, RUAKURA 2 EWS 20354
STRATFORD EWS 2009
WAIKERIA EWS 20076
CHRISTCHURCH AERO 20002
DUNEDIN, MUSSELBURGH EWS 1999
TURANGI 2 EWS 1973
TE KUITI EWS 1947
DANNEVIRKE EWS 1939
WELLINGTON, KELBURN 1939
MARTINBOROUGH EWS 1932
INVERCARGILL AERO 18952
TAUMARUNUI AWS 18651
OHAKUNE EWS 1849
PARAPARAUMU EWS 1799
MIDDLEMARCH EWS 1798
ARAPITO EWS 1786
PALMERSTON NORTH EWS 17071
REEFTON EWS 1699
BALCLUTHA, TELFORD EWS 1655
MT COOK EWS 16161

16
Section 5: Annual temperature – record or near record warmth for many
locations
2017 was New Zealand’s 5th warmest year on record based on NIWA’s seven-station series. Many
locations observed record or near-record high mean, mean maximum, and mean minimum
temperatures while no locations observed record or near-record low mean, mean maximum, or
mean minimum temperatures.
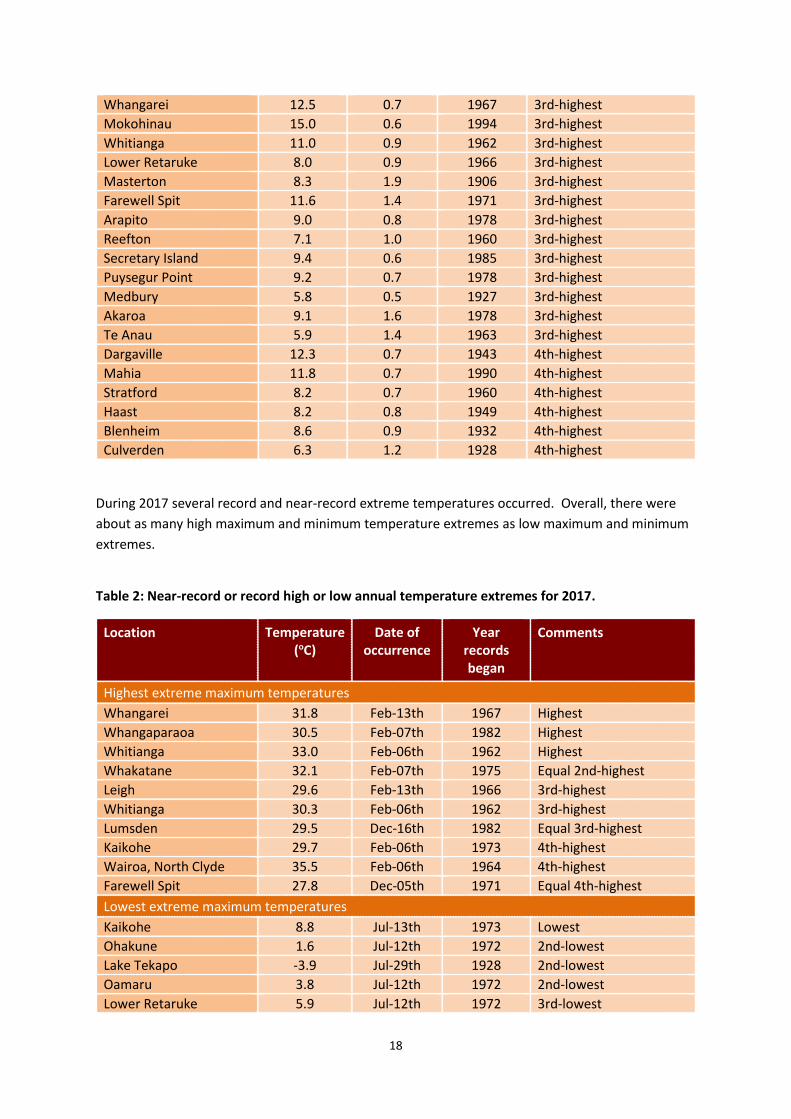
Table 1: Near-record or record high or low annual average temperature departures for 20175.
Location Mean air temp. (oC)
Departure from
normal (oC)
Year records began
Comments
Mean temperature
Te Puke 15.2 1.2 1973 Highest
Wairoa, North Clyde 15.6 1.3 1964 Highest
Lauder 11.2 1.6 1924 Highest
Mokohinau 17.0 0.6 1994 2nd-highest
Auckland (Whenuapai) 15.5 0.8 1945 2nd-highest
Whitianga 15.7 1.0 1962 2nd-highest
Hastings 14.8 0.9 1965 2nd-highest
Waiau 12.3 0.9 1974 2nd-highest
Whangarei 16.6 0.8 1967 3rd-highest
Whangaparaoa 16.4 0.7 1982 3rd-highest
Rotorua 13.5 0.8 1964 3rd-highest
Gisborne 15.3 1.0 1905 3rd-highest
Waiouru 9.9 0.9 1962 3rd-highest
Wanganui (Spriggens Park) 14.7 0.7 1937 3rd-highest
Farewell Spit 14.7 0.8 1971 3rd-highest
Arapito 13.5 0.8 1978 3rd-highest
Reefton 12.4 1.0 1960 3rd-highest
Secretary Island 12.4 0.6 1985 3rd-highest
Puysegur Point 11.7 0.7 1978 3rd-highest
Motueka 13.3 0.8 1956 3rd-highest
Akaroa 13.5 1.0 1978 3rd-highest
Wanaka 11.5 1.0 1955 3rd-highest
Cromwell 12.0 1.1 1949 3rd-highest
Kaitaia 16.5 0.8 1948 4th-highest
Auckland (Airport) 16.1 0.6 1959 4th-highest
5 The rankings (1st, 2nd, 3rd….etc) in Tables 1 to 12 are relative to climate data from a group of nearby stations, some of which may no longer be operating. The current climate value is compared against all values from any member of the group, without any regard for homogeneity between one station’s record and another. This approach is used because of the practical limitations of performing homogeneity checks in real-time.

17
Masterton 13.8 1.4 1906 4th-highest
Hicks Bay 15.7 0.8 1969 4th-highest
Mahia 14.7 0.6 1990 4th-highest
Hawera 13.2 0.6 1977 4th-highest
Westport 13.3 0.7 1937 4th-highest
Blenheim 13.7 0.6 1932 4th-highest
Te Anau 10.3 0.7 1963 4th-highest
Mean maximum temperature
Rotorua 18.3 1.3 1964 Highest
Cromwell 18.7 1.7 1949 Highest
Whangarei 20.9 1.1 1967 2nd-highest
Mokohinau 19.1 0.8 1994 2nd-highest
Whangaparaoa 19.6 0.8 1982 2nd-highest
Wairoa, North Clyde 20.7 1.4 1964 2nd-highest
Secretary Island 15.4 0.7 1985 2nd-highest
Hanmer Forest 18.6 1.6 1906 2nd-highest
Lauder 17.5 1.8 1924 2nd-highest
Te Puke 19.8 0.8 1973 3rd-highest
Hicks Bay 19.1 1.1 1969 3rd-highest
Gisborne 20.4 0.9 1905 3rd-highest
Puysegur Point 14.3 0.9 1978 3rd-highest
Waiau School 18.6 0.9 1974 3rd-highest
Manapouri 13.5 0.7 1971 3rd-highest
Tiwai Point 15.0 1.0 1970 3rd-highest
Whangarei 20.6 0.9 1967 4th-highest
Auckland (Whenuapai) 19.8 0.7 1945 4th-highest
Auckland (Mangere) 19.8 0.9 1959 4th-highest
Hastings 20.1 1.1 1965 4th-highest
Mahia 17.6 0.5 1990 4th-highest
Wanganui (Spriggens Park) 18.7 0.7 1937 4th-highest
Westport 17.1 0.9 1937 4th-highest
Arapito 17.9 0.7 1978 4th-highest
Milford Sound 15.6 1.0 1934 4th-highest
Kaikoura 16.8 1.0 1963 4th-highest
Wanaka 17.0 0.9 1955 4th-highest
Lumsden 15.6 0.7 1982 4th-highest
Clyde 18.0 1.2 1978 4th-highest
Mean minimum temperature
Te Puke 10.5 1.6 1973 Highest
Hastings 9.5 0.8 1965 Highest
Wairoa, North Clyde 10.4 1.1 1964 Highest
Lauder 4.9 1.3 1924 Highest
Auckland (Whenuapai) 11.2 0.9 1945 2nd-highest
Port Taharoa 12.5 0.9 1973 2nd-highest
Hawera 9.5 0.7 1977 2nd-highest
Waiouru 5.4 1.0 1962 2nd-highest
Cape Reinga 13.7 0.6 1951 3rd-highest
Kaitaia Aero 12.8 0.9 1948 3rd-highest
18
Whangarei 12.5 0.7 1967 3rd-highest
Mokohinau 15.0 0.6 1994 3rd-highest
Whitianga 11.0 0.9 1962 3rd-highest
Lower Retaruke 8.0 0.9 1966 3rd-highest
Masterton 8.3 1.9 1906 3rd-highest
Farewell Spit 11.6 1.4 1971 3rd-highest
Arapito 9.0 0.8 1978 3rd-highest
Reefton 7.1 1.0 1960 3rd-highest
Secretary Island 9.4 0.6 1985 3rd-highest
Puysegur Point 9.2 0.7 1978 3rd-highest
Medbury 5.8 0.5 1927 3rd-highest
Akaroa 9.1 1.6 1978 3rd-highest
Te Anau 5.9 1.4 1963 3rd-highest
Dargaville 12.3 0.7 1943 4th-highest
Mahia 11.8 0.7 1990 4th-highest
Stratford 8.2 0.7 1960 4th-highest
Haast 8.2 0.8 1949 4th-highest
Blenheim 8.6 0.9 1932 4th-highest
Culverden 6.3 1.2 1928 4th-highest
During 2017 several record and near-record extreme temperatures occurred. Overall, there were
about as many high maximum and minimum temperature extremes as low maximum and minimum
extremes.
Table 2: Near-record or record high or low annual temperature extremes for 2017.
Location Temperature (oC)
Date of occurrence
Year records began
Comments
Highest extreme maximum temperatures
Whangarei 31.8 Feb-13th 1967 Highest
Whangaparaoa 30.5 Feb-07th 1982 Highest
Whitianga 33.0 Feb-06th 1962 Highest
Whakatane 32.1 Feb-07th 1975 Equal 2nd-highest
Leigh 29.6 Feb-13th 1966 3rd-highest
Whitianga 30.3 Feb-06th 1962 3rd-highest
Lumsden 29.5 Dec-16th 1982 Equal 3rd-highest
Kaikohe 29.7 Feb-06th 1973 4th-highest
Wairoa, North Clyde 35.5 Feb-06th 1964 4th-highest
Farewell Spit 27.8 Dec-05th 1971 Equal 4th-highest
Lowest extreme maximum temperatures
Kaikohe 8.8 Jul-13th 1973 Lowest
Ohakune 1.6 Jul-12th 1972 2nd-lowest
Lake Tekapo -3.9 Jul-29th 1928 2nd-lowest
Oamaru 3.8 Jul-12th 1972 2nd-lowest
Lower Retaruke 5.9 Jul-12th 1972 3rd-lowest

19
Takapau Plains 4.0 Jul-12th 1972 3rd-lowest
Arapito 7.0 Jul-13th 1978 3rd-lowest
Rangiora 3.2 Jul-12th 1972 3rd-lowest
Lumsden 0.0 Jul-07th 1982 3rd-lowest
Stratford 5.8 Jul-12th 1972 4th-lowest
Waiau S 3.1 Jul-12th 1974 4th-lowest
Whitianga 10.5 Jul-13th 1971 Equal 4th-lowest
Highest extreme minimum temperatures
Akaroa 21.6 Dec-10th 1978 Highest
Waipara West 22.4 Feb-22nd 1973 Equal 2nd-highest
Hicks Bay 20.5 Mar-12th 1972 3rd-highest
Franz Josef 17.4 Feb-21st 1953 3rd-highest
Secretary Island 17.6 Feb-21st 1988 3rd-highest
Rangiora 20.5 Dec-10th 1972 3rd-highest
Five Rivers 17.7 Dec-05th 1982 3rd-highest
Kaikohe 19.6 Feb-14th 1973 Equal 3rd-highest
Takapau Plains 19.4 Feb-07th 1972 4th-highest
Farewell Spit 18.8 Dec-18th 1972 4th-highest
Lower Retaruke 19.1 Mar-12th 1972 Equal 4th-highest
Lowest extreme minimum temperatures
Five Rivers -8.3 Jul-07th 1982 Lowest
Kaikoura -2.0 Jul-16th 1963 2nd-lowest
Mt Cook -13.7 Jul-29th 1929 2nd-lowest
Oamaru -5.4 Jul-30th 1967 3rd-lowest
Turangi -6.6 Jul-30th 1968 4th-lowest
Appleby -5.6 Jul-30th 1932 4th-lowest
Lake Tekapo -14.6 Jul-29th 1925 4th-lowest
Tiwai Point -4.1 Jul-07th 1970 Equal 4th-lowest
Section 6: Annual rainfall – wetter north, drier south
Areas of above normal rainfall (120-149% of the annual normal) occurred in Auckland, Waikato, Bay
of Plenty, and coastal Canterbury, and north coastal Otago. On the other hand, rainfall was below
normal (50-79% of the annual normal) in much of Southland and interior Otago. Elsewhere, 2017
annual rainfall totals were near normal (within 20% of the annual average).
Five locations observed near-record high annual rainfall totals, while three locations observed record
or near-record low rainfall totals.
The driest rainfall recording locations during 2017 (based on data available at time of writing) were:
Clyde with 278 mm, followed by Cromwell with 280 mm, then Alexandra with 377 mm. Of the
regularly reporting gauges the wettest locations in 2017 were: Cropp River (West Coast, 975 metres
above sea level) with 8662 mm, Tuke River (West Coast, 975 metres above sea level) with 8097 mm,
and North Egmont with 7082 mm. Of the regularly reporting gauges, the wettest locations in 2017
excluding high elevation stations were Milford Sound with 6000 mm, Secretary Island with 4385 mm,
and Franz Josef with 3587 mm.

20
Table 3: Record or near-record annual rainfall totals for the year 2017.
Location Rainfall total (mm)
Percentage of normal
Year records began
Comments
High records or near-records
Whitianga 2426 132 1961 2nd-highest
Te Puke 2401 146 1973 2nd-highest
Oamaru 813 172 1941 2nd-highest
Waiouru 1281 120 1950 3rd-highest
Akaroa 1358 140 1977 3rd-highest
Lower Retaruke 1837 118 1966 4th-highest
Low records or near-records
Tiwai Point 731 65 1970 Lowest
Franz Josef 3587 80 1926 3rd-lowest
Cromwell 280 70 1949 3rd-lowest
The top three daily rainfall totals from regularly reporting gauges in 2017 were 316 mm at Castle
Mount on 24 September, 309 mm at Milford Sound on 31 January, and 260 mm at North Egmont on
8 August.
It is notable that Oamaru recorded 161 mm of rain on 21 July, the wettest day in the town on record
since records began in 1950, but then recorded 163 mm during the following five months combined
(August-December 2017), just 2 mm more than the record one-day total.
Five locations recorded their record or near-record highest 1-day extreme rainfall in 2017.
Table 4: Record or near-record high extreme 1-day rainfall totals that occurred in 2017.
Location 1-day extreme rainfall (mm)
Date Year records began
Comments
Oamaru 161 Jul-21st 1950 Highest
Te Puke 186 Apr-04th 1973 2nd-highest
Auckland (Mangere) 101 Mar-10th 1959 4th-highest
Secretary Island 166 May-02nd 1985 4th-highest
Middlemarch 64 Jul-21st 1896 4th-highest
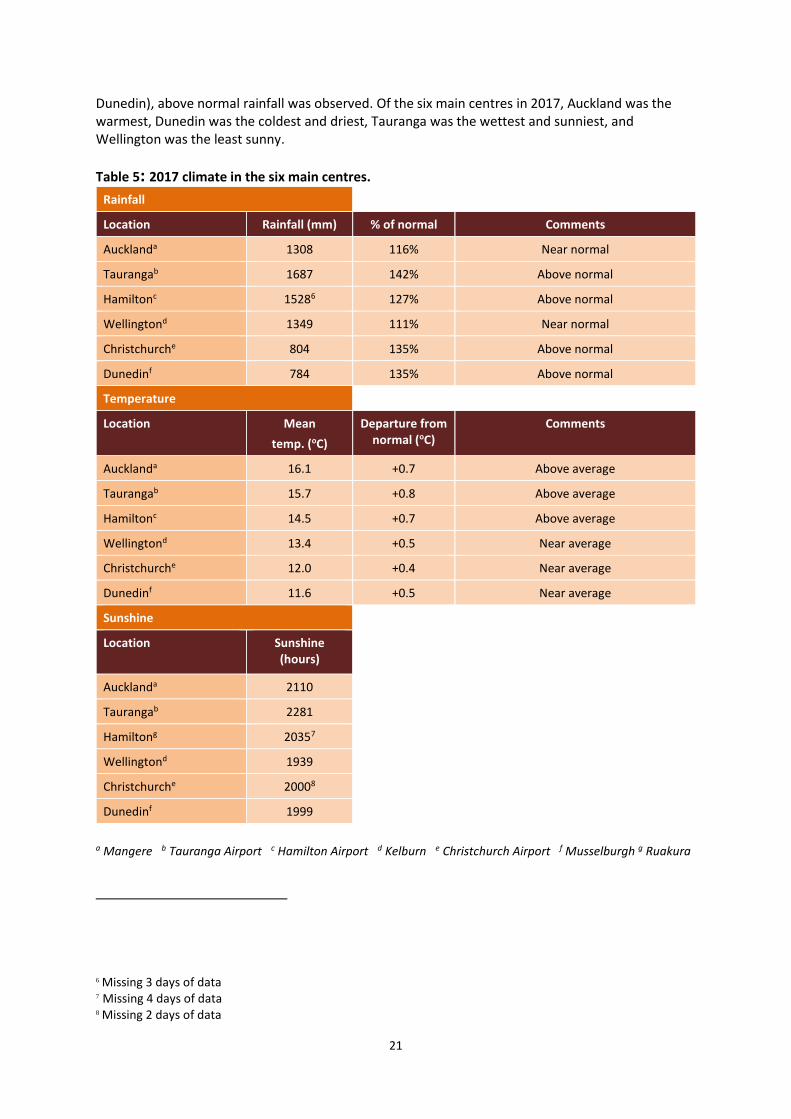
Section 8: 2017 climate in the six main centres
Three out of the six main centres (Auckland, Hamilton, Tauranga) observed above average temperatures during 2017 while the other three (Wellington, Christchurch, Dunedin) had near average temperatures. In four out of the six main centres (Hamilton, Tauranga, Christchurch, and
21
Dunedin), above normal rainfall was observed. Of the six main centres in 2017, Auckland was the warmest, Dunedin was the coldest and driest, Tauranga was the wettest and sunniest, and Wellington was the least sunny.
Table 5: 2017 climate in the six main centres.
Rainfall
Location Rainfall (mm) % of normal Comments
Aucklanda 1308 116% Near normal
Taurangab 1687 142% Above normal
Hamiltonc 15286 127% Above normal
Wellingtond 1349 111% Near normal
Christchurche 804 135% Above normal
Dunedinf 784 135% Above normal
Temperature
Location Mean
temp. (oC)
Departure from normal (oC)
Comments
Aucklanda 16.1 +0.7 Above average
Taurangab 15.7 +0.8 Above average
Hamiltonc 14.5 +0.7 Above average
Wellingtond 13.4 +0.5 Near average
Christchurche 12.0 +0.4 Near average
Dunedinf 11.6 +0.5 Near average
Sunshine
Location Sunshine (hours)
Aucklanda 2110
Taurangab 2281
Hamiltong 20357
Wellingtond 1939
Christchurche 20008
Dunedinf 1999
a Mangere b Tauranga Airport c Hamilton Airport d Kelburn e Christchurch Airport f Musselburgh g Ruakura
6 Missing 3 days of data 7 Missing 4 days of data 8 Missing 2 days of data

22
Section 9: Significant weather and climate events in 2017 This section contains information pertaining to some of the more significant weather and climate
events that occurred in 2017. Note that a more detailed list of significant weather events for 2017
can be found in the Highlights and extreme events section of NIWA’s Monthly Climate Summaries.
These summaries are available online at http://www.niwa.co.nz/climate/summaries.
Drought and low rainfall
It was a very dry start to 2017 across the north and east of the North Island, with much of Northland
receiving just 20-40% of its normal January rainfall and totals that were even more scant across
Gisborne and Hawke’s Bay. With just 2 mm of rain during January, Gisborne had its driest January
since records began in 1905. A mere 5 mm of rain fell in Napier during January, making it the 3rd
driest January on record with records dating back to 1870.
On 3 February 2017, the Minister for Primary Industries officially classified the impact of Northland’s
dry conditions as a medium-scale adverse event under the Primary Sector Recovery Policy. This
announcement came following several months of low rainfall resulting in significant soil moisture
deficits, low pasture covers, and low supplementary feed on Northland farms. During January, the
drought fuelled numerous scrub fires and leading to water shortages around the region.
During November 2017, significant dryness returned to New Zealand, this time mainly in the south.
Oamaru, Waimate, Lincoln, Christchurch (Airport), Waipara, Ashburton, and Hanmer Forest in the
South Island all recorded their driest November on record. Especially noteworthy was Orari, where
no rainfall was recorded during the month. This made it the first time in at least 120 years (since
records began in 1897) that this location observed 0 mm of rainfall during an entire month.
Furthermore, at the end of November, Christchurch a 35-day dry spell, and Lincoln a 35-day dry
spell. Additionally, Lincoln had its 2nd-driest month overall since records began in 1881.
Very dry weather continued during December 2017, leading to the classification of a medium-scale
adverse event in Taranaki and western parts of the Manawatu-Whanganui and Wellington. On 31
December, according to The New Zealand Drought Index, 11 of New Zealand’s 16 geographical
regions were experiencing meteorological drought.
Floods and high rainfall
New Zealand’s climate during 2017 will be remembered chiefly for a string of high impact and
record-setting rainfall events, mainly during the autumn season. The first such event took place
across the upper North Island between 7-12 March and was known colloquially as the Tasman
Tempest. The tempest was followed by the remnants of ex-Tropical Cyclone Debbie during 4-5 April
and then ex-Tropical Cyclone Cook during 12-13 April.
Each of these events and their impact on New Zealand are described in detail below.
The Tasman Tempest
During 7-12 March, the upper North Island experienced three significant heavy rainfall events which
caused major flooding, slips, and damage to homes and infrastructure. These events were caused by

23
a very slow moving subtropical low pressure system in the Tasman Sea (the Tasman Tempest) which
was halted by blocking high pressure system to the south. The clockwise movement of air around
the low pressure system meant that moisture-laden air masses from the tropics were directed
toward New Zealand like an atmospheric river (i.e. a river in the sky). The slow-moving nature of the
system, combined with the moist air, caused very heavy rain to fall over a six-day period.
On 7-8 March, heavy downpours and significant flooding affected the upper North Island,
particularly southeast Auckland and the Coromandel Peninsula. For some areas, the rainfall event
had an average recurrence interval of over 100 years. Early on 8 March, nearly 200 school children
were evacuated from waist deep floodwaters at a school camp (Camp Adair) in the Hunua Ranges,
southeast of Auckland. Major flooding in Clevedon caused significant stock losses from farms in the
area, as well as road closures and evacuations. Farther south, the Coromandel Peninsula was cut off
due to State Highway 25 being closed at both Kopu and south of Tairua, due to flooding and slips.
The towns of Pauanui, Whangamata, Tairua, Onemana, Hikuai, and Kaiaua were affected by severe
flooding and slips, with some evacuations taking place.
On 9 March, Auckland residents were asked by Watercare, the city’s water supply company, to
reduce water consumption for the next three weeks. This request was made because of increased
suspended sediment in the Hunua water supply reservoirs following the 7-8 March rainfall that
caused the Ardmore Water Treatment Plant to run at half of its normal capacity.
On 10-11 March, the second extreme rainfall event occurred. Heavy rain fell in eastern Northland,
Auckland, and Coromandel. Many houses were flooded and thousands of people were without
power. Waiheke Island was affected by flooding and slips in some areas, with a house being left
perched above a slip on a cliff in Oneroa. The Clevedon River flooded again for the second time in
three days, and Kawakawa Bay was cut off by slips.
On 12 March, the third significant rainfall event occurred. Localised downpours hit Auckland, with
many areas being affected by flooding, including Kaukapakapa, Devonport, Parnell, Remuera, Eden
Terrace, Blockhouse Bay, Morningside, Massey, Westgate, Whenuapai, New Lynn, Avondale,
Titirangi, Henderson, Te Atatu, West Harbour, Glen Eden, and Kelston. The area around New Lynn
was the worst affected. Over 320 properties in Auckland were flooded (over 220 in west Auckland),
some in waist deep water. Roads were closed in New Lynn due to major flooding, and people were
trapped in their cars and in retail stores by floodwaters at the intersection of Great North Road and
Clark Street.
Ex-Tropical Cyclone Debbie
During 4-5 April, the remnants of ex-Tropical Cyclone Debbie moved across the North Island. The
weather pattern was similar to the Tasman Tempest that occurred just a few weeks prior, with
strong low pressure over and west of the North Island while a blocking high existed over and east of
the South Island. This atmospheric circulation pattern caused abundant moisture to flow from the
tropics toward New Zealand. This storm will be remembered mostly for the prolific flooding that it
contributed to in the township of Edgecumbe in Bay of Plenty.

24
On 4 April, a mud slip slammed into an apartment building in the Kohimarama suburb of Auckland.
In Whanganui and Rangitikei, a state of emergency was declared due to heavy rain and the threat of
flooding on the Whanganui River. Schools were also closed on 5 April due to the state of emergency.
On 5 April, significant impacts were felt around the Auckland region due to the heavy rainfall. A slip
in Titirangi blocked a shared driveway which trapped five families inside their homes, while power
was knocked out to around 2000 homes, mainly in St. Heliers, Orakei, and Grey Lynn. The Maraetai
and Clevedon areas of Auckland that were hit by floods in early March were again cut off by the
flooded Wairoa River.
Elsewhere on 5 April, more than 170 schools and early childcare centres were closed across the
North Island, mostly in the Manawatu-Whanganui Region, while 150 students were stranded at a
school camp near Port Waikato.
On the morning of 6 April, the entire township of Edgecumbe in Bay of Plenty (about 1600 people)
was evacuated due to rising water on the Rangitaiki River. After a stopbank failure, floodwaters
reached as high as 1.5 metres in the town, and boats were used to help evacuate residents. About
170 residents returned home on 14 April.
Ex-Tropical Cyclone Cook
During 12-13 April, ex-Tropical Cyclone Cook moved from north to south over New Zealand following
a landfall near Whakatane on the evening of the 12th. The storm brought heavy rain and some
flooding to the North Island and parts of the South Island following a destructive impact across areas
in Vanuatu and New Caledonia. At its peak, Cook had sustained winds of 155 km/h.
A state of emergency was declared in Bay of Plenty on 11 April ahead of the approaching storm, with
a state of emergency also declared in Thames-Coromandel on 12 April. All schools in Whakatane,
Kawerau, and Opotiki districts were closed on 12 April. In the Auckland region, all train service
between Papakura and Pukekohe was suspended due to flooding. On the evening of 12 April,
Kerikeri had 75.8 mm of rain in only two hours, or just over half the amount normally received
during all of April.
On 13 April, Cook approached the upper North Island and made landfall near Whakatane. Thames-
Coromandel Civil Defence evacuated everyone from low-lying areas in advance of the storm, and
requested that no one visit the Coromandel Peninsula during and shortly after the event. During the
storm, several slips and downed trees closed State Highway 25 between Tararu and Preece Point,
while diversions were put in place on State Highway 29 due to slips in the Kaimai Range. Additional
road closures occurred on State Highway 2 between Napier and Wairoa, on State Highway 1 south of
Kaikoura, and the Motueka Valley Highway 20 km north of Tapawera.
On 13 April, schools in the eastern Bay of Plenty were closed, and schools in the western Bay of
Plenty were asked to close by 1 pm. In addition, coastal areas of Whakatane were evacuated due to
the threat of storm surge and coastal inundation, and about 120 people stayed at the Whakatane
evacuation centre. The New Zealand Defence Force also placed at least 500 personnel, along with
aircraft and trucks on standby to assist with storm response. Heavy rain associated with Cook on the
night of 13-14 April caused flooding along the Heathcote and Avon Rivers in Christchurch.
25
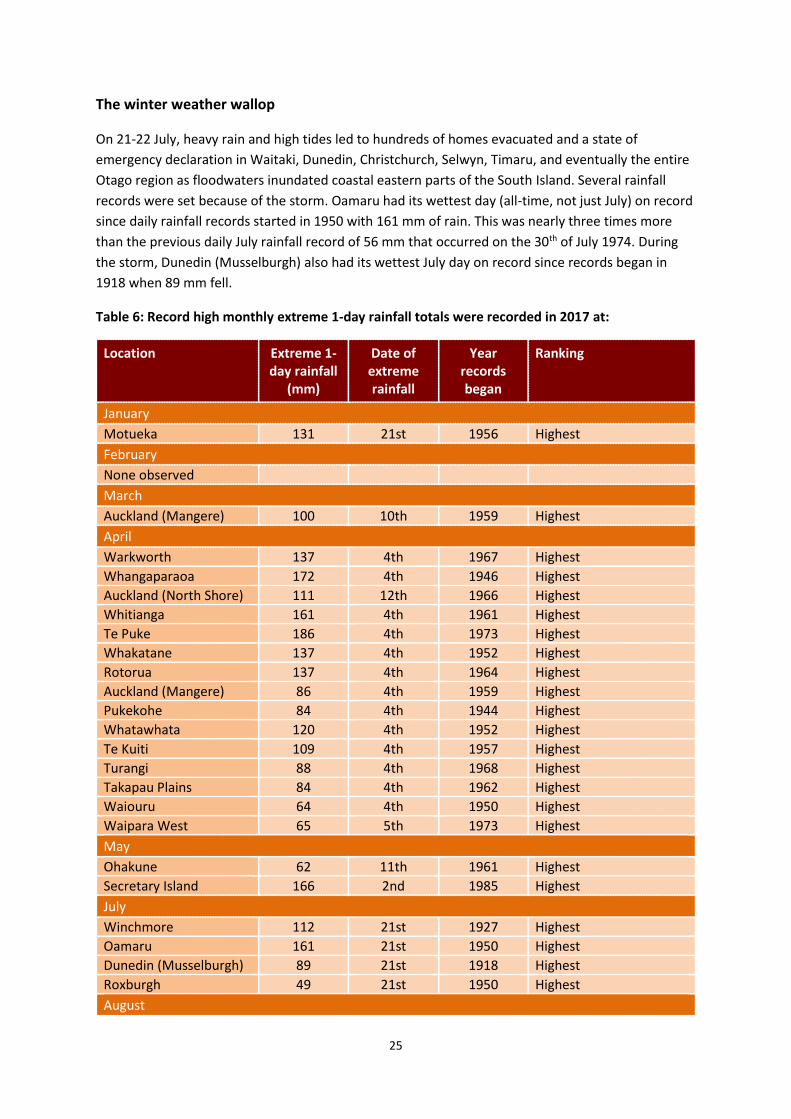
The winter weather wallop
On 21-22 July, heavy rain and high tides led to hundreds of homes evacuated and a state of
emergency declaration in Waitaki, Dunedin, Christchurch, Selwyn, Timaru, and eventually the entire
Otago region as floodwaters inundated coastal eastern parts of the South Island. Several rainfall
records were set because of the storm. Oamaru had its wettest day (all-time, not just July) on record
since daily rainfall records started in 1950 with 161 mm of rain. This was nearly three times more
than the previous daily July rainfall record of 56 mm that occurred on the 30th of July 1974. During
the storm, Dunedin (Musselburgh) also had its wettest July day on record since records began in
1918 when 89 mm fell.
Table 6: Record high monthly extreme 1-day rainfall totals were recorded in 2017 at:
Location Extreme 1-day rainfall
(mm)
Date of extreme rainfall
Year records began
Ranking
January
Motueka 131 21st 1956 Highest
February
None observed
March
Auckland (Mangere) 100 10th 1959 Highest
April
Warkworth 137 4th 1967 Highest
Whangaparaoa 172 4th 1946 Highest
Auckland (North Shore) 111 12th 1966 Highest
Whitianga 161 4th 1961 Highest
Te Puke 186 4th 1973 Highest
Whakatane 137 4th 1952 Highest
Rotorua 137 4th 1964 Highest
Auckland (Mangere) 86 4th 1959 Highest
Pukekohe 84 4th 1944 Highest
Whatawhata 120 4th 1952 Highest
Te Kuiti 109 4th 1957 Highest
Turangi 88 4th 1968 Highest
Takapau Plains 84 4th 1962 Highest
Waiouru 64 4th 1950 Highest
Waipara West 65 5th 1973 Highest
May
Ohakune 62 11th 1961 Highest
Secretary Island 166 2nd 1985 Highest
July
Winchmore 112 21st 1927 Highest
Oamaru 161 21st 1950 Highest
Dunedin (Musselburgh) 89 21st 1918 Highest
Roxburgh 49 21st 1950 Highest
August

26
None observed
September
Hanmer Forest 126 18th 1905 Highest
October
None observed
November
Palmerston North 50 7th 1928 Highest
December
None observed
Temperature extremes
Summer 2016-17 was New Zealand’s coolest summer in five years (since 2011-12) and the fifth-
coolest summer in the last 20 years. The nation-wide average temperature for summer 2016-17 was
16.3°C (0.4°C below the 1981-2010 summer average, using NIWA’s seven-station temperature series
which begins in 1909).
Despite the cooler temperatures overall, several upper North Island locations experienced their
warmest summer day on record, due to the ongoing dryness at the time. These include: Whitianga
(33.0°C, 6th Feb), Whangaparaoa (30.5°C, 7 Feb), and Whangarei (31.8°C, 13 Feb).
On the morning of 22 May, the temperature at Auckland (Western Springs) dipped to 0.4°C, the
coldest temperature since 3 July 2016 (323 days). Many locations in New Zealand dipped below
freezing. The low temperatures were recorded after southerly winds hit the country, followed by
settled anticyclonic conditions.
On 12 and 13 July, a cold southerly outbreak led to many North Island and some eastern South
Island locations observing near-record low maximum temperatures for winter. This included Cape
Reinga, which only reached 10.8°C on the 13 July, the 3rd-equal lowest winter daily maximum
temperature on record.
Winter 2017, which had a nationwide average temperature of 8.9°C (0.5°C warmer than the 1981-
2010 winter average), was New Zealand’s 11th-warmest winter on record according to NIWA’s seven-
station temperature series. Mean temperatures for New Zealand were near average during June and
July. However, the country observed its third-warmest August on record, which brought spring-like
temperatures to end the winter season for many parts of the country.
On 19 and 20 October, a warm northwest Foehn wind caused very warm temperatures in the Otago
region, with a few locations exceeding 30°C. Cromwell recorded 28.6°C on 19 October and 30.0°C on
20 October. The temperature on the 19 October set a new monthly record, and then this new record
was beaten the next day. The 30.0°C reading on the 20 October was also the first time a
temperature of 30.0°C or greater was observed in Cromwell between the months of April and
October and thus was the warmest temperature on record during those months.
On 30 October, another northwest Foehn episode brought warm temperatures to Southland and
Otago. Invercargill recorded its highest October temperature on record (25.9°C), where records
begin in 1905.

27
On 23 November, Cromwell reached 33.3°C, its hottest November (and spring) temperature on
record since records began in 1949. It was the warmest temperature observed in the country since
February 2017. A large ridge of high pressure provided bright sunshine across the interior South
Island, prompting the mercury to soar. In addition, from 19-30 November, Cromwell recorded 12
consecutive days with a maximum temperature at or above 25°C, the longest such streak during
November on record. It beat the previous November record of 8 days during 1974. Finally, Cromwell
observed three days with a maximum temperature of higher than 30°C during November 2017. This
was the most days on record, eclipsing two days in 2010 and two days in 1974.
Table 7: Extremes of high daily maximum temperature in 2017 were recorded at:
Location Extreme maximum
(°C)
Date of extreme
temperature
Year records began
Ranking
January
None observed
February
Whangarei Airport 31.8 13th 1967 Highest
Whangaparaoa 30.5 7th 1982 Highest
Whitianga 33.0 6th 1962 Highest
Whakatane 32.1 7th 1975 Highest
March
None observed
April
Mokohinau Island 24.5 3rd 1994 Highest
Rotorua 25.1 3rd 1964 Highest
Motu 25.7 2nd 1990 Highest
Gisborne 29.7 2nd 1905 Highest
Hastings 30.1 2nd 1965 Highest
Wairoa 28.8 2nd 1964 Highest
Mahia 26.5 2nd 1990 Highest
Secretary Island 23.8 13th 1985 Highest
May
None observed
June
None observed
July
None observed
August
Whitianga 20.1 31st 1962 Highest
Whanganui 21.0 28th 1937 Highest
September
Takapau Plains 22.2 15th 1962 Highest
Hastings 26.6 25th 1965 Highest
Puysegur Point 20.3 24th 1978 Highest
Kaikoura (Middle Creek) 25.7 25th 1963 Highest

28
Manapouri, West Arm Jetty 19.8 24th 1971 Highest
October
Haast 23.3 8th 1949 Highest
Milford Sound 24.1 8th 1934 Highest
Puysegur Point 22.1 30th 1978 Highest
Mt Cook 25.2 19th 1929 Highest
Five Rivers 25.8 19th 1982 Highest
Cromwell 30.0 20th 1949 Highest
Invercargill 25.9 30th 1905 Highest
Tiwai Point 23.7 30th 1970 Highest
South West Cape 21.8 30th 1991 Highest
November
Cromwell 33.3 23rd 1949 Highest
Manapouri 27.5 23rd 1971 Highest
Tara Hills 29.9 23rd 1949 Equal highest
December
Mokohinau 27.8 22nd 1994 Highest
Whitianga 30.2 16th 1962 Highest
Taupo 29.8 6th 1949 Highest
Whatawhata 30.2 6th 1952 Highest
Castlepoint 29.7 5th 1972 Highest
Hawera 25.7 9th 1977 Highest
Farewell Spit 27.8 5th 1971 Highest
Hanmer Forest 34.6 8th 1906 Highest
Mt Cook 30.1 5th 1929 Highest
Ranfurly 31.3 7th 1897 Highest
Lumsden 29.5 16th 1982 Highest
Table 8: Extremes of low daily maximum temperature in 2017 were recorded at:
Location Extreme low
maximum (°C)
Date of extreme
temperature
Year records began
Ranking
January
None observed
March
Whakatane 15.8 8th 1975 Lowest
Port Taharoa 16.8 8th 1974 Lowest
April
None observed
May
Takaka 7.9 20th 1978 Lowest
June
None observed
July
29
Rotorua 5.7 13th 1972 Lowest
Rangiora 3.2 12th 1972 Lowest
Arapito 7.0 13th 1978 Lowest
August
None observed
September
Oamaru 6.1 1st 1972 Lowest
Taumarunui 7.4 10th 1947 Equal lowest
October
None observed
November
None observed
December
None observed
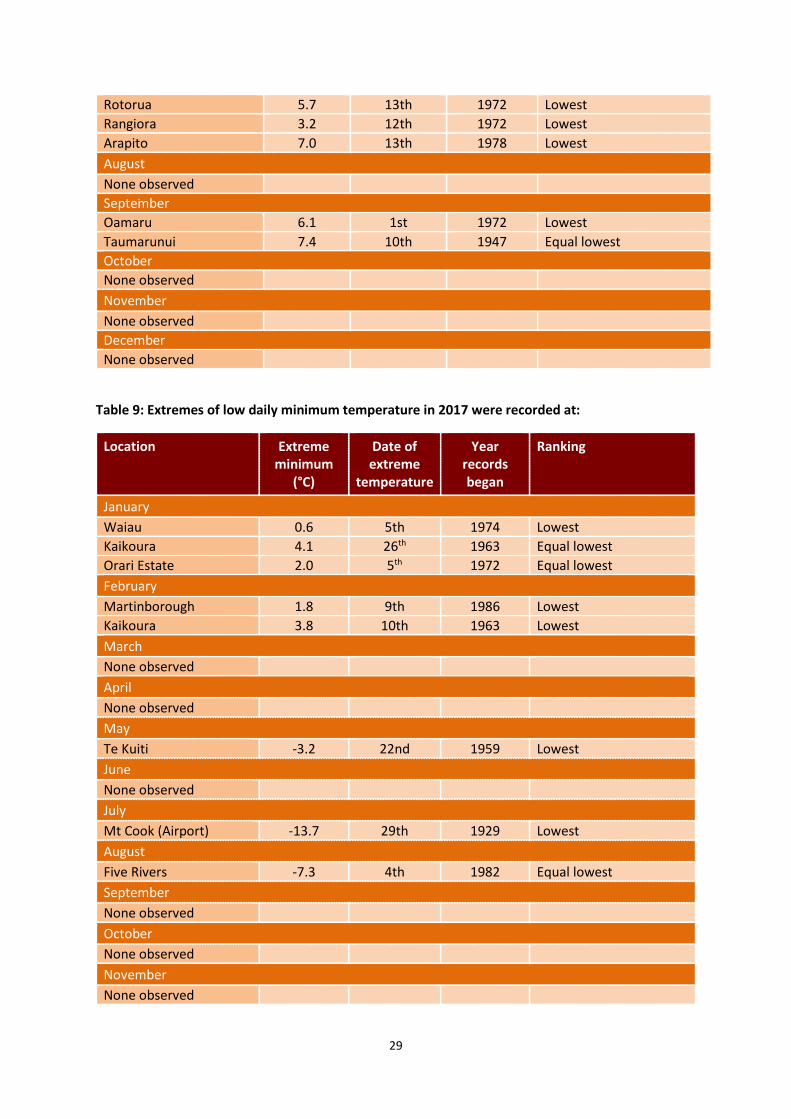
Table 9: Extremes of low daily minimum temperature in 2017 were recorded at:
Location Extreme minimum
(°C)
Date of extreme
temperature
Year records began
Ranking
January
Waiau 0.6 5th 1974 Lowest
Kaikoura 4.1 26th 1963 Equal lowest
Orari Estate 2.0 5th 1972 Equal lowest
February
Martinborough 1.8 9th 1986 Lowest
Kaikoura 3.8 10th 1963 Lowest
March
None observed
April
None observed
May
Te Kuiti -3.2 22nd 1959 Lowest
June
None observed
July
Mt Cook (Airport) -13.7 29th 1929 Lowest
August
Five Rivers -7.3 4th 1982 Equal lowest
September
None observed
October
None observed
November
None observed

30
December
None observed
Table 10: Extremes of high daily minimum temperature in 2017 were recorded at:
Location Extreme high
minimum (°C)
Date of extreme
temperature
Year records began
Ranking
January
None observed
February
Cheviot 21.7 1st 1982 Highest
March
None observed
April
Cape Reinga 19.9 3rd 1971 Highest
Kerikeri 21.0 5th 1952 Highest
Kaikohe 19.6 4th 1973 Highest
Whangarei 20.9 4th 1967 Highest
Mokohinau Island 20.7 4th 1994 Highest
Whangaparaoa 19.9 4th 1982 Highest
Auckland (Whenuapai) 20.0 4th 1951 Highest
Port Taharoa 19.5 3rd 1974 Highest
Mahia 17.9 3rd 1990 Highest
Secretary Island 15.9 1st 1988 Highest
Auckland (Airport) 20.6 4th 1961 Equal highest
May
None observed
June
None observed
July
None observed
August
None observed
September
Appleby 14.2 26th 1941 Highest
Medbury 14.7 25th 1927 Highest
Waiau School 16.4 25th 1974 Highest
Waipara West 16.7 25th 1973 Highest
Le Bons Bay 13.8 25th 1984 Highest
October
Secretary Island 14.3 31st 1988 Highest
November
Farewell Spit 16.8 30th 1972 Highest
December
Paraparaumu 19.6 9th 1972 Highest

31
Farewell Spit 18.8 18th 1972 Highest
Greymouth 18.1 17th 1972 Highest
Secretary Island 16.7 7th 1988 Highest
Kaikoura 20.4 10th 1972 Highest
Akaroa 21.6 10th 1978 Highest
Le Bons Bay 20.2 9th 1984 Highest
Manapouri (West Arm Jetty) 16.1 3rd 1972 Highest
Five Rivers 17.7 5th 1982 Highest
Nugget Point 16.4 3rd 1972 Highest

32
Strong winds
For ‘central New Zealand’ for the year as a whole (and using the 62 km/hr threshold), 2017 was less
windy than the 1981-2010 climatological average (Figure 3)9, with only 29 days exceeding 62 km/hr
average 9am wind speed between Auckland and Christchurch (compared to the climatological
number of 35.3 days). For the last three months of the year, only two gale days were experienced
(compared to 11.3 days on average), both in October. However, January and September were
unusually windy months. The four windiest years in this record are: 1988 (1st, 65 days), 2002 (2nd, 55
days), 1982 (3rd, 54 days), and 2014 (4th, 53 days).
Figure 3: (above) Annual number of ‘windy days’ for central New Zealand, 1966 to 2017, with horizontal line indicating the 1981-2010
average (35.3 days); (Bottom) Number of ‘windy days’ by month, comparing the months of 2017 (blue histogram) with the 1981-2010
average (green).
On 19 January, the “bomb low”10 that hit central and southern New Zealand caused damaging high
winds in Wellington and parts of the South Island. State Highway 2 at Rimutaka Hill was closed for a
9 In these graphs, a ‘windy day’ is defined as one where the daily 9am pressure difference corresponds to a
geostrophic wind speed exceeding a specified threshold (either westerly or easterly). Thus, it is a broad
measure, and won’t capture short-lived southerlies or local wind enhancements. The threshold selected is 62
km/hr. (Note: On the Beaufort wind scale, a mean speed of 62 km/hr or greater corresponds to Gale Force or
greater). The wind index used is: Z1 (Auckland minus Christchurch), referred to as “Central NZ” in Figure 3. 10 A ‘bomb low’ is a rapidly deepening low pressure system which causes very strong winds, heavy rain and cool temperatures.
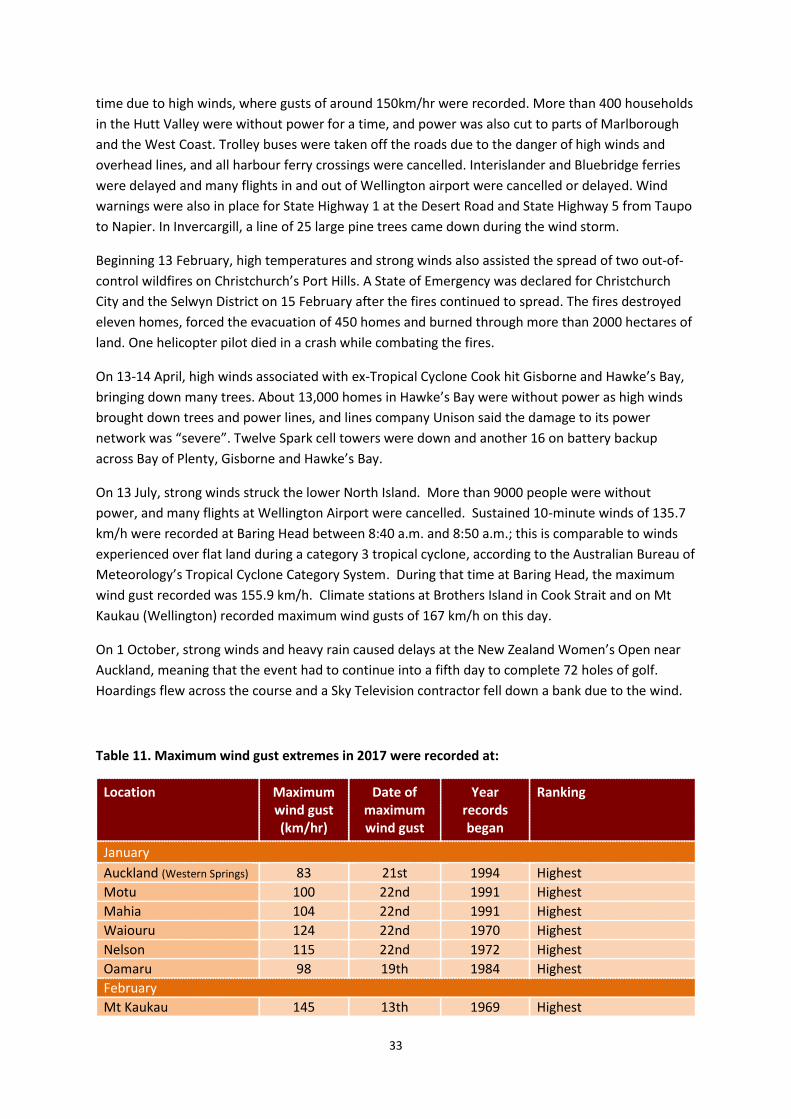
33
time due to high winds, where gusts of around 150km/hr were recorded. More than 400 households
in the Hutt Valley were without power for a time, and power was also cut to parts of Marlborough
and the West Coast. Trolley buses were taken off the roads due to the danger of high winds and
overhead lines, and all harbour ferry crossings were cancelled. Interislander and Bluebridge ferries
were delayed and many flights in and out of Wellington airport were cancelled or delayed. Wind
warnings were also in place for State Highway 1 at the Desert Road and State Highway 5 from Taupo
to Napier. In Invercargill, a line of 25 large pine trees came down during the wind storm.
Beginning 13 February, high temperatures and strong winds also assisted the spread of two out-of-
control wildfires on Christchurch’s Port Hills. A State of Emergency was declared for Christchurch
City and the Selwyn District on 15 February after the fires continued to spread. The fires destroyed
eleven homes, forced the evacuation of 450 homes and burned through more than 2000 hectares of
land. One helicopter pilot died in a crash while combating the fires.
On 13-14 April, high winds associated with ex-Tropical Cyclone Cook hit Gisborne and Hawke’s Bay,
bringing down many trees. About 13,000 homes in Hawke’s Bay were without power as high winds
brought down trees and power lines, and lines company Unison said the damage to its power
network was “severe”. Twelve Spark cell towers were down and another 16 on battery backup
across Bay of Plenty, Gisborne and Hawke’s Bay.
On 13 July, strong winds struck the lower North Island. More than 9000 people were without
power, and many flights at Wellington Airport were cancelled. Sustained 10-minute winds of 135.7
km/h were recorded at Baring Head between 8:40 a.m. and 8:50 a.m.; this is comparable to winds
experienced over flat land during a category 3 tropical cyclone, according to the Australian Bureau of
Meteorology’s Tropical Cyclone Category System. During that time at Baring Head, the maximum
wind gust recorded was 155.9 km/h. Climate stations at Brothers Island in Cook Strait and on Mt
Kaukau (Wellington) recorded maximum wind gusts of 167 km/h on this day.
On 1 October, strong winds and heavy rain caused delays at the New Zealand Women’s Open near
Auckland, meaning that the event had to continue into a fifth day to complete 72 holes of golf.
Hoardings flew across the course and a Sky Television contractor fell down a bank due to the wind.
Table 11. Maximum wind gust extremes in 2017 were recorded at:
Location Maximum wind gust (km/hr)
Date of maximum wind gust
Year records began
Ranking
January
Auckland (Western Springs) 83 21st 1994 Highest
Motu 100 22nd 1991 Highest
Mahia 104 22nd 1991 Highest
Waiouru 124 22nd 1970 Highest
Nelson 115 22nd 1972 Highest
Oamaru 98 19th 1984 Highest
February
Mt Kaukau 145 13th 1969 Highest

34
Wellington (Kelburn) 139 13th 1972 Highest
March
Paeroa 98 8th 1991 Highest
April
Te Puke 67 13th 1987 Highest
Whakatane 117 13th 1974 Highest
Motu 111 13th 1991 Highest
Hawera 100 30th 1986 Highest
Oamaru 96 17th 1984 Highest
Lauder 122 28th 1981 Highest
May
Kaikohe 89 20th 1986 Highest
June
Farewell Spit 102 14th 1973 Equal highest
July
Baring Head 156 13th 1991 Highest
Whanganui 119 13th 1977 Highest
Oamaru 91 21st 1984 Highest
Queenstown 93 21st 1972 Equal highest
August
Hokitika 122 6th 1972 Highest
September
Hawera 102 8th 1986 Highest
Auckland (North Shore) 74 28th 1994 Equal highest
October
Kaikohe 104 1st 1986 Highest
November
Hokitika 107 7th 1972 Highest
Richmond 95 8th 1972 Highest
December
None observed
Snow
On 20 May, a southerly outbreak delivered the first significant snowfall to low elevations for the
year. Snow settled to approximately 200 metres above sea level in southern parts of the South
Island, with snow flurries falling to near sea level. Around 13 cm of snow was recorded in Kingston,
and numerous flights were cancelled or delayed in Queenstown due to adverse weather and snow
on the runway. Several southern roads were closed due to snow, including State Highway 1
between Dunedin and Waitati and State Highway 87 from Outram to Sutton. Snow drifts of 70-90
cm were observed at The Remarkables ski area near Queenstown, although some exposed slopes
were stripped bare of snow due to strong winds that accompanied the snowfall.
On 1 July, up to 30 vehicles were towed after State Highway 8 between Twizel and Fairlie, and State
Highway 80 between Aoraki-Mt Cook and Ben Ohau, were closed due to snow. Snowfall also cut
road access into Tekapo and Mt Cook, and contributed to two buses sliding off the road. Several day
visitors to Tekapo were forced to stay for the night due to road closures.

35
On 8 July, black ice was widespread across the lower South Island. Emergency services responded to
34 crashes on roads in Southland and Otago. Two cars rolled down banks on Saturday evening, one
near Balclutha and the other at Okaramio, near Blenheim. Ice on the runway at Invercargill airport
caused flight cancellations and a diversion.
On 13 July, the Desert Road and other sections of State Highways in the Central Plateau were closed
due to snow. The NZ Defence Force came to the rescue after a group of Mana bus passengers were
stranded near the army camp in Waiouru due to road closures. They stayed overnight at the
barracks. Powerco said several thousand customers went without power overnight after heavy
snowfalls downed lines and flooding created havoc across the company's network. Damage was
spread across a large swathe of the lower North Island including Wairarapa, Manawatu, Whanganui,
Taranaki, Ohakune, Waiouru and Taihape.
Tornadoes and waterspouts
On 11 January, the area around Cromwell was affected by up to four mini tornadoes (known as “dust
devils”). These are caused by strong convective heating of the near-surface air. Powerlines and
fences were blown down, windows were smashed, several trailers were overturned, and building
materials were carried up to 500 m away.
On 6 September, a small tornado hit Awatuna in Westland District, ripping the roof off one building
and throwing it about 100 metres. There was also lighter damage to several nearby homes and
sheds, along with several damaged road signs. The tornado also cut power and water to the
township.
For media comment, please contact:
Mr Chris Brandolino
Principal Scientist – Forecasting, NIWA National Climate Centre
Tel. 09 375 6335, Mobile (027) 886 0014
For climate data, please contact:
Mr Ben Noll
Meteorologist, NIWA Auckland
Tel. 09 375 6334, Mobile (027) 405 3052
Note for editors:
Climate measurements have been made in New Zealand for about 150 years, with reasonable
coverage of reliable data from at least the early 1900s. NIWA makes its raw climate data publicly
available for free on-line. Journalists are advised, however, to take extreme care when
interpreting trends from raw data to ensure they have not been compromised by changes in site
location, urbanisation, exposure, or instrumentation over time. If in any doubt, please call us.
© Copyright NIWA 2018. All rights reserved

36
Acknowledgement of NIWA as the source of this information and all forms of media associated
with it is required.