wdscs.yolasite.comwdscs.yolasite.com/resources/7th grade excel expense budget.docx · web...
TRANSCRIPT

Excel Part 1Simple Excel Budget with Chart:
.
Expense Budget Instructions:
1. Open an Excel spreadsheet and save as Expense Budget 20_ _ (year).
2. Enter your chart title in cell C1.
3. Click in cell C1 and drag mouse to cell H1. In the Home tab, alignment group, find and apply "Merge and Center"
to the title.
4. With the title still selected, on the Home tab, Font group, apply a new font color, font size and font style.
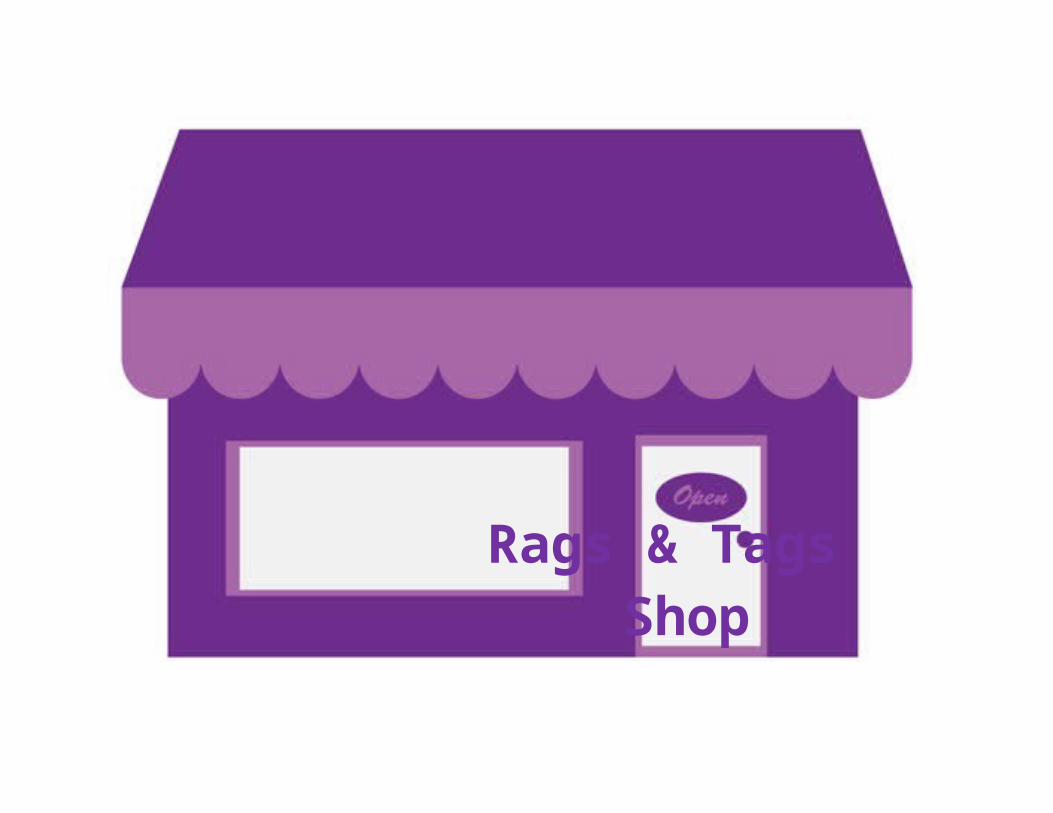
5. Visit the Rags & Tags Shop and make a few selections.
6. Enter Items to purchase beginning in cell A3 ending in cell A7. Enter cost values beginning in cell B3 ending in
cell B7.
7. Type the word "Total" in cell A9.

8. Click in cell B9 and the click the Formulas tab on the menu bar. Find and click "AutoSum" in the Function Library
group and then press enter to get the total.
9. Click in cell B3 and drag the mouse down to cell B9. On the Home tab, number group, find and click the $ sign to
convert the number values to currency.
10. Click in cell A3 and drag mouse down to select all the labels down to cell A9. Continue to drag across to select
all the numerical values on column B.
11. Create a column chart. Go to Insert tab > Charts group > Column > 2D Column.
12. Format the chart. Click on the chart. Go to Design tab > Chart layouts group > choose a chart layout that will
produce a chart title and horizontal and vertical axis labels.
13. Fill in the appropriate text for the Chart Title and the axis. "Clothes Expense, Cost and Clothes".
14. Click once on the chart to select it. Click a second time on an individual chart piece to select it for a color change.
Right click on the selected chart piece and choose Format Data Point. Go to Fill > Solid Fill > Color. Choose a
color for your chart piece. Repeat process for each chart piece.

Excel Part 2Excel Shopping Budget with Chart:
Follow these instructions to make your Excel budget and chart.
1. Open an Excel spreadsheet and save as Shopping Budget 20_ _ (year).
2. Enter your chart title in cell C1.
3. Click in cell C1 and drag mouse to cell H1. In the Home tab, alignment group, find and apply "Merge and Center"
to the title.
4. With the title still selected, on the Home tab, Font group, apply a new font color, font size and font style.
5. Enter "Allowance" in cell A3. Enter "Shopping Expenses" in cell A5.
6. Visit the Rags & Tags Shop and make a few selections.
7. Enter Items to purchase beginning in cell A6 ending in cell A10. Enter 200.00 in cell B3. Enter cost values
beginning in cell B6 ending in cell B10.
8. Type "Total Expenses" in cell A12. Type "Money Left Over" in cell A14.

9. Click in cell B12 and then click the Formulas tab on the menu bar. Find and click "AutoSum" in the Function
Library group and then press enter to get the expenses total.
10. Click in cell B14 and enter the formula =B3-B12. Press Enter.
11. Click in cell B3 and drag the mouse down to cell B14. On the Home tab, number group, find and click the $ sign
to convert the number values to currency.
12. Click in cell A6 and drag mouse down to select all the labels down to cell A10. Continue to drag across to select
the adjacent numerical values in column B.
13. Create a Pie chart. Go to Insert tab > Charts group > Pie > 3D Pie.
14. Click on the chart. Go to Design tab > Chart layouts group > choose a chart layout that will produce labels and
number values in the pie pieces.
15. Add a Chart Title. Click on the chart.Go to Layout tab > Labels group > choose Chart title "Above Chart". Enter
your chart's title.
16. Click once on the chart to select it. Click a second time on an individual chart piece to select it for a color change.
Right click on the selected chart piece and choose Format Data Point. Go to Fill > Solid Fill > Color. Choose a
color for your chart piece. Repeat process for each chart piece.
17. Deselect the chart. Go to Print preview. The chart may be partially cut off if it overlaps column I or J. Choose
Page Setup and change the layout to landscape. Print.

Rags & Tags Shop