watershed implementation plan for the upper salt … watershed implementation plan for the upper...
TRANSCRIPT

Watershed Implementation Plan for the Upper Salt Fork of the Vermilion River
Champaign and Vermilion Counties, Illinois
Prepared by the
Salt Fork Steering Committee of the
Champaign County Soil and Water Conservation District
May 2007
With funding provided by the Illinois Environmental Protection Agency
with additional assistance provided by:
Salt Fork Technical Advisory Committee, USDA-Natural Resources Conservation Service, and
Association of Illinois Soil and Water Conservation Districts
May 2007
2
TABLE OF CONTENTS
FOREWORD ........................................................................................................................................... 4 INTRODUCTION ..................................................................................................................................... 6
I. Mission Statement ...................................................................................................................... 8 II. Watershed Description .............................................................................................................. 9 III. Watershed Activities .............................................................................................................. 12
Early History........................................................................................................................... 12 Drainage and Agriculture....................................................................................................... 13 Urban Development ................................................................................................................ 14 Protecting Our Natural Resources ......................................................................................... 15 Recent Events .......................................................................................................................... 17
Channel Maintenance.................................................................................................. 17 2002 Ammonia Spill ................................................................................................... 18 Total Maximum Daily Load Development................................................................. 19
IV. Watershed Resource Inventory............................................................................................ 20
Water Quality.......................................................................................................................... 20 Available Monitoring Data ......................................................................................... 20 Conservation Practices................................................................................................ 25
Conveyance of Flow................................................................................................................ 29 Maps............................................................................................................................ 29 Flow Data.................................................................................................................... 32 Stream Bank Condition and Impedances to Flow....................................................... 32 Computer Modeling.................................................................................................... 32
Land Use Management ........................................................................................................... 33 Recreation ............................................................................................................................... 34
Urbana Park District ................................................................................................... 35 Recreation Trail .......................................................................................................... 35 Homer Lake Forest Preserve....................................................................................... 36
Fish and Other Wildlife .......................................................................................................... 37 Fish.............................................................................................................................. 37 Birds............................................................................................................................ 37 Other Animals............................................................................................................. 39 Trees and Plants .......................................................................................................... 39 Terrestrial Habitat Areas............................................................................................. 39
Landowner Education ............................................................................................................. 40 V. Problem Statements ................................................................................................................ 43
Water Quality.......................................................................................................................... 43 Flooding and Channel Stewardship........................................................................................ 47 Land Use Management ........................................................................................................... 49 Recreation ............................................................................................................................... 49 Terrestrial Wildlife.................................................................................................................. 50

May 2007
3
VI. Goals and Objectives ............................................................................................................. 51 Water Quality.......................................................................................................................... 51
Goals ........................................................................................................................... 51 Current Loads.............................................................................................................. 52 Data Needs for Aquatic Wildlife Habitat Studies....................................................... 54 Water Quality Objectives............................................................................................ 55
Flooding and Channel Stewardship........................................................................................ 55 Channel Maintenance.................................................................................................. 55 Stream Bank Erosion .................................................................................................. 56 Watershed Storage ...................................................................................................... 58 Computer Modeling Needs ......................................................................................... 58 Flooding and Channel Stewardship Goals and Objectives ......................................... 59
Terrestrial Wildlife.................................................................................................................. 60 Public Information and Education.......................................................................................... 60
VII. Implementation Strategies/Alternatives ............................................................................ 61
Water Quality.......................................................................................................................... 61 Nutrient and Sediment Load Reduction...................................................................... 61 Homer Lake ................................................................................................................ 64 Aquatic Wildlife Habitat............................................................................................. 64 Additional Monitoring ................................................................................................ 66
Flooding and Channel Stewardship........................................................................................ 66 Channel Maintenance.................................................................................................. 66 Stream Bank Erosion .................................................................................................. 67 Watershed Storage ...................................................................................................... 67 Computer Modeling Needs ......................................................................................... 67
Terrestrial Wildlife.................................................................................................................. 68 Public Information and Education.......................................................................................... 69
VIII. Cost Summary .................................................................................................................... 70 IX. Selection of Implementation Strategies ............................................................................... 72 X. Measuring Progress/Success .................................................................................................. 73
CHALLENGES ...................................................................................................................................... 75 REFERENCES....................................................................................................................................... 76 APPENDIX.......................................................................................................................................... A-1
Problems & Objectives Identified by Salt Fork Steering & Technical Advisory Committees .... A-2 Channel Stewardship Guidelines .................................................................................................. A-6 Fish Inventory from IEPA Intensive Basin Surveys................................................................... A-12 Fish Survey of Boneyard Creek in 2006..................................................................................... A-13 Mammal and Tree Inventory ...................................................................................................... A-15 Mussel Inventory ........................................................................................................................ A-16 Bird Inventory............................................................................................................................. A-24 Boneyard Creek Bibliography .................................................................................................... A-47
May 2007
4
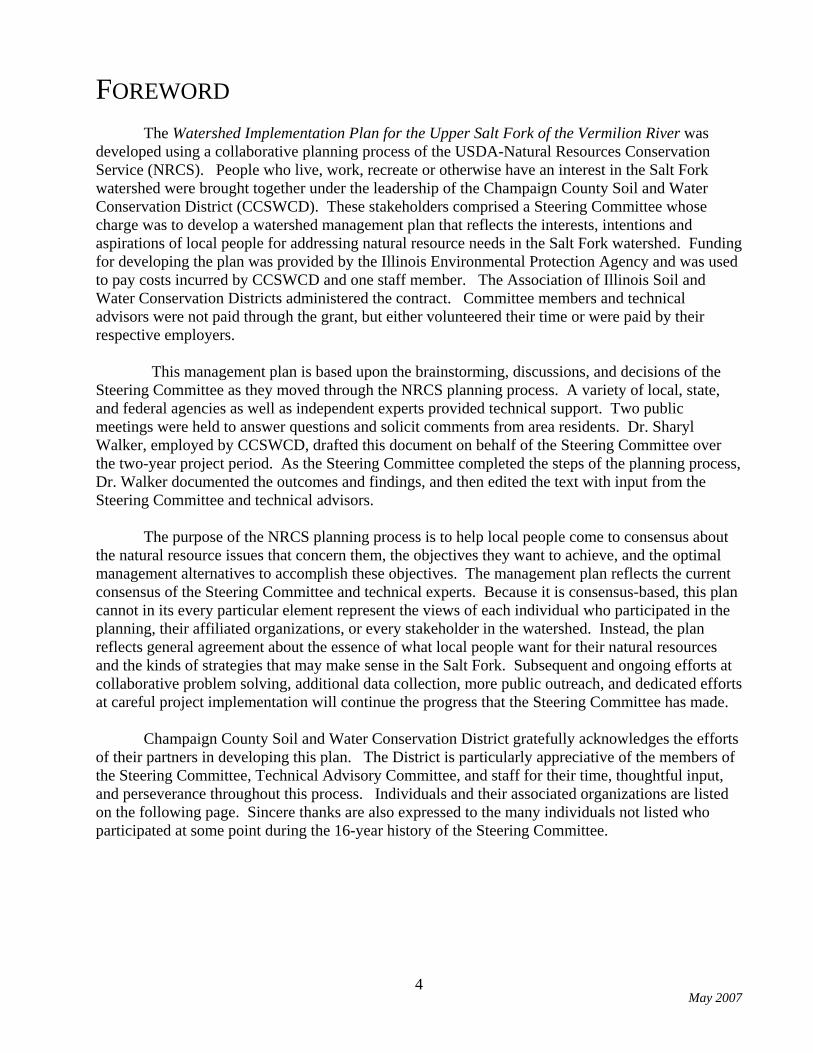
FOREWORD
The Watershed Implementation Plan for the Upper Salt Fork of the Vermilion River was developed using a collaborative planning process of the USDA-Natural Resources Conservation Service (NRCS). People who live, work, recreate or otherwise have an interest in the Salt Fork watershed were brought together under the leadership of the Champaign County Soil and Water Conservation District (CCSWCD). These stakeholders comprised a Steering Committee whose charge was to develop a watershed management plan that reflects the interests, intentions and aspirations of local people for addressing natural resource needs in the Salt Fork watershed. Funding for developing the plan was provided by the Illinois Environmental Protection Agency and was used to pay costs incurred by CCSWCD and one staff member. The Association of Illinois Soil and Water Conservation Districts administered the contract. Committee members and technical advisors were not paid through the grant, but either volunteered their time or were paid by their respective employers.
This management plan is based upon the brainstorming, discussions, and decisions of the Steering Committee as they moved through the NRCS planning process. A variety of local, state, and federal agencies as well as independent experts provided technical support. Two public meetings were held to answer questions and solicit comments from area residents. Dr. Sharyl Walker, employed by CCSWCD, drafted this document on behalf of the Steering Committee over the two-year project period. As the Steering Committee completed the steps of the planning process, Dr. Walker documented the outcomes and findings, and then edited the text with input from the Steering Committee and technical advisors.
The purpose of the NRCS planning process is to help local people come to consensus about the natural resource issues that concern them, the objectives they want to achieve, and the optimal management alternatives to accomplish these objectives. The management plan reflects the current consensus of the Steering Committee and technical experts. Because it is consensus-based, this plan cannot in its every particular element represent the views of each individual who participated in the planning, their affiliated organizations, or every stakeholder in the watershed. Instead, the plan reflects general agreement about the essence of what local people want for their natural resources and the kinds of strategies that may make sense in the Salt Fork. Subsequent and ongoing efforts at collaborative problem solving, additional data collection, more public outreach, and dedicated efforts at careful project implementation will continue the progress that the Steering Committee has made.
Champaign County Soil and Water Conservation District gratefully acknowledges the efforts of their partners in developing this plan. The District is particularly appreciative of the members of the Steering Committee, Technical Advisory Committee, and staff for their time, thoughtful input, and perseverance throughout this process. Individuals and their associated organizations are listed on the following page. Sincere thanks are also expressed to the many individuals not listed who participated at some point during the 16-year history of the Steering Committee.

May 2007
5
Steering Committee (in alphabetical order) Ansel Anderson – Izaak Walton League Tim Bachman – Urbana-Champaign Sanitary District Stanley Balbach – drainage district attorney Brad Bennett – City of Urbana Eleanor Blackmon – City of Champaign/CCSWCD Board Clark Bullard – Prairie Rivers Network Beth Chato – Audubon Society Jim Cottrell – drainage district attorney Lloyde Esry – St. Joseph Drainage District #3 Don Flessner – Saline Branch drainage District Tami Fruhling-Voges – City of St. Joseph Robert Holmes – United States Geological Survey Joseph Irle – Beaver Lake Drainage District Kenneth Kesler – CCSWCD Board Kent Krukewitt – Drainage District #1 Town of Sidney R. W. (“Larry”) Larimore – Izaak Walton League, ret. Illinois Natural History Survey Derek Liebert – Urbana Park District Steve Moser – Champaign County Board John McMahon – Salt Fork River Partners Dan Olson – Champaign County Forest Preserve District Pete Passarelli – Village of Rantoul Larry Pridemore – Village of Sidney Larry Rishel – Landowner Sue Smith – Salt Fork River Partners (former Steering Committee member) Brad Uken – Champaign County Farm Bureau Technical Advisory Committee (in alphabetical order) Jamie Alderks – USDA-Natural Resources Conservation Service Ansel Anderson – Izaak Walton League Tim Bachman – Urbana-Champaign Sanitary District Brad Bennett – City of Urbana Tom Berns – Berns, Clancy and Associates Eleanor Blackmon – City of Champaign/CCSWCD Board Howard Brown – Growmark Kevin Donoho – USDA-Natural Resources Conservation Service Robert Holmes – United States Geological Survey Tim Kelly – Illinois Environmental Protection Agency Wayne Kinney – Midwest Streams, Inc. Paul Krone – USDA-Natural Resources Conservation Service Bill Lewis – USDA-Natural Resources Conservation Service Gary Lutterbie – Illinois Department of Natural Resources Kent Mitchell – ret. University of Illinois Dan Newhouse – Illinois Department of Natural Resources Dan Olson – Champaign County Forest Preserve District Susan Monte – Champaign County Planning and Zoning Jeff Roseman – Champaign County Planning and Zoning Karl Visser – Clark Dietz, Inc. Staff (in alphabetical order) Kevin Donoho –USDA-Natural Resources Conservation Service Bill Lewis – USDA-Natural Resources Conservation Service Jim Nelson – Association of Illinois Soil and Water Conservation Districts Jody Rendziak – USDA-Natural Resources Conservation Service Bruce Stikkers – Champaign County Soil and Water Conservation District Sharyl Walker – Champaign County Soil and Water Conservation District

May 2007
6
Watershed Implementation Plan for the Upper Salt Fork of the Vermilion River Champaign and Vermilion Counties, Illinois
INTRODUCTION
The Salt Fork in Champaign and Vermilion Counties is both a utilitarian river and a thing of beauty. It plays an important role both in the ecosystem and the local economy and is worthy of protection. We, as its stewards, recognize the need to address current problems within the watershed as well as to be mindful of what gets passed downstream to other communities; we recognize that doing so not only protects our livelihoods, but will also help us avoid future restrictive legislation. We also recognize that while the Salt Fork is worthy of our attention and stewardship, that from a global perspective, we are very fortunate to have the luxury of addressing the relatively minor problems at hand.
It has long been a goal of the Champaign County Soil and Water Conservation District to have a comprehensive watershed plan for the Salt Fork. A steering committee was established in 1990. The planning process has had several starts over the years, but the gears of funding, staff, politics, and public interest never quite meshed until recently. In 2005, the Illinois Environmental Protection Agency (IEPA) awarded a grant to the District to develop a watershed implementation plan for the Salt Fork. This provided the opportunity to convert 16 years’ worth of meetings and debate into a comprehensive plan. Thanks are due to the citizens of Illinois who funded the preparation of this document, as well as to the many persons (representing themselves and a very long list of public and private organizations) who faithfully attended meetings and shared their opinions and expertise.
This document is organized according to guidelines provided by the Association of Illinois Soil and Water Conservation Districts, the managing agency for this project. It generally follows the nine steps outlined in the USDA-Natural Resources Conservation Service’s three-phase, resource planning process (http://www.nedc.nrcs.usda.gov/fotg/module4/module4a.html), shown in Figure 1.
The planning process is iterative as indicated by the double-headed arrows in Figure 1: once strategies are implemented and evaluated, the process begins again and new or refined strategies are developed. The ten components of this watershed plan document the first iteration of the first two phases of this process and provide a sketch for carrying out the third. It is understood that this document will always be subject to update as evaluation and additional inventory reveal the need. The numbers appearing in this document are particularly subject to revision and are presented for planning purposes ONLY, unless otherwise indicated. The Salt Fork Steering Committee makes no claims as to the scientific reliability of these numbers and strongly discourages their citation outside of their immediate planning context.

May 2007
7
Implement Plan
Phase IPhase I
Phase IIIPhase III
Phase IIPhase II
The Resource Planning ProcessUSDA-Natural Resources Conservation Service
Know the Planning Area1. Identify resource concerns2. Determine objectives3. Conduct inventories4. Analyze resource data
Make Decisions5. Develop alternatives6. Evaluate alternatives7. Make decisions
Implement & Evaluate 8. Implement the plan9. Evaluate the plan
USDA-NRCS Champaign, Illinois. September 1999.
Figure 1. The Three-Phase Resource Planning Process (courtesy USDA-NRCS).

May 2007
8
PLAN COMPONENTS I. Mission Statement
The mission of the Salt Fork Steering Committee is to develop a scientifically-sound strategy to implement cost-effective practices and educational programs sufficient to ensure that all waters of the Salt Fork will meet the needs of future generations. In so doing, the Committee recognizes the role of the Salt Fork in the ecosystem, the economy, recreational activities, and local livelihoods and will recommend actions that protect and enhance these functions.
Aerial photography (March 28, 2005) illustrating the multiple functions of the Salt Fork. Note agricultural drainage ditches, farmland, residential areas, Homer Lake, and the Salt Fork River itself. (Photography courtesy Champaign County Regional Planning Commission.)
May 2007
9
II. Watershed Description
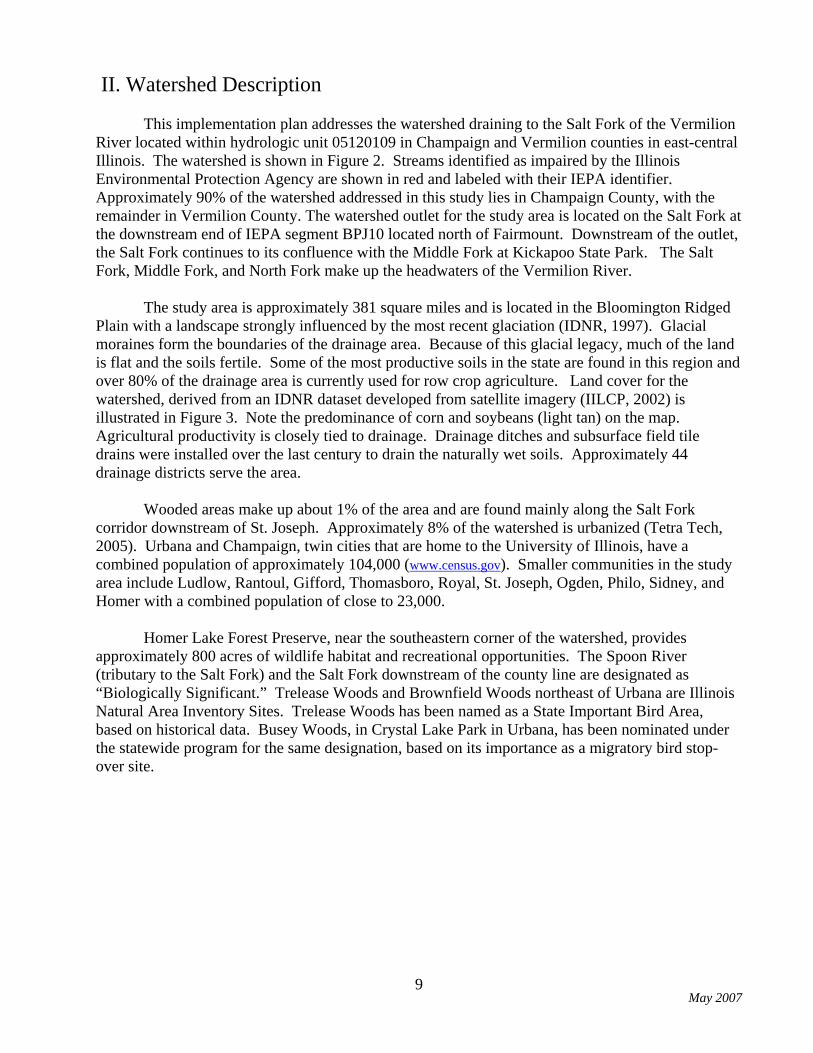
This implementation plan addresses the watershed draining to the Salt Fork of the Vermilion River located within hydrologic unit 05120109 in Champaign and Vermilion counties in east-central Illinois. The watershed is shown in Figure 2. Streams identified as impaired by the Illinois Environmental Protection Agency are shown in red and labeled with their IEPA identifier. Approximately 90% of the watershed addressed in this study lies in Champaign County, with the remainder in Vermilion County. The watershed outlet for the study area is located on the Salt Fork at the downstream end of IEPA segment BPJ10 located north of Fairmount. Downstream of the outlet, the Salt Fork continues to its confluence with the Middle Fork at Kickapoo State Park. The Salt Fork, Middle Fork, and North Fork make up the headwaters of the Vermilion River.
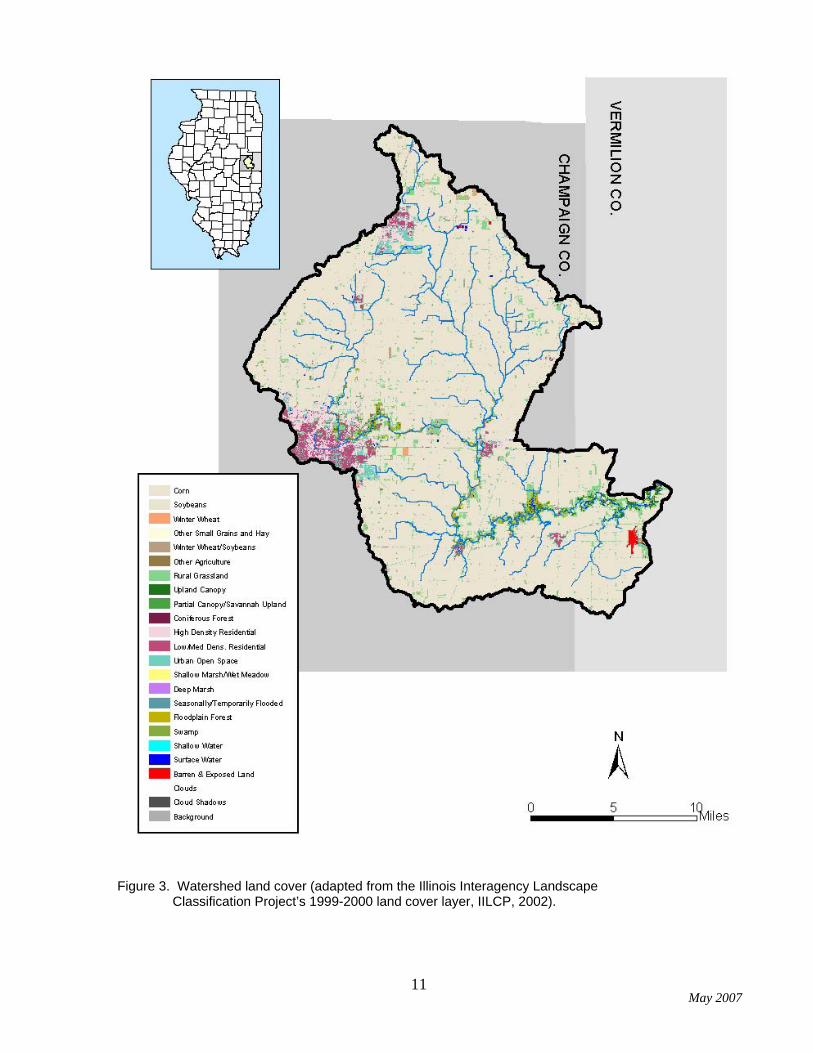
The study area is approximately 381 square miles and is located in the Bloomington Ridged Plain with a landscape strongly influenced by the most recent glaciation (IDNR, 1997). Glacial moraines form the boundaries of the drainage area. Because of this glacial legacy, much of the land is flat and the soils fertile. Some of the most productive soils in the state are found in this region and over 80% of the drainage area is currently used for row crop agriculture. Land cover for the watershed, derived from an IDNR dataset developed from satellite imagery (IILCP, 2002) is illustrated in Figure 3. Note the predominance of corn and soybeans (light tan) on the map. Agricultural productivity is closely tied to drainage. Drainage ditches and subsurface field tile drains were installed over the last century to drain the naturally wet soils. Approximately 44 drainage districts serve the area.
Wooded areas make up about 1% of the area and are found mainly along the Salt Fork
corridor downstream of St. Joseph. Approximately 8% of the watershed is urbanized (Tetra Tech, 2005). Urbana and Champaign, twin cities that are home to the University of Illinois, have a combined population of approximately 104,000 (www.census.gov). Smaller communities in the study area include Ludlow, Rantoul, Gifford, Thomasboro, Royal, St. Joseph, Ogden, Philo, Sidney, and Homer with a combined population of close to 23,000.
Homer Lake Forest Preserve, near the southeastern corner of the watershed, provides approximately 800 acres of wildlife habitat and recreational opportunities. The Spoon River (tributary to the Salt Fork) and the Salt Fork downstream of the county line are designated as “Biologically Significant.” Trelease Woods and Brownfield Woods northeast of Urbana are Illinois Natural Area Inventory Sites. Trelease Woods has been named as a State Important Bird Area, based on historical data. Busey Woods, in Crystal Lake Park in Urbana, has been nominated under the statewide program for the same designation, based on its importance as a migratory bird stop-over site.
May 2007
10
Figure 2. Upper Salt Fork Watershed addressed by the implementation plan. Stream segments shown in red are listed as impaired by IEPA.
May 2007
11
Figure 3. Watershed land cover (adapted from the Illinois Interagency Landscape Classification Project’s 1999-2000 land cover layer, IILCP, 2002).

May 2007
12
III. Watershed Activities Glaciers, and forces of nature following their retreat, left the region flat, wet, and fertile. This section briefly describes human activities in the Salt Fork watershed since the 1800s that have either overcome or protected those characteristics. Events that led to present conditions and current activities of various organizations are outlined. Such information can help us develop solutions that build on the successes of the past and avoid its mistakes; and synergize, rather than replicate, present efforts. Early History Several excellent histories have been written to describe the way things were in the Salt Fork watershed before settlement by European Americans in the early 1800s. A few of these are listed in the References section at the end of this document. Past accounts describe both the vastness of the tall grass prairie in the marshy upland areas as well as the sheltering timbered areas along the stream corridors. They record the settlers’ amazement with the fertility of the soil and diversity of plants and animals, as well as stories of hardships related to weather, insects, and sickness. Early settlement occurred on the relatively high ground of the moraines and also along the wooded areas of the Salt Fork where shelter, firewood, and clean water were plentiful. Formerly occupied by Illinois, Iroquois, Pottawatomie, and Kickapoo Native Americans, Big Grove (Brownfield Woods) was one of the first areas in the watershed settled by European Americans. Big Grove was originally a 10-sq. mi. wooded area extending from what is now Main Street in Urbana, to the towns of Leverett to the north and Mayview to the east (Hansen, 1963). An area on the south side of Big Grove was designated as the county seat and was named Urbana when Champaign County was created in 1833 (www.city.urbana.il.us/urbana/city_resources/History.html). Routes chosen for the construction of railroads in the mid-19th century greatly influenced development in the area. Cunningham and Shoaf (2005) describe some of the dealings that led to the location of Sidney and the re-location of Homer to its present site. The Illinois Central Railroad laid track just west of Urbana and opened passenger service in 1854 (www.cumtd.com/itc/rail_history.html). The resulting development spawned the city of Champaign. Rantoul, to the north, can trace its name to the railroad station named in 1855 after Robert Rantoul, Jr., an original stockholder of the Illinois Central railroad company (www.rootsweb.com/~ilchampa/towns-townships/rantoultwnshp.html). The Illinois Industrial University, now the University of Illinois, was chartered in 1867 as a land-grant institution made possible through the Morrill Act of 1862. The campus was built in Urbana and Champaign and has played a major role in the region’s development since opening in 1868 (www.uiuc.edu). Not only is the University of Illinois hydrologically tied to the Salt Fork by Boneyard Creek running through its campus, but it also impacts the Salt Fork through its influence on the local economy, agricultural research, and collection of scientific information.

May 2007
13
Drainage and Agriculture In 1879, state legislation was passed to provide for the organization of drainage districts (Hay and Stall, 1974). Such districts were given assessment authority to provide for the construction and maintenance of drainage ditches. In many areas, ditches were dug where no channel previously existed to connect with the natural stream. Beaver Lake is the largest of the drainage districts in the watershed and was organized in 1880. Saline Branch Drainage District, downstream of Beaver Lake Drainage District, was formed in 1906 and receives flow from Boneyard Creek and from the municipalities of Urbana and Champaign. The Upper Salt Fork Drainage District was organized in 1925 and is the longest of the drainage districts, including lands along the Salt Fork from Rantoul to downstream of St. Joseph. Hay and Stall (1974) provide a good history of these and other districts. A map of drainage districts in the study area is provided in IV. Watershed Resource Inventory (see p. 31). The construction of ditches, and the laying of underground tile drains with outlet to the ditches, made it possible to grow corn in the naturally poorly-drained areas of the region. The increased supply of grain and the established railroad system supported growth of the existing beef industry (Larimore and Bayley, 1996). As fertilizer and equipment manufacturing processes improved following World War II, corn production became more profitable. By the late 1950s, the local cattle industry was declining (Larimore and Bayley, 1996) and the agricultural industry was dominated by production of corn and soybeans. While subsurface drainage is now responsible for much of the area’s prosperity, it also impacts water quality by providing a pathway to the Salt Fork for dissolved nutrients and agrichemicals. Nitrogen and phosphorus are two parameters of concern in the Salt Fork. Subsurface drainage also affects the rate and timing at which flow enters receiving streams. The effect is not fully understood and is difficult to adequately address in computer models. The extensive production of corn and soybeans has also reduced diversity in wildlife habitat and has increased soil erosion which contributes to stream and lake siltation.
Photo courtesy CCSWCD.

May 2007
14
Figure 4. Boneyard peak flows (cfs) from 1948-2004. Graph courtesy Robert Holmes, USGS.
Urban Development Larimore and Bayley (1996) discuss some of the environmental impacts of urban development and drainage. By 1928, Boneyard Creek running through Champaign and Urbana reportedly was so polluted with municipal and industrial waste that it no longer supported a permanent fish population. Urbanization reduces the capacity of the land surface to absorb water leading to increased flooding. Annual peak flows for the Boneyard have increased since the 1950s (personal communication with Robert Holmes, USGS, 2006). Figure 4 shows peak flows measured in Boneyard Creek plotted over time. Increased peak flows in the Boneyard have not, however, resulted in a significant increase in peak flows in the Salt Fork. Municipal and county ordinances address storage and discharge of storm water from developments to minimize local downstream impacts. To address Boneyard Creek flooding, an extensive flow control project is underway. One portion of that project is City of Champaign’s construction of the Healey St. detention basin completed in 1999. The basin, shown in Figure 5, is 450 ft. x 430 ft. and is 55 ft. deep (http://dailyengineers.com/boneyard.htm). Berns, Clancy & Associates (BCA) have extensive knowledge of past and present Boneyard projects. Their bibliography on the subject is provided in the Appendix.
Figure 5. City of Champaign’s Healey Street Detention Basin. Photos courtesy CCSWCD (2006).
0
200
400
600
800
1000
Jan-48 Dec-57 Dec-67 Dec-77 Dec-87 Dec-97 Dec-07Year
Peak
Flo
w -
cfs

May 2007
15
Protecting Our Natural Resources Since the 1950s, several positive actions have been taken to protect and improve our natural resources. The Soil Bank Act of 1956 provided incentives to landowners to take cropland temporarily out of production as a means to reduce soil erosion. The program evolved into the present day Conservation Reserve Program (CRP) which places emphasis on environmentally sensitive lands. Improvements in waste treatment methods and passage of the Water Pollution Control Act and Clean Water Act in the 1970s greatly reduced problems from point source pollution. The Champaign and Vermilion County Soil and Water Conservation Districts (SWCDs) (founded in the 1950s) have worked closely with USDA and other partners to promote enrollment in CRP as well as the adoption of practices such as conservation tillage to reduce soil erosion and nutrient management to reduce inputs of agrichemicals to streams. An inventory of conservation practices adopted in the watershed is presented in IV. Watershed Resource Inventory of this document. Champaign County SWCD received IDNR C-2000 funds to purchase land for restoration of a wetland near St. Joseph. This wetland, pictured in Figure 6, will provide 60 acres of wildlife habitat as well as storage for floodwaters. CCSWCD is partnering with several organizations and volunteers to develop educational opportunities for people visiting the site.
Figure 6. St. Joseph Wetland site (under development) (composite photo courtesy CCSWCD, 2005). The Illinois State Water Survey conducted a “Phase I” study of Homer Lake from 1997-2000 through a grant provided by IEPA’s Illinois Clean Lakes Program to the Champaign County Forest Preserve District (Lin and Bogner, 2000). The study included analyses of water quality and lake sedimentation data as well as recommendations for reducing pollutants to the lake. Building on this study, Champaign County SWCD and Champaign County Forest Preserve District received a grant from IEPA in 2004 to improve water quality in Homer Lake through emphasis on nutrient management and erosion control. The project targeted both agricultural and residential landowners. Incentive payments were given to implement practices that reduce inputs of sediment, nitrogen, and phosphorus. Educational workshops were offered to inform the public about Homer Lake water quality and ways to improve it. The cities of Champaign and Urbana and the University of Illinois have studied urban flooding and associated pollution problems. Many improvements have been made to Boneyard Creek. In addition, the municipalities of Champaign County have organized a committee to assist in implementation of the regulations associated with Phase II of the National Pollutant Discharge Elimination System (NPDES) storm water management program.

May 2007
16
The Urbana Park District (UPD) has established several parks along the Saline Branch including Judge Webber/Perkins Road, Crystal Lake, Busey Woods, AMBUCS, and Chief Shemauger. Plans to restore 30 acres of wetland and flood storage by reconnecting the floodplain to the Saline Branch at the Perkins Road Park site are underway using funds from IDNR’s C-2000 program. In addition, UPD is exploring development of a trail system to connect the parks. Several private organizations also have been active in the protection and inventory of watershed resources. Since 1998, Prairie Rivers Network, Salt Fork River Partners, the local chapter of Izaak Walton League, the Champaign County Forest Preserve District (CCFPD), and local businesses have worked together to sponsor the annual Salt Fork River Clean-Up. One Saturday
each fall, approximately 200 volunteers remove trash from the river and banks of the Salt Fork in the area near Homer Lake. Materials removed have included bottles and cans, styrofoam, auto and tractor tires, wire fencing, and appliances. This successful event has received funds from IEPA’s Streambank Cleanup and Lakeshore Enhancement (SCALE) program to help keep it going.
Salt Fork River Clean-Up, October 5, 2002. Photo courtesy Paul DuMontelle. Izaak Walton League members and the CCFPD have also participated in the Illinois Department of Natural Resources’ RiverWatch program to collect stream data and identify macroinvertebrate species indicative of water quality. The program was suspended by IDNR in 2004 due to budget shortfalls; however, private funds allowed sampling to resume in 2005. Salt Fork River Partners is working with Prairie Rivers Network to coordinate “Stream Teams” to conduct water quality testing along the Salt Fork from St. Joseph to the Illinois Route 49 bridge and possibly further downstream. These organizations should be consulted regarding recommendations for continued or additional monitoring. Available data are presented in IV. Watershed Resource Inventory section of this plan. The Champaign County Audubon Society (www.champaigncountyaudubon.org) conducts bird counts every spring and winter to maintain a detailed census. They also monitor breeding bird populations at all four forest preserves and Urbana’s natural parks. In addition, they raise money to support conservation research and education. Bird population information is presented in IV. Watershed Resource Inventory section and the Appendix. The local chapters of Pheasants Forever work to establish wildlife habitat and provide seed and planters to landowners who wish to establish native grasses along ditches and streams. Other private, wildlife-supporting organizations in the area are National Wild Turkey Federation, Ducks Unlimited, and White Tails Unlimited.

May 2007
17
Recent Events Over the past 16 years, the Salt Fork has been the object of much discussion. Flooding, debates concerning channel maintenance, an accidental ammonia spill, and the listing of the river on IEPA’s impaired waters report have kept the Salt Fork in the local news. Channel Maintenance Lack of maintenance outside of drainage districts, and maintenance within drainage districts have fueled debate in the Salt Fork watershed for many years. Flooding in 1990, exacerbated by a blockage of woody debris upstream of Sidney, prompted the formation of the Salt Fork Steering Committee by the Champaign County SWCD. With help from USDA-SCS (now NRCS), emergency funds were obtained to clear the Sidney blockage. Additional emergency funds were obtained to remove a series of blockages in 1994. In 2002, the Salt Fork Steering Committee developed Channel Stewardship Guidelines outlining the conditions and methods for addressing woody debris in channels outside of drainage districts (see Appendix). Soon after, CCSWCD received a grant to begin implementation of those guidelines. However, the funding of the grant was delayed until late 2005, such that debris accumulations could not be addressed until the summer of 2006. The project was completed in the fall of 2006. Landowners and observers are pleased with the work and the manner in which it was conducted. Figure 7 illustrates work done at a site between St. Joseph and Sidney.
Figure 7. Before and after maintenance work on the Salt Fork between St. Joseph and Sidney (July 2006). Photos courtesy CCSWCD. During 1994-1995, a drainage district removed trees and sediment bars from the Salt Fork downstream of St. Joseph to maintain agricultural drainage. In violation of the Clean Water Act, spoil was deposited in wetland areas without permission from the U.S. Army Corps of Engineers. Although a permit was eventually obtained, overall, the actions were unacceptable to many citizens. In recent years, other drainage ditch maintenance efforts have been met with objections from those concerned with the potential impacts on aquatic habitat and downstream flooding. Some also argue that cleaning out drainage ditches does little to restore flow capacity. Figure 8 presents a series of photographs taken before and after recent maintenance on the Spoon River.

May 2007
18
Figure 8. Spoon River near County Road 2300E. Photos courtesy Clark Bullard. 2002 Ammonia Spill
On July 11, 2002, a maintenance contractor cleaning boilers at the University of Illinois Abbott Power Plant discharged wastewater from that operation which contained elevated levels of ammonia having a high pH into the sanitary sewer system. While this wastewater had been collected and treated in separate holding tanks at Abbott Power Plant prior to discharge, the strength and rate of discharge created interference with the Urbana & Champaign Sanitary District’s normal ammonia removal process at the District’s Northeast Wastewater Treatment Plant. As a result, a substantial ammonia load passed through the treatment facility and into the Saline Branch.
As a result of the elevated levels of ammonia, a fish kill occurred in the Saline Branch and the Salt Fork. Illinois Department of Natural Resources estimated that more than 105,000 fish were killed and many other aquatic and riparian species were impacted. Damages have been sought to help pay for restoration.
The Urbana & Champaign Sanitary District (UCSD) and the University of Illinois have adopted a set of measures to ensure that discharges of this nature will not occur again. These measures include emphasis on written communications and an effort on the part of UI to find alternatives to using high-concentration ammonia solutions. Details regarding these measures can be obtained from UCSD.
April 2005: Small “floodplain” formed from prior bank failures.
May 2005: After ditch maintenance work.
July 2005: Benches beginning to reform.
April 2006: Bank failure following spring rain.
August 2006: New “floodplain” and meander pattern forming.
May 2007
19
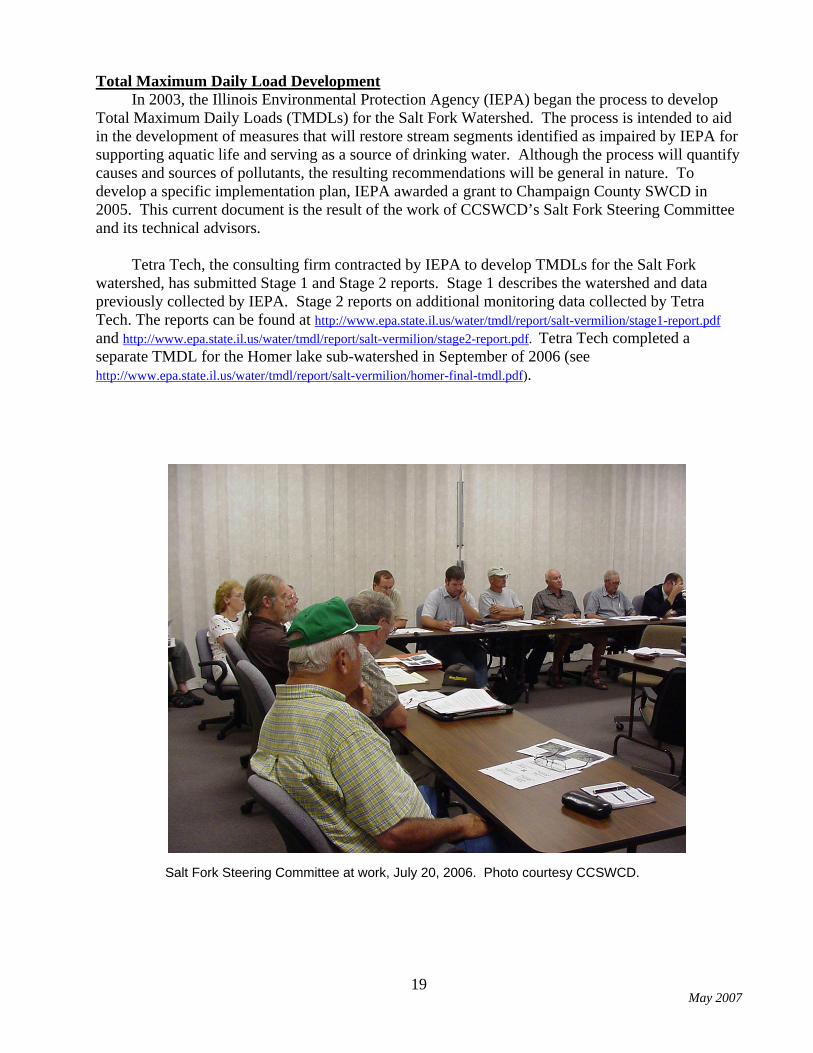
Total Maximum Daily Load Development In 2003, the Illinois Environmental Protection Agency (IEPA) began the process to develop Total Maximum Daily Loads (TMDLs) for the Salt Fork Watershed. The process is intended to aid in the development of measures that will restore stream segments identified as impaired by IEPA for supporting aquatic life and serving as a source of drinking water. Although the process will quantify causes and sources of pollutants, the resulting recommendations will be general in nature. To develop a specific implementation plan, IEPA awarded a grant to Champaign County SWCD in 2005. This current document is the result of the work of CCSWCD’s Salt Fork Steering Committee and its technical advisors. Tetra Tech, the consulting firm contracted by IEPA to develop TMDLs for the Salt Fork watershed, has submitted Stage 1 and Stage 2 reports. Stage 1 describes the watershed and data previously collected by IEPA. Stage 2 reports on additional monitoring data collected by Tetra Tech. The reports can be found at http://www.epa.state.il.us/water/tmdl/report/salt-vermilion/stage1-report.pdf and http://www.epa.state.il.us/water/tmdl/report/salt-vermilion/stage2-report.pdf. Tetra Tech completed a separate TMDL for the Homer lake sub-watershed in September of 2006 (see http://www.epa.state.il.us/water/tmdl/report/salt-vermilion/homer-final-tmdl.pdf).
Salt Fork Steering Committee at work, July 20, 2006. Photo courtesy CCSWCD.

May 2007
20
IV. Watershed Resource Inventory Over the past century, citizens in the Salt Fork watershed have been concerned with water quality, habitat for fish and other wildlife, conveyance of flow, recreation, and land use management. This section presents an incomplete inventory of data for use in addressing the current natural resource concerns of the Salt Fork. Water Quality Concerns about water quality in much of the Salt Fork system include excessive nutrients (nitrogen and phosphorus), excessive sediment, and lack of habitat to support aquatic wildlife. In addition, some stream segments are impacted by urban runoff and contaminants from industrial practices no longer in use. The Illinois Environmental Protection Agency (IEPA) has monitored the quality of waters in the Salt Fork system since 1966. In addition, other agencies and private organizations have started citizen volunteer programs to monitor a variety of water quality parameters. Meanwhile, several agencies and organizations have promoted the implementation of practices to reduce the quantity of pollutants entering waterbodies. This section inventories available water quality data and conservation practices in place. Available Monitoring Data The Illinois Environmental Protection Agency monitors the waters of the state as required by the provisions of the Clean Water Act. Some private entities also monitor water quality and its indicators. Based on IEPA’s monitoring, potential causes and sources of pollutants associated with the impaired water bodies of the Salt Fork were listed in IEPA’s Section 303(d) report (2006). Impairments, along with causes and sources, are summarized in Table 1. The Illinois Environmental protection Agency is responsible for reporting on waters throughout the state. Thus, the pollutant sources listed are based on generalized, rather than specific knowledge since agency resources are not available to do in-depth investigations on all water bodies. Parameters for which TMDLs are to be developed are listed in bold type, although this plan is concerned with all aspects of water quality.

May 2007
21
Table 1. Causes and sources of pollutants for water bodies in the Upper Salt Fork Watershed listed in IEPA’s 2006 303(d) report. (TMDLs to be developed for parameters in bold.)
Water Body (IEPA Identifier)
Uses Listed as Impaired
Causes
Sources
Homer Lake (RBO – 65 acres) Aesthetic quality
Total suspended solids excessive algal growth Phosphorus
Crop production Shore area modifications Forest/grassland/park land
Boneyard Cr. (BPJCA – 3.2 miles) Aquatic life
Habitat alteration DDT Hexachlorobenzene PCBs
Urban runoff Hydrologic/habitat modification Contaminated sediments
Saline Branch (BPJC08 – 15.5 miles, upstream of Boneyard, and BPJC06 – 10.3 miles, downstream of Boneyard)
Aquatic life
Habitat alteration Total Nitrogen Dissolved oxygen Boron Ammonia Total suspended solids DDT Dieldrin Methoxychlor Phosphorus
Channelization Crop production Municipal point sources Contaminated sediments Unknown sources
Spoon River (BPJD02 – 13.7 miles) Aquatic life Dissolved oxygen
Habitat alteration Crop production Channelization
Salt Fork River (BPJ09 – 13.8 miles, BPJ10 – 13.6 miles, and BPJ12 – 3.1 miles)
Aquatic life Public water supply
Ammonia Total Nitrogen pH Nitrate Total suspended solids Phosphorus
Crop production Municipal point sources Unknown sources
IEPA Monitoring Data IEPA operates four water quality monitoring programs in the Salt Fork watershed:
• Ambient Water Quality Network (AWQMN) • Facility Related Stream Surveys (FRSS) • Intensive Basin Surveys • Ambient Lakes Monitoring Program
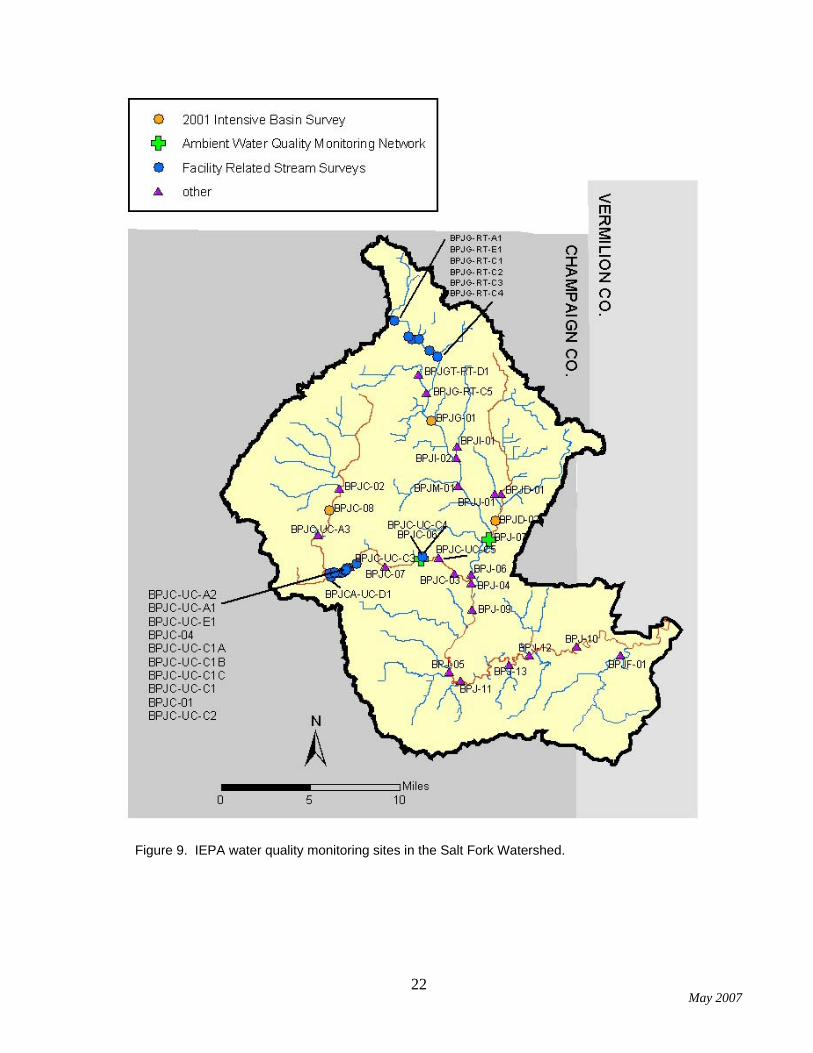
Station locations for the study area are shown in Figure 9. Impaired reaches are shown in red. Stations in the AWQMN are sampled every six weeks for basic physical and chemical parameters. Facility Related Stream Surveys target areas upstream and downstream of municipal treatment plants. Macroinvertebrates as well as physical and chemical parameters are monitored annually at these stations, depending on staff resources. Intensive Basin Surveys are conducted once every five years and are the main source of information for assessing the aquatic life designated use. Physical, chemical, and biological parameters are evaluated. Three stations were monitored in the 2001 Intensive Basin Survey in addition to the FRSS stations. During Intensive Basin Surveys, stream segments are characterized in terms of quality of aquatic life habitat. Homer Lake is monitored five times per year as part of the Ambient Lakes Monitoring Program. Temperature, dissolved oxygen, water clarity, and water and sediment chemistry are evaluated. In addition, the lake was sampled one to two times per month from May 1997 to April 1998 by IEPA or an IEPA-approved volunteer as part of an Illinois State Water Survey (ISWS) study funded through the IEPA Clean lakes Program (Lin and Bogner, 2000).
May 2007
22
Figure 9. IEPA water quality monitoring sites in the Salt Fork Watershed.

May 2007
23
RiverWatch Data In addition to the IEPA monitoring sites, six stream sites in the study area were monitored by volunteers as part of IDNR’s RiverWatch program over the period from 1996-2003. Data were collected on one to six occasions, depending on the site, for a total of 15 sets of observations. Volunteers recorded weather, physical characteristics of the water, stream bottom material, degree of stream cover, macroinvertebrate and other species observed, and surrounding land use. Selected parameters are presented in Table 2. Precise sampling locations are not presented to protect the privacy of cooperating landowners. Table 2. RiverWatch sampling results for the Salt Fork.
Location Season/Year Turbidity Algal Growth
(%)
MBI1 Macroinvertebrate
Biotic Index (lesser scores indicate better water quality/
habitat)
Biological Score2
(greater scores indicate better water quality/
habitat)
Habitat Score3
(greater scores indicate better aquatic wildlife
habitat)
Spring/1996 0 7.79 4.7 9.3 Spring/1999 Medium 0 9.00 4.2 7.7 Spring/2001 Slight 0 6.29 9.0 15.7 Spring/2002 Slight 6-25 5.98 13.4 9.3
tributary to Saline
Branch Spring/2003 Clear 26-50 6.14 11.6 24.3
Saline Branch (upstream of Boneyard)
Summer/1996
6-25
5.67
82.1
77.8
Boneyard Creek
Spring/1996
1-5
7.41
1.7
21.2
Salt Fork (above Saline)
Spring/2001
Clear
1-5
6.34
4.4
83.5
trib. to Salt Fork (near Sidney)
Spring/1996
26-50
6.62
10.0
90.1
Spring/1996 6-25 5.56 37.8 21.2 Summer/1999 Slight 1-5 9.74 2.5 21.2 Spring/2000 Clear 1-5 6.25 12.3 59.6 Spring/2001 Slight 1-5 6.29 10.4 59.6 Spring/2002 Clear 0 6.34 30.8 86.0
Conkey Branch (downstream of
Homer Lake spillway)
Spring/2003 Clear 1-5 7.03 29.8 55.5
1 MBI: Measured on a scale of 1-11. 1-6 = good; 6.1-7.5 = fair; 7.6-8.9 = poor; 9-11 = very poor 2 Biological Score: Percentile ranking from 1-100 representing a composite of biological indices. 3 Habitat Score: Percentile ranking from 1-100 representing a composite of habitat characteristics. See http://ctap.inhs.uiuc.edu/publications/2002CTAPannual3.pdf .

May 2007
24
Stream Teams Data Salt Fork River Partners have established four sampling sites in the Salt Fork watershed. Sites are monitored by collecting water samples for chemical analysis as well as by applying visual assessment protocols. Data have been collected since September 2004. As of September 2005, a total of 11 sets of observations had been made. Results for selected parameters are presented in Table 3.
Table 3. Stream Team sampling results for the Salt Fork.
Location Month-Year pH Alkalinity(mg/L)
Dissolved oxygen (mg/L)
Total suspended
solids (mg/L)
Ortho-phosphate-P
(mg/L)
Nitrate-nitrogen (mg/L)
Sept-2004 7.5 262 6.6 66.1 0.10 4.4 Feb-2005 7.5 248 9.8 19.0 0.13 8.0 Mar-2005 8.0 260 8.7 8.7 0.17 8.0
IL Rt. 49 bridge
Jul-2005 7.5 222 15.5 15.5 1.17 17.6 Feb-2005 7.5 248 10.0 8.7 0.14 9.0 Apr-2005 8.5 282 15.0 6.5 0.20 6.0 May-2005 7.5 260 8.6 6.5 0.50 8.0
IL Rt. 14 bridge
Jun-2005 7.5 220 9.0 6.5 1.17 2.0 CR 1100N bridge Feb-2005 7.5 291 15.0 26.8 0.07 8.0
Feb-2005 7.5 244 9.8 8.3 0.14 8.0 Upstream of CR 2400 E Jun-2005 7.5 236 4.6 36.2 1.07 6.0
Other Water Quality Related Data Available data indirectly related to water quality are the T-Transect surveys conducted by Soil and Water Conservation Districts for the Illinois Department of Agriculture. Points are surveyed on a square grid approximately every 1.5 miles. The same points are visited every two years and factors related to erosion are reported. The Revised Universal Soil Loss Equation is used to estimate the rate of erosion occurring at each survey point. Estimated rates are compared against “T”, the agronomically “tolerable” rate of erosion for a given soil type. For most soils in the watershed, T is estimated to be 4-5 tons/acre/year. According to CCSWCD and VCSWCD, in 2004 the erosion rate was estimated to be greater than T for 10 points out of 129 in the study area. The T-Transect surveys provide insight regarding erosion rates within fields. The quantity of eroded material that reaches streams and lakes is a fraction of total field erosion. Two studies conducted by the ISWS provide insight regarding the rate of sediment transport to the Salt Fork. In 1998, the ISWS measured sediment accumulation in Homer Lake since construction of its dam in 1969 and also measured sediment concentrations in water entering and leaving the lake (Lin and Bogner, 2000). The sediment survey indicated a transport rate of 0.32 tons/acre/year, averaged over the 30 years the dam had been in place. This average is 13% of the estimated average annual field erosion rate. Samples collected during the one-year water quality monitoring portion of the study (1997-1998) indicated sediment entering at a rate of 0.46 tons/acre/year for that time period.
Stream Team water sampling. Photo courtesy Sue Smith.

May 2007
25
A second ISWS study was conducted in 2000-2001 in the larger Vermilion watershed (Keefer, 2003). Flow and sediment concentrations were monitored in the North Fork, Middle Fork, and the Vermilion River near Danville (see Figure 2). While sediment from the Salt Fork was not measured directly, transport rate from that watershed was estimated to be 0.18 tons/acre/year by subtracting the contributions from the North and Middle Forks from that measured at Danville. Since the study included a period of below normal runoff, the estimate of 0.18 tons/acre/year is most likely below the average annual rate. The same study estimated a transport rate of 0.65 tons/acre/year for the adjacent Little Vermilion watershed. Based on discussion with Roger Windhorn of USDA-NRCS, a value of 0.3 tons/acre/year will be used for planning purposes. Conservation Practices
Primary nonpoint source pollutants identified by IEPA are nutrients and sediment. Practices that can help keep these pollutants from entering streams include buffer strips of trees or grass along stream banks, wetlands, nutrient (fertilizer) management, conservation tillage techniques, and grassed waterways. These practices are primarily applicable to the dominant land use: row crop agriculture. The United States Department of Agriculture and the Illinois Department of Agriculture offer programs to implement such practices. Some of the rules, details, and funding of these programs change over time, but those that are most applicable to the Salt Fork Watershed are listed below. Additional programs are sometimes available from various sources. The Champaign County Soil and Water Conservation District can be contacted for current program availability. Programs and practices are described in more detail below. The efficacy of such practices in reducing nutrient and sediment loads will be discussed under VII. Implementation Strategies/ Alternatives. CRP: Conservation Reserve Program
Several practices under the CRP program have been successfully used to conserve natural resources and improve water quality in the watershed. These practices are available for land that has agricultural crop history.
1. Filter Strips and Riparian Buffers: These are grass or tree strips along drainage ditches and streams that filter out sediment and nutrients. The width varies depending on the site and is determined by using standards developed by the Natural Resources Conservation Service. An annual rental rate is paid to compensate for the lost crop income and 50% cost share is available along with some incentive payments.
2. Shallow Water Areas for Wildlife: These are areas that are naturally wet as determined by the Natural Resources Conservation Service. The practice generally involves closing off the natural outflow of water with a 1 to 3-foot berm of soil and placing a water control valve in this berm. The water is held in the area for a portion of the year to improve habitat for wildlife such as ducks. The ponded area is surrounded by a grass filter to improve water quality. An annual rental rate is paid to compensate for the lost crop income and 50% cost share is available along with some incentive payments.
3. Waterways: These are grass strips in farm fields that convey storm water from a field while protecting the field from gulley erosion. Gulley erosion is prevented which keeps soil out of the streams. An annual rental rate is paid to compensate for the lost crop income and 50% cost share is available along with some incentive payments.

May 2007
26
WRP: Wetland Reserve Program Private wetlands converted to agricultural production prior to 1985 are eligible for up to 90%
cost share for restoration. The plan also provides one time payments for 10-year, 30-year, or permanent easements.
WHIP: Wildlife Habitat Incentive Program
All private land is eligible for this program -- no crop history is necessary. A wildlife biologist from the Natural Resources Conservation Service works with the landowner to develop a plan and cost share up to 75% is available for the plantings recommended. There are no land rental payments with this program.
EQIP: Environmental Quality Incentive Program
This program is divided into livestock and non-livestock segments. The livestock feature offers up to 75% cost share for fencing and improvements (such as watering systems) in livestock facilities. This program could be used by someone with a pasture along a stream to fence the livestock out of the stream and provide an alternate watering facility. There are a few small holdings of cattle and other livestock in the watershed.
The non-livestock segment provides up to 75% cost share for soil conservation practices such
as terraces that can be used to reduce soil erosion on sloping fields. These are parallel berms at specified intervals on the contour of a slope that catch water before gullies can form. Tile carries the water from these berms into the existing tile system in the area or delivers it into a drainage ditch or stream. Crops are planted on the contour and soil erosion is controlled on the site. CPP: Conservation Practices Program
This program provides up to 60% cost share for a variety of projects that reduce soil erosion. There is no annual rental payment. The program can also be used for nutrient management plans (crop fertilizer plans that follow the University of Illinois guidelines for fertilization). An incentive of $7 to $10 per acre is paid on a one time basis to farmers for adopting these plans on their fields.
Farmers willing to try no-till or strip-till can receive an incentive payment of up to $800.
These farming practices leave crop residue on the soil surface to protect it from erosion. The implementation of these practices reduces the soil being deposited into streams and ditches.
Practices in Place in the Watershed Acres currently enrolled in various conservation programs are summarized in Table 4. Figure 10 provides a visual inventory of vegetative buffers. There are a total of 279 miles of streams or 558 miles of stream banks in the watershed addressed by this watershed plan. Approximately 71% of the stream banks have some kind of vegetative buffer (including non-CRP trees or grass). The average width of CRP-enrolled buffers is 74 feet. Stream segments coded as red in Figure 10 are in need of vegetative buffers on either or both banks.

May 2007
27
Table 4. Summary of Current Conservation Practices Related to Water Quality.
Program Practice Pollutants addressed Acres enrolled in Homer Lake Watershed
Acres enrolled in remainder of
Salt Fork watershed area
Total Acres
Enrolled
CRP (USDA)
Grass buffers along channels
Filters sediment and pollutants bound to sediment such as P and some pesticides; roots also uptake dissolved forms of N and P
51 1,900 1,951
CRP (USDA)
Tree buffers along channels
Filters sediment and pollutants bound to sediment such as P and some pesticides; roots also uptake dissolved forms of N and P. Trees also provide shading which increases dissolved oxygen levels in streams.
0 145 145
CRP (USDA)
Grassed waterways
Prevents transport of sediment by healing or preventing formation of gullies in cropped fields
0 304 304
CRP (USDA)
Shallow water areas and wetland buffer
Traps sediment; aquatic plants take up nutrients. 0 22 22
CRP (USDA)
Other grass/tree/shrub planting practices
Such practices include windbreaks and wildlife food plots. While these are not implemented for the benefit of water quality, land used for these practices are taken out of crop production thus reducing erosion and fertilizer losses.
0 596 596
EQIP (USDA) and 319 (IEPA)
Nutrient management
Prevents over-application of N and P on cropped fields by prescribing appropriate application rates based on soil testing, yield history, and UI recommendations
3,500 3,800 7,300
EQIP (USDA) and 319 (IEPA)
Conservation tillage
Reduces soil erosion by limiting the degree to which soil and crop residues are disturbed in preparing fields for planting.
315 0 315
Application of anhydrous ammonia. Photo courtesy CCSWCD.

May 2007
28
Figure 10. Stream bank buffer status in the Salt Fork Watershed.

May 2007
29
Conveyance of Flow Both historical and current data related to the river’s ability to transport water are available from a variety of sources including IDNR, USGS, USDA-NRCS, and SWCD records. This section outlines available sources of information related to maps of channels and drainage districts, flow data, bank condition and impedances to flow, and computer models. Maps Maps from the original United States Public Land Surveys were recently preserved in digital format and are available on CD from the Illinois State Archives. USGS has published topographic maps showing stream channels in the area since 1895. The most recent 1:24,000 USGS topographic maps of the area are available in digital format. Champaign County SWCD used 1993 USGS digital black and white aerial photography to map channels at the 1:12,000 scale for use in their Geographic Information Systems database. Other digital aerial photography sets available include:
• 1940 black and white photography flown for USDA and archived by IDNR • 1984-1996 color infra-red photography flown by a private vendor • 1993 USGS black and white photography • 1998-1999 USGS black and white photography • 2002 black and white photography flown for Champaign County only • 2004, 2005, 2006 color infra-red photography flown for USDA • 2005 color photography flown for Champaign County only
Available hardcopy aerial photography sets flown for USDA include:
• 1940 (Champaign and Vermilion Counties) • 1960, 1983 (Vermilion County only) • 1975, 1982, 1990, 1993 (Champaign County only) • USDA-FSA crop compliance slides for 1980-2003 (a few years missing for Champaign
County; availability for Vermilion County unknown). Drainage districts are responsible for maintenance of free flow within their boundaries. Approximately 44 drainage districts serve the study area, although some may no longer be active. Drainage districts listed in Table 5 and outlined in Figure 11 were digitized by CCSWCD based on best available information from district commissioners and from the 1971 Inventory of Illinois Drainage and Levee Districts (Illinois Department of Business and Economic Development, 1971).

May 2007
30
Table 5. Drainage Districts in the Upper Salt Fork Watershed (see Figure 11). Acres listed are approximate, not legal measurements.
District Acres
1. Bailey Branch 1693 2. Beaver Lake 36888 8. Conkey Branch 4314 11. Dillsburg Special 3429 14. #10 Ogden Township 1291 15. #11 Ogden Township 605 19. #1 Town of Sidney 2425 20. #2 Sidney Township 3910 21. #1 Town of South Homer 4250 22. St. Joseph Township #3 5917 23. St. Joseph Twp. #4 4769 24. St. Joseph Twp #5 424 25. St. Joseph Twp #8 891 26. #1 Town of Stanton 2068 30. Ehmen-Schmidt Mutual 1309 33. Flatville Special 7703 36. Hickory Grove 399 42. Killbury Mutual 62 56. Raup 2873 57. Salt Fork 7177 58. Saline Branch 12757 60. Schindler 867 63. Silver Creek 5077 64. Spoon River 24336 65. South Fork 4582 66. #6 St. Joseph Twp 1194 67. Stanton Special 4224 69. Triple Fork 4211 71. Union Stanton-Ogden Twp 2236 75. Union #1 Philo & Sidney 2386 76. #1 Philo & Urbana 2480 79. #2 Somer & Stanton 6649 80. Union #1 Homer & Sidell 1021 81. Union #2 South Homer & Sidney 4158 82. Union #3 South Homer & Sidney 1181 83. #2 St. Joseph & Ogden 4119 84. Union DD #7 St. Joe & Ogden 912 86. Upper Salt Fork 14484 87. Urbana & Champaign Sanitary District (technically not a drainage district) 5828 90. Willow Branch 973 91. Wrisk 2068 92. Youman's Branch Mutual 1803 96. #1 Town of Somer 2531 9991. Vermilion County #48 211

May 2007
31
Figure 11. Drainage districts in the study area. (See Table 5 for district names; Vermilion County district boundaries have not yet been digitized.)

May 2007
32
Flow Data Stream flow records are maintained by USGS for five gauging stations in the study area. Periods of record are listed below in Table 6.
Table 6. USGS gauging stations in the study area (http://nwis.waterdata.usgs.gov).
Site ID Site Name Period of Record 03336900 Salt Fork near St. Joseph 1958-1991 and
2004-present 03337000 Boneyard Creek at Urbana 1948-present 03337100 Boneyard Creek at Lincoln Ave. 2001-present 03337500 Saline Branch at Urbana 1936-1958 03338000 Salt Fork near Homer 1944-1958
Stream Bank Condition and Impedances to Flow Geo-referenced aerial video of the Salt Fork from Batesville in Vermilion County to St. Joseph in Champaign County was flown in March of 2004 in a cooperative venture of the U.S. Geological Survey Illinois Water Science Center and the Illinois Department of Agriculture. The upper reaches above County Road 1850 N in Champaign County were not flown due to lack of funding (personal communication with Robert Holmes, USGS, 2006). Wayne Kinney of Midwest Streams, Inc. analyzed the videography and identified log jams and areas of bank erosion. Results from his analysis are discussed under VI. Goals and Objectives. A woody debris inventory of the Salt Fork was conducted near the end of 2005 by Applied Ecological Services (AES) as part of CCSWCD’s channel maintenance grant. They collected photos and GPS coordinates for 189 sites. Those sites were prioritized to guide maintenance work conducted during the summer and fall of 2006. Computer Modeling Some of the gauging data collected by USGS was used in a detailed hydrologic and hydraulic modeling study conducted by USDA-NRCS for the Salt Fork Steering Committee (Visser, 2002 and 2003). The study included the surveying of numerous cross-sections between Rantoul and the county line and the resulting calibrated model is available for investigating a variety of hydraulic scenarios, including the effects of debris blockages. One digital product available for use is a GIS layer of bridge crossings with attributes that include the modeled 100-year flood elevation and flow rate. The bridge crossings can also be linked to digital photographs of each location.
May 2007
33
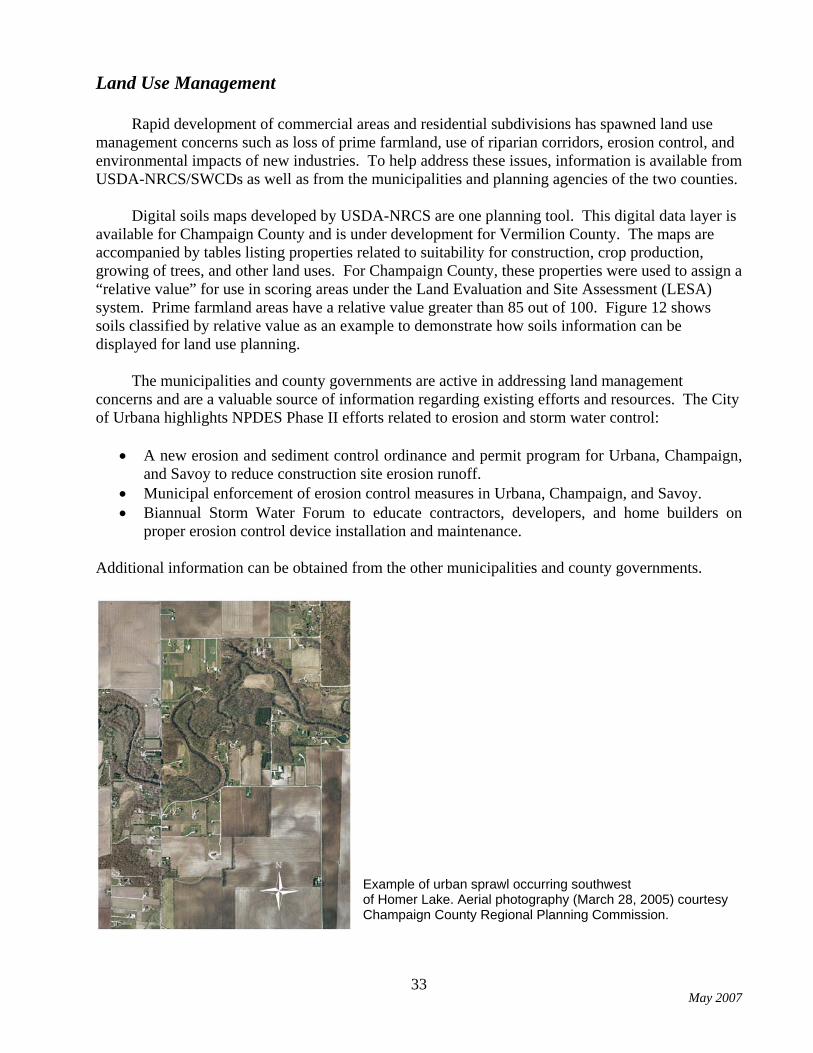
Land Use Management Rapid development of commercial areas and residential subdivisions has spawned land use management concerns such as loss of prime farmland, use of riparian corridors, erosion control, and environmental impacts of new industries. To help address these issues, information is available from USDA-NRCS/SWCDs as well as from the municipalities and planning agencies of the two counties. Digital soils maps developed by USDA-NRCS are one planning tool. This digital data layer is available for Champaign County and is under development for Vermilion County. The maps are accompanied by tables listing properties related to suitability for construction, crop production, growing of trees, and other land uses. For Champaign County, these properties were used to assign a “relative value” for use in scoring areas under the Land Evaluation and Site Assessment (LESA) system. Prime farmland areas have a relative value greater than 85 out of 100. Figure 12 shows soils classified by relative value as an example to demonstrate how soils information can be displayed for land use planning. The municipalities and county governments are active in addressing land management concerns and are a valuable source of information regarding existing efforts and resources. The City of Urbana highlights NPDES Phase II efforts related to erosion and storm water control:
• A new erosion and sediment control ordinance and permit program for Urbana, Champaign, and Savoy to reduce construction site erosion runoff.
• Municipal enforcement of erosion control measures in Urbana, Champaign, and Savoy. • Biannual Storm Water Forum to educate contractors, developers, and home builders on
proper erosion control device installation and maintenance. Additional information can be obtained from the other municipalities and county governments.
Example of urban sprawl occurring southwest of Homer Lake. Aerial photography (March 28, 2005) courtesy Champaign County Regional Planning Commission.

May 2007
34
Figure 12. Relative Value of soils in the Champaign County portion of the watershed. (Analysis for Vermilion County not yet available.)

May 2007
35
Recreation Water quality affects quality of human recreational opportunities, both those involving water activities as well as land-based activities which are enhanced by plants and wildlife dependent in some way on the Salt Fork. Existing and planned recreational opportunities available in the Salt Fork watershed are summarized in this section. Urbana Park District The City of Urbana has several excellent parks bordering a total of approximately 1.5 miles of Saline Branch. Urbana Park District (UPD) master plans include future development of a trail to connect the parks, intensive water quality and biological inventorying, bank stabilization and riparian habitat improvements, and environmental education programs. Crystal Lake Park provides opportunities for fishing, canoeing, paddle-boating, walking, and picnicking. The lake is annually stocked with channel catfish and hybrid sunfish. Busey Woods is a 59-acre remnant of the Big Grove woodland and is adjacent to the Anita Purves Nature Center. The Saline Branch was relocated to run along the eastern edge of the woods, leaving numerous ephemeral oxbow ponds within the woods that benefit a variety of species. The area serves as an urban wetland buffering the Saline Branch and also provides many opportunities for environmental education. Chief Shemauger Park on the north bank of the Saline Branch features ball fields and picnic areas. Like many other stretches of the Saline Branch, bank stabilization, control of bush honeysuckle, and trash clean-up are needed here. The Hickory Street Park site provides storage for UPD and also has a small prairie propagation plot. The Perkins Road Park site features a park for dog-walking. Future plans include restoring prairie and wetland areas and developing overlooks and trails. The plans include reconnection of the Saline Branch to a former meander which should provide flood control, water quality, and fish habitat benefits. Judge Webber Park is further downstream on the eastern edge of Urbana. The area is designated as an outdoor archery range through agreement with the East Illinois Archers Association. Urbana Park District’s most recent acquisition is Weaver Park, a 60-acre area which drains to a tributary of the Salt Fork in St. Joseph Drainage District #3. Recreation Trail Plans are underway to develop a 24.5 mile recreation trail from Weaver Park in Urbana to Kickapoo State Park near Danville along the abandoned rail line paralleling US Route 150 (Bloomer, 2005). Trail nodes will feature parking, water fountains, and other amenities. Lease for the right-of-way was obtained in February of 2005 by the Champaign County Conservation and Design Foundation. Many other entities are also involved in the project including IDNR, UI, and several municipalities.
May 2007
36
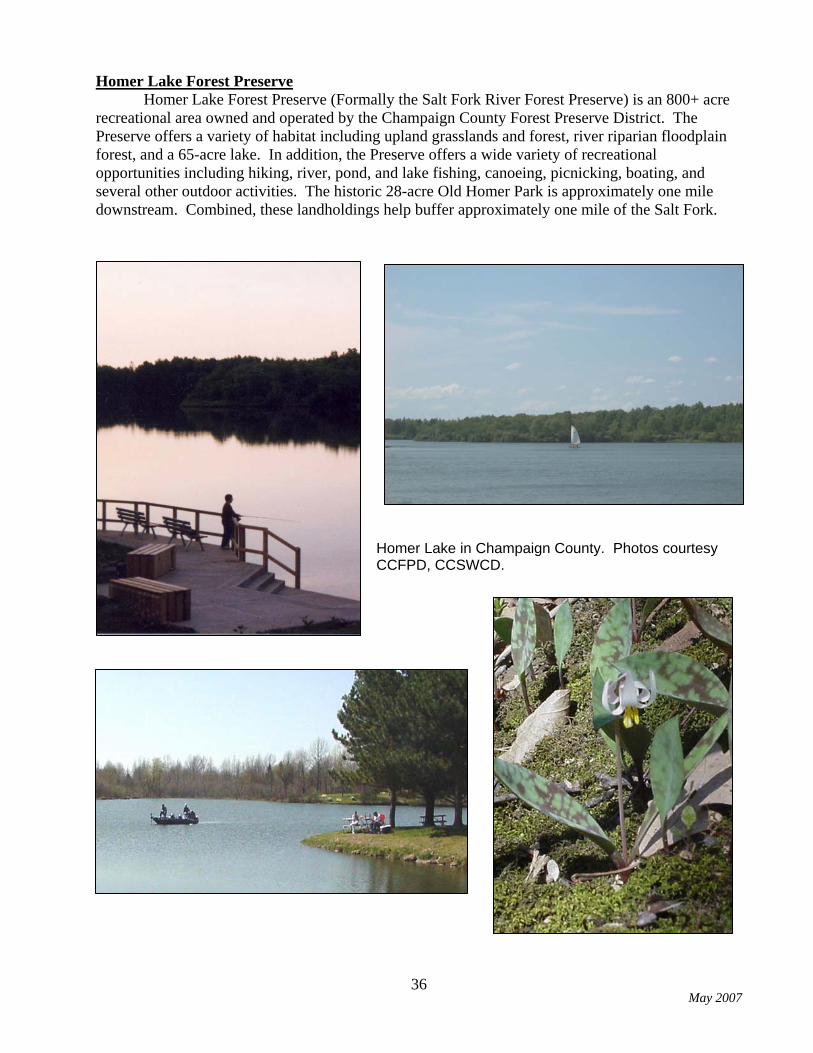
Homer Lake Forest Preserve Homer Lake Forest Preserve (Formally the Salt Fork River Forest Preserve) is an 800+ acre
recreational area owned and operated by the Champaign County Forest Preserve District. The Preserve offers a variety of habitat including upland grasslands and forest, river riparian floodplain forest, and a 65-acre lake. In addition, the Preserve offers a wide variety of recreational opportunities including hiking, river, pond, and lake fishing, canoeing, picnicking, boating, and several other outdoor activities. The historic 28-acre Old Homer Park is approximately one mile downstream. Combined, these landholdings help buffer approximately one mile of the Salt Fork.
Homer Lake in Champaign County. Photos courtesy CCFPD, CCSWCD.

May 2007
37
Fish and Other Wildlife The Salt Fork watershed is home to a variety of fish, birds, mammals, and plants. Some species are highly valued by humans, while others are considered a threat to property or indigenous species. This section summarizes available data, focusing on measures that serve as indicators of environmental health. Information regarding the state of animal and plant populations is collected by the Illinois Department of Natural Resources as well as private organizations and citizens. Species inventories are provided in the Appendix. Fish Fish populations in the area were studied as early as 1885, as noted by Larimore and Bayley in The Fishes of Champaign County, Illinois (1996), an Illinois Natural History Survey bulletin which details the findings of four major surveys conducted at roughly 30-year intervals. Larimore and Bayley tabulated and mapped the species found in each survey, examined trends, and discussed factors contributing to those trends. They concluded that:
• Channelization greatly reduced habitat diversity for fish. • Habitat can be improved by limiting channel maintenance; allowing development of channel
features that provide variation in water depth and velocity; allowing growth of bank vegetation; and restoring floodplain water storage areas.
• Silt is a major factor negatively impacting fish and other aquatic organisms. • Water quality has greatly improved since the 1950s due to changes in handling municipal and
industrial wastes, reduction of cattle grazing, and use of conservation tillage. Accidental spills are still a primary threat to aquatic wildlife.
The Illinois Department of Natural Resources works closely with IEPA in sampling fish for the Intensive Basin Surveys conducted every five years. Fish species collected in recent years for the Salt Fork, Saline Branch, Spoon River, and Upper Salt Fork are listed in the Appendix. With the exception of the Upper Salt Fork, the segments sampled are listed as impaired for aquatic life by IEPA in the 2006 303(d) report (IEPA, 2006). Data were not available for the Boneyard for 2001, but are available for the 2006 survey and are presented in the Appendix. Birds The Salt Fork River provides an important corridor of food and shelter for migrating, resident, and nesting birds. Habitat quality varies widely in the Salt Fork watershed. Especially rich areas are the Homer Lake Forest Preserve, the Urbana Park District properties of Busey Woods, the new Perkins Road Park site, and the University of Illinois research properties of Brownfield and Trelease Woods. The Illinois Department of Natural Resources recently published the results of its Illinois Breeding Bird Atlas Project (www.inhs.uiuc.edu/chf/pub/ifwis/maps/). This statewide effort established a regular grid of 6,148 census blocks with approximate area of 9 square miles each. Local Audubon observers, under contract with IDNR, systematically surveyed the census blocks within Champaign County during the breeding seasons from 1985-1991. Numbers of breeding species found in blocks within the Salt Fork watershed are shown in Figure 13 and range from 45 in the Flatville area to 88 in the Homer Lake area. The census results show evidence of greater diversity in bird life in areas with wooded streams and wetlands than in the more open drainage channel corridors and agricultural fields.

May 2007
38
Since the 1991 survey, the total number of bird species with some evidence of breeding
observed in the Homer Lake area has increased to 101 and includes three State Threatened species. Numbers have not increased significantly in the other Salt Fork census blocks and no breeding Threatened or Endangered species have been observed in those areas. The Appendix provides a historical inventory of species observed at Busey Woods, Perkins Road Park, and Homer Lake in Champaign County. The local chapter of the Audubon Society is to be commended for maintaining such a detailed database.
Figure 13. Numbers of breeding bird species by Illinois Breeding Bird Atlas census block (1985-1991).

May 2007
39
Other Animals The Salt Fork is home to variety of mammals including coyote, fox, and deer. Deer are considered to be a nuisance in some residential areas of the watershed. Mammals identified by Steering Committee members are listed in the Appendix. Franklin’s ground squirrel is the only mammal in the watershed listed on the Threatened and Endangered species list (personal communication with Eric Smith, IDNR, 2006).
The Illinois Natural History Survey has inventoried mussels in the Salt Fork (see Appendix). Mussels are indicators of stream health because they are susceptible to the effects of siltation and pollution. While the number of mussel species has generally been on the decline in Illinois, species still found in the Salt Fork include the plain pocketbook, wavyrayed lampmussel, and elktoe (Cummings, 2000).
Mussels collected from the Salt Fork placed on a kayak. Photo courtesy Sue Smith. Trees and Plants
Two concerns in the Salt Fork River watershed are a lack of native plant diversity and the encroachment of exotic and invasive plants into remaining natural areas. Silver maple and multiflora rose have become particularly noticeable in the watershed. Landowner cooperation is essential to control the spread of detrimental species. Native plantings in conservation programs and home landscapes can increase plant diversity. An incomplete inventory of trees found along the Salt Fork is provided in the Appendix. Terrestrial Habitat Areas
Historically, the Salt Fork River watershed contained areas of tallgrass prairie, wet meadows, savanna, and river corridor. These areas provided a diverse habitat for many species of plants and animals. Today, small remnants of each of these habitats remain but have been severely fragmented and reduced to areas along railways and river corridors. Efforts made by public and private landholders could reduce the negative impacts, and enhance the quality of life in the watershed. According to IDNR’s most recent land cover study (based on 1999-2000 satellite imagery) (IILCP, 2002), approximately 9% of the study area has land cover potentially suitable for support of wildlife habitat. These areas (highlighted in red in Figure 14) are not necessarily maintained for the purpose of wildlife support. In addition, much of the area is fragmented. “Islands” are less beneficial than contiguous habitat. Where appropriate, many of the practices listed in Table 4 are maintained for wildlife as well as for achieving maximum water quality benefit.
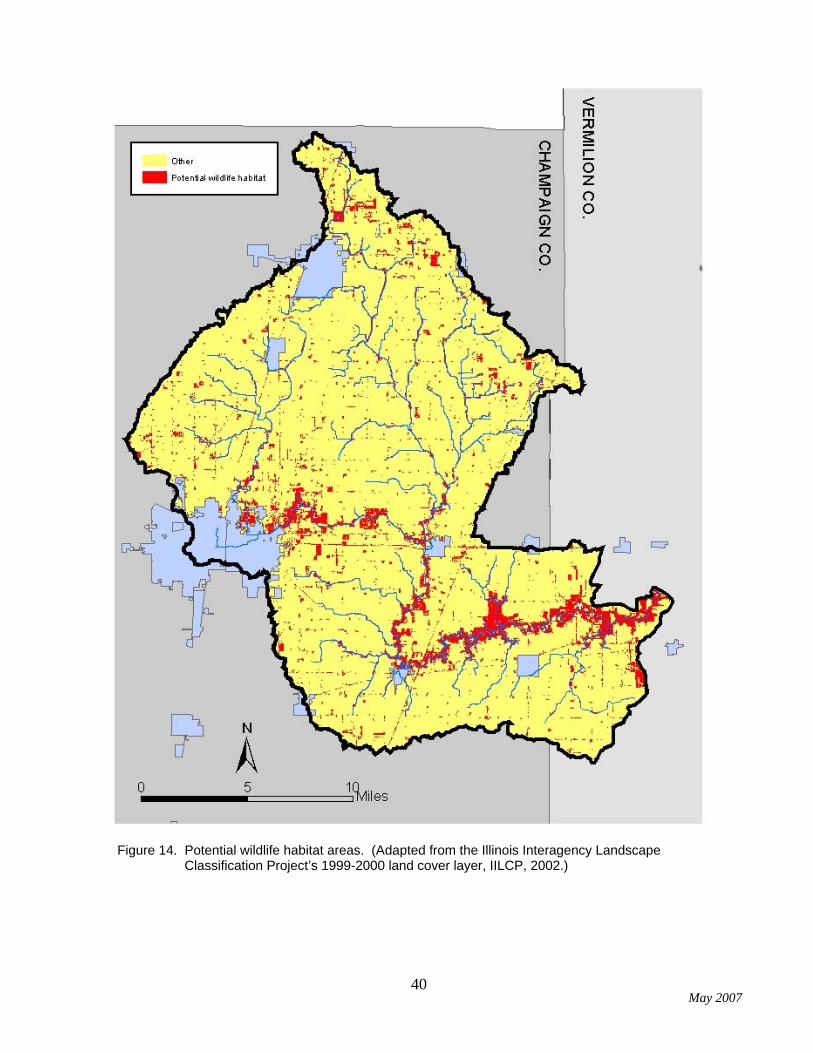
May 2007
40
Figure 14. Potential wildlife habitat areas. (Adapted from the Illinois Interagency Landscape Classification Project’s 1999-2000 land cover layer, IILCP, 2002.)

May 2007
41
Landowner Education
Private and public landowner education is a critical component of any watershed plan. The most successful programs pair educational components with applied, in-the-field, technical assistance. Educational programs that target a select audience can help increase public awareness and appreciation of local water resources, which in turn will increase support for watershed groups and projects. There are many pressing issues concerning the Salt Fork for both private landowners and public land managers. Invasive and exotic species control, water quality, environmentally friendly homeowner practices, Federal Farm Bill programs that enhance water quality and wildlife habitat, and wildlife management are just a few of the topics that need to be addressed in the watershed. This section inventories some of the available resources for providing technical assistance and environmental education to the public.
Several federal, state, county, and private agencies help distribute educational information and provide technical assistance in the Salt Fork watershed. USDA offices provide technical assistance on a variety of watershed topics including federal Farm Bill Programs that are crucial to water quality and wildlife conservation. The USGS Illinois Water Science Center provides technical assistance and resources regarding a variety of issues such as flooding, surface water quality, and ground water supply. The Illinois Department of Natural Resources (IDNR) offices provide assistance in areas related to wildlife, ecology, forestry, and fisheries management. IDNR District Wildlife Biologists meet with landowners on their sites and offer suggestions for improvements or enrollment of their land in conservation programs. In some situations, assistance from other departments of the IDNR such as the Illinois Natural History Survey (based on campus in Champaign/Urbana) or the Illinois Nature Preserves Commission may be applicable.
Forest Preserve and Conservation Districts in Champaign and Vermilion counties offer
educational programs, public meeting locations, and technical advice to interested landowners, and often provide a location for outdoor classrooms. Local University of Illinois Extension offices have individuals trained in both education and technical areas for assisting with such programs. Special interest groups such as Prairie Rivers Network, Salt Fork River Partners, and the Illinois Association of Drainage Districts focus on educating the public about water quality and other watershed concerns. Additionally, county and municipal health departments can be instrumental in developing materials for homeowners. Contact information for many of these organizations and agencies is provided in Table 7. Even though there are many avenues for educational and technical assistance, there are very few individuals available to provide applied, in-the-field assistance to landowners. This need will be addressed in later sections of this watershed plan.

May 2007
42
Table 7. Summary of Agencies and Organizations Providing Conservation Assistance to Residents of the Salt Fork River Watershed.
Organization Contact Number Assistance
Champaign County Audubon Society (217) 367-6766 www.champaigncountyaudubon.org
E
Champaign County Farm Bureau Vermilion County Farm Bureau
(217) 352-5235 (217 442-8713
E
Champaign County SWCD Vermilion County SWCD
(217) 352-3536, ext. 3; www.ccswcd.com (217) 442-1691, ext. 3
T, E, F T, E, F
Champaign County Forest Preserve District (217) 586-4389 T, E Ducks Unlimited (907) 232-7612 E Earth Partners (part of Champaign County Farm Bureau) (217) 352-5235 E *East Central Illinois Master Naturalists (217) 333-7672 E, A Grand Prairie Friends/Prairie Grove Volunteers Not Available E Homer Lake Homeowner Association Not Available E Illinois Association of Drainage Districts (217) 763-6300; [email protected] T, E Illinois Department of Natural Resources (Region 3) (217) 935-6860 T, E, F, A Illinois Department of Natural Resources (Gibson City) (217) 784-4730 T, E, F,A Illinois Environmental Protection Agency (217) 782-5562 T, E, F Illinois Natural History Survey (various offices) (217) 333-6880 T, E, A Illinois Smallmouth Alliance www.illinoissmallmouthalliance.com E Illinois State Geological Survey (217) 333-ISGS T, E, A Izaak Walton League (217) 367-9857 E National Wild Turkey Federation (217) 536-6978 E Pheasants Forever (877) 773-2070 E Prairie Rivers Network (217) 344-2371 T, E Public Health Departments (county and city offices) Champaign-Urbana: (217) 352-7961 T, E, F Salt Fork River Partners Not Available E University of Illinois Extension (county offices) (217) 333-7672 T, E USDA - NRCS (Champaign Field Office) USDA - NRCS (Danville Field Office)
(217) 352-3536, ext. 3 (217) 442-1691, ext. 3
T, F
USGS - Illinois Water Science Center (217) 344-0037 T, E Urbana Park District (217) 384-4062 E White Tails Unlimited (877) 649-1624 E
T = Technical Assistance E = Educational Opportunities F = Financial Assistance for Programs A = Applied Field Assistance * New program in 2006. First graduating volunteers projected for Dec. 2006.

May 2007
43
Average Secchi Reading for Homer Lake from 1989 - 2004
28.0
49.0
41.9
33.7
24.421.5
19.7 20.3
19.5
17.3
39.438.6
18.8
R2 = 0.67
0.05.0
10.015.020.025.030.035.040.045.050.0
1989
1990
1991
1992
1993
1994
1995
1996
1997
1998
1999
2000
2001
2002
2003
2004
Avg
Sec
chi d
epth
(in)
Total Phosphorus in Homer Lake 1989 to 2002
0.092 0.0780.032
0.070 0.0370.044
0.955
0.0640.072
R2 = 0.05
0.00
0.10
0.20
0.30
0.40
0.50
0.60
0.70
0.80
0.90
1.00
1989
1990
1991
1992
1993
1994
1995
1996
1997
1998
1999
2000
2001
2002
2003
2004
Tota
l Pho
spho
rus
(mg/
L)
Algae observed in the Upper Salt Fork, 09/30/04. Photo courtesy Clark Bullard.
V. Problem Statements As indicated in the Mission Statement, the Steering Committee recognizes the multiple functions of the Salt Fork and the inter-relatedness of the resource concerns held by the watershed’s stewards. While the water quality impairments listed in Table 1 provide the catalyst for developing this plan, to be useful, the plan must also be mindful of concerns related to flooding and channel stewardship, recreation, wildlife, and land use management. In 2005, the Steering Committee developed a list of 27 concerns which are tabulated in the Appendix. Concerns from all categories are discussed and priorities identified below. Water Quality
The Illinois Environmental Protection Agency has identified one
lake and seven stream segments in the study area as having impaired designated uses. Available resources limit water quality monitoring both in terms of number of sites and frequency of sampling. In addition, it takes time to process and report data which creates a lag between measured and current conditions. Thus, the water bodies identified by IEPA in the 2006 303(d) report do not necessarily represent all segments with impairments or all current causes. Some observers have noted problems such as algal blooms on reaches not listed as impaired.
The impairments identified by IEPA represent best available information and provide a place to start in determining what needs to be improved. Problems identified are described below:
Homer Lake’s Aesthetic Quality designated use is impaired due to excessive suspended solids and phosphorus. Water clarity has declined as indicated by average Secchi depth and phosphorus concentrations have been variable over the past decade (see Figure 15). Potential sources of pollutants include row crop and other agriculture, recent residential construction, runoff from surrounding residential areas, and on-site sewage disposal systems of surrounding residences.
Figure 15. Average Secchi disk readings and total phosphorus concentrations for Homer Lake. Graphs courtesy CCFPD.
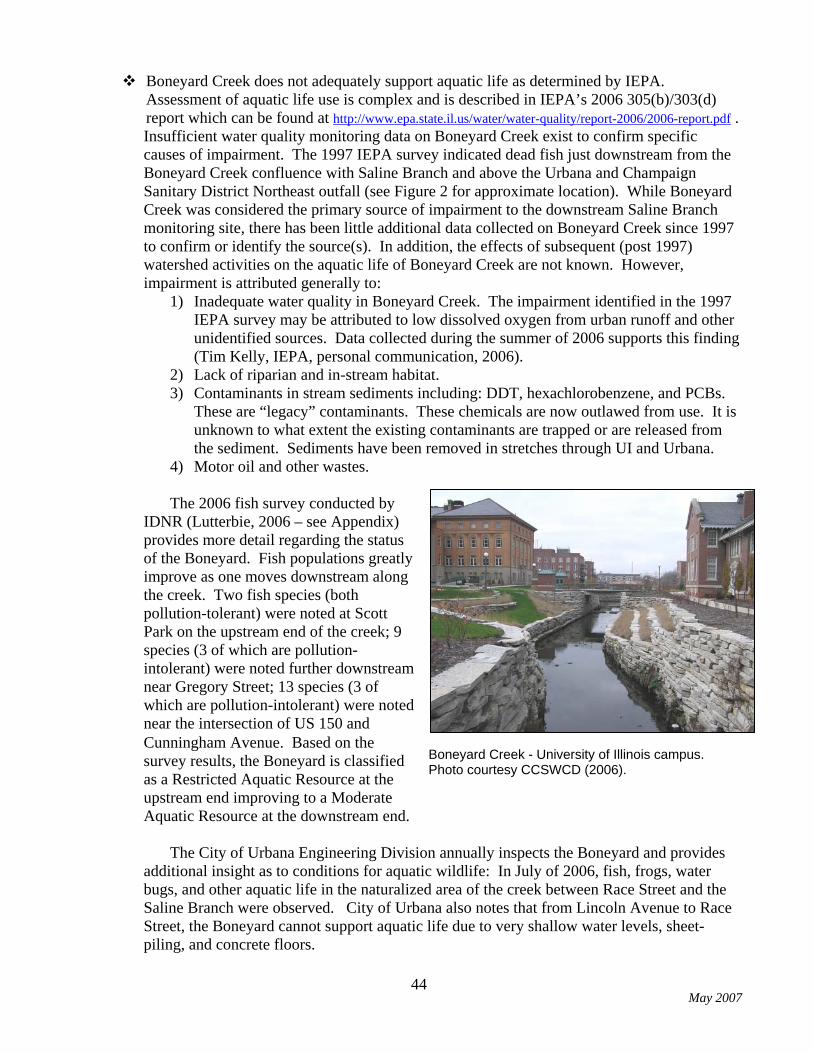
May 2007
44
Boneyard Creek - University of Illinois campus. Photo courtesy CCSWCD (2006).
Boneyard Creek does not adequately support aquatic life as determined by IEPA. Assessment of aquatic life use is complex and is described in IEPA’s 2006 305(b)/303(d) report which can be found at http://www.epa.state.il.us/water/water-quality/report-2006/2006-report.pdf . Insufficient water quality monitoring data on Boneyard Creek exist to confirm specific causes of impairment. The 1997 IEPA survey indicated dead fish just downstream from the Boneyard Creek confluence with Saline Branch and above the Urbana and Champaign Sanitary District Northeast outfall (see Figure 2 for approximate location). While Boneyard Creek was considered the primary source of impairment to the downstream Saline Branch monitoring site, there has been little additional data collected on Boneyard Creek since 1997 to confirm or identify the source(s). In addition, the effects of subsequent (post 1997) watershed activities on the aquatic life of Boneyard Creek are not known. However, impairment is attributed generally to:
1) Inadequate water quality in Boneyard Creek. The impairment identified in the 1997 IEPA survey may be attributed to low dissolved oxygen from urban runoff and other unidentified sources. Data collected during the summer of 2006 supports this finding (Tim Kelly, IEPA, personal communication, 2006).
2) Lack of riparian and in-stream habitat. 3) Contaminants in stream sediments including: DDT, hexachlorobenzene, and PCBs.
These are “legacy” contaminants. These chemicals are now outlawed from use. It is unknown to what extent the existing contaminants are trapped or are released from the sediment. Sediments have been removed in stretches through UI and Urbana.
4) Motor oil and other wastes.
The 2006 fish survey conducted by IDNR (Lutterbie, 2006 – see Appendix) provides more detail regarding the status of the Boneyard. Fish populations greatly improve as one moves downstream along the creek. Two fish species (both pollution-tolerant) were noted at Scott Park on the upstream end of the creek; 9 species (3 of which are pollution-intolerant) were noted further downstream near Gregory Street; 13 species (3 of which are pollution-intolerant) were noted near the intersection of US 150 and Cunningham Avenue. Based on the survey results, the Boneyard is classified as a Restricted Aquatic Resource at the upstream end improving to a Moderate Aquatic Resource at the downstream end.
The City of Urbana Engineering Division annually inspects the Boneyard and provides additional insight as to conditions for aquatic wildlife: In July of 2006, fish, frogs, water bugs, and other aquatic life in the naturalized area of the creek between Race Street and the Saline Branch were observed. City of Urbana also notes that from Lincoln Avenue to Race Street, the Boneyard cannot support aquatic life due to very shallow water levels, sheet-piling, and concrete floors.

May 2007
45
Saline Branch above the Boneyard does not adequately support aquatic life due to: 1) lack of habitat 2) low dissolved oxygen 3) nitrogen
Potential sources of nitrogen include row crop agriculture and urban runoff. After additional sampling, Tetra Tech (2007) concluded that dissolved oxygen is adequate and recommended that this segment be de-listed for dissolved oxygen impairment.
Saline Branch below the Boneyard does not adequately support aquatic life due to lack of habitat and the following:
1) nitrogen 2) phosphorus 3) boron 4) suspended solids 5) DDT (sediment) 6) dieldrin (sediment) 7) methoxychlor (sediment)
Potential sources of nutrients and suspended solids include row crop agriculture, urban and residential runoff, and municipal point sources. Sources of boron need to be identified, but typically include wastewater (Dan Hippe, USGS NE Region Water Quality Specialist). Contaminated sediment may be due to previous industrial practices no longer in use or from a decommissioned landfill in Urbana.
Spoon River does not adequately support aquatic life due to:
1) lack of habitat 2) low dissolved oxygen
Agricultural activities in the watershed may be contributing nutrients that encourage algal growth which eventually leads to increased oxygen demand. Lack of shading along streams may decrease dissolved oxygen concentrations. Committee members also expressed a need to obtain more information to assess the impact of channel maintenance in 2005 on sediment load.
Salt Fork River (St. Joseph to Homer Lake) does not adequately support aquatic life due to: 1) nitrogen 2) phosphorus 3) suspended solids
Potential sources of nutrients and suspended solids include row crop agriculture, urban and residential runoff, and municipal point sources.
Salt Fork River (Homer Lake to past county line) does not adequately support aquatic life
due to: 1) nitrogen 2) phosphorus 3) suspended solids
The Salt Fork does not support its use as a water supply for the town of Oakwood due to excessive nitrate. Potential sources of pollutants include row crop and other agriculture, urban and residential runoff, and municipal point sources.

May 2007
46
Based on available information, the Steering Committee identified the following water quality priorities:
Reduction of inputs of nutrients and sediment (from all known and controllable sources) throughout the watershed.
Increasing and improving aquatic wildlife habitat in Boneyard Creek, Saline Branch, and
Spoon River. Increasing dissolved oxygen is recognized as a component of this issue. While boron and contaminated sediments are of concern, there are insufficient data regarding sources and extents of the problems. The Steering Committee urges IEPA to obtain more information on these problems.
Salt Fork stream bed downstream of Homer Lake. Photo courtesy CCSWCD.

May 2007
47
Flooding and Channel Stewardship Maintenance of free flow, bank integrity, flooding, and debris blockages have been of concern to the Steering Committee since its formation in 1990. These issues are inter-related with water quality in several ways, including:
• stream bank erosion degrades water quality
• bank vegetation impacts channel hydraulics, bank stability, and water temperature
• means for addressing aquatic life impairments may include structures that affect channel hydraulics
• woody material in channels plays a role in nutrient cycling and in providing habitat for
aquatic wildlife.
Specific concerns identified by the Steering Committee include:
There is no systematic means to maintain free flow in the Salt Fork downstream of the Upper Salt Fork Drainage District. The Steering Committee has not yet reached consensus as to the degree to which this is desirable.
Debris accumulations may contribute to localized flooding and bank erosion. Past
emergency blockage removal projects, Steering Committee woody debris inventories, a 2004 aerial inventory conducted by USGS and the Illinois Department of Agriculture, and a woody debris inventory conducted by Applied Ecological Services in 2005 may provide information useful for quantifying the nature and extent of problems associated with woody debris.
Woody debris blockage and associated bank erosion along a committee member’s property (2002). Photos courtesy CCSWCD.
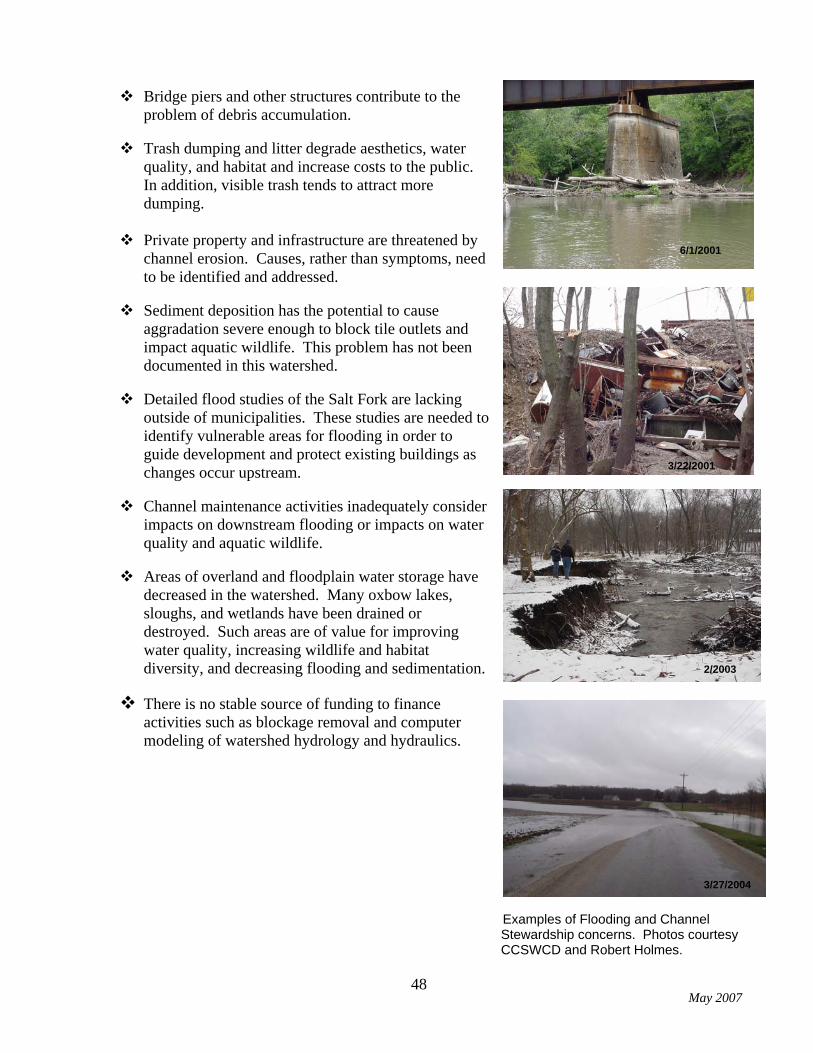
May 2007
48
Bridge piers and other structures contribute to the
problem of debris accumulation.
Trash dumping and litter degrade aesthetics, water quality, and habitat and increase costs to the public. In addition, visible trash tends to attract more dumping.
Private property and infrastructure are threatened by
channel erosion. Causes, rather than symptoms, need to be identified and addressed.
Sediment deposition has the potential to cause
aggradation severe enough to block tile outlets and impact aquatic wildlife. This problem has not been documented in this watershed.
Detailed flood studies of the Salt Fork are lacking
outside of municipalities. These studies are needed to identify vulnerable areas for flooding in order to guide development and protect existing buildings as changes occur upstream.
Channel maintenance activities inadequately consider
impacts on downstream flooding or impacts on water quality and aquatic wildlife.
Areas of overland and floodplain water storage have
decreased in the watershed. Many oxbow lakes, sloughs, and wetlands have been drained or destroyed. Such areas are of value for improving water quality, increasing wildlife and habitat diversity, and decreasing flooding and sedimentation.
There is no stable source of funding to finance activities such as blockage removal and computer modeling of watershed hydrology and hydraulics.
Examples of Flooding and Channel
Stewardship concerns. Photos courtesy CCSWCD and Robert Holmes.
6/1/2001
3/22/2001
2/2003
3/27/2004

May 2007
49
Concerns in this category are marked by strong political differences as well as insufficient knowledge of underlying processes. For now, issues of high priority are:
Funding preventative channel maintenance and solving committee controversy regarding the implementation of the Channel Stewardship Guidelines.
Localized channel erosion and lack of information to identify the underlying causes. In particular, information is needed to determine how land use changes and channel alterations impact natural flow hydraulics and channel geomorphology.
Increase and enhancement of watershed storage for nutrient processing and improved wildlife
habitat.
Adequacy of computer models already constructed for the Salt Fork to ensure they have the necessary capabilities to address future questions regarding development and channel maintenance.
Land Use Management
How we use the land directly impacts the quality of water draining from the land. Concerns related to urbanization initially identified by the Steering Committee include:
Poor urban and residential land uses adjacent to streams may be at risk to flooding or may cause water pollution.
Poorly controlled urbanization may overload agricultural drainage systems.
Prime farmland is threatened by urbanization.
Industrial development may degrade water quality and habitat. We need to be mindful of
what we send downstream in terms of quantity and quality. These issues are of high importance to the Steering Committee. However, for the most part, they are more appropriately addressed by the Champaign County Board and other entities. The Steering Committee would like to serve as a resource to the County Board as these issues are discussed, but will not address implementation details in this plan. Recreation The Salt Fork plays an important role in serving human recreational needs. Improving water quality enhances recreational opportunities and citizens can directly improve or degrade the resource through their activities.
There is a need for additional opportunities for fishing in the watershed, in water safe for human contact, and supportive of healthy aquatic wildlife.
There are insufficient opportunities for public boating and canoeing on waters safe for
canoeing.

May 2007
50
Both of these concerns are of high priority. Some aspects of these issues are being addressed under Water Quality and Flooding and Channel Stewardship. The recommendation of the Technical Advisory Committee was that another entity should take the lead in developing additional objectives and strategies for this category. Thus, recreational concerns will not be addressed directly in the remainder of this document. Terrestrial Wildlife From pre-settlement days to the present, the Salt Fork has been valued for the variety of plant and animal wildlife it supports. Current residents may not depend directly on wildlife for survival, but many recognize an interconnectedness between the environment which supports wildlife and that which supports humans. Concerns identified include:
The need to protect, enhance, diversify, and increase wildlife and wildlife habitat in the watershed.
The need to reduce the potential for wildlife damage to human and other wildlife habitat. Over-abundance of deer in particular is an apparent problem.
The watershed needs greater native plant diversity and fewer exotic and invasive species of
plants.
More one-on-one technical assistance is needed to help landowners establish habitat. In addition to the Water Quality concern of improving aquatic wildlife habitat, technical assistance for wildlife habitat establishment on land is of high priority to the Steering Committee. An implementation strategy will be outlined in this plan for providing such assistance.

May 2007
51
VI. Goals and Objectives
Goals and objectives for solving problems of high priority to the Steering Committee are presented for the categories of Water Quality, Flooding and Channel Stewardship, and Wildlife. Land Use Management and Recreation concerns will not be further addressed in a direct manner in this watershed implementation plan until additional coordination with other entities can be achieved. A fourth section lists goals and objectives for Public Information and Education necessary for implementing the Steering Committee’s plan. Water Quality The ultimate goal is for all water bodies in the Salt Fork watershed to fully support their designated uses. Available information is insufficient to determine what it will take to reach that goal, although Tetra Tech, in their role in developing TMDLs, is in the process of performing analyses for parameters for which there are numerical standards. As a first step in trying to direct water quality trends in the right direction, three water quality goals are presented with the intention of revising them as additional information becomes available. The numeric goals listed represent what is currently believed to be reasonably achievable. They are not based on scientific analysis. It is intended that such goals will be revisited as more data become available. Current loads for nutrients and sediment are estimated based on limited available information. Data needs are identified for aquatic wildlife habitat studies. This information is then used to form objectives in support of the goals. Goals
1) For the entire Salt Fork study area: • Reduce nitrate-nitrogen, phosphorus, and sediment loads by 15% each by the year
2017.
2) For the Homer Lake watershed, in addition to the above: • Improve water clarity such that Secchi depths are greater than or equal to 24 inches and
phosphorus concentrations are 0.05 mg/L or less by 2017. • Eliminate faulty on-site sewage disposal system discharges to the lake by 2010. • Replace individual on-site sewage disposal systems with a community waste water
treatment system by 2020.
3) For Boneyard Creek, Saline Branch, and Spoon River: • Develop objectives and implementation strategies for increasing aquatic wildlife habitat
in these reaches by 2010.

May 2007
52
Current Loads The nature of the pollutants and their sources makes it difficult to pinpoint how much comes from where. It is also difficult to know what combination of factors (besides pollutant quantity) causes maximum pollutant concentrations to exceed water quality limits. It is, therefore, difficult to develop quantitative objectives for reducing loads. Tetra Tech’s analyses are anticipated to assist with this problem. For now, the estimates tabulated in Tables 8 and 9 are offered as a starting point. Table 8. Estimated Contributions of Nitrate-Nitrogen from Various Sources*
* The numbers appearing in this table are subject to revision and are presented for planning purposes ONLY. The Salt Fork Steering Committee makes no claims as to the scientific reliability of these numbers and strongly discourages their citation outside of their immediate planning context.
Table 9. Estimated Contributions of Phosphorus from Various Sources*
* The numbers appearing in this table are subject to revision and are presented for planning purposes ONLY. The Salt Fork Steering Committee makes no claims as to the scientific reliability of these numbers and strongly discourages their citation outside of their immediate planning context.
Land Use/Pollutant Source
Acres (rounded values
based on Tetra Tech, 2005)
Nitrate-nitrogen export
coefficient lb/ac/yr
Nitrate-nitrogen
Load lb/yr
(Acres x export coeff.)
% of total load
Reference
Agricultural areas dominated by corn and
soybean production 218,000 18* 3.9 million* 94*
Based on data for the Little Vermilion watershed from Mitchell, 2005
Urban nonpoint
sources 19,000 10* 190,000* 5* www.water.ncsu.edu/watershedss
Other nonpoint sources 7,000 2* 14,000* 0* www.water.ncsu.edu/watershedss
Point sources NA NA 38,000* 1*
UCSD*2 (value supplied for USCD by Bachman, 2005 was multiplied by 2 to
account for other municipal point sources)
TOTAL 244,000 4.2 million lb/yr* or 7 mg/L* 100
15% load reduction 244,000 3.5 million lb/yr* or 6 mg/L* 85
Land Use/Pollutant Source
Acres (rounded values based
on Tetra Tech, 2005)
Phosphorus export
coefficient lb/ac/yr
Phosphorus Load lb/yr
(Acres x export coeff.)
% of total load Reference
Agricultural areas dominated by corn and
soybean production 218,000 0.04* 8720* 16*
Based on data for the Little Vermilion watershed from Mitchell, 2005
Urban nonpoint
sources 19,000 2.0* 38,000* 68* www.water.ncsu.edu/watershedss
Other nonpoint sources 7,000 0.1* 700* 1* www.water.ncsu.edu/watershedss
Point sources NA NA 8264* 15*
UCSD*2 (value supplied for USCD by Bachman was multiplied by 2 to account for other municipal point
sources)
TOTAL 244,000 55,700 lb/yr* or 0.09 mg/L* 100
15% load reduction 244,000 47,300 lb/yr* or 0.08 mg/L* 85

May 2007
53
Table 8 presents estimated loads from various sources for nitrate-nitrogen. Although nitrate-nitrogen is subject to denitrification, for this analysis, it is appropriate to treat it as a conservative substance. A study by Schaller et al. (2004) on the nearby Sangamon River indicated that denitrification losses were small in the overall mass balance. Very little nitrate-nitrogen data exist for the study area. Tetra Tech (2005) reports four measured nitrate-nitrogen concentrations for the outlet of the watershed addressed in this plan. However, 304 samples were collected by IEPA between 1967 and 2004 downstream of the study area near Oakwood in Vermilion County. The average of these measurements is 6.9 mg/L (Tetra Tech, 2005). This value (rounded to 7 mg/L) was used to estimate current conditions in the upstream study area.
Land use acreages in Table 8 were estimated from values reported by Tetra Tech (2005) for the watershed draining to BPJ10 (see Figures 2 and 3) based on satellite imagery collected in 1999-2000 and processed by the Illinois Natural History Survey. The largest land use in the watershed is agriculture, dominated by corn and soybean production (but also including small grains, other agriculture, and rural grasslands). The University of Illinois has studied nutrient yields from tile-drained fields in the Little Vermilion River watershed (adjacent to the Salt Fork) for over a decade (Mitchell, 2005). Those data indicate nitrate-nitrogen export rates ranging from 11-27 lb/acre/year for cropped areas. Urban areas comprise about 8% of the watershed area. No local export values are available, but a North Carolina State University (NCSU) website indicates urban export coefficients ranging from 4-12 lb/acre/year based on national data reported by the US Environmental Protection Agency (www.water.ncsu.edu/watershedss). Forest, wetlands, idle land and all remaining areas were grouped together and are assumed to export nitrate-nitrogen at a rate of 2 lb/acre/year based on the NCSU website and the Little Vermilion data. Export coefficients were multiplied by their respective land use acreage to estimate nitrate-nitrogen loads exported from each land use. These values were added to the estimated point source load. Point sources in the watershed include municipal waste treatment plants in Urbana, Rantoul, and St. Joseph. Based on data provided by Urbana and Champaign Sanitary District, total point source load is conservatively estimated to be twice that for Urbana or 38,000 lbs/year. Thus, as listed in Table 8, total annual load (from nonpoint and point sources) for the watershed is estimated to be 4.2 million lbs/year for the watershed. An average water yield of 1.1 million liters/acre/year was assumed based on data from USGS in order to estimate a flow-weighted average concentration (load/water yield). The export coefficient for agricultural land was adjusted within the range of 11-27 lb/acre to achieve the estimated concentration of 7 mg/L indicated by the downstream measurements noted above. The next question is: what average nitrate-nitrogen concentration is desirable as a goal in order for the Salt Fork to fully support its designated uses? Without better data and methods, the answer is unknown. A 15% reduction is suggested as an initial, reasonably achievable goal, subject to revision as more is learned. A 15% reduction in current loads is projected to result in an estimated annual load of 3.5 million lbs/year or an average concentration of 6 mg/L. Uncertainties embodied in Table 8 (and following tables) are likely perplexing to those faced with implementing or funding practices to reduce nonpoint source loads. It must be remembered that we are dealing with a system affected by a large number of unknowns and have limited resources for quantifying those unknowns. While the numbers presented are closer to guesses than “estimates,” they probably do reflect reality at the order of magnitude level and provide a starting point for choosing actions that do some good.

May 2007
54
A similar method was used in choosing values for phosphorus in Table 9. Phosphorus measurements in the Little Vermilion Watershed suggest an agricultural export coefficient ranging from 0.02 – 0.06 lb/ac/yr (Mitchell, 2005). The North Carolina State University (NCSU) website (www.water.ncsu.edu/watershedss) indicates urban nonpoint sources exporting phosphorus at rates ranging from 1.1-3.4 lb/acre/year, with forest and idle land contributing about 0.1 lb/ac/yr. There is no phosphorus standard for streams and measured data are not available for the outlet of the watershed. The standard for lakes is 0.05 mg/L and this should be the goal for Homer Lake. Information concerning sediment yields from various land uses in the watershed is not readily available. Based on the information presented in the inventory and discussion with soil scientist Roger Windhorn of USDA-NRCS, this plan will assume an annual suspended sediment load of 0.3 tons/acre/year averaged over all sources. Channel erosion is estimated to contribute 56 tons/mile or roughly 20% of the total suspended sediment load. A rate of 0.3 tons/acre/year translates into a total load of about 73,200 tons/year. If a 15% reduction is desired, controls are needed to reduce the total load by about 11,000 tons/year. Data Needs for Aquatic Wildlife Habitat Studies
As care is needed in selecting strategies for improving aquatic wildlife habitat and areas where they will be effective, it would be beneficial to have the Saline Branch and Spoon River (two reaches listed as impaired due to habitat alteration) surveyed by a stream geomorphologist using procedures such as those developed by USDA-NRCS:
• Stream Stabilization Inventory and Evaluation Procedure • Rapid Assessment Method of Erosion and Sediment Inventory Procedures
The Boneyard may also require study in specific areas, although much of it has already been engineered for flood control.
Stream cross section measurements are needed in order to assess the current channel stability and Channel Evolution Model (CEM) stages. Extensive surveys have been conducted on Boneyard Creek and some information may also exist for the Spoon River and Saline Branch which may help in reducing the amount of additional data that needs to be collected to perform these assessments. Some of the information needed for these procedures include (from Kinney, 2005):
• Bank-full heights and flow data to determine bank-full discharges. • Development of a CEM model to generalize current channel status, stability, and trends.
This requires judgment on the observer’s part and thus requires a trained hydraulic engineer and geomorphologist.
• Valley slope, channel slope, cross section data From this information we hope to learn:
• Bank-full discharges for each of the streams (Spoon River and Saline Branch) • Where the sediment is coming from, i.e., bank erosion or uplands • How much sediment each stream channel is delivering downstream • Where channel incision may be occurring and if it is affecting stream bank erosion • Which stream segments are unstable and to what degree • CEM stage for the different stream segments • Connectivity to the flood plain and what would be required to restore it. • Sediment-carrying capacity (requiring slope data, flow data, and computer modeling).

May 2007
55
Water Quality Objectives Based on the above current estimated loads and data needs, water quality objectives for achieving the listed goals include:
1) Achieve 70% (or better) adoption rate of nutrient and erosion control best management practices for agricultural, residential, and urban land throughout the watershed. It is unknown what degree of participation is needed to improve water quality. According to CCSWCD staff, the maximum level of participation that can reasonably be achieved is expected to be 70% of applicable acres.
2) Inform all homeowners surrounding Homer Lake regarding on-site sewage disposal system maintenance.
3) Sponsor hydraulic surveys and analyses to assess specific needs for improving aquatic wildlife habitat in Boneyard Creek, Saline Branch, and Spoon River. These activities will require the expertise of hydraulic engineers, geomorphologists, and aquatic biologists.
Flooding and Channel Stewardship Part of the mission of the Steering Committee is to ensure a river course which provides free flow, recreational opportunities, flood protection, and wildlife habitat. Much work remains to be done in terms of coming to agreement on what is desired and obtaining the data to choose wise actions. Current needs and complexities for the priority issues are outlined. The discussion is then followed by goals and objectives identified to provide a starting point. Channel Maintenance The Salt Fork downstream of St. Joseph is less-channelized than the upper reaches of the river, the gradient is less steep until close to the county line, and the banks are generally lined with trees (Kinney, 2005). The process of banks eroding and trees falling in the river is natural, is perhaps exacerbated by human activities, and is poorly understood. Resulting accumulations of trees and debris can lead to localized flooding and increased bank erosion. Past computer modeling conducted by a member of the Salt Fork Technical Advisory Committee indicated that blockages have negligible effect on upstream water levels and subsequent flooding. However, public and private funds have been used in the past to address blockages that were posing threats to roads and private property. As the area is not in a drainage district, there is no special-purpose unit of government responsible for regular maintenance, although such authority does exist at the County level and Champaign County has done some maintenance on an as-needed basis in the past. Some who rely on a free-flowing Salt Fork to provide drainage outlet essential to their agricultural operations would like to establish a means for providing regular maintenance to address existing accumulations and prevent future ones. Some who emphasize other functions of the river, such as wildlife habitat, water quality, recreation, and control of downstream flows, feel those functions are threatened by maintenance activities. Others would like to better understand channel hydrodynamics in this reach before spending money on “solutions” that may turn out to be only “band aids.” The various factions do overlap -- however, over the past 15 years, the issue has become dominated by emotion and politics. Channel Stewardship Guidelines were developed by the Steering Committee in 2002 for performing maintenance in such a way that considers all functions. However, guideline implementation as part of the 2005-2006 maintenance project raised old debates. While win-win solutions are available, the Technical Advisory Committee is unwilling to propose technical strategies until the Steering Committee reaches consensus as to what problems exist and what technical questions they want answered.

May 2007
56
Stream Bank Erosion Wayne Kinney of Midwest Streams, Inc. analyzed the aerial videography collected by USGS
and IDOA in March of 2004. For the lower 16 miles of the Salt Fork addressed by this watershed implementation plan (between points A and B in Figure 16), Kinney identified 6 logjams and 81 erosion sites (Kinney, 2005). He noted that the channel may be aggrading in this area in response to past upstream channelization. The aggradation process (that is, the process in which the bottom slope decreases due to material being deposited) includes the formation of “cutoffs” which should be allowed to continue to develop. He suggested that the sediment accumulations should be studied in more detail to determine if aggradation is indeed occurring. If so, he recommended reducing the supply of sediment available for transport through bank stabilization. For the next 12 miles upstream (between points B and C in Figure 16), which are channelized, Kinney (2005) noted 43 erosion sites. His preliminary analysis indicated that this reach would be suitable for treatment with a series of riffles and pools to reduce sediment, increase sediment transport capacity, and improve aquatic wildlife habitat. He recommended a survey of the complete channel profile and evaluation of the impact on drainage structures and out of bank flow before making specific design recommendations. The main channel upstream of point C in Figure 16 and tributaries to the Salt Fork were not inventoried due to lack of funding. Nevertheless, erosion in the upper reaches is of concern to the Steering Committee. It is recommended that discussions be held with drainage district commissioners to discuss the value of inventory in this area and mutually agreeable goals and objectives.
Examples of bank erosion. Photos courtesy Robert Holmes.
11/9/2002
1/24/2004

May 2007
57
Figure 16. Segment identifiers for proposed stream bank erosion investigations.

May 2007
58
Watershed Storage The general opinion is that increasing areas of overland and floodplain storage is desirable for the sake of water quality, wildlife habitat, recreation, as well as controlling flooding and sedimentation. Partnering organizations have successfully planned three such projects currently being implemented with public funds. The Champaign County SWCD, with funding from IDNR and assistance from a variety of organizations, are in the implementation phase of re-establishing a wetland near St. Joseph. The Urbana Park District is in the process of restoring wetlands in the former floodplain of the Saline Branch. Future plans target restoring a portion of the site for floodplain storage. The Champaign County Forest Preserve District is constructing a small wetland complex that will retain some floodwater and provide unique wildlife habitat in the Homer Lake Forest Preserve. That project is funded by the National Association of County Organizations. The many variables make it difficult to quantify how much benefit is gained from a particular project which makes it difficult to set measurable goals and objectives. The initial need is for identification of potential sites that meet basic topographic and land use criteria. Computer Modeling Needs
In 2002-2003, a hydrologic computer model was developed for the Champaign County portion of the Salt Fork watershed (Visser, 2002 and 2003). This modeling effort used the unsteady-state rainfall-runoff model TR-20, which estimates overland flow rates for each sub-basin in the watershed for selected design storms. A preliminary effort at modeling flood elevations at selected locations along the Salt Fork was then made with the steady-state hydraulics model HEC-RAS, using the estimated flow rates provided by TR-20.
Modeling of the Salt Fork River system was undertaken with limited funding and was intended to be a planning-level effort. Due to these funding limitations, the HEC-RAS hydraulics model was created from cross-section data near bridges only. In some places the cross-sections are farther apart than is standard practice for model applications that are intended to be used to definitively determine flood elevations or the impacts of various management alternatives. The existing model has distances between cross sections that are larger than 2,000 feet. Additional cross-sections are necessary to provide the accuracy and confidence in the predicted flood elevations from the hydraulic model. As the HEC-RAS model becomes better refined with more carefully discretized cross-section data, a concurrent improvement will also be realized in the TR-20 hydrologic model during recalibration with field data from USGS stream flow gauging station 03336900 on the Salt Fork near St. Joseph. These improved modeling results can be used by CCSWCD, drainage districts, and other agencies to assure protection of life and property along the various stream segments within the Salt Fork basin, in addition to the assurance of accuracy when evaluating various management options.
Cross-sections should be added to critical modeling areas, such as the main stem from St. Joseph to the Champaign-Vermilion County line. This area is not currently in a drainage district and has been the location of several large logjams over the years. Additional cross-sections would improve modeling of potential impacts of logjams and alternative management measures on upstream drainage.

May 2007
59
The existing hydraulic model is a steady-state model which has limitations when one desires to fully examine the unique behavior (such as in-channel and floodplain storages and effects of channel friction) of the Salt Fork system. With the dynamic nature of the flooding process, an unsteady-state hydraulic model, such as UNET, FEQ, or XP-SWMM needs to be implemented for the Salt Fork stream system in order to fully understand the various management alternatives. For example, as one examines the impacts of dredging the channel and eliminating boundary roughness (through removal of woody vegetation along the banks), the timing of flooding through the system needs to be evaluated. Using an unsteady flow model for the Salt Fork system also permits a better use of the unsteady inflow generated from TR-20 along different nodes of the steam. The current system of models assumes linearity in combining the flow rates at subsequent channel nodes provided from the rainfall-runoff model, TR-20. However, flood flow conveyed through a river system is a non-linear process. Thus, assuming a linear process hinders the ability to fully assess the downstream impacts of channel modifications. To capture this non-linearity, a fully dynamic unsteady-state model, such as UNET or FEQ, needs to be implemented. Furthermore, as the issue of floodwave timing and length of flooding was a driving force in the decision to pursue expensive maintenance by the drainage districts, the implementation of an unsteady-state flow model allows for full examination of the flood duration on tile outlet conditions. Flooding and Channel Stewardship Goals and Objectives
1) Reach consensus by the end of 2007 as to what is desirable regarding funding the implementation of the Channel Stewardship Guidelines.
2) Complete detailed studies by 2010 to determine if stream bank erosion controls should be
implemented as indicated by Kinney (2005) for the two lower reaches of the Salt Fork. Hold discussions regarding inventory of bank erosion in the upper reaches.
3) Increase or enhance watershed storage areas in the watershed.
• Identify potential areas of watershed storage. • Pursue incentive and grant opportunities to design and construct three new sites. • Track all watershed storage areas in 5-year increments to assess progress.
4) Improve computer modeling capabilities to address future questions as to the effects of development and channel maintenance.
• Collect additional cross-sections between St. Joseph and the watershed outlet with sufficient density to meet currently accepted standards for hydraulic models.
• Inventory tile outlets (elevation and horizontal position) in the major tributaries and the main stem.
• Decide on what is needed in computational ability.

May 2007
60
Terrestrial Wildlife In addition to the aquatic wildlife habitat goal listed under Water Quality, the Steering
Committee desires to increase and improve habitat for terrestrial species. The goals are to: • Increase terrestrial wildlife habitat by 20% (550 acres) by the year 2020. • Make technical expertise easily available to landowners for creating and maintaining
wildlife habitat. Objectives for accomplishing the second goal are addressed in the following section. Public Information and Education In order to accomplish the stated Water Quality and Wildlife goals, individual citizens will need to do what is right for the property they oversee. Thus, public information and education are essential to the success of this plan. An important goal of this plan will be to establish a staff position to serve as a resource to citizens in the Salt Fork and surrounding areas. Position objectives will be to:
• Provide advice and information to homeowners (particularly in the Homer Lake watershed) regarding water quality and wildlife.
• Provide wildlife habitat technical assistance and planting coordination
• Provide public education by serving as a resource to schools and community organizations
• Coordinate a service project clearinghouse to help match volunteers with local environmental projects such as storm drain stenciling, stream clean up, and citizen stream monitoring.
Providing technical assistance regarding a recent tree planting. Photo courtesy CCSWCD.

May 2007
61
VII. Implementation Strategies/Alternatives The Technical Advisory Committee recommended several strategies for addressing the goals outlined above for the four main categories of focus. Water Quality
Strategies are outlined below for reducing nutrient and sediment pollutant loads and for improving aquatic wildlife habitat. Nutrient and Sediment Load Reduction
The goal is to reduce annual N, P, and sediment loads by 15% by the year 2017 by encouraging maximum participation (70% of applicable acres) in implementation of best management practices. Specific practices recommended by the Technical Advisory Committee are described below for both agricultural and residential lands. Estimated load reductions are computed in Table 10.
• Nutrient management for corn/soybean cropped acres: the practice is aimed at reducing field losses of nitrate-nitrogen and phosphorus, as well as expenditures on fertilizer. It involves soil testing, developing a nutrient management plan, and applying fertilizer at a rate recommended by the University of Illinois after taking into account yield history and nutrients from other sources. For agricultural lands in this area, tile drainage is the primary means of transport for nitrate-nitrogen which is a water soluble nutrient -- there is very little surface runoff (Mitchell, 2005). Phosphorus associated with soil is transported by what little surface runoff there is. Some dissolved phosphorus may also be transported in tile flow. Based on current typical application rates of nitrogen in the area, nutrient management can reduce N application rates by up to 30 lbs/ac. This translates into an estimated tile flow load reduction of 3 lbs/ac/year of nitrate-nitrogen based on data collected in the adjacent Little Vermilion River watershed by the University of Illinois (CCSWCD estimate based on Mitchell, 2005). Fertilizer cost savings are estimated by CCSWCD to be $10/acre.
• Conservation tillage: the practice reduces field runoff from fields and thus transport of soil
and associated nutrients (particularly phosphorus). Conservation tillage encompasses a range of practices that reduce the amount of soil disturbed for seed bed preparation. Previous crop residues are typically left on the field which reduces erosion and provides some winter shelter for pheasants and other wildlife. Conservation tillage requires fewer equipment passes over the field which saves on fuel costs and reduces soil compaction leading to increased earthworm activity and water infiltration. Conservation tillage is estimated by CCSWCD to reduce soil losses to the river by 0.2 tons/acre and river P loads by 0.02 lbs/acre (phosphorus estimates based on committee member discussions with Illinois State Water Survey staff).

May 2007
62
• Filter strips and riparian buffers: replacing fertilized crops along a channel bank with trees or native grasses reduces nitrogen, phosphorus, and soil inputs to the river by trapping overland flow and by root uptake of nutrients in water moving through the soil. In addition, the area taken out of crop production receives no fertilizer to add to the stream nutrient load. In the case of dug channels with spoil berms, vegetative filters are designed with 36’ of their width on the upstream side of the berm so that runoff blocked by the berm is still filtered. In addition, trees or grass provide wildlife habitat. Filter strips trap approximately 90% of the soil from the fields they protect. Each mile of filter strip (with approximately 100 acres of cropland draining into it) is projected to save 47 tons of soil (CCSWCD estimate) and 5 lbs of associated P (estimate based on committee member discussions with Illinois State Water Survey staff). By not applying fertilizer, each acre planted as buffer likely reduces the N load by 15 lbs/yr (CCSWCD estimate). In addition to planting filter strips along streams, buffers are also recommended for surface inlets and are expected to perform in a similar manner.
• Wetlands: Wetlands fed by subsurface tile can remove nitrogen from drainage water. In a
study conducted by Kovacic, et al. (2000), constructed wetlands in Champaign County were shown to remove 37% or more of total nitrogen inputs. Local experience can guide design of this practice.
• Lawn care education: Homeowners and lawn care companies in the watershed will be
encouraged to use sound practices in fertilizing lawns. An educator will promote the use of native plantings as well as recommendations outlined by the University of Illinois to reduce N and P pollutant loads from residential sources (see later section on Public Information and Education for details regarding the educator). Recommendations will include (based on personal communications with Bruce Branham, UI Extension, 2006):
- Applying N at a rate of 2-3.5 lbs/1000 ft2/yr (87-152 lbs/ac/yr) - Using a fertilizer formulation with 0% P since soils in the area generally contain
sufficient P for residential lawns. - Applying liquid formulations of fertilizers and pesticides by trained professionals for
more accurate chemical placement. With centrifugal spreaders, granules are more likely to be deposited on sidewalks or driveways where they can be washed into the storm sewer system.
Pollutant load savings are estimated to be about 4.4 lb N/ac/yr and 0.2 lb P/ac/yr) (based on personal communications with Bruce Branham, UI Extension, 2006 and CCSWCD-estimated fractions reaching the stream).
• Construction erosion control education: The proposed educator will be expected to work in partnership with municipal and county erosion control enforcement agencies and to participate in Champaign and Urbana’s Biannual Storm Water Forum. The proposed educator will regularly tour the watershed to make sure that required erosion controls are being used effectively. The educator will not play the role of enforcement, but where improvements can be made, the educator will work with the offending party and applicable local agencies. In addition, construction companies will be encouraged to display a sign with a telephone number inviting public opinion for the question, “How’s my erosion control?” It is unknown to what extent these proposed actions will reduce sediment loads.

May 2007
63
Widespread adoption of the practices listed above should at least help reduce nonpoint source pollution in the Salt Fork. Table 10 provides estimates of the expected reductions and compares them with the load reduction goals from Tables 8 and 9. The nutrient goals may not be achievable with the practices listed; however, it is acknowledged that there is much uncertainty regarding the inputs and the expected effectiveness of proposed practices. The Committee also notes that even if these arbitrary goals are met, no guarantee is made that the end result will be full support of designated uses. Nevertheless, we are reasonably certain that implementation of the proposed practices can only help in reducing pollutant loads.
One way to encourage widespread adoption of suggested practices might be through a water
quality credit trading system. Such an arrangement provides a means for industries and municipalities to pay landowners to adopt conservation practices. Thus, a given pollutant is reduced from nonpoint sources rather than point sources. Point sources that might be willing to participate in such a program could be located outside of the local watershed for pollutants of concern at river basin scales. The Environmental Protection Agency and USDA recently (October 13, 2006) signed an agreement supporting this type of strategy (www.epa.gov/OWOW/watershed/trading.htm). A pilot project could be established in the Salt Fork watershed to test this approach for funding conservation practices. Table 10. Summary of Estimated Annual Load Reductions*
Practice Desired
Participating Acres (after plan
implementation)
Estimated N-load reduction (lbs)
Estimated P-load reduction
(lbs)
Estimated sediment load
reduction (tons)
Nutrient management 140,000 (70% of corn/soy acres)
@3 lb/ac reduction = 420,000 lbs* ? none
Conservation tillage
140,000 (70% of corn/soy acres)
(current participation: 5% corn acres and 35%
soy acres)
? @0.02 lb/ac
reduction = 2800 lbs*
@0.2 tons/ac = 28,000 tons*
Vegetative buffers 1000 new acres (10 miles) @15 lb/ac = 15,000 lbs*
10 miles x 5 lbs/mile = 50 lbs*
10 miles x 47 tons/mile = 470 tons*
Constructed wetlands (see Kovacic et al., 2000)
100 new acres of wetlands fed by 1700 acres of tile-drained
cropland
@7lbs/ac cropland = 12,000 lbs* 0* ?
Lawn care education 13,000 @4.4 lb/ac =57,000 lbs* @0.2 lb/ac = 2600 lbs* 0*
TOTAL REDUCTION FROM PRACTICES 504,000 lbs* 5450 lbs* 28,470 tons*
GOAL (15% of totals given in Table 8 for nitrate-N and Table 9 for P)
625,000 lbs* 8400 lbs* 11,000 tons*
DIFFERENCE -121,000 lbs* (shortfall) -2950 lbs* (shortfall)
17,470 tons* (overshoot)
* The numbers appearing in this table are subject to revision and are presented for planning purposes ONLY. The Salt Fork
Steering Committee makes no claims as to the scientific reliability of these numbers and strongly discourages their citation outside of their immediate planning context.

May 2007
64
Homer Lake In addition to the above measures applicable to the entire study area, the Technical Advisory
Committee and Steering Committee propose the following actions for Homer Lake:
• On-site sewage disposal system maintenance: The proposed educator will work with residents surrounding Homer Lake to provide advice in on-site sewage disposal system selection and encourage regular maintenance. The educator will be in charge of mailings and workshops. A system will be devised to remind homeowners periodically of maintenance schedules. In addition, the educator will work with residents to research a cooperative alternative in which a contractor is hired to maintain all systems on a periodic basis. A community maintenance contract would help ensure regular, professional maintenance and would likely result in a cost savings to the homeowner. It is unknown to what extent nutrient, pathogen, and solids loads to the lake will be reduced by this action.
• Community waste treatment: It is desirable that individual on-site sewage disposal systems
be replaced with a community waste treatment system by 2020. Advantages of such a system include:
- increased protection of Homer Lake water quality - increased protection of home water supplies (bored wells in the area are susceptible to
contamination from individual on-site sewage disposal systems - elimination of on-site sewage disposal systems which will become subject to new
discharge permit regulations. Additional research is needed to investigate costs and community treatment options. The proposed educator could assist with this research. In addition to material form IEPA, information from the National Environmental Services Center of West Virginia University (publishers of Small Flows Quarterly) may be useful in developing alternatives.
Aquatic Wildlife Habitat
The goal is to complete the survey and evaluation work necessary to develop a plan by 2010 for improving aquatic wildlife habitat in the Boneyard, Saline Branch, and Spoon River. The first priority is to obtain the data needed to select appropriate strategies. The recommended treatments will depend upon stream widths and other factors unique to the individual stream segments. Examples of practices that might be considered include:
• Stone Toe Protection - where eroding banks are protected with non-erodible materials • Rock Riffle Grade Control - the use of loose rock grade control structures will create or
enhance the riffle-pool flow sequence found in natural channels. In stable systems this alternating riffle-pool sequence dissipates the energy in the stream and allows the stream banks to remain stable with little or no lateral movement. This method is also used to prevent down-cutting and further incision of the channel.
• Floodplain Excavation - this is an alternative to raising the water surface and reconnecting
the channel to the historic floodplain to dissipate energy. By excavating to develop a new floodplain within the existing stream corridor the channel can be returned to its natural stable condition.

May 2007
65
• Stream Barbs and Bendway Weirs - hard structure devices used to deflect the flow away from the stream bank and into the center of the channel.
• J-Vanes – These structures use the same principle as stream barbs and bendway weirs except
they are simpler and less expensive. These structures are constructed from boulders or rip-rap and could be placed in portions of the streams along the outside bends to help protect the stream bank and provide habitat for aquatic life. The water is deflected from the bank and directed to the center of the stream, depositing sediment along the bank upstream of the j-vane and at the same time creating a pool at the end and downstream of the j-vane. The rock structures provide habitat for aquatic invertebrates, aerate the water as the water flows over the boulders, and the pool created provides deeper water for fish.
There are several practices which are less expensive and may provide some stream bank
stabilization and provide habitat for wildlife. It would be beneficial to have the stream stabilization assessments done prior to the implementation of these practices although it would not be completely necessary. For these practices to be successful, cooperation from the drainage districts and riparian landowners would be necessary.
One such practice is the j-vane, described above. Another practice is the use of fallen trees. Trees that have fallen into the stream could be cabled to the shoreline where they fall in, before they have a chance to move downstream and create an obstruction. Based upon how the trees are placed against the shoreline, they can provide stream bank protection by deflecting the flow away from the stream bank, and at the same time provide habitat for fish, invertebrates, reptiles, amphibians, birds and mammals. This could be accomplished by purchasing a boat, hydraulic winch, generator, anchors and cable. Volunteers or a hired contractor could perform the work.
In addition, trees could be planted along the west and south banks of the stream corridors. This would leave the north and east banks open for conducting maintenance of the streams. The riparian corridors should be 30-100 feet wide. This would make them not only a valuable component to streams, but provide valuable terrestrial habitat as well. Trees provide at least three major functions:
• Shade to the stream: cooler water temperatures increase the capacity of the water to hold oxygen and make the stream more hospitable for additional species of fish.
• Bank stabilization: tree roots help stabilize the stream bank by holding the soil in place. • Food source: leaves of trees, after falling into the stream become a major food source for
stream dwelling bacteria, which feed the insects and macro-invertebrates and eventually provide food for fish.
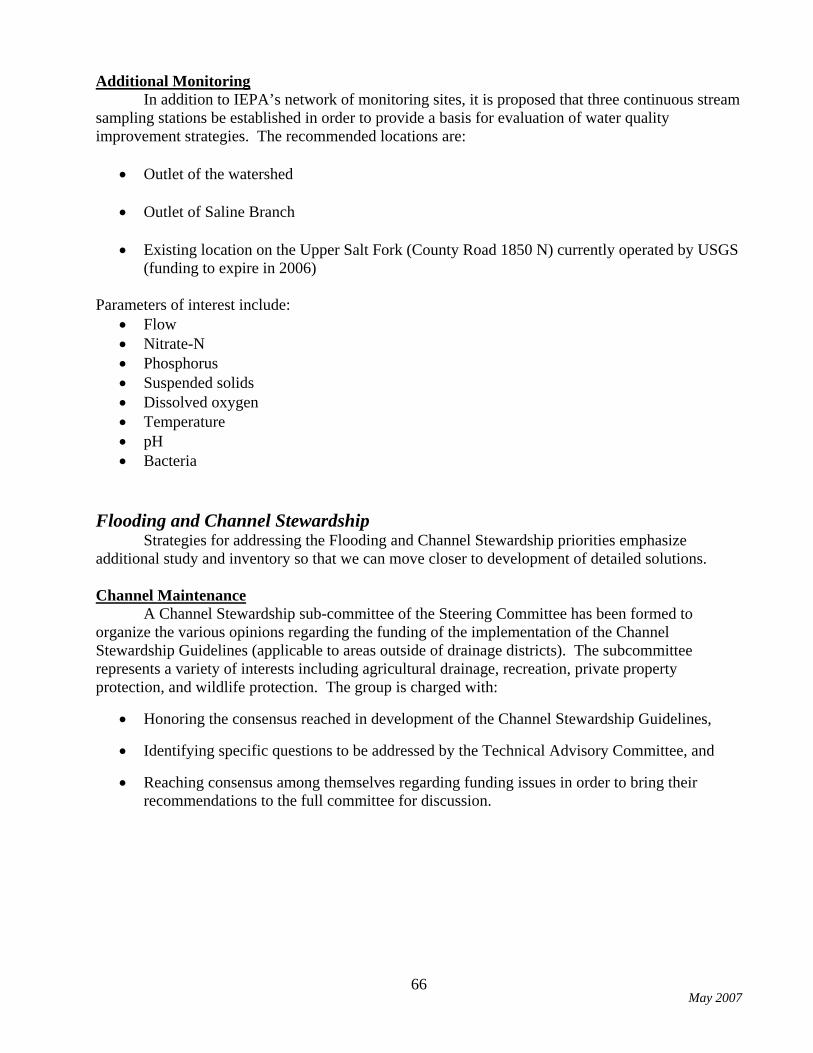
May 2007
66
Additional Monitoring In addition to IEPA’s network of monitoring sites, it is proposed that three continuous stream
sampling stations be established in order to provide a basis for evaluation of water quality improvement strategies. The recommended locations are:
• Outlet of the watershed • Outlet of Saline Branch
• Existing location on the Upper Salt Fork (County Road 1850 N) currently operated by USGS
(funding to expire in 2006) Parameters of interest include:
• Flow • Nitrate-N • Phosphorus • Suspended solids • Dissolved oxygen • Temperature • pH • Bacteria
Flooding and Channel Stewardship
Strategies for addressing the Flooding and Channel Stewardship priorities emphasize additional study and inventory so that we can move closer to development of detailed solutions. Channel Maintenance
A Channel Stewardship sub-committee of the Steering Committee has been formed to organize the various opinions regarding the funding of the implementation of the Channel Stewardship Guidelines (applicable to areas outside of drainage districts). The subcommittee represents a variety of interests including agricultural drainage, recreation, private property protection, and wildlife protection. The group is charged with:
• Honoring the consensus reached in development of the Channel Stewardship Guidelines,
• Identifying specific questions to be addressed by the Technical Advisory Committee, and
• Reaching consensus among themselves regarding funding issues in order to bring their recommendations to the full committee for discussion.
May 2007
67
Stream Bank Erosion The goal is to complete the studies necessary to make detailed recommendations for erosion
prevention or controls in the Salt Fork channel. The segment between points A and B in Figure 16 requires a study to determine if channel aggradation is occurring. If so, Wayne Kinney (2005) recommends use of stone toe protection (and possibly bendway weirs or stream barbs in selected locations) to treat 81 sites or 40,500 feet. The aggradation study would require a two-person crew and one month to measure sediment depths and collect samples for particle size distribution analysis along the 16-mile stretch.
The upper 12 miles of the study area (between B and C in Figure 16) requires a profile survey as well as an impact study of proposed riffles on drainage structures. The same two-person crew could survey the profile of the upper 12 miles over another one-month period. If additional cross-sections were measured and tile outlets inventoried, the Salt Fork model could be used to determine if tile outlets would be submerged. Results of that study would be used to refine Wayne Kinney’s initial recommendation of installing rock riffles approximately every 500 feet at an average height of 3 feet. An alternative option would be to treat the 43 eroding sites (or 34,400 feet) with stone toe protection or stream barbs. This option is less expensive but would not have the benefits of improving habitat or sediment transport capacity. Studies described above pertain to the portion of the main channel inventoried from the air by USGS and the Illinois Department of Agriculture in 2004. Studies in the upper reaches (predominantly within drainage districts) are also desirable and may aid in designing maintenance practices which are more cost-effective than those traditionally employed. Discussions are needed with drainage district commissioners and others to gather inventory data related to channel erosion in these reaches and then to develop a plan for solving problems revealed by the inventory. Watershed Storage The goal is to increase or enhance watershed storage areas. Topography and current land use may restrict the number of candidate sites. General initial steps would include:
• Discussions with UPD, CCFPD, and others to determine overall interest, perceived value, and desired functions of the projects.
• Developing rough cost estimates based on land value and experiences with past projects.
• Hiring a consultant to investigate the suitability of the sites for the proposed purposes and to develop preliminary designs with more refined cost estimates.
After discussions and approvals, funds would need to be sought for purchase and construction. Computer Modeling Needs The goal is to improve computer modeling capabilities to address future questions as to the effects of development and channel maintenance. The strategy for accomplishing this is to seek funds for collecting additional cross-sections between St. Joseph and the watershed outlet with sufficient density to meet currently acceptable hydraulic modeling standards. In addition, funding will be sought to inventory tile outlets (elevation and horizontal position) along the major tributaries and main stem. These data could be collected in conjunction with the studies needed for channel erosion control. The Technical Advisory Committee will need to determine model computational needs.

May 2007
68
Terrestrial Wildlife The goal is to increase and improve terrestrial wildlife habitat acreage by 20% (550 acres) by
the year 2020. The strategy consists of two parts: • Promote existing landowner incentive programs for establishing wildlife habitat.
• Provide the technical assistance necessary to help landowners with the sign-up, establishment, and maintenance processes.
Table 11 lists conservation practices suitable to the area which support wildlife. Currently
USDA-NRCS and SWCD field office staff promote these practices by working with landowners as they come into the office. Funding has not been available in recent years to provide staff for one-on-on contacts of eligible landowners and intensive technical assistance after enrollment. The Educator/Habitat Coordinator described in more detail in the next section could help fill this gap. Table 11. Terrestrial Wildlife Habitat Improvement Programs and Practices
PROGRAM INCENTIVES CONTRACT
LENGTH EQIP
Annual payments
up to 75% cost share 1-10 years
PRACTICE LIST
EQIP
WH
IP
WR
P
CR
P
CR
EP
CSP
CPP
GR
P
WHIP up to 75% cost share 5-15 years Constructed Wetlands X X X X X Contour Buffer strips X X X X Wildlife wetland habitat management X X X X X Field Borders X X X X
WRP up front payments up to 100% cost
share
10, 30 or Permanent
(Easements only) Tree Planting X X X X X Windbreaks (field & farmstead) X X X X Prescribed Burning X X X X Riparian Forest Buffers X X X X X X Grassed Waterways X X X X
CRP
Annual payments 50% cost share
up to additional 40%
10-15 years
Streambank Stabilization X X X X Shallow water areas for wildlife X X X Piggy back on CRP
Large incentives
15, 35 years or Permanent
(Easements) Wildlife Food Plots X X X X
* CREP (In approved watersheds on
competitive basis) Upland wildlife habitat management X X X
Annual Payments 5-10 years Conservation Cover X X X X X X X CSP (In approved watersheds on
competitive basis) Forest Stand Improvement X X X * CPP 60% cost share 1 year cost share Conservation Crop Rotation X X
Residue Management X X X X
Cover & green manure crops X X X X Critical Area Planting X X X X Ponds X X Livestock Exclusion X X X X X X Woodland Direct Seeding X X X Wetland Restoration X X X X X X X Filter strips X X X X X X Rotational Grazing X X X X X X Stream Habitat Improvement X X X X X X
Firebreaks X
Wildlife Watering Facility X X
KEY: EQIP = Environmental Quality Incentives Program WHIP = Wildlife Habitat Incentives Program WRP = Wetland Reserve Program CRP = Conservation Reserve Program *CREP = Conservation Reserve Enhancement Program CSP = Conservation Security Program *CPP = Conservation Practice Program * Denotes state funded programs.
Pasture and Hayland Planting X
May 2007
69
Public Information and Education It is proposed that one person be employed to carry out the educational outreach and
landowner technical assistance aspects of the watershed implementation plan. In particular, the Educator/Habitat Coordinator will deliver information and assistance addressing the Steering Committee’s concerns related to:
• Homer Lake • Legacy contaminants in Boneyard Creek and Saline Branch • Trash dumping and stream corridors throughout the watershed • Wildlife
The Educator/Habitat Coordinator might be employed by CCSWCD, CCFPD, or a county
entity and could serve both Champaign and Vermilion Counties. Duties include: 1) Homeowner education concerning:
- On-site sewage disposal system selection and maintenance - “Green” household cleaners and other products - Lawn care and landscaping with respect to water quality, wildlife, and energy savings - Undesirable wildlife and invasive plant species.
2) Wildlife habitat coordination: - Work one-on-one with landowners from planning to planting and maintenance of
wildlife habitat - Assist landowners with enrollment in applicable incentive programs - Work with Pheasants Forever to assist landowners with borrowing needed equipment
3) Public education: - Maintain website on issues related to the Salt Fork such as updates on water quality
monitoring results, information on contaminated sediments, hazardous waste collection days, and topics listed above
- Serve as a guest speaker and resource for community organizations and local schools - Provide information to golf courses, fertilizer dealers, lawn care companies - Develop adult-based technical education programs
4) Volunteer/service project clearinghouse coordination: - Work with area organizations to help match volunteers with local environmental
service projects such as: Storm drain stenciling River and roadside clean-up days Water quality monitoring Tree-planting Trash can installation or painting at popular fishing sites
- Maintain website listing opportunities and contact information
5) Erosion control: - Visit construction sites and make note of erosion control practices - Work with appropriate parties to address problems if erosion control is inadequate.
6) Partnerships: The Educator/Habitat Coordinator is expected to maintain working relationships with public agencies and private organizations such as those listed in Table 7.

May 2007
70
VIII. Cost Summary Estimated costs and technical assistance needs for the proposed strategies are outlined in Table 12. This table serves as an aid for summarizing the proposed options. For each strategy, landowner costs, external funding needs, and agency assistance costs are estimated. Costs are based on best available information; however, more detailed discussion of selected strategies will be required to refine these estimates before applying for funding. Representatives from the potential funding sources and implementation parties listed will be essential consultants in preparing detailed funding proposals. Some of the listed costs may seem beyond affordability and we may not succeed in finding a program to fund a full solution. Nevertheless, as we begin to work on problems and increase our data inventories, we may be able to break problems down into fundable portions. It is also hoped that as solutions are tried and are successful, that landowners will adopt practices on their own without external incentives. Sources of funding will likely reveal themselves as partners are identified for implementing various parts of the plan. For example, EPA and USDA’s promotion of water quality credit trading may lead to identifying urban partners outside of the immediate watershed for funding conservation practice incentives. Several of the Flooding and Channel Stewardship strategies are in line with the mission of USGS which may help to secure additional funding sources for conducting the studies needed to take the next steps towards developing solutions.

Table 12. Summary of Estimated Implementation Costs* Category Strategy Landowner/ Resident Costs External Funding Needs (not
including government agency technical assistance)
Agency Technical and Administrative
Assistance ($ or hours)
Potential Funding Sources
Implementers
Nutrient management on 70% of corn/soybean acres (140,000 acres)
Nutrient management plan development: $3/acre =
$420,000
Incentive payments: $10/acre = 1,400,000
2 hrs/client @ $20/hr x 1400
clients = $56,000
IEPA (319) IDOA (CPP)
Landowners, USDA-NRCS, IEPA, IDOA,
SWCDs Conservation tillage on 70% of corn/soybean acres (140,000 acres)
none
Incentive payments: $5/acre = $700,000 (assuming no limit on
acreage enrolled)
2 hrs/client @ $20/hr x 1400
clients = $56,000
IEPA (319) IDOA (CPP)
Landowners, USDA-NRCS, IEPA, IDOA,
SWCDs Filter strips, riparian buffers: 1000 acres
none (seeding costs reimbursed by
FSA; equipment can be borrowed)
Incentive payments: ~$200/acre/yr x 1000 acres x
10 years = $2M Seeding costs: $54-188/acre x
1000 acres = $54,000-$188,000
2 hrs/client @ $20/hr x 1000
clients = $40,000
USDA-FSA Landowners, USDA-NRCS, USDA-FSA,
SWCDs
Surface inlet buffers none (seeding costs reimbursed by
FSA; equipment can be borrowed from
SWCDs/Pheasants Forever)
Incentive payments: ~$50/year/inlet buffer x 40 inlets x 10 years = $20,000
Seeding costs: $54-188/acre x
10 acres = $540 -$1880
2 hrs/client @ $20/hr x 40 clients =
$1600
USDA-FSA Landowners, USDA-NRCS, USDA-FSA,
SWCDs
Lawn care education, construction erosion control, and Homer Lake on-site sewage disposal system education
See Public Information and Education
Homer Lake community waste treatment system ? ? ?
IEPA (State Revolving
Loan Fund)
Homer Lake area residents,
Homeowners’ association
Hydraulic/ geomorphologic survey of Boneyard, Saline, Spoon (36 mi)
none
Consultant fees = $25,000
40 hours @
$20/hour = $800
IEPA, IDOA, USGS, IDNR,
Drainage Districts
Private consultant assisted by
CCSWCD, USGS, drainage district commissioners
Bank stabilization/ fish habitat improvement practices for Boneyard, Saline, and Spoon (quantities unknown)
Landowners pay 25% of
installation costs
Won’t know practices or quantities until survey above is complete.
40 hours @
$20/hour = $800
IEPA, IDOA, USGS, IDNR,
Drainage Districts
Landowners, drainage districts, private contractors
with assistance from CCSWCD, USDA-
NRCS, and sponsors Continuous stream sampling: 3 stations
none Station establishment: $22,000 Sampling, maintenance, and data processing costs: $25,000/yr
40 hours @ $20/hour = $800
IEPA USGS
IEPA, USGS, IDNR, SWCDs, UI,
UCSD
Water Quality
Water quality trading program
? ? ? IEPA USDA
Industries and Municipalities
IEPA, USDA, and partners
Channel Stewardship subcommittee
none Possible legal or engineering consultant fees: $10,000
20 hours @ $20/hour = $400
? Steering Committee with assistance from
CCSWCD Hydraulic/ geomorphologic studies of reaches AB, BC in Figure 16
Channel geomorphology studies: $22,000
(See Kinney, 2005)
80 hours @ $20/hour = $1600
IEPA, IDOA, USGS, IDNR,
Drainage Districts
Private contractor with assistance from SWCDs, USGS, and
sponsors Hydraulic/ geomorphologic studies of upper reaches in drainage districts
? ? ? IEPA, IDOA, USGS, IDNR,
Drainage Districts
Private contractor with assistance from SWCDs, USGS, and
drainage district commisioners
Computer modeling data collection
none Cross-sections, profile, tile outlet surveys: $25,000
40 hours @ $20/hour = $800
IEPA, IDOA, USGS, IDNR,
Drainage Districts
Private contractor with assistance from SWCDs, USGS, and
sponsors Computer modeling none Costs dependent on modeling questions to be answered
to be determined at a later date. IEPA, IDOA, USGS, IDNR,
Drainage Districts
USGS, USDA-NRCS, or private
engineering consultant
Flooding & Channel
Stewardship
Preliminary watershed storage investigations
none Consulting fees: $5,000/site x 3 sites = $15,000
120 hours @ $20/hour = $2400
IDNR Private consultant with assistance from
SWCDs, USGS, municipalities or
Counties, and sponsors
Wildlife conservation practices
Landowners pay 40% up to $1000
For 100 participants = $100,000
Incentive payments: up to $1500/participant x 100 participants = $150,000
2 hrs/client @ $20/hr x 100 clients
= $4000
USDA-FSA USDA-NRCS:
Pheasants Forever
Landowners, USDA-NRCS, SWCDs, IDNR
Wildlife
One-on-one field and planning assistance
See Public Information and Education
Public
Information & Education
Hire Educator/Habitat Coordinator
eventual user fees?
Salary: $36,000/year Overhead: 15%
Total = $41,400/year
Included in overhead
Champaign & Vermilion Counties,
IEPA, IDNR, Private corps.
CCSWCD, CCFPD,
VCSWCD, other county entities
* The numbers appearing in this table are subject to revision and are presented for planning purposes ONLY.
The Salt Fork Steering Committee strongly discourages their citation outside of their immediate planning context.

May 2007
72
IX. Selection of Implementation Strategies Table 13 outlines the strategies the Steering Committee would like to see implemented as soon as funding is available. Activities associated with each strategy are listed for each project year. Note that project years do not necessarily correspond across strategies; for example, nutrient management may not begin in the same year as bank stabilization efforts. The strategies listed are those that have developed over the course of discussions by the Steering Committee and its Technical Advisory Committee. Activities listed in the table provide only a broad-stroke sketch. The CCSWCD Board and its subcommittees will need to identify partners to assist in preparing detailed work plans. Table 13. Schedule of Implementation*
Activities and Responsible Agent by Project Year (after funding is received) (Note: projects do not necessarily start in the same calendar year.)
Category Strategy
1 2 3 5 Nutrient management on 70% of corn/soybean acres (140,000 acres) Conservation tillage on 70% of corn/soybean acres (140,000 acres)
• Develop operator mailing list and letter for targeted mailing to eligible producers (SWCDs with help from USDA-NRCS and FSA)
• Begin enrolling producers (SWCDs)
• Continue enrolling producers (SWCDs)
• Landowners begin implementation on applicable acres
• Landowners report fertilizer rates and yields to SWCDs
• Landowners continue implementation on applicable acres
• Landowners report fertilizer rates and yields to SWCDs
• Landowners continue implementation and reporting
• Compile data and send composite results to participants.
Filter strips, riparian buffers, surface inlet buffers: 1000+ acres
• Update vegetated buffer GIS layer (SWCDs with help from FSA)
• Develop operator mailing list and letter for targeted mailing to eligible producers (SWCDs with help from NRCS and FSA)
• Begin enrolling producers (FSA with help from NRCS and SWCDs)
• Landowners establish or maintain buffers with assistance from NRCS, SWCDs, Pheasants Forever. • GIS layer update and enrollment continues (SWCDs and FSA). • NRCS and SWCDs provide assistance for buffer maintenance.
Lawn care education, and Homer Lake on-site sewage disposal system education
• Hire Educator/Wildlife Coordinator (CCFPD, CCSWCD, or county entity)
• Develop mailing list, knowledge base of pertinent information, instructional materials, website, and incentives program (Educator with assistance from UI Extension, CCFPD, and CCSWCD)
• Sponsor annual workshops (Educator with assistance from CCFPD, CCSWCD, and others) • Implement incentive programs (Educator with assistance from CCFPD, CCSWCD, and others) • Update databases and website (Educator with assistance from CCFPD, CCSWCD, and others)
Construction erosion control
• Develop knowledge base of pertinent information, instructional materials, and relationships with developers, contractors, and county entities (Educator with assistance County Zoning, municipalities, CCFPD, CCSWCD, NRCS)
• Tour the watershed every 3-6 months to see if contractors are using appropriate erosion controls. Communicate with residents, contractors, and appropriate entities if change is needed.
Homer Lake community waste treatment system
• ? • ? • ? • ?
Hydraulic/ Geomorphologic survey of Boneyard, Saline, Spoon (36 miles)
• Obtain consent & input from drainage district commissioners
• Hire consultant or work with USGS to conduct survey
• Obtain landowner permissions (CCSWCD, USGS)
• Perform survey, analyze results, make recommendations for habitat enhancement (consultant, USGS, IDNR)
• Review results with drainage district commissioners and landowners, develop detailed plan, and pursue funding for implementation. (consultant, CCSWCD, USDA-NRCS, USGS, IDNR, commissioners, landowners, UI)
Water quality sampling • Confirm specific sites, parameters to be measured, and responsibilities with USGS, IEPA, UI, ISWS, drainage districts, others.
• Establish flow gages at watershed outlet and Saline (USGS, IEPA,UI, ISWS, others)
• Collect, process, and analyze data (USGS, IEPA, UI, ISWS, or others) • Make data publicly available (USGS, IEPA, UI, ISWS, or others)
Water Quality
Water quality trading program
• Details worked out and system in place for Salt Fork landowners (IEPA, USDA)
• Advertize to potential traders (IEPA, USDA, SWCDs)
Manage and maintain program (IEPA, USDA, SWCDs)
Channel Stewardship subcommittee
Reach consensus as to what is desirable regarding funding of implementation of the Channel Stewardship Guidelines (subcommittee with assistance from CCSWCD and NRCS).
• Future activities depend on conclusions reached by subcommittee and could include: - employing legal counsel to assist in establishing a maintenance entity - sponsoring meetings with various organizations to establish a voluntary system of channel
maintenance - employing an engineering consultant to conduct additional hydrologic investigations
Hydraulic/ geomorphologic studies of reaches AB, BC in Figure 16 Hydraulic/ geomorphologic studies of upper reaches
• Perform survey, analyze results, make recommendations (consultant, USGS)
• Review results, develop detailed plan if controls are recommended, and pursue funding for implementation. (consultant, CCSWCD, NRCS, IDNR, landowners, drainage districts)
Computer modeling data collection
• Hire consultant or work with USGS to
conduct survey • Obtain landowner permissions
(CCSWCD, USGS, drainage districts)
• Collect data in conjunction with surveys (consultant)
• Organize data for future modeling efforts (CCSWCD, consultant, USGS).
Computer modeling To be determined
Flooding & Channel Stwdshp.
Preliminary watershed storage investigations
• Preliminary meetings with SWCDs, CCFPD, UPD, municipalities to determine level of commitment to watershed storage and to discuss candidate sites
• Work with USGS or hire consultant to do preliminary site investigations
(CCSWCD, USGS, and others)
• Conduct site investigations • Prepare cost estimate for
technically feasible sites
(consultant or USGS)
Hold discussions with applicable entities and develop site proposals (CCSWCD, USGS, and others)
• Pursue funding for construction.
(CCSWCD and others)
Wildlife Wildlife conservation practices
• Develop mailing list and letter for targeted mailing (Habitat Coordinator with help from SWCDs and NRCS)
• Begin enrolling producers (Habitat Coordinator, FSA)
Landowners implement practices and maintain habitat with assistance from Habitat Coordinator.
Public Info & Education
Hire Educator/ Habitat Coordinator
• Establish partnerships, and develop databases, mailing lists, training materials.
• Assist landowners as indicated above. • Maintain and improve knowledge base and training materials.
* The activities and timelines appearing in this table are subject to revision and are presented for planning purposes ONLY. The Salt Fork Steering Committee strongly discourages their citation outside of their immediate planning context.

X. Measuring Progress/Success The ultimate water quality goal is for the Salt Fork to fully support all of its designated uses and thus be removed from the 303(d) list. Establishment of three continuous sampling sites are proposed for measuring progress towards this goal. It is recognized, however, that it may take several years for improvement to be noted in terms of measured parameters such as nitrate concentration, dissolved oxygen, and biotic indices. Intermediate measures of progress include participation rates in conservation and educational programs. Specific criteria for evaluating the success of individual goals are outlined in Table 14. Milestones to be achieved 1, 2, 5, and 10 years after project initiation are also listed.
USGS gaging station on Upper Salt Fork for which funding is sought. Photos courtesy Robert Holmes.
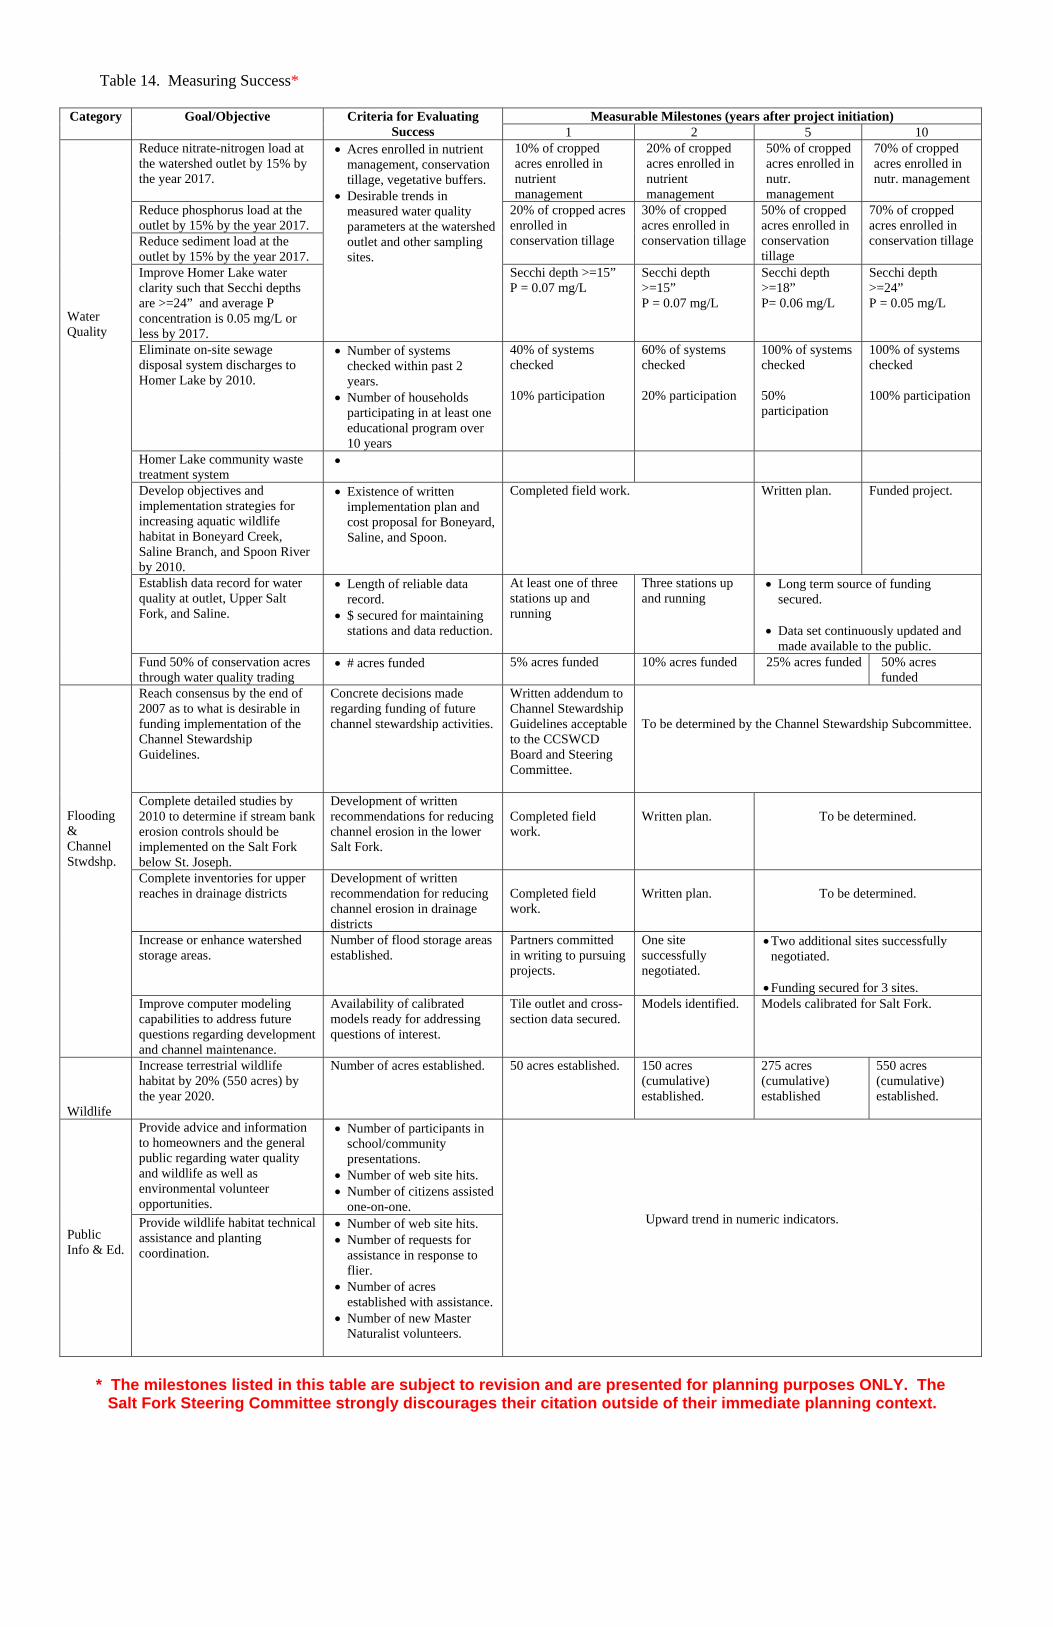
Table 14. Measuring Success*
Measurable Milestones (years after project initiation) Category Goal/Objective Criteria for Evaluating Success 1 2 5 10
Reduce nitrate-nitrogen load at the watershed outlet by 15% by the year 2017.
10% of cropped acres enrolled in nutrient management
20% of cropped acres enrolled in nutrient management
50% of cropped acres enrolled in nutr. management
70% of cropped acres enrolled in nutr. management
Reduce phosphorus load at the outlet by 15% by the year 2017. Reduce sediment load at the outlet by 15% by the year 2017.
20% of cropped acres enrolled in conservation tillage
30% of cropped acres enrolled in conservation tillage
50% of cropped acres enrolled in conservation tillage
70% of cropped acres enrolled in conservation tillage
Improve Homer Lake water clarity such that Secchi depths are >=24” and average P concentration is 0.05 mg/L or less by 2017.
• Acres enrolled in nutrient management, conservation tillage, vegetative buffers.
• Desirable trends in measured water quality parameters at the watershed outlet and other sampling sites.
Secchi depth >=15” P = 0.07 mg/L
Secchi depth >=15” P = 0.07 mg/L
Secchi depth >=18” P= 0.06 mg/L
Secchi depth >=24” P = 0.05 mg/L
Eliminate on-site sewage disposal system discharges to Homer Lake by 2010.
• Number of systems checked within past 2 years.
• Number of households participating in at least one educational program over 10 years
40% of systems checked 10% participation
60% of systems checked 20% participation
100% of systems checked 50% participation
100% of systems checked 100% participation
Homer Lake community waste treatment system
•
Develop objectives and implementation strategies for increasing aquatic wildlife habitat in Boneyard Creek, Saline Branch, and Spoon River by 2010.
• Existence of written implementation plan and cost proposal for Boneyard, Saline, and Spoon.
Completed field work. Written plan. Funded project.
Establish data record for water quality at outlet, Upper Salt Fork, and Saline.
• Length of reliable data record.
• $ secured for maintaining stations and data reduction.
At least one of three stations up and running
Three stations up and running
• Long term source of funding secured.
• Data set continuously updated and
made available to the public.
Water Quality
Fund 50% of conservation acres through water quality trading
• # acres funded 5% acres funded 10% acres funded 25% acres funded 50% acres funded
Reach consensus by the end of 2007 as to what is desirable in funding implementation of the Channel Stewardship Guidelines.
Concrete decisions made regarding funding of future channel stewardship activities.
Written addendum to Channel Stewardship Guidelines acceptable to the CCSWCD Board and Steering Committee.
To be determined by the Channel Stewardship Subcommittee.
Complete detailed studies by 2010 to determine if stream bank erosion controls should be implemented on the Salt Fork below St. Joseph.
Development of written recommendations for reducing channel erosion in the lower Salt Fork.
Completed field work.
Written plan.
To be determined.
Complete inventories for upper reaches in drainage districts
Development of written recommendation for reducing channel erosion in drainage districts
Completed field work.
Written plan.
To be determined.
Increase or enhance watershed storage areas.
Number of flood storage areas established.
Partners committed in writing to pursuing projects.
One site successfully negotiated.
• Two additional sites successfully negotiated.
• Funding secured for 3 sites.
Flooding & Channel Stwdshp.
Improve computer modeling capabilities to address future questions regarding development and channel maintenance.
Availability of calibrated models ready for addressing questions of interest.
Tile outlet and cross-section data secured.
Models identified. Models calibrated for Salt Fork.
Wildlife
Increase terrestrial wildlife habitat by 20% (550 acres) by the year 2020.
Number of acres established. 50 acres established. 150 acres (cumulative) established.
275 acres (cumulative) established
550 acres (cumulative) established.
Provide advice and information to homeowners and the general public regarding water quality and wildlife as well as environmental volunteer opportunities.
• Number of participants in school/community presentations.
• Number of web site hits. • Number of citizens assisted
one-on-one.
Public Info & Ed.
Provide wildlife habitat technical assistance and planting coordination.
• Number of web site hits. • Number of requests for
assistance in response to flier.
• Number of acres established with assistance.
• Number of new Master Naturalist volunteers.
Upward trend in numeric indicators.
* The milestones listed in this table are subject to revision and are presented for planning purposes ONLY. The
Salt Fork Steering Committee strongly discourages their citation outside of their immediate planning context.

CHALLENGES Looking back at the Mission Statement, we could start to pick apart this first comprehensive watershed implementation plan of the Salt Fork. We do not have enough numbers to evaluate the scientific-soundness or cost-effectiveness of our strategies. And we really do not know if what we propose will lead to getting off the impaired list. But, based on best available information, we do believe that the strategies listed in this plan are a good place to start for helping trends move in the right direction. The subcommittees involved in implementation will be identifying priorities for obtaining additional information necessary for moving forward. This is a “living” document. That means the planning process is iterative and is never fully complete. That means we start HERE and change what we need to when we know better. The first challenge is to not let lack of data be an excuse for doing nothing. The second challenge is for the residents of the watershed to take ownership of the plan and give it a “life” beyond fulfillment of our contract obligations to IEPA -- to take hold of some of the strategies and start doing them. The third challenge is to make note of the details of the past and present so that in the future we can see that, indeed, progress is being made.
Salt Fork near Homer Lake Forest Preserve, fall 2006. Photo courtesy CCSWCD.

REFERENCES Bloomer, J. P. 2005. Old rail’s a step closer to a trail. The News-Gazette, Feb. 13, 2005, 153(199):A-1, A-4. Champaign, IL. Cummings, K. 2000. Mussels of the Salt Fork River. Fact sheet provided by Kevin Cummings to participants on a CCSWCD-sponsored tour of the Salt Fork watershed on November 18, 2000. Cunningham, R. K., Jr. and M. S. Shoaf. 2005. From the Timber to the Prairie: A History of Homer, Illinois. Volume I. Homer Historical Society, Homer, IL. Hansen, Donald F. The Natural Resources of Champaign County. Champaign County Conservation Education Council. 2nd Edition. 1963. Hay, R. C. and J. B. Stall. 1974. History of Drainage Channel Improvement in the Vermilion River Watershed, Wabash Basin. UILU-WRC-74-0090. UIUC-WRC, Urbana, IL. Kinney, W. 2005. Aerial Assessment Report for Salt Fork of the Vermilion River – Champaign and Vermilion Counties. Prepared for the Illinois Department of Agriculture. Illinois Department of Business and Economic Development. 1971. Inventory of Illinois Drainage and Levee Districts. Volume II. State of Illinois, Springfield, IL. Illinois Department of Natural Resources, 1997. Headwaters Area Assessment. Volume 1: Geology. IDNR-ISGS, Champaign, IL. Illinois Environmental Protection Agency. 2006. Illinois Integrated Water Quality Report and Section 303(d) List – 2006. Springfield, IL. www.epa.state.il.us/water/tmdl/303d-list.html Illinois Interagency Landscape Classification Project. 2002. Land Cover of Illinois 1999-2000 Classification. (GIS layer available at www.agr.state.il.us/gis/landcover.html) Keefer, L. 2003. Sediment and Water Quality Monitoring for the Vermilion River and Little Vermilion River Watersheds. ISWS CR 2003-06. IDNR-ISWS, Champaign, IL. Kovacic, D., M. David, L. Gentry, K. Starks, and R. Cooke. 2000. Effectiveness of constructed wetlands in reducing nitrogen and phosphorus export from agricultural tile drainage. Journal of Environmental Quality, 29(4):1262-1274. Larimore, R. W. and P. B. Bayley. 1996. The fishes of Champaign County, Illinois, during a century of alterations of a prairie ecosystem. Illinois Natural History Survey Bulletin, 35(2):53-183. IDNR-INHS, Champaign, IL. Lin, S. D. and W. C. Bogner. 2000. Phase I: Diagnostic-Feasibility Study of Homer Lake, Champaign County, Illinois. ISWS CR 2000-13. IDNR-ISWS, Champaign, IL. McCollum, D. A. and J. O. Smith. 1982. A Guide to the Big Vermilion River System. Shakerag Publishing Co., Champaign, IL. Mitchell, J. K. 2005. Personal communications and data collected from the Little Vermilion River watershed.
May 2007 76
Schaller, J., T. Royer, M. David, and J. Tank. 2004. Denitrification associated with plants and sediments in an agricultural stream. Journal of the North American Benthological Society. 23(4): 667-676. Tetra Tech, 2005. TMDL Development for the Salt Fork Vermilion River Watershed - Stage One Report: Watershed Characterization and Water Quality Analysis. Final report submitted to Illinois Environmental Protection Agency. www.epa.state.il.us/water/tmdl/report/salt-vermilion/stage1-report.pdf Tetra Tech, 2006. TMDL Development for Homer Lake in the Salt Fork Vermilion River Watershed, Illinois - Stage Three Report: TMDL Development. Final report submitted to Illinois Environmental Protection Agency. www.epa.state.il.us/water/tmdl/report/salt-vermilion/homer-final-tmdl.pdf Tetra Tech, 2007. Stage 2 – Water Quality Sampling Report for TMDLs in North Fork Vermilion River, Salt Fork Vermilion River, Sugar Creek, and Walnut Point Lake. Final Report submitted to Illinois Environmental Protection Agency. www.epa.state.il.us/water/tmdl/report/salt-vermilion/stage2-report.pdf Visser, K. 2002. Salt Fork of the Vermilion River Hydraulic Model. USDA-NRCS, Champaign, IL. Visser, K. 2003. Salt Fork of the Vermilion River Hydrologic Model. USDA-NRCS, Champaign, IL.
May 2007 77

A-1 May 2007
APPENDIX • Problems & Objectives Identified by Salt Fork &Technical Advisory Committees • Channel Stewardship Guidelines • Fish Inventory from IEPA Intensive Basin Surveys • Fish Survey of Boneyard Creek in 2006 • Mammal and Tree Inventory • Mussel Inventory • Bird Inventory • Boneyard Creek Bibliography

Problems & Objectives Identified by Salt Fork Steering & Technical Advisory Committees Water Quality The Illinois Environmental Protection Agency has identified one lake and seven stream segments in the study area that have impaired designated uses. Concern regarding the impaired segments was imposed upon the Steering Committee by the CCSWCD Board. The Water Quality subcommittee, after studying available data, suggests the following problems and objectives:
Priority (H/M/L)
ID Suggested Problems Suggested Objectives
1. Homer Lake Recreational activities are impaired due to poor water clarity.
1. Slow eutrophication such that Secchi depths increase to >= 24 inches during all non-frozen months by 2015. 2. Ensure that 99% of all surrounding on-site sewage disposal systems are functioning as designed on a biennial basis. 3. Ensure that all contractors working in the watershed are using best available methods to control erosion on their work sites. 4. Minimize inputs of P from agriculture by striving for 70% of cropped acres to be under nutrient management plans and for 100% of acres to be eroding at T or less by 2015.
2. Boneyard Aquatic life impaired. 1. Insufficient data to confirm causes of
impairments. 2. Inadequate water quality. 3. Lack of riparian and in-stream habitat 4. Contaminants in stream sediments
including: DDT, hexachlorobenzene, PCBs.
1. Determine the current status of aquatic life in Boneyard Creek. 2. Implement sanitary and storm sewer system practices through existing mandates and programs. 3. To implement BMPs which improve aquatic life habitat in Boneyard Creek where technically and economically feasible. 4. Where legacy contaminants exist, limit possible human exposure or consumption.
3. Saline above Boneyard
Aquatic life impaired due to: 1. Lack of habitat. 2. Low dissolved oxygen. 3. Excessive N.
1. To improve aquatic habitat such that the Macroinvertebrate Biotic Index is 5.9 or lower and the Index of Biotic Integrity is 41 or higher by 2015. 2. To minimize inputs of N from agriculture by striving for 70% of cropped acres to be following an approved nutrient management plan by 2015. 3. To minimize inputs of N and other deoxygenating substances from urban sources by minimizing impact of storm and sanitary sewers, and encouraging BMP’s in urbanized areas.
4. Saline below Boneyard
Aquatic life impaired due to: 1. Lack of habitat 2. Excessive N and P. 3. Excessive boron. 4. Suspended solids 5. DDT, dieldrin, methoxychlor in sediment.
1. To improve aquatic habitat such that the Macroinvertebrate Biotic Index is 5.9 or lower and the Index of Biotic Integrity is 41 or higher by 2015. 2. To minimize inputs of N, P, and sediment from agriculture by striving for 70% of cropped acres to be following an approved nutrient management plan and for 100% of acres to be eroding at T or less by 2015. 3. To minimize inputs of N, P, and sediment from urban sources by encouraging installation of BMPs. 4. To reduce boron levels such that no water samples exceed 1000 ug/L (additional info needed to identify sources). 5. Where legacy contaminants exist in sediment, limit possible human exposure or consumption.
5. Spoon River Aquatic life impaired due to: 1. Lack of habitat 2. Low dissolved oxygen
1. To improve aquatic habitat such that the Macroinvertebrate Biotic Index is 5.9 or lower and the Index of Biotic Integrity is 41 or higher by 2015. 2. To reduce inputs of N, P and other deoxygenating substances from agriculture by striving for 70% of cropped acres to be following an approved nutrient management plan by the year 2015.
6. Salt Fork below St. Joseph (3 segments)
Aquatic life impaired due to: 1. Excessive N (nitrate) and P 2. Excessive suspended solids.
1. To improve aquatic habitat such that the Macroinvertebrate Biotic Index is 5.9 or lower and the Index of Biotic Integrity is 41 or higher by 2015. 2. To minimize inputs of N, P, and sediment from agriculture by striving for 70% of cropped acres to be under nutrient management plans and for 100% of acres to be eroding at T or less by 2015. 3. To minimize inputs of N, P, and sediment from urban sources through the implementation of BMPs.
A-2 May 2007

Flooding and Channel Stewardship The Flooding and Channel Stewardship subcommittee studied concerns related to maintaining free flow, bank integrity, flooding, and debris blockages. The concerns are inter-related with water quality in several ways, including:
- stream bank erosion degrades water quality - bank vegetation impacts channel hydraulics, bank stability, and water temperature - means for addressing aquatic life impairments may include structures that affect channel hydraulics
Lack of a legal entity for performing channel maintenance outside of drainage districts has been the focus of much past discussion and a former subcommittee investigated legal entity options. Since no option was found to be ideal, the current approach of the Flooding & Channel Stewardship subcommittee is to investigate voluntary methods (possibly tied with the annual Salt Fork River Clean-Up) that will accomplish the desired results. The subcommittee seeks Steering Committee feedback as to whether or not a legal entity is truly desired.
Priority (High, Med.,
or Low)
ID Suggested Problems Suggested Objectives
7. Free flow There is no systematic means for ensuring that free flow is maintained in the Salt Fork downstream of Upper Salt Fork drainage district.
Maintain adequate flow in the main channel of the Salt Fork such that fields with well-maintained tile drain within 2 days after a bank full flood event.
8. Woodydebris
Woody debris accumulations contribute to localized flooding and bank erosion.
Debris accumulations spanning more than 50% of the channel’s bank full width will remain in place for no more than 2 years.
9. Bridge piers
Bridge piers and other structures catch debris.
Minimize obstructions in the 100-year floodway (e.g., piers and pipe crossings). Strive to prevent additions of such obstructions and to remove those that are abandoned or unnecessary where practical.
10. Trashdumping
Trash dumping & litter degrade aesthetics, water quality, habitat and increase costs to public.
Reduce trash between Shakerag bridge (2125E) and the Homer Lake bridge (1200N). 1. Large items such as appliances and tires will not be present in the channel for longer than one year. 2. The quantity of “small” litter collected annually along the banks will decrease by 50% over a 10 year period. 3. Number of illegal trash dump sites will be reduced by 50% over a 10 year period.
11. Channelerosion
Private property and infrastructure are threatened by channel erosion.
Protect infrastructure and excessive land loss threatened by channel erosion as measured by landowner-installed erosion pins.
12. Sedimentdeposition
Sediment deposition blocks tile outlets and impacts aquatic wildlife.
Limit amount of sediment impacting tile flow and aquatic wildlife. Further investigate sources of sediment.
13. Floodstudies
Detailed flood studies of the Salt Fork are lacking outside of municipalities.
Maintain unobstructed floodway and floodplain through time and make sure base flood elevation does not increase.
14. Streammaintenance
Stream maintenance activities inadequately consider downstream impacts
Further develop existing hydraulic models of the Salt Fork and make available for future channel evaluations.
15. Invasivespecies
Invasive tree and plant species can retard flow.
Additional information needed to define desired state of diverse tree and plant population.
A-3 May 2007

Land Use Management The Land Use Management sub-committee was charged with addressing concerns related to urbanization and agricultural practices. Land use and watershed activities directly influence water quality. However, many of the concerns raised by the Steering Committee are already addressed by regulations at the County, state, or federal level. Feedback from the Steering Committee is needed to better define concerns inadequately addressed by these regulations.
Priority (High, Med.,
or Low)
ID Suggested Problems Suggested Objectives
16. Streamcorridors
Poor land uses adjacent to streams may be at risk to flooding or may cause water pollution.
Buffer 100% of stream corridor.
17. Urbanstorm flow
Urbanization outletting to agricultural tile strains agricultural drainage.
(Problem needs better definition. Joe Irle, please advise.)
18. Prime farmland
Prime farmland is threatened by urbanization.
(County zoning ordinances already exist.) 1. Increase educational programs stressing value of protecting prime farmland. 2. Promote urban renewal programs.
19. Newindustry
Intensifying land use may degrade water quality and/or habitat.
(Regulations already address industrial discharges and storm water handling.)
20. Trashdumping
Trash dumping & litter degrade aesthetics, water quality, habitat and increase costs to public.
Reduce instances of dumping and litter. (See Item #10.)
A-4 May 2007

A-5 May 2007
Recreation The Recreation sub-committee addressed concerns related to increasing public access to, and knowledge of, recreational opportunities. Water quality greatly impacts recreational opportunities and access for recreation also provides access for clean up and monitoring efforts. Feedback from the Steering Committee is requested regarding the extent to which problems are a lack of opportunities vs. a lack of knowledge of existing opportunities.
Priority (High, Med.,
or Low)
ID Suggested Problems Suggested Objectives
21. Hunting There are insufficient opportunities for firearm and archery hunting in the watershed.
Increase opportunities for hunting in the watershed in conjunction with deer culling and wildlife habitat objectives.
22. Hiking/biking
There are insufficient opportunities for hiking, biking, and wildlife viewing in the watershed.
1. Create additional sites for hiking, biking, and wildlife viewing. 2. Make the existence of all sites known to the public.
23. Fishing There is a need for additional opportunities for fishing in the watershed, in water safe for human contact and supportive of healthy fish, amphibians and reptiles.
1. Increase public access for the purpose of fishing. 2. Reduce occurrences of trash near bank fishing sites.
24. Boatingand canoeing
There are insufficient opportunities for public boating and canoeing on waters safe for recreation.
1. Increase public access points for boating and canoeing. 2. Reduce obstructions to safe boating and canoeing.
Wildlife The Wildlife sub-committee addressed concerns related to increasing diversity in wildlife and wildlife habitat. More inventory is needed to define the desired state of diversity in plant and animal populations.
Priority (High, Med.,
or Low)
ID Suggested Problems Suggested Objectives (more inventory needed to refine objectives)
25. Wildlifediversity
There is a need to diversify all wildlife in the watershed while reducing the potential for wildlife damage to human and wildlife habitat.
Diversify the populations of all animal species in each habitat type in the watershed. (As suitable habitat is restored and expanded, wildlife diversity will follow.)
26. Plantdiversity
The watershed needs greater native plant diversity and a fewer exotic and invasive species of plants.
1. Public and Private landholders should restore and diversify the plant populations in the watershed where possible.
2. Public and Private landholders should be educated about, and control exotic and invasive plants on their lands.
27. Habitat protection
There is a need to protect, enhance, diversify, and increase the amount of wildlife habitat.
Protect remaining biologically significant habitat through conservation easements and other programs, as well as increase suitable wildlife habitat in the watershed by 20% by 2020 through conservation easements, best management practices, and incentive programs.

A-6 May 2007
Channel Stewardship Guidelines Salt Fork River Watershed Steering Committee
Channel Stewardship Guidelines Working Paper
Introduction
The Salt Fork River Watershed Steering Committee views the Salt Fork River as a beautiful and valued resource and recognizes the important role it plays in the ecosystem, the economy, recreation, and local livelihoods. The Steering Committee seeks to be a good steward of the river and its watershed within the boundary of Champaign County.
This paper comes about as a result of local stakeholders wishing to address problems related to flooding in a responsible manner that complements the many functions of the river. Over the past 12 years, more than $30,000 of Federal emergency flood funds and many more dollars in technical assistance have been spent to respond to crises related to two blockage events on the Salt Fork. The worst of the events occurred in 1990 when collections of woody debris upstream of Sidney caused County Road 1100N to be impassable with standing water for a number of days. At least 250 acres of agricultural land could not be cropped until the blockage was removed. In 1994, Federal funds were again obtained to remove a series of blockages that were causing localized flooding and bank scour.
In late 1994 and early 1995, drainage district commissioners removed trees from the banks and
sediment bars from a portion of the Salt Fork downstream of St. Joseph in the interest of maintaining free outlet for agricultural drainage. The actions taken were without approval from the US Army Corps of Engineers and were unacceptable to many citizens. The drainage district has since applied for an “after the fact” permit for the work done.
Learning from past events, the Committee believes it is irresponsible to rely on emergency funding to respond to flooding crises and that it is also irresponsible to maintain free flow in a manner that degrades other functions of the river. This paper states the manner in which the Committee believes the channel itself should be cared for to the benefit of all.
In particular, the paper addresses channels and tributaries downstream of St. Joseph -- both natural and altered by humans -- that are not under the direct jurisdiction of a government entity, as shown in the attached map. It provides guidelines regarding activities performed in and around the stream channel to maintain the free flow of water while preserving natural ecological functions of the stream.
Stakeholders
These guidelines address the interests of each member of the Steering Committee who in turn represent a wide range of stakeholders, including (in alphabetical order):
• Agricultural producers • Ecologists • Future generations • Historians • Municipalities • Recreationists • Streamside residents

A-7 May 2007
Problems Addressed Particular problems addressed by these guidelines include (not listed in order of importance):
• Flooding due to dam-like blockages, such as those occurring in 1990 and 1994. • Streambank erosion. • Canoeists having to port on private property to go around blockages. • Decline in aquatic wildlife habitat areas. • Trash in the channel and on streambanks.
Objectives The Committee recognizes that human acts of stewardship, performed with careful
forethought, can enhance the river’s functions and correct localized problems. The Committee will implement strategies that help attain the following objectives (not listed in order of importance):
• Provide free flow of water in order to minimize property damage, provide agricultural drainage, and enhance canoeing opportunities.
• Maintain existing streambank vegetation. • Remove all human-generated garbage. • Recognize the important role woody debris plays in the ecosystem and strive to maintain it. • Improve aquatic wildlife habitat when possible to do so. • Provide means for annual channel inspection and as-needed maintenance to
minimize environmental impact and maximize long-term cost effectiveness.
General Guidelines for Channel Stewardship The following guidelines apply to the development and implementation of any channel
stewardship activity: • Appropriate agencies will be consulted for technical and legal advice to ensure that
environmentally, historically, or culturally sensitive areas are protected and that state and federal regulations are met.
• Heavy equipment will not be used except as a last resort. • Project implementation will be accomplished with minimal undesirable impacts. • Any damages resulting from a project will be repaired in a timely manner. • Affected landowners will be consulted early in the planning process to provide information
and secure any needed permissions. • Efforts will be made to promote good public relations.

A-8 May 2007
Guidelines for Removal or Repositioning of Woody Debris
The following guidelines related to woody debris are derived from those developed by the Champaign County Forest Preserve District as modified by the Salt Fork River Watershed Steering Committee. These guidelines recognize the importance of woody debris in the ecosystem as well as the potential for woody debris to interfere with other functions of the river. It is believed that with careful planning, all functions can be protected and enhanced. 1. Woody debris should be left as is in or along the channel unless it has the potential to interfere
with agricultural drainage or free-flow of water, impede canoeists, cause stream bank scour, or snag additional debris leading to future problems. The “Definitions of Stream Obstruction Conditions” provided in the American Fisheries Society 1983 document entitled Stream Obstruction Removal Guidelines will be used as an aid for determining which situations require attention. A copy of the description of the five “Conditions” outlined in the document is attached. In addition, the NRCS hydrologic computer model of the Salt Fork may be useful to help guide determinations.
2. Annual inspection and attention to woody material in or alongside the channel is preferable to
initiating activities in response to crises. Regular maintenance will help prevent the occurrence of crises, be more cost-effective, and will be of less impact to the environment.
3. Timber on the riverbank, standing or fallen that is not likely to be dislodged by flooding, will
be left. 4. Trees projecting over the river provide important shading. Such trees will be left intact.
However, limbs may be removed if they project down to bank-full level and may catch debris or injure a canoeist. Limbs may also be removed as necessary to keep a root mass from dislodging from the streambank.
5. In cases that fit the attached descriptions of Condition Two (where the subcommittee
determines the condition will cause a problem in the near future) or Condition Three, logs will be repositioned parallel to flow to correct the problem and protect the stream bank or enhance wildlife habitat. Alternatively, logs may be cut into sections short enough so as to not cause problems downstream. If a log is attached to the streambank, care should be taken to preserve the severed rootmass as well as its attachment to the bank.
6. In cases that fit the description of Condition Four (see attached), key logs will be repositioned
or cut where appropriate to restore free-flow of water. Material from these specific locations should be left in-stream as cut sections short enough so as to not cause problems downstream. However, if the quantity is such that cutting is not practical, the material may be removed or burned.
7. Areas of the river channel that have riffles (shallow water areas of gravel/rock), or that fit the
description of Condition Five (see attached), are extremely rich in aquatic life forms, and thus highly valued. Avoid impacting these areas by working around them, preferably on the downstream side.
8. The integrity of the streambank shall be maintained. Avoid unnecessary impacts to the banks
or channel that may result in erosion.
A-9 May 2007
Guidelines for Streambank Protection and Restoration 9. In cases where outside curve bank erosion is occurring and fallen logs are available, reposition
logs to the toe of the bank for the purposes of lessening bank erosion. 10. In addition to the applicable guidelines above, information provided in the following technical
documents shall be used to the extent that it is applicable to the Committee’s objectives: • USDA-NRCS, 1996. Engineering Field Handbook, Chapter 16: Streambank and
Shoreline Protection. • USDA-NRCS, 1998. National Engineering Handbook, Part 653, Stream Corridor
Restoration: Principles, Processes, and Practices. Chapter 8F: Streambank Restoration. (see www.usda.gov/stream_restoration)
Guidelines on the Creation of Aquatic Wildlife Habitat Areas 11. In addition to the applicable guidelines listed for woody debris removal and repositioning, the
guidelines provided in the reference listed below shall be used to the extent that they are applicable to the Committee’s objectives:
• USDA-NRCS, 1998. National Engineering Handbook, Part 653, Stream Corridor Restoration: Principles, Processes, and Practices. Chapter 8G: Instream Habitat Recovery. (See www.usda.gov/stream_restoration)
Guidelines on the Removal of Human-Generated Debris 12. Remove all human-generated garbage in and alongside the channel unless removal is likely to
cause more environmental damage than leaving the material. 13. Historically significant materials shall not be disturbed. When such materials are seriously in
conflict with the purpose of the environmental cleanup, request for a decision must be brought to the appropriate historical/cultural authority, e.g. the Early American Museum, Illinois Department of Natural Resources, or Illinois Historic Preservation Agency. Any decisions are to be made only after careful evaluation of the site.
Channel Stewardship Subcommittee A subgroup of the Steering Committee will be appointed by the CCSWCD to conduct an annual inspection of the channel and advise on how to apply stewardship guidelines for specific locations where it is questionable exactly what work should be done. The subcommittee will consult outside scientific resources as needed. The subcommittee will represent all stakeholders and will strive to meet the intent of the objectives and guidelines of the Steering Committee.

A-10 May 2007

A-11 May 2007

A-12 May 2007
Fish Inventory from IEPA Intensive Basin Surveys Fish collected during Intensive Basin Surveys from Salt Fork stations (courtesy Gary Lutterbie, IDNR). Species that indicate good water quality/habitat are highlighted in yellow.
Common Name
Salt Fork BPJ-09
07/08/97
Salt Fork BPJ-10
07/07/97
Salt Fork BPJ-12 7/20/76
Saline Br. BPJC-06
(d/s of Boneyard) 07/07/97
Saline Br. BPJC-08
(u/s of Boneyard) 08/13/01
Upper Salt Fk
BPJG-01 08/13/01
Spoon River BPJD-02 8/14/01
Gizzard shad 11 6 10 Grass pickerel 2 49 9 Northern pike 3 Carp 3 8 40 29 Golden shiner 1 Creek chub 4 10 97 18 Hornyhead chub 2 3 18 14 377 34 Central stoneroller 34 2430 85 Suckermouth minnow 1 3 Striped shiner 4 20 1 206 453 826 179 Redfin shiner 7 4 11 Spotfin shiner 1 23 17 29 4 Bluntnose minnow 6 65 36 52 670 109 2 Rosyface shiner 1 Sand shiner 2 122 518 13 Silverjaw minnow 1 33 13 1189 1 Quillback 1 1 22 3 1 River carpsucker 9 Highfin carpsucker 3 White sucker 24 1 1 Spotted sucker 1 4 9 Creek chubsucker 5 10 Northern hog sucker 4 2 1 2 Shorthead redhorse 9 2 Black redhorse 3 Golden redhorse 3 31 28 1 Silver redhorse 3 8 Channel catfish 2 Yellow bullhead 40 6 Black Bullhead 57 Flathead catfish 1 Stonecat 56 Tadpole madtom 19 2 Brindled madtom 1 Blackstripe topminnow 1 1 3 346 239 114 Brook silverside 6 Black crappie 2 White crappie 2 Rock bass 2 1 1 Largemouth bass 6 29 1 Spotted bass 1 2 4 Smallmouth bass 6 1 2 Green sunfish 3 3 8 6 23 Bluegill 2 33 5 26 Longear sunfish 10 53 12 15 2 12 Walleye 1 Dusky darter 2 Slenderhead darter 3 Johnny darter 2 1 5 4 Greenside darter 11 1 Orangethroat darter 7 4 TOTAL FISH 38 267 279 514 1871 5864 486 TOTAL SPECIES 12 29 24 20 19 24 15

Fish Survey of Boneyard Creek in 2006
Illinois Department of Natural Resources Gary Lutterbie
Region 3 Streams Biologist 13 October 2006
Fish population surveys were conducted at three locations on Boneyard Creek in 2006. One location was near the Armory near the intersection of Hwy 150 and Cunningham Avenue (the furthest downstream site), a second site just upstream of Gregory Street, and a third site in Scott Park (the furthest upstream site). The fish populations improved greatly as we moved downstream. Only two fish species were found at Scott Park, the creek chub and green sunfish. Both of these species are very tolerant of poor conditions. At the middle site near Gregory Street the number of fish species collected increased to 9, including the rosyface shiner, smallmouth bass and rainbow darter which are considered intolerant of poor conditions. The site furthest downstream near the Armory had 13 species of fish, including hornyhead chub, rosyface shiner and rainbow darter which are considered intolerant of poor conditions. The Revised Index of Biotic Integrity is used to evaluate a stream based on the fish collected. It uses 10 metric which are listed in the attached table. The R-IBI (Revised IBI) score increased from 3 at the furthest upstream site to 30 at the middle site, to 35 at the most downstream site. Based on these results the Boneyard would be classified as a Restricted Aquatic Resource at the upstream end, improving to a Limited Aquatic Resource in the middle portion and becoming classified as a Moderate Aquatic Resource at the lowest portion of the creek. IBI Scores as they Relate to their Integrity Class along with Their Attributes that Correspond to Each Class.
IBI Score
Integrity Class
Attributes
51-60 Unique Aquati cResource (A)
Comparable to the best situations without human disturbance; all regionally expected species for the habitat and stream size, including the most intolerant forms, are present with a full array of age classes, balanced trophic structure.
41-50 Highly Valued Aq atic uResource (B)
Species richness somewhat below expectations, especially due to the loss of the mostintolerant forms; some species are present with less than optimal abundance or size distributions; trophic structure shows some signs of stress.
31-40 Moderate Aquatic Resource (C)
Signs of additional deterioration include loss of intolerant forms, fewer species, and highly ske ed trophic structure; older age classes of top wpredators may be rare.
21-30 Limited Aquati cResource (D)
Dominated by omnivores, tolerant forms, and habitat generalists; few top carnivores; growth rates and condition factors commonly depressed; hybrids and diseased fish often present.
<21 Restricted Aquatic Resource (E)
Few fish present, mostly introduced or tolerant forms; hybrids common; disease, parasites, fin damage and other anomalies regular.
A-13 May 2007
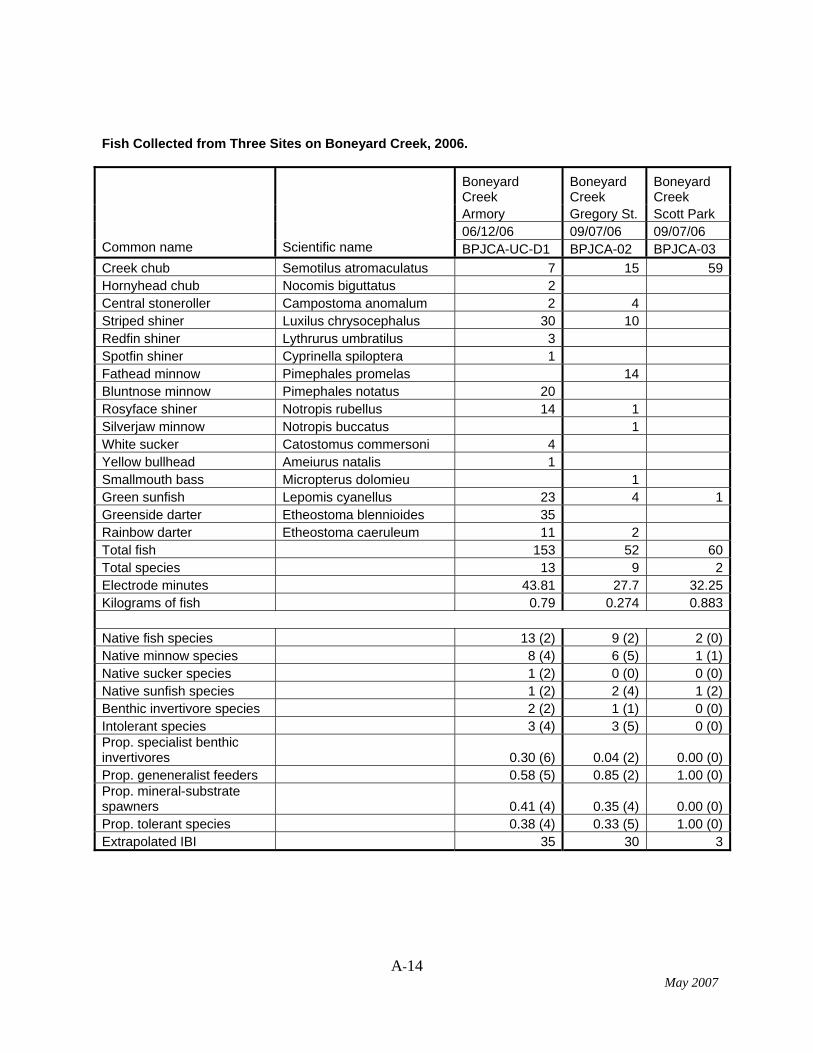
A-14 May 2007
Fish Collected from Three Sites on Boneyard Creek, 2006.
Boneyard Creek
Boneyard Creek
Boneyard Creek
Armory Gregory St. Scott Park 06/12/06 09/07/06 09/07/06
Common name
Scientific name BPJCA-UC-D1 BPJCA-02 BPJCA-03
Creek chub Semotilus atromaculatus 7 15 59Hornyhead chub Nocomis biguttatus 2 Central stoneroller Campostoma anomalum 2 4 Striped shiner Luxilus chrysocephalus 30 10 Redfin shiner Lythrurus umbratilus 3 Spotfin shiner Cyprinella spiloptera 1 Fathead minnow Pimephales promelas 14 Bluntnose minnow Pimephales notatus 20 Rosyface shiner Notropis rubellus 14 1 Silverjaw minnow Notropis buccatus 1 White sucker Catostomus commersoni 4 Yellow bullhead Ameiurus natalis 1 Smallmouth bass Micropterus dolomieu 1 Green sunfish Lepomis cyanellus 23 4 1Greenside darter Etheostoma blennioides 35 Rainbow darter Etheostoma caeruleum 11 2 Total fish 153 52 60Total species 13 9 2Electrode minutes 43.81 27.7 32.25Kilograms of fish 0.79 0.274 0.883 Native fish species 13 (2) 9 (2) 2 (0)Native minnow species 8 (4) 6 (5) 1 (1)Native sucker species 1 (2) 0 (0) 0 (0)Native sunfish species 1 (2) 2 (4) 1 (2)Benthic invertivore species 2 (2) 1 (1) 0 (0)Intolerant species 3 (4) 3 (5) 0 (0)Prop. specialist benthic invertivores 0.30 (6) 0.04 (2) 0.00 (0)Prop. geneneralist feeders 0.58 (5) 0.85 (2) 1.00 (0)Prop. mineral-substrate spawners 0.41 (4) 0.35 (4) 0.00 (0)Prop. tolerant species 0.38 (4) 0.33 (5) 1.00 (0)Extrapolated IBI 35 30 3

Mammal and Tree Inventory Mammals and trees observed along the Salt Fork as identified by Steering Committee members Larry Rishel and Clark Bullard: Mammals Trees
Common name opossum Eastern mole short-tailed shrew raccoon Bats mink striped skunk red fox coyote wood chuck Eastern chipmunk red squirrel grey squirrel flying squirrel beaver deer mouse vole muskrat rabbit white tail deer feral cat
Common name Box elder Silver maple Sugar maple Shad bush Paw paw Iron wood Bitternut hickory Pig nut hickory Shag bark hickory mockernut hickory Catalpa Hackberry Red bud Hawthorn Persimmon White ash Green ash Blue ash Honey locust Kentucky coffee tree Black walnut Red cedar Osage orange Crab apple mulberry Horn bean sycamore cottonwood Wild plum Black cherry White oak Swamp white oak Shingle oak bur oak Yellow chestnut oak Pin oak Northern red oak Black oak Sumac Black locust Willow Sassafras Bald cypress Bass wood American and slippery elm Viburnum
A-15 May 2007

A-16 May 2007
Mussel Inventory (Compiled by Kevin Cummings of the Illinois Natural History Survey)

INHS Mollusk Collection Database Search Results
A-17 May 2007
Catalogue # Genus species Common Name Status Stream Drainage County State Country Year
INHS 15171 Physella gyrina Tadpole Physa OK Boneyard Creek
(Saline Branch Drainage Ditch- Salt Fork Vermilion River Dr.) Champaign Illinois USA 1977
INHS 15167 Physella virgata Protean Physa OK Boneyard Creek
(Saline Branch Drainage Ditch- Salt Fork Vermilion River Dr.) Champaign Illinois USA 1977
INHS 15170 Physella gyrina Tadpole Physa OK Busey Woods Pond
(Saline Branch Drainage Ditch- Salt Fork Vermilion River Dr.) Champaign Illinois USA 1977
INHS 15169 Physella virgata Protean Physa OK Busey Woods Pond
(Saline Branch Drainage Ditch- Salt Fork Vermilion River Dr.) Champaign Illinois USA 1977
INHS 1364 Amblema plicata Threeridge OK East Branch Salt Fork Vermilion River (Wabash River Dr.) [Champaign] Illinois USA 1928
INHS 1365 Anodontoides ferussacianus
Cylindrical papershell OK
East Branch Salt Fork Vermilion River (Wabash River Dr.) [Champaign] Illinois USA 1928
INHS 1363 Megalonaias nervosa Washboard OK East Branch Salt Fork Vermilion River (Wabash River Dr.) [Champaign] Illinois USA 1928
INHS 1425 Pyganodon grandis Giant floater OK East Branch Salt Fork Vermilion River (Wabash River Dr.) [Champaign] Illinois USA 1928
INHS 26378 Anodontoides ferussacianus
Cylindrical papershell OK Saline Branch
(Salt Fork Vermilion River Dr.) Champaign Illinois USA 2001
INHS 252 Amblema plicata Threeridge OK Saline Branch Drainage Ditch
(Salt Fork Vermilion River Dr.) [Champaign] Illinois USA 1926
INHS 4903 Anodontoides ferussacianus
Cylindrical papershell OK
Saline Branch Drainage Ditch
(Salt Fork Vermilion River Dr.) Champaign Illinois USA 1926
INHS 19192 Anodontoides ferussacianus
Cylindrical papershell OK
Saline Branch Drainage Ditch
(Salt Fork Vermilion River Dr.) Champaign Illinois USA 1996
INHS 19193 Corbicula fluminea Asian clam Introduc
ed Saline Branch Drainage Ditch
(Salt Fork Vermilion River Dr.) Champaign Illinois USA 1996
INHS 5858 Potamilus alatus Pink Heelsplitter OK Saline Branch Drainage Ditch
(Salt Fork Vermilion River Dr.) Champaign Illinois USA 1988
INHS 21020 Toxolasma parvus Lilliput OK Saline Branch Drainage Ditch
(Salt Fork Vermilion River Dr.) [Champaign] Illinois USA 1920
INHS 132 Corbicula fluminea Asian clam Introduc
ed Saline Branch Salt Fork Vermilion River (Wabash River Dr.) Champaign Illinois USA 1987
INHS 251 Amblema plicata Threeridge OK Salt Fork [Vermilion River] (Wabash River Dr.) [Champaign] Illinois USA
INHS 762 Fusconaia flava Wabash pigtoe OK Salt Fork [Vermilion River] (Wabash River Dr.) [Champaign] Illinois USA
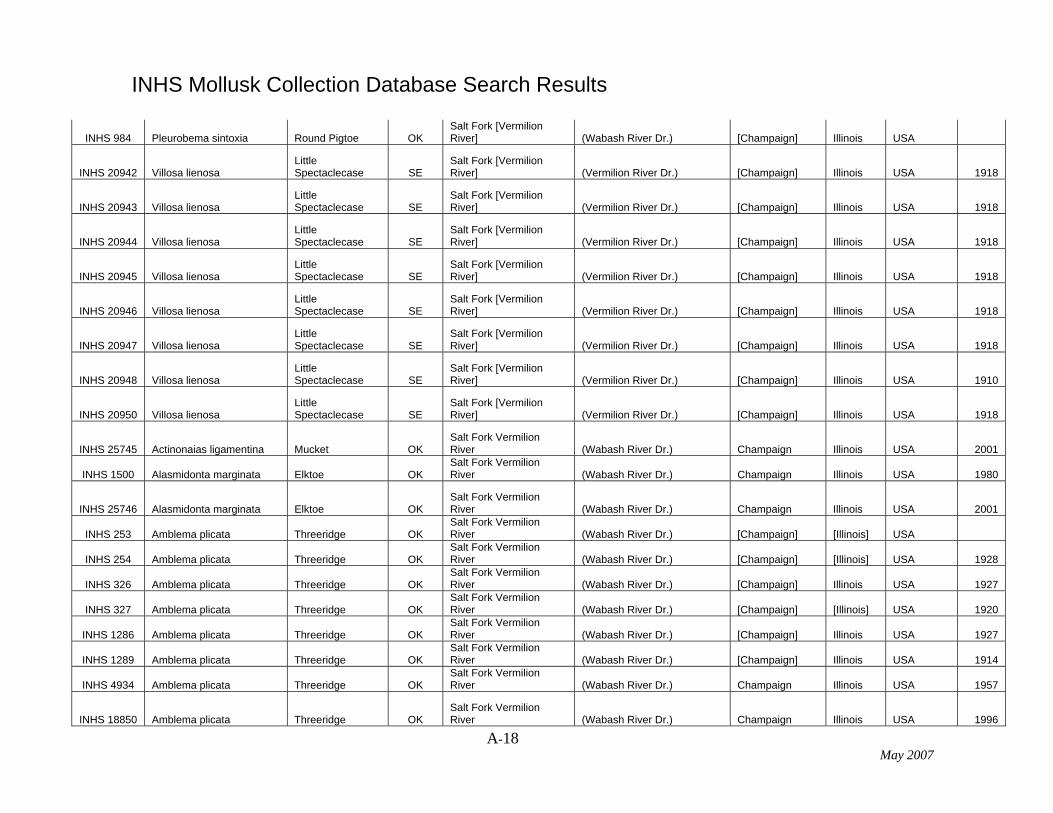
INHS Mollusk Collection Database Search Results
INHS 984 Pleurobema sintoxia Round Pigtoe OK Salt Fork [Vermilion River] (Wabash River Dr.) [Champaign] Illinois USA
INHS 20942 Villosa lienosa Little Spectaclecase SE
Salt Fork [Vermilion River] (Vermilion River Dr.) [Champaign] Illinois USA 1918
INHS 20943 Villosa lienosa Little Spectaclecase SE
Salt Fork [Vermilion River] (Vermilion River Dr.) [Champaign] Illinois USA 1918
INHS 20944 Villosa lienosa Little Spectaclecase SE
Salt Fork [Vermilion River] (Vermilion River Dr.) [Champaign] Illinois USA 1918
INHS 20945 Villosa lienosa Little Spectaclecase SE
Salt Fork [Vermilion River] (Vermilion River Dr.) [Champaign] Illinois USA 1918
INHS 20946 Villosa lienosa Little Spectaclecase SE
Salt Fork [Vermilion River] (Vermilion River Dr.) [Champaign] Illinois USA 1918
INHS 20947 Villosa lienosa Little Spectaclecase SE
Salt Fork [Vermilion River] (Vermilion River Dr.) [Champaign] Illinois USA 1918
INHS 20948 Villosa lienosa Little Spectaclecase SE
Salt Fork [Vermilion River] (Vermilion River Dr.) [Champaign] Illinois USA 1910
INHS 20950 Villosa lienosa Little Spectaclecase SE
Salt Fork [Vermilion River] (Vermilion River Dr.) [Champaign] Illinois USA 1918
INHS 25745 Actinonaias ligamentina Mucket OK Salt Fork Vermilion River (Wabash River Dr.) Champaign Illinois USA 2001
INHS 1500 Alasmidonta marginata Elktoe OK Salt Fork Vermilion River (Wabash River Dr.) Champaign Illinois USA 1980
INHS 25746 Alasmidonta marginata Elktoe OK Salt Fork Vermilion River (Wabash River Dr.) Champaign Illinois USA 2001
INHS 253 Amblema plicata Threeridge OK Salt Fork Vermilion River (Wabash River Dr.) [Champaign] [Illinois] USA
INHS 254 Amblema plicata Threeridge OK Salt Fork Vermilion River (Wabash River Dr.) [Champaign] [Illinois] USA 1928
INHS 326 Amblema plicata Threeridge OK Salt Fork Vermilion River (Wabash River Dr.) [Champaign] Illinois USA 1927
INHS 327 Amblema plicata Threeridge OK Salt Fork Vermilion River (Wabash River Dr.) [Champaign] [Illinois] USA 1920
INHS 1286 Amblema plicata Threeridge OK Salt Fork Vermilion River (Wabash River Dr.) [Champaign] Illinois USA 1927
INHS 1289 Amblema plicata Threeridge OK Salt Fork Vermilion River (Wabash River Dr.) [Champaign] Illinois USA 1914
INHS 4934 Amblema plicata Threeridge OK Salt Fork Vermilion River (Wabash River Dr.) Champaign Illinois USA 1957
INHS 18850 Amblema plicata Threeridge OK Salt Fork Vermilion River (Wabash River Dr.) Champaign Illinois USA 1996
A-18 May 2007
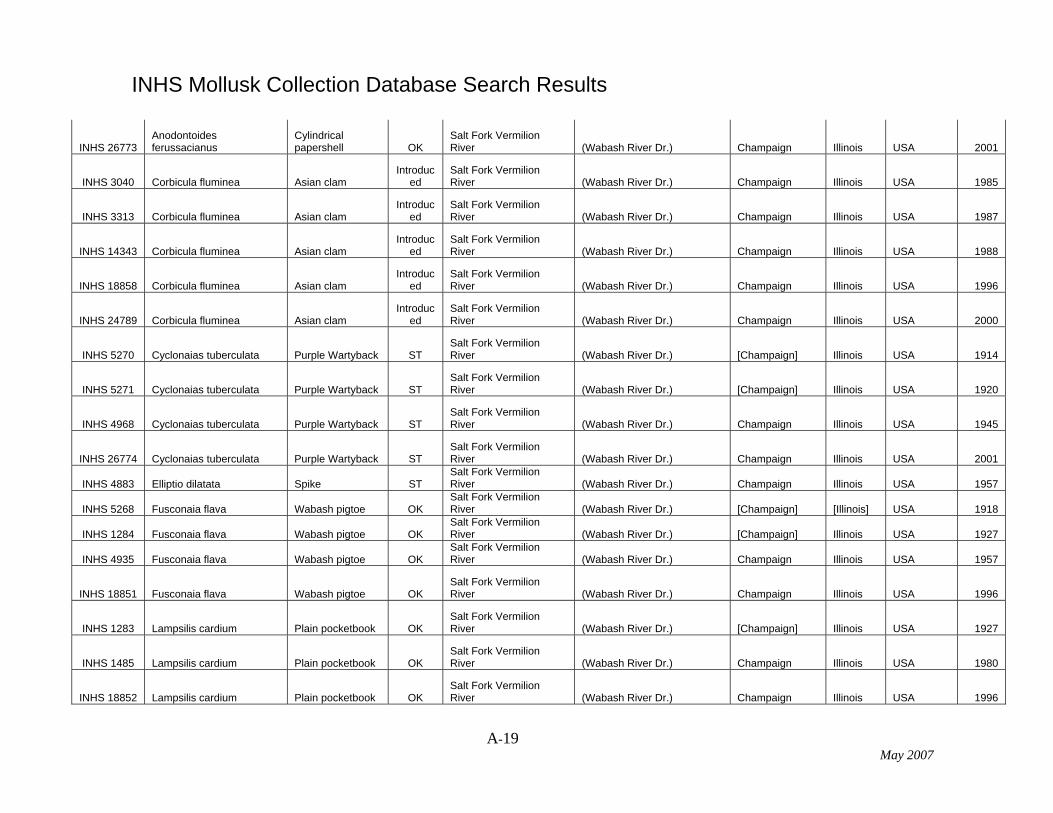
INHS Mollusk Collection Database Search Results
INHS 26773 Anodontoides ferussacianus
Cylindrical papershell OK
Salt Fork Vermilion River (Wabash River Dr.) Champaign Illinois USA 2001
INHS 3040 Corbicula fluminea Asian clam Introduc
ed Salt Fork Vermilion River (Wabash River Dr.) Champaign Illinois USA 1985
INHS 3313 Corbicula fluminea Asian clam Introduc
ed Salt Fork Vermilion River (Wabash River Dr.) Champaign Illinois USA 1987
INHS 14343 Corbicula fluminea Asian clam Introduc
ed Salt Fork Vermilion River (Wabash River Dr.) Champaign Illinois USA 1988
INHS 18858 Corbicula fluminea Asian clam Introduc
ed Salt Fork Vermilion River (Wabash River Dr.) Champaign Illinois USA 1996
INHS 24789 Corbicula fluminea Asian clam Introduc
ed Salt Fork Vermilion River (Wabash River Dr.) Champaign Illinois USA 2000
INHS 5270 Cyclonaias tuberculata Purple Wartyback ST Salt Fork Vermilion River (Wabash River Dr.) [Champaign] Illinois USA 1914
INHS 5271 Cyclonaias tuberculata Purple Wartyback ST Salt Fork Vermilion River (Wabash River Dr.) [Champaign] Illinois USA 1920
INHS 4968 Cyclonaias tuberculata Purple Wartyback ST Salt Fork Vermilion River (Wabash River Dr.) Champaign Illinois USA 1945
INHS 26774 Cyclonaias tuberculata Purple Wartyback ST Salt Fork Vermilion River (Wabash River Dr.) Champaign Illinois USA 2001
INHS 4883 Elliptio dilatata Spike ST Salt Fork Vermilion River (Wabash River Dr.) Champaign Illinois USA 1957
INHS 5268 Fusconaia flava Wabash pigtoe OK Salt Fork Vermilion River (Wabash River Dr.) [Champaign] [Illinois] USA 1918
INHS 1284 Fusconaia flava Wabash pigtoe OK Salt Fork Vermilion River (Wabash River Dr.) [Champaign] Illinois USA 1927
INHS 4935 Fusconaia flava Wabash pigtoe OK Salt Fork Vermilion River (Wabash River Dr.) Champaign Illinois USA 1957
INHS 18851 Fusconaia flava Wabash pigtoe OK Salt Fork Vermilion River (Wabash River Dr.) Champaign Illinois USA 1996
INHS 1283 Lampsilis cardium Plain pocketbook OK Salt Fork Vermilion River (Wabash River Dr.) [Champaign] Illinois USA 1927
INHS 1485 Lampsilis cardium Plain pocketbook OK Salt Fork Vermilion River (Wabash River Dr.) Champaign Illinois USA 1980
INHS 18852 Lampsilis cardium Plain pocketbook OK Salt Fork Vermilion River (Wabash River Dr.) Champaign Illinois USA 1996
A-19 May 2007

INHS Mollusk Collection Database Search Results
INHS 4884 Lampsilis fasciola Wavyrayed Lampmussel SE
Salt Fork Vermilion River (Wabash River Dr.) Champaign Illinois USA 1957
INHS 26775 Lampsilis fasciola Wavyrayed Lampmussel SE
Salt Fork Vermilion River (Wabash River Dr.) Champaign Illinois USA 2001
INHS 1471 Lampsilis siliquoidea Fatmucket OK Salt Fork Vermilion River (Wabash River Dr.) Champaign Illinois USA 1980
INHS 1477 Lampsilis siliquoidea Fatmucket OK Salt Fork Vermilion River (Wabash River Dr.) Champaign Illinois USA 1980
INHS 18853 Lampsilis siliquoidea Fatmucket OK Salt Fork Vermilion River (Wabash River Dr.) Champaign Illinois USA 1996
INHS 1424 Lasmigona complanata White Heelsplitter OK Salt Fork Vermilion River (Wabash River Dr.) [Champaign] Illinois USA 1928
INHS 4936 Lasmigona complanata White Heelsplitter OK Salt Fork Vermilion River (Wabash River Dr.) Champaign Illinois USA 1957
INHS 14342 Lasmigona complanata White Heelsplitter OK Salt Fork Vermilion River (Wabash River Dr.) Champaign Illinois USA 1988
INHS 18854 Lasmigona complanata White Heelsplitter OK Salt Fork Vermilion River (Wabash River Dr.) Champaign Illinois USA 1996
INHS 1285 Lasmigona costata Flutedshell OK Salt Fork Vermilion River (Wabash River Dr.) [Champaign] Illinois USA 1927
INHS 25747 Lasmigona costata Flutedshell OK Salt Fork Vermilion River (Wabash River Dr.) Champaign Illinois USA 2001
INHS 22800 Obovaria subrotunda Round Hickorynut SE Salt Fork Vermilion River (Wabash River Dr.) [Champaign] Illinois USA 1918
INHS 4937 Pleurobema sintoxia Round Pigtoe OK Salt Fork Vermilion River (Wabash River Dr.) Champaign Illinois USA 1957
INHS 25748 Pleurobema sintoxia Round Pigtoe OK Salt Fork Vermilion River (Wabash River Dr.) Champaign Illinois USA 2001
INHS 26776 Pleurobema sintoxia Round Pigtoe OK Salt Fork Vermilion River (Wabash River Dr.) Champaign Illinois USA 2001
INHS 340 Pyganodon grandis Giant floater OK Salt Fork Vermilion River (Wabash River Dr.) [Champaign] Illinois USA
INHS 18855 Pyganodon grandis Giant floater OK Salt Fork Vermilion River (Wabash River Dr.) Champaign Illinois USA 1996
INHS 26777 Pyganodon grandis Giant floater OK Salt Fork Vermilion River (Wabash River Dr.) Champaign Illinois USA 2001
A-20 May 2007

INHS Mollusk Collection Database Search Results
INHS 26778 Quadrula metanevra Monkeyface OK Salt Fork Vermilion River (Wabash River Dr.) Champaign Illinois USA 2001
INHS 4938 Quadrula pustulosa Pimpleback OK Salt Fork Vermilion River (Wabash River Dr.) Champaign Illinois USA 1957
INHS 25749 Quadrula pustulosa Pimpleback OK Salt Fork Vermilion River (Wabash River Dr.) Champaign Illinois USA 2001
INHS 18856 Quadrula quadrula Mapleleaf OK Salt Fork Vermilion River (Wabash River Dr.) Champaign Illinois USA 1996
INHS 20620 Simpsonaias ambigua Salamander Mussel SE
Salt Fork Vermilion River (Wabash River Dr.) [Champaign] Illinois USA 1919
INHS 5458 Strophitus undulatus Creeper OK Salt Fork Vermilion River (Wabash River Dr.) Champaign Illinois USA 1927
INHS 21024 Toxolasma lividus Purple Lilliput SE Salt Fork Vermilion River (Wabash River Dr.) [Champaign] Illinois USA 1918
INHS 25750 Toxolasma lividus Purple Lilliput SE Salt Fork Vermilion River (Wabash River Dr.) Champaign Illinois USA 2001
INHS 5459 Toxolasma parvus Lilliput OK Salt Fork Vermilion River (Wabash River Dr.) Champaign Illinois USA 1927
INHS 21019 Toxolasma parvus Lilliput OK Salt Fork Vermilion River (Wabash River Dr.) [Champaign] Illinois USA 1918
INHS 21021 Toxolasma parvus Lilliput OK Salt Fork Vermilion River (Wabash River Dr.) [Champaign] Illinois USA 1918
INHS 21022 Toxolasma parvus Lilliput OK Salt Fork Vermilion River (Wabash River Dr.) [Champaign] Illinois USA 1918
INHS 21023 Toxolasma parvus Lilliput OK Salt Fork Vermilion River (Wabash River Dr.) [Champaign] Illinois USA 1918
INHS 21028 Toxolasma parvus Lilliput OK Salt Fork Vermilion River (Wabash River Dr.) [Champaign] Illinois USA 1918
INHS 21029 Toxolasma parvus Lilliput OK Salt Fork Vermilion River (Wabash River Dr.) [Champaign] Illinois USA 1918
INHS 4939 Tritogonia verrucosa Pistolgrip OK Salt Fork Vermilion River (Wabash River Dr.) Champaign Illinois USA 1957
INHS 25751 Tritogonia verrucosa Pistolgrip OK Salt Fork Vermilion River (Wabash River Dr.) Champaign Illinois USA 2001
INHS 5272 Utterbackia imbecillis Paper Pondshell OK Salt Fork Vermilion River (Wabash River Dr.) [Champaign] Illinois USA 1918
INHS 4882 Villosa fabalis Rayed Bean SE, X Salt Fork Vermilion (Wabash River Dr.) Champaign Illinois USA 1956
A-21 May 2007
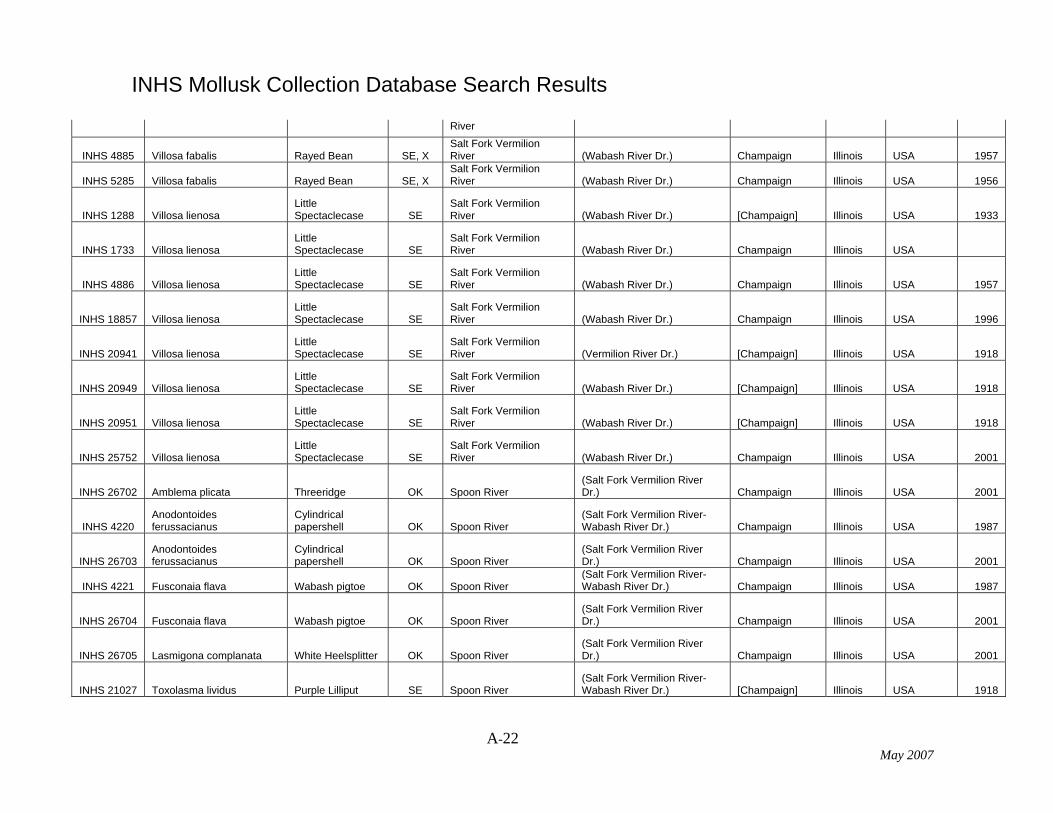
INHS Mollusk Collection Database Search Results
River
INHS 4885 Villosa fabalis Rayed Bean SE, X Salt Fork Vermilion River (Wabash River Dr.) Champaign Illinois USA 1957
INHS 5285 Villosa fabalis Rayed Bean SE, X Salt Fork Vermilion River (Wabash River Dr.) Champaign Illinois USA 1956
INHS 1288 Villosa lienosa Little Spectaclecase SE
Salt Fork Vermilion River (Wabash River Dr.) [Champaign] Illinois USA 1933
INHS 1733 Villosa lienosa Little Spectaclecase SE
Salt Fork Vermilion River (Wabash River Dr.) Champaign Illinois USA
INHS 4886 Villosa lienosa Little Spectaclecase SE
Salt Fork Vermilion River (Wabash River Dr.) Champaign Illinois USA 1957
INHS 18857 Villosa lienosa Little Spectaclecase SE
Salt Fork Vermilion River (Wabash River Dr.) Champaign Illinois USA 1996
INHS 20941 Villosa lienosa Little Spectaclecase SE
Salt Fork Vermilion River (Vermilion River Dr.) [Champaign] Illinois USA 1918
INHS 20949 Villosa lienosa Little Spectaclecase SE
Salt Fork Vermilion River (Wabash River Dr.) [Champaign] Illinois USA 1918
INHS 20951 Villosa lienosa Little Spectaclecase SE
Salt Fork Vermilion River (Wabash River Dr.) [Champaign] Illinois USA 1918
INHS 25752 Villosa lienosa Little Spectaclecase SE
Salt Fork Vermilion River (Wabash River Dr.) Champaign Illinois USA 2001
INHS 26702 Amblema plicata Threeridge OK Spoon River (Salt Fork Vermilion River Dr.) Champaign Illinois USA 2001
INHS 4220 Anodontoides ferussacianus
Cylindrical papershell OK Spoon River
(Salt Fork Vermilion River- Wabash River Dr.) Champaign Illinois USA 1987
INHS 26703 Anodontoides ferussacianus
Cylindrical papershell OK Spoon River
(Salt Fork Vermilion River Dr.) Champaign Illinois USA 2001
INHS 4221 Fusconaia flava Wabash pigtoe OK Spoon River (Salt Fork Vermilion River- Wabash River Dr.) Champaign Illinois USA 1987
INHS 26704 Fusconaia flava Wabash pigtoe OK Spoon River (Salt Fork Vermilion River Dr.) Champaign Illinois USA 2001
INHS 26705 Lasmigona complanata White Heelsplitter OK Spoon River (Salt Fork Vermilion River Dr.) Champaign Illinois USA 2001
INHS 21027 Toxolasma lividus Purple Lilliput SE Spoon River (Salt Fork Vermilion River- Wabash River Dr.) [Champaign] Illinois USA 1918
A-22 May 2007

INHS Mollusk Collection Database Search Results
A-23 May 2007
INHS 21017 Toxolasma parvus Lilliput OK Spoon River (Salt Fork Vermilion River- Wabash River Dr.) [Champaign] Illinois USA 1920
INHS 21025 Toxolasma parvus Lilliput OK Spoon River (Salt Fork Vermilion River- Wabash River Dr.) [Champaign] Illinois USA 1918
INHS 21026 Toxolasma parvus Lilliput OK Spoon River (Salt Fork Vermilion River- Wabash River Dr.) [Champaign] Illinois USA 1918
INHS 20939 Villosa lienosa Little Spectaclecase SE Spoon River
(Salt Fork Vermilion River- Wabash River Dr.) [Champaign] Illinois USA 1918
INHS 20940 Villosa lienosa Little Spectaclecase SE Spoon River
(Salt Fork Vermilion River- Wabash River Dr.) [Champaign] Illinois USA 1918
INHS 20954 Villosa lienosa Little Spectaclecase SE Spoon River
(Salt Fork Vermilion River- Wabash River Dr.) [Champaign] Illinois USA 1920
INHS 26706 Villosa lienosa Little Spectaclecase SE Spoon River
(Salt Fork Vermilion River Dr.) Champaign Illinois USA 2001
INHS 2067 Anodontoides ferussacianus
Cylindrical papershell OK
trib. Saline Branch Drainage Ditch
(Salt Fork Vermilion River Dr.) Champaign Illinois USA 1988
INHS 24505 Anodontoides ferussacianus
Cylindrical papershell OK trib. Spoon River
(Salt Fork Vermilion River Dr.) Champaign Illinois USA 2000
INHS 24507 Anodontoides ferussacianus
Cylindrical papershell OK trib. Spoon River
(Salt Fork Vermilion River Dr.) Champaign Illinois USA 2000
INHS 24506 Corbicula fluminea Asian clam Introduc
ed trib. Spoon River (Salt Fork Vermilion River Dr.) Champaign Illinois USA 2000
INHS 24508 Corbicula fluminea Asian clam Introduc
ed trib. Spoon River (Salt Fork Vermilion River Dr.) Champaign Illinois USA 2000
INHS 19753 Anodontoides ferussacianus
Cylindrical papershell OK
trib. Upper Salt Fork Drainage Ditch
(Salt Fork Vermilion River Dr.) Champaign Illinois USA 1976
INHS 19751 Anodontoides ferussacianus
Cylindrical papershell OK
Upper Salt Fork Drainage Ditch
(Salt Fork Vermilion River Dr.) Champaign Illinois USA 1976
INHS 26379 Anodontoides ferussacianus
Cylindrical papershell OK
Upper Salt Fork Drainage Ditch
(Salt Fork Vermilion River Dr.) Champaign Illinois USA 2001
INHS 26380 Strophitus undulatus Creeper OK Upper Salt Fork Drainage Ditch
(Salt Fork Vermilion River Dr.) Champaign Illinois USA 2001

A-24 May 2007
Bird Inventory Historical Inventory of Bird Species in the Salt Fork Watershed (information courtesy Beth Chato, Champaign County Audubon Society). See attached lists for:
• Busey Woods • Perkins Road • Homer Lake

A-25 May 2007
BUSEY WOODS 59 acres 2004 2005 HISTORICAL LIST Private to 1971 when donated to U/I Woods were officially Bioblitz conducted
CUMMULATIVE THROUGH Leased to UPD 1974 closed all summer for June 24-25. Jeff Brawn,
2005 Purchased by UPD 1991 boardwalk construction, so Dave Thomas,
breeding survey was Dave Enstrom
These records begin with data from limited Helen Parker, Beth Chato,
John Zimmerman from '59-'63. Mike Ward gave intense
Included is Lois Hartel's breeding study from '62. coverage. There is a gap until Beth Chato began keeping records in '75. 54 species seen during
Sightings are from many observers, especially Robert Chapel. Bioblitz √* CLP-Crystal Lake Park
#Observers 1 1 6+
# Visits 4 2 5
# Hours 4 4 58
Historical list 1st
highest 1st
Status of species in
County 2003 03 03 04 04 2004 05 05 05
227 species yr breed year + seen date breeding seen date breeding seen date breeding
seen evid high comments 128 sp 1st evidence 138 sp 1st evidence 1st evidence
seen 37 seen 44 129 seen 60
1 Grebe, Pied Billed 76
occasional nests in county
2 Cormorant, Db Cr 97 migrant √ √ 5/22
3 Heron, Great Blue 75
F 79
exploring woods last 2 years √ √ 4/4 / √* 4/17 F
4 Little Blue 99 migrant √ 4/22
5 Green 62
NY 62
nests observed on West Pond √ 5/10 P √ 4/23 / √* 4/17 /
6 Egret, Great 75 migrant √ 4/19
7 Night Heron, Bl. Cr. 75 migrant CLP 3/31
8 Yellow Crown. 62 NY 62
2 pair nested 62 & 63
9 Bittern, Least 77 rare nester in County
10 American 77 migrant
11 Vulture, Turkey 75 flies over √ √ 4/3 √ 4/3
12 Goose, Wt. Fronted 92 flies over CLP 12/13
13 Snow 85 flies over
14 Canada 74 F 04 flies over √ √ 3/7 f √ 1/10
15 Ross' 97 flies over
16 Duck, Wood 60
FL 62
nests regularly on West pond √ 5/2 P √ 3/2 / √* 3/13 /

A-26 May 2007
17 Mallard 85
FL 85
fledglings on West Pond in past √ 5/10 P √ 3/14 P √* 2/26 P
18 Pintail 81 migrant
19 Teal, Blue winged 74 migrant √ √ 4/19 √ 4/10
20 Green -winged 76 migrant
21 Shoveller 82 migrant
22 Duck, Ring-necked 84 migrant
23 Wigeon, American 93 migrant
24 Scaup, Lesser 85 migrant
25 Merganser, Hooded 87 migrant
26 Common 03 migrant √ √
27 Hawk, Sharp-shinned 75 fly over √
28 Cooper"s 62
NY 1
nest not found this year √ 3/16 ON √ 2/9 ON √ 1/10 T
29 Goshawk 62 winter √ 1/1
30 Hawk, Red-tailed 79
T 94
nesting somewhere in area √ √ 3/19 T
31 Red-shoulder
75
nests at Allerton, Middlefork √ 3/2
32 Broadwinged 85 P 85
potential for nest √ √ 4/17
33 Rough-legged 60 winter fly over √ 4/19
34 Eagle, Golden 77 flew over one time
35 Harrier, Northern 97 flies over
36 Osprey 80 flies over
37 Falcon, Peregrine 81 flies over √ 4/17
38 Merlin 78 migrant √ √ 4/9
39 Kestrel 75 X 75 could nest on fill √ 10/18
40 Bobwhite 62 X 62 now scarce in our area √ 10/10
41 Pheasant, Ring-neck
past resident on golf course
42 Rail, Virginia 60 migrant
43 Sora 82 migrant
44 King 78 migrant
45 Moorhen, Common 80
on Saline one spring
46 Coot 80 has nested in county
47 Crane, Sandhill 76 migrant √ 4/24
48 Plover, Golden 89 migrant √ 5/1
49 Semi- 77 summer
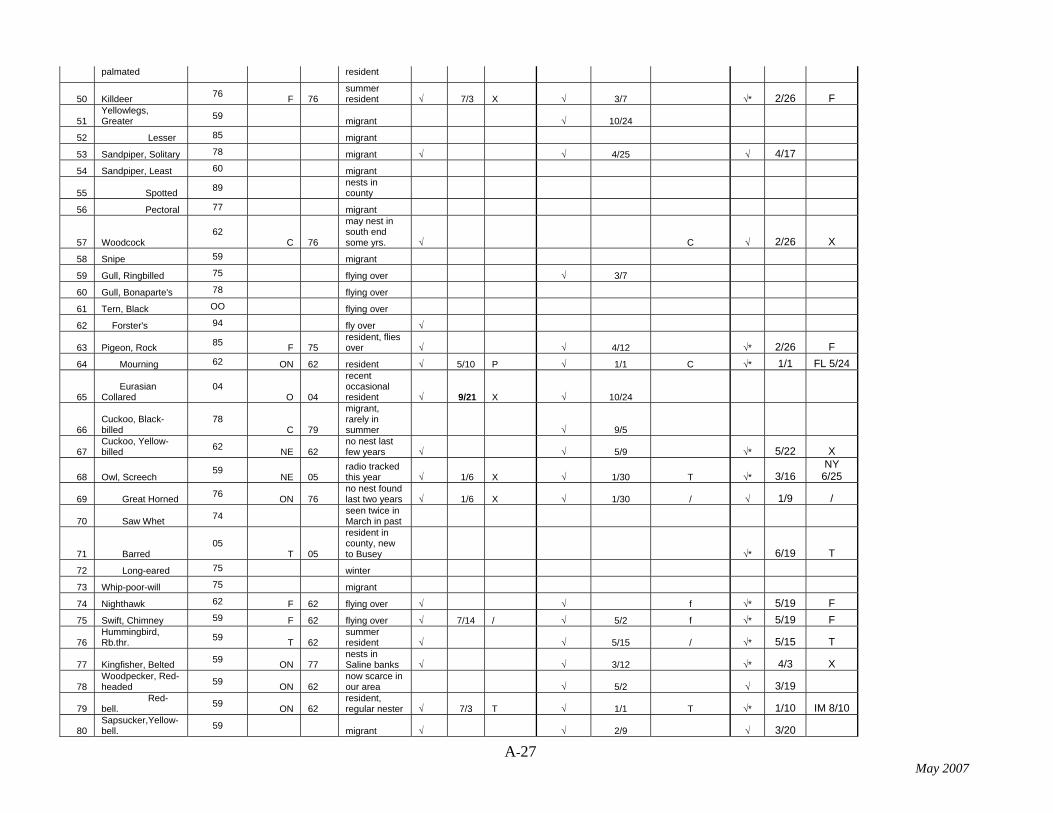
A-27 May 2007
palmated resident
50 Killdeer 76 F 76 summer resident √ 7/3 X √ 3/7 √* 2/26 F
51 Yellowlegs, Greater 59 migrant √ 10/24
52 Lesser 85 migrant
53 Sandpiper, Solitary 78 migrant √ √ 4/25 √ 4/17
54 Sandpiper, Least 60 migrant
55 Spotted 89 nests in county
56 Pectoral 77 migrant
57 Woodcock 62
C 76
may nest in south end some yrs. √ C √ 2/26 X
58 Snipe 59 migrant
59 Gull, Ringbilled 75 flying over √ 3/7
60 Gull, Bonaparte's 78 flying over
61 Tern, Black OO flying over
62 Forster's 94 fly over √
63 Pigeon, Rock 85 F 75 resident, flies over √ √ 4/12 √* 2/26 F
64 Mourning 62 ON 62 resident √ 5/10 P √ 1/1 C √* 1/1 FL 5/24
65 Eurasian Collared
04 O 04
recent occasional resident √ 9/21 X √ 10/24
66 Cuckoo, Black-billed
78 C 79
migrant, rarely in summer √ 9/5
67 Cuckoo, Yellow-billed 62 NE 62
no nest last few years √ √ 5/9 √* 5/22 X
68 Owl, Screech 59
NE 05 radio tracked this year √ 1/6 X √ 1/30 T √* 3/16
NY 6/25
69 Great Horned 76 ON 76 no nest found last two years √ 1/6 X √ 1/30 / √ 1/9 /
70 Saw Whet 74 seen twice in March in past
71 Barred 05
T 05
resident in county, new to Busey √* 6/19 T
72 Long-eared 75 winter
73 Whip-poor-will 75 migrant
74 Nighthawk 62 F 62 flying over √ √ f √* 5/19 F
75 Swift, Chimney 59 F 62 flying over √ 7/14 / √ 5/2 f √* 5/19 F
76 Hummingbird, Rb.thr. 59 T 62
summer resident √ √ 5/15 / √* 5/15 T
77 Kingfisher, Belted 59 ON 77 nests in Saline banks √ √ 3/12 √* 4/3 X
78 Woodpecker, Red-headed 59 ON 62
now scarce in our area √ 5/2 √ 3/19
79 Red-bell. 59 ON 62
resident, regular nester √ 7/3 T √ 1/1 T √* 1/10 IM 8/10
80 Sapsucker,Yellow-bell. 59 migrant √ √ 2/9 √ 3/20

A-28 May 2007
81 Woodpecker, Downy 59 ON 76
resident, regular nester √ 6/9 FL √ 1/1 T √* 1/14 FL 5/29
82 Hairy 59
ON 80 resident, 1 pair √ √ 5/30 T √* 4/12
NY 5/22
83 Black-backed Woodpecker
one old record, winter R Cooper
84 Flicker, Northern 59
ON 62
summer, winters regularly √ 7/3 FL √ 3/21 T √* 4/3 IM 7/1
85 Woodpecker, Pileated
83 / 83
resident selected spots √ 4/20
86 Flycatcher Olive-sided 59 migrant
87 Pewee, Eastern 59 FL 76 summer resident √ √ 5/15 T √* 5/8 FL 6/25
88 Western 84
one record, Robert Chapel
89 Flycatch.,Yellow-bell. 79 migrant √ √ 5/24 √ 8/24
90 Flycatcher, Acadian 76 T 85
occasional nester √ 5/30 CLP 5/7
91 Alder 77 migrant √ 9/5
92 Willow 75 T 75 nests at Meadowbrook
93 Least 74 X 78 rare breeder in our area √ √ 5/15 √ 5/8
94 Phoebe, Eastern 59 ON 76 nests under bridges √ √ 3/7 √* 3/20 T 6/25
95 Flycatcher, Great Cr. 60 FL 62
summer resident √ √ 5/2 T √* 5/7 T 6/25
96 Kingbird, Eastern 77 0N 78 summer resident CLP fL CLP 5/7 FLCLP
97 Vireo, White-eyed 60 FL 77 no nests in last few years √ 6/16 X √ 4/25 T √ 4/28
98 Bell's 76 P 85 nests at Meadowbrook
99 Solitary 59 migrant √ √ 5/2 √ 4/12
100 Yellow-throated
76 X 05
new to breeding bird list √ √ 5/9 √* 4/29 X 6/25
101 Warbling 60 FL 76 summer resident √ √ 4/25 √* 4/28 A 6/25
102 Philadelphia 59 migrant √ √ 5/2 √ 5/22
103 Red-eyed 59 FL 76 summer resident √ 7/14 T √ 5/2 fL √* 5/9 IM 8/10
104 Jay, Blue 59 ON 62 resident √ / √ 1/1 NB √* 1/10 FL 6/30
105 Crow, American 59 / 62 resident √ / √ 3/7 f √* 1/18 X 6/25
106 Lark, Horned 77 flies over √ 2/26
107 Martin, Purple 62 F 62 flies over √ 4/17
108 Swallow, Tree 75 flies over √ 4/4
109 Rough-winged 77 P 98
summer resident √ √* 5/1 T 6/25
110 Bank 78 nests at Riverbend

A-29 May 2007
111 Barn* 60 ON 75 used to nest under bridge √ √ 5/9 √* 5/8 /6/25
112 Cliff OO nests at Homer Lake
113 Chickadee, Black-cap.
62 P 00
pair in Busey appear to be mixed, √ 7/14 / √ 3/21 fL √* 1/10 T 7/1
114 Carolina 77 FL 89 one of each species √ T √ 3/14 / √* 1/10 T 6/24
115 Titmouse, Tufted 59
FL 00
recently returned to Woods √ 5/11 X √ 3/12 T √ 5/9 T 6/24
116 Nuthatch, Red-breasted 59 / 95 winter √ √ 9/19 √ 5/8
117 Nuthatch, White-br. 62 FL 76
residen, at least 2 pair √ 5/14 X √ 1/1 P √* 1/10 T 76/24
118 Creeper, Brown 59 many winter in Busey √ √ 2/18 √ 1/14
119 Wren, Carolina 59
FL 76 resident √ 7/14 FL √ 1/1 T √* 1/14 NB
4/12
120 Bewick's 73 rare migrant
121 House 59 ON 62 summer resident √ 6/9 FL √ 4/23 ON √* 4/23 FL 6/30
122 Winter 59
winter regularly in Busey √ √ 1/30 √ 1/14
123 Sedge 81 nests in county
124 Marsh 76 migrant √ √ 10/18
125 Kinglet, Golden-crown 60 migrant √ √ 3/21 √ 3/20
126 Ruby-crowned 59 migrant √ √ 4/4 √ 4/10
127 Gnatcatcher, Blue-gray 60 FL 84 nested 03 √ 6/9 FL √ 3/28 FL √* 4/11 T 6/25
128 Bluebird, Eastern 76 nests on golf course √ √ 3/7 √ 4/5
129 Veery 59 migrant √ √ 5/2 √ 5/8
130 Thrush, Gray-cheeked 59 migrant √ √ 9/23 √ 5/7
131 Swainson's 59 migrant √ √ 5/2 √ 4/12
132 Hermit 59 migrant √ √ 4/12 √ 4/3
133 Wood 62 ON 76 declining nester √ √ 5/2 √* 5/22 X 6/25
134 Robin, American 59
ON 62 many now winter √ 6/9 ON √ 1/1 fL √* 2/26
ON 4/23
135 Catbird, Gray 59 ON 75 summer resident √ 7/14 M √ 4/25 T √* 4/27 FL 6/19
136 Mockingbird 59 FL 79 now scarce in our area √
137 Thrasher, Brown 59
FL 75 summer resident √ 7/14 '/ √ 3/28 T √* 1/3
ON 6/19
138 Starling, European 59 ON 62 resident √ 5/30 0N √ 1/1 fL √* 1/11 ON
139 Pipit, Water 81 flying over
140 Waxwing, Cedar 59 FL 77 resident √ 7/14 X √ 5/3 X √* 5/1 T 6/24

A-30 May 2007
141 Warbler, Blue-winged 76
Busey is of Statewide √ √ 5/2 √ 8/31
142 Golden-winged
60
significance as a rest area √ √ 8/26
( Lawrence's) hybrid 86
for migrating warblers
( Brewster's) hybrid
93
in spring and fall. It is possible
143 Tennessee 60 to see almost all of these √ √ 5/2 √ 5/8
144 Orange-crowned
60
in one day in May if conditions √ √ 5/2 √ 4/27
145 Nashville 60 are right. √ √ 4/25 √ 4/27
146 Parula 63 FL 88 has nested in Busey √ √ 4/18 √ 4/29
147 Yellow 59 X 88 nests at Meadowbrook √ √ 4/27
148 Chestnut-sided 59 X 83 migrant √ √ 5/9 √ 5/15
149 Magnolia 60 migrant √ √ 5/15 √ 5/16
150 Cape May 75 migrant √ √ 5/2 √ 8/31
151 Black-throated Blue 59 migrant √ √ 10/13
152 Yellow-rumped 59 migrant √ √ 3/31 √ 4/3
153 Black-throated Green 59 migrant √ √ 5/2 √ 4/10
154 Blackburnian 59 migrant √ √ 5/16 √ 5/22
155 Yellow-throated 75
nests at Lake-of- Woods √ 4/18 √ 4/11
156 Pine 75 migrant √ √ 5/15 √ 5/1
157 Prairie 77 migrant √
158 Palm 60 migrant √ √ 4/25 √ 5/1
159 Bay-breasted 59 migrant √ √ 5/9 √ 9/4
160 Blackpoll 60 migrant √ √ 9/19 √ 10/9
161 Cerulean 75 X 85 migrant CLP 5/7
162 WARBLER,BLACK & WHITE 59 X 85
occasionally summers √ √ 5/2 / √ 4/10
163 Redstart. American 59 FL 85
occasionally summers √ √ 5/2 √ 5/7
164 WARBLER, PROTHONOTARY 60 X 05
ooccasionally summers √* 4/12 X 6/25
165 Worm-eating 76 migrant √ 4/29 CLP 5/7
166 Swainson's 85 one record
167 Ovenbird 59 T 78 used to nest in area √ √ 5/2 √ 5/8
168 Waterthrush, North. 60 migrant √ √ 4/25 √ 4/27
169 Louisiana 78
nest ot Lake-of-Woods one year √ √ 4/11 √ 4/10

A-31 May 2007
170 Warbler, Kentucky 60 migrant √ 5/18
171 Connecticut 76 migrant
172 Mourning 63 migrant √ √ 5/18
173 Common Yellowthroat 59 FL 76
summer resident √ √ 4/25 √* 5/22 X 6/24
174 Warbler, Hooded 75 migrant √ 5/8 √ 5/22
175 Wilson's 59 migrant √ √ 5/15 √ 5/22
176 Canada 60 migrant √ √ 9/5 √ 5/22
177 Chat, Yellow-breast. 60 P 85
summer resident
178 Tanager, Summer 60 T 76 rare summer √ 5/2 √ 4/28
179 Scarlet 60
FL 76
scarce summer resident √ √ 5/2 √ 5/1
180 Towhee, Rufous-sided 59 FL 75
summer resident √ √ 3/12 √* 3/27 X 6/25
181 Sparrow, Tree 62 winter √ √ 2/9 √ 1/31
182 Chipping 60 FL 79 summer resident √ 7/14 FL √ 4/12 fL √* 4/3 T 6/25
183 Clay-color OO migrant √ 10/18
184 Field 59 FL 62 summer resident √ √ 3/28 √ 4/10
185 Vesper 76 summer resident
186 Lark 89 rare summer
187 Savannah 84
summer resident
188 Henslow's
77
scarce summer resident
189 Le Conte's 94 migrant
190 Sparrow, Sharp-tailed 94 migrant
191 Fox 59 migrant √ √ 2/14 √ 3/19
192 Sparrow, Song 59 FL 77 summer resident √ √ 3/12 √* 3/7 T 7/1
193 Lincoln's 59 migrant √ √ 10/10 √ 10/2
194 Swamp 59 migrant √ √ 3/21 √ 4/24
195 White-throated 59
now winters at feeders √ √ 1/1 √ 1/1
196 White-crown. 60 migrant √ √ 5/8 √ 5/7
197 Harris' 78 infrequent migrant
198 Junco, Dark-eyed 59 winter √ √ 1/1 √ 1/10
199 Longspur, Lapland 81 fly over, winter
200 Smith's 82 fly over
201 Bunting, Snow 81 fly over, winter
202 Cardinal, Northern 59 ON 76 resident √ 7/14 FL √ 1/1 fL √* 1/10 FL 6/18

A-32 May 2007
203 Grosbeak, Rose-br. 59 FL 77
occasionally summers √ √ 5/2 √ 5/7
204 Evening 75 migrant
205 Blue 85 nests at Middlefork
206 Bunting, Indigo* 60
FL 76 summer resident √ 7/14 FL √ 4/30 T √* 4/23
NE 6/18
207 Dicksissel 91 summer resident
208 Bobolink 60 flies over √ √ 5/9
209 Blackbird, Red-wing. 59 FL 77
summer resident √ √ 3/21 √* 2/26 T 6/24
210 Meadowlark, Eastern 59 summer √ √ 4/11 √ 5/1
211 Blackbird, Yellow-hd. 80 one record
212 Rusty 59 declining √ 3/20
213 Brewer's 78
occasional migrant
214 Grackle, Common 59 FL 76 summer resident √ 7/3 FL √ 2/18 fL √* 3/6 FL 8/10
215 Cowbird, Brown-hd. 59 FL 76 nest parasite √ 7/3 X √ 3/21 fL √* 3/6 FL 8/10
216 Oriole, Orchard 75 ON 76 summer resident √ CLP 5/7
217 Baltimore 60 ON 76 summer resident √ √ 4/25 √* 5/6 T 6/25
218 Grosbeak, Pine 93 winter, rare /
219 Finch, Purple 59 migrant √ √ 4/11 √ 1/27
220 House* 84 ON 90 resident √ √ 1/1 fL √* 1/10 FL 6/30
221 Crossbill, Red 80 winter, sporatic
222 White-winged 78
winter, sporatic
223 Redpoll, Common 81 winter, sporatic
224 Siskin, Pine 76 FL 98 summers occasionally √ 10/13
225 Goldfinch, American 59 ON 76 resident √ 7/3 P √ 1/1 P √* 1/10 FL 8/8
226 House Sparrow 59 ON 76 resident √ 7/3 FL √ 1/1 fL √* 1/10 FL6/30
227 Sparrow, Eurasian tree 83
one record, Earl Long
CONFIRMED EVIDENCE OF BREEDING C- courtship
UN-used nest found
N-visiting probable nest site
FL-fledgling A-agitated behaviour or calls from adult
ON-on nest
POSSIBLE EVIDENCE OF BREEDING
small x- species present but no details known
FY adult with food for young
/-observed in suitable habitat

A-33 May 2007
NE-nest with eggs x-singing male
NY nest with young OTHER
PROBABLE EVIDENCE OF BREEDING F- flying over area nc- not counted
M- multiple singing males (7 or more) O-observed during the breeding season
P -pair
not believed to be
breeding Observers:
T- holding territory RC= Robert Chapel
EC= Elizabeth Chato
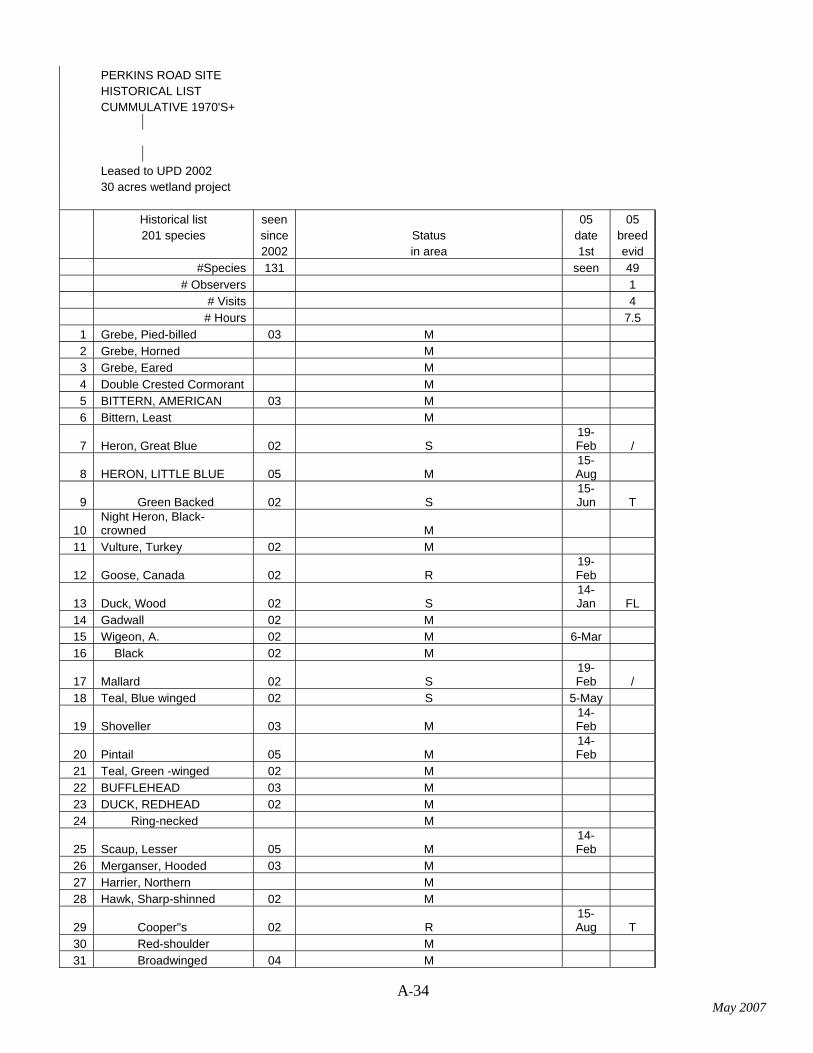
A-34 May 2007
PERKINS ROAD SITE HISTORICAL LIST CUMMULATIVE 1970'S+ Leased to UPD 2002 30 acres wetland project Historical list seen 05 05 201 species since Status date breed 2002 in area 1st evid #Species 131 seen 49 # Observers 1 # Visits 4 # Hours 7.5
1 Grebe, Pied-billed 03 M 2 Grebe, Horned M 3 Grebe, Eared M 4 Double Crested Cormorant M 5 BITTERN, AMERICAN 03 M 6 Bittern, Least M
7 Heron, Great Blue 02 S 19-Feb /
8 HERON, LITTLE BLUE 05 M 15-Aug
9 Green Backed 02 S 15-Jun T
10 Night Heron, Black-crowned M
11 Vulture, Turkey 02 M
12 Goose, Canada 02 R 19-Feb
13 Duck, Wood 02 S 14-Jan FL
14 Gadwall 02 M 15 Wigeon, A. 02 M 6-Mar 16 Black 02 M
17 Mallard 02 S 19-Feb /
18 Teal, Blue winged 02 S 5-May
19 Shoveller 03 M 14-Feb
20 Pintail 05 M 14-Feb
21 Teal, Green -winged 02 M 22 BUFFLEHEAD 03 M 23 DUCK, REDHEAD 02 M 24 Ring-necked M
25 Scaup, Lesser 05 M 14-Feb
26 Merganser, Hooded 03 M 27 Harrier, Northern M 28 Hawk, Sharp-shinned 02 M
29 Cooper"s 02 R 15-Aug T
30 Red-shoulder M 31 Broadwinged 04 M

A-35 May 2007
32 Hawk, Red-tailed 02 R 5-May / 33 MERLIN 02 M 34 Kestrel 02 S 5-May 35 Pheasant, Ring-neck 02 R 6-Mar X 36 Rail, Yellow M 37 Rail, Virginia M 38 SORA 04 M 5-May 39 COOT 02 M 40 Plover, Black-bellied M 41 Plover, Golden M 42 Semi-palmated M
43 Killdeer 02 S 15-Jun M
44 Yellowlegs, Greater 05 M 5-May 45 Lesser 03 M 5-May 46 Sandpiper, Solitary 02 M 5-May 47 Willet M
48 Sandpiper Spotted 02 S 23-Jun X
49 Upland M 50 Godwit, Hudsonian M 51 Turnstone, Ruddy M 52 Sanderling M
53 Sandpiper, Semi-palmated 05 M 15-Aug
54 Western M
55 Least 03 M 15-Aug
56 White-rumped M 57 Baird's M
58 Pectoral 02 M 25-Aug
59 Dunlin M 60 Sandpiper, Stilt M 61 Buff-breasted M 62 Ruff M 63 Dowitcher, Short-billed M 64 Dowitcher, Long-billed M
65 Woodcock 03 S 13-Mar /
66 Snipe 03 M 67 Phalarope, Wilson's M 68 Red-necked M 69 Gull, Laughing M 70 Franklin's M
71 Ringbilled 05 M 19-Feb
72 Sabine's M 73 Tern, Caspian M 74 Common M 75 Forster's M 76 Black M 77 Pigeon, Rock 02 R 5-Sep
78 EURASIAN COLLARED 05 R 23-Jun F
79 Dove, Mourning 02 R 6-Mar FL

A-36 May 2007
80 Cuckoo, Yellow-billed 04 S 81 Cuckoo, Black-billed 04 S 82 Owl, Great Horned R 83 Screech 04 R 84 Nighthawk 03 S 85 Swift, Chimney 02 S 5-May F
86 Hummingbird, Ruby-throated 04 S
87 Kingfisher, Belted 03 S 88 Woodpecker, Red-headed 03 S
89 Red-bellied 03 R 15-Aug X
90 Sapsucker,Yellow-bell. 03 M
91 Woodpecker, Downy 02 R 15-Jun FL
92 Flicker, Northern 02 S 15-Jun T
93 Flycatcher Olive-sided M
94 Pewee, Eastern 05 S 15-Jun X
95 Alder M
96 Willow 02 S 15-Jun p/T
97 Least M
98 Phoebe, Eastern 02 S 15-May
99 Flycatcher, Great Cr. 04 S 28-Jul FL
100 Kingbird, Eastern 03 S 15-Jun T
101 Vireo, White-eyed 04 M 102 Bell's M 103 Yellow-throated 06 M 104 Blue-headed M
105 Warbling 02 S 15-May T
106 Philadelphia 03 M 107 Red-eyed S 108 Jay, Blue 02 R 6-Mar T
109 Crow, American 02 R 25-Aug /
110 Lark, Horned R 111 Martin, Purple S
112 Swallow, Tree 04 M 15-Jun /
113 Rough-winged 02 S 15-Jun M
114 Bank 03 M 115 Cliff 05 M 28-Jul /
116 Barn 02 S 15-Jun M
117 Chickadee, Carolina 02 R
118 Titmouse, Tufted 02 R 13-Mar
119 Nuthatch, White-br. 02 R 120 Creeper, Brown 06 W
121 Wren, Carolina 03 R 15-Jun FL
122 House 02 S 5-May FL

A-37 May 2007
123 Winter 03 W 124 Sedge 06 M 125 Marsh 03 M 126 Kinglet, Golden-crown M 127 Ruby-crowned 02 M 128 Gnatcatcher,Blue-gray 02 S 5-May X 129 Veery M 130 Thrush, Gray-cheeked M 131 Swainson's 03 M 132 Hermit 06 M 133 Wood M 134 Robin, American 02 S 5-May FL
135 Catbird,Gray 02 S 15-Jun FL
136 Thrasher, Brown 02 S 5-May FL
137 Starling, European 02 R 15-Jun FL
138 Pipit, American M
139 Waxwing, Cedar 02 S 15-Jun FL
140 Warbler, Blue-winged M 141 Golden-winged 03 M 142 Tennessee 03 M 143 Orange-cr. 02 M 144 Nashville 03 M 145 Parula 02 M 146 Yellow 02 S 5-May T 147 Chestnut-sided 03 M 148 Magnolia 03 M 149 Cape May M 150 Yellow-rumped 02 M 151 Black-thr. Green 03 M 152 Prairie M 153 Palm 02 M 154 Bay-breasted M 155 Blackpoll M 156 Black & Wh. M 157 Redstart, American 03 M 158 Warbler, Worm-eating M 159 Ovenbird 03 M 160 Waterthrush, North. 03 M 161 Louisiana M 162 Warbler, Kentucky M 163 Connecticut M 164 Mourning M 165 Yellowthroat, Common 02 S 5-May T 166 Warbler, Wilson's M 167 Canada M
168 Chat, Yellow-breast. 02 S 15-Jun T
169 Tanager, Scarlet M 170 Towhee, Rufous-sided 02 S 171 Sparrow, Tree 06 W 172 Chipping 02 S 5-May X 173 Clay-color M

A-38 May 2007
174 Field 02 S 15-May
175 Vesper M 176 Savannah M 177 Sparrow, Grasshopper M 178 LeConte's M
179 Nelson's Sharp-tail. 02 M
180 Fox 03 M 13-Mar
181 Song 02 S 6-Mar FL 182 Lincoln's 02 M
183 Swamp 02 M 13-Mar
184 White-throated 02 M 7-May 185 White-crown. 02 M
186 Junco, Dark-eyed 02 W 13-Mar
187 Cardinal, Northern 02 R 6-Mar FL 188 Grosbeak, Rose-br. 02 S
189 Bunting, Indigo 02 S 15-Jun FL
190 Dicksissel 03 S
191 Blackbird, Red-wing. 02 S 16-Mar ON
192 Meadowlark, Eastern 04 S 5-May P
193 Blackbird, Rusty 05 M 13-Mar
194 Grackle, Common 02 S 15-Jun FL
195 Cowbird, Brown-hd. 02 S 5-May X 196 Oriole, Orchard 03 S 12-Jul A
197 Baltimore 02 S 15-Jun FL
198 Finch, Purple M 199 House 02 S 6-Mar FL 200 Goldfinch, American 02 S 5-May FL 201 House Sparrow 02 S 6-Mar ON KEY:
SEASONAL STATUS Probable:
M Migrant P -pair R Resident T- holding territory S Summer resident M- multiple singing males (7 or more) W Winter resident C- courtship A-agitated behaviour or calls from adult BREEDING EVIDENCE N-visiting probable nest site Confirmed : P/T pair on territory FL-fledgling, IM immature bird Possible: FY-adult with food for young /- present during breeding season MP-many nesting pairs X- singing in suitable habitat Ny-nest with young F- flying over area NE-nest with eggs O-observed during the breeding season ON-on nest

A-39 May 2007
HOMER LAKE
FOREST PRESERVE 800 acres
HISTORICAL LIST Dam completed 1969
CUMMULATIVE Owned by CCFPD since 1992
1983+
First recorded breeding bird study done in 1983
Included in Illinois Breeding Bird Census, 1986-91
Much of the Homer Lake Preserve was originally farmland which is heavily overgrown
with non-native honeysuckle and autumn olive. The Forest Preserve District is now working
hard to reclaim some of these areas. It does have good river corridor habitat and several woodland
remnants as well as the lake. Notable bird life includes the Cliff Swallow colony by the dam and
resident Pileated Woodpeckers. There are several unusual summer warbler records.
#Observers 2 2
# Visits 4 6
# Hours 6 14
Historical list Highest Status of species in
County 03 03 03 04 04 04 05 05 05 06 06 06
230 breeding + seen date Breeding seen date Breeding seen date Breeding seen date breeding
evidence comments 104 1st evidence 114 1st evidence 115 1st 61 128 1st 75
species seen species species seen species
1 Loon, Common migrant, occasional summer
2 GREBE, PIED-BILLED* FL 85
breeds in suitable habitat √ 4/9 1 3/17
3 Horned migrant √ 3/22
4 Eared migrant
5 Cormorant, Double Crested migrant 1
10-May √ 19-Sep √ 4/23
6 Bittern, American migrant
7 Least migrant 1
8 Heron, Great Blue P85 several colonies in area 1 3-May / √ 8-May / √ 4/9 / 1 3/17
9 Egret, Great migrant √ 7/29 O
10 Heron, Little Blue migrant √ 26-Aug √
11 HERON, TRI-COLORED
Rare species, new to list '03
18-May
12 Egret, Cattle migrant
13 Heron, Green P85 breeds 1 3-May / √ P √ 5/7 1 5/6
14 Night Heron, Black-Crowned migrant √ 21-Aug √ 5/10 1 4/11
15 IBIS, WHITE rare species, new to list '05 √ 7/31 O

A-40 May 2007
16 Vulture, Turkey /85 probably nests somewhere 1
10-May / √ 8-May / √ 4/9 1 4/14
17 GOOSE, WHITE-FRONTED migrant, new to list 1 3/18
18 Goose, Canada ON86 resident 1 3-May FL √ 8-May FL √ 5/7 FL 1 2/17
19 CACKLING new to list 1 12/2
20 Snow migrant 1 12/2
21 Swan, Tundra migrant 1 3/17
22 Duck, Wood FL83 breeds √ 18-Apr NE √ 4/9 / 1 3/30
23 Teal, Green -winged migrant √ 14-Apr
24 Mallard FL85 breeds 1 3-May P √ 14-Apr / √ 7/31 FL 1 3/17
25 Pintail, Northern migrant
26 Teal, Blue-winged migrant √ 14-Apr √ 4/9 1 3/17
27 Shoveller, Northern migrant √ 14-Apr 1 1/4
28 Gadwell migrant
29 Wigeon, American migrant 1 3/30
30 Canvasback migrant
31 Redhead migrant
32 Duck, Ring-necked migrant √ 3/22
33 Scaup, Lesser migrant √ 3/22
34 Goldeneye, Common migrant 1 12/2
35 Bufflehead migrant
36 MERGANSER, HOODED /94
breeds on Middle Fork 1 3/17
37 Common migrant
38 Red-breasted migrant √ 11-May √ 3/22
39 Duck, Ruddy migrant
40 Eagle, Bald migrant, nest in Vermilion County 1 4/7
41 OSPREY** migrant 1 3-May √ 2-May √ 5/7 1 4/7
42 HARRIER, NORTHERN** /86 migrant 1 3-May √
43 Hawk, Sharp-shinned migrant
44 Cooper's X02 resident √ 5/7 T 1 3/17 /
45 Goshawk, Northern winters
46 HAWK, RED-SHOULDERED* /94
some nesting records in County 1 1/1 /
47 Broadwinged migrant √ 6-May 1 5/4
48 Red-tailed FL04 resident 1 10-May FL √ 8-May FL √ 4/9 T 1 2/17 UN
49 Rough-legged winters
50 Eagle, Golden migrant
51 Merlin migrant
52 FALCON, migrant

A-41 May 2007
PEREGRINE**
53 PRAIRIE rare migrant or winter visitor
54 Kestrel, American resident 1 2-Jan 1/1
55 Pheasant, Ring-necked FL86 resident 1 3-May T √ 14-Apr X √ 7/29 T 1 4/14 T
56 Turkey, Wild /94 resident on all preserves √ / 1 10/6 X
57 Bobwhite T 06 very few in our area now √ X 1 6/28 T
58 Rail, Virginia migrant
59 Sora migrant
60 Coot /96 has occasionally bred in County √ 8-May √ 5/7
61 Crane, Sandhill migrant
62 Plover, Black-bellied migrant
63 Golden migrant 1 10-May
64 Killdeer P94 breeds 1 10-May X √ / √ 5/7 1 2/27
65 Yellowlegs, Greater migrant √ 5/7
66 Lesser migrant √ 5/7
67 Sandpiper, Solitary migrant √ 8-May √ 4/30 1 4/5
68 Willet migrant
69 Sandpiper, Spotted /85 breeds 1 3-May √ 8-May √ 5/7 1 5/6 /
70 Upland breeds Monticello Field station
71 Godwit, Hudsonian migrant, Jim Smith's record
72 Semi-palmated migrant
73 Western migrant
74 Baird's migrant
75 Least migrant
76 Pectoral migrant
77 Dunlin migrant
78 Sandpiper, Stilt migrant
79 Dowitcher, Short-Billed migrant
80 Long-Billed migrant
81 Woodcock, American FL86 on woodcock walk 1 √ C 1 3/15 C
82 Snipe, Common migrant 1 3/7
83 Gull, Bonaparte's migrant
84 Herring migrant
85 Ringbilled migrant √ 8-May 1 3/30
86 Tern, Common migrant
87 Forster's migrant

A-42 May 2007
88 Tern, Black O85 migrant
89 Pigeon, Rock /85 resident
90 Dove, Mourning ON85 resident 1 3-May ON √ 14-Apr T √ T 1 3/17 C
91 Cuckoo, Black-billed X87 unusual in summer
92 Yellow-billed FL85 breeds 1 2-Jul T √ 31-Jul T √ 7/29 T 1 8/1 X
93 Owl, Screech FL85 resident 1 3-May / √ X √ T 1 X
94 Great Horned FL85 resident 1 √ 2-May FL
95 Barred /86 resident √ X √ 5/7 X 1 4/14 X
96 Long-eared none seen in usual winter roost
97 Short-eared winters
98 Nighthawk nests in town
99 Whip-poor-will migrant
100 Swift, Chimney NB 96 breeds 1 3-May / √ 8-May / √ 5/7 / 1 5/6 /
101 Hummingbird, Ruby- throated /86 breeds 1
10-May √ 2-Jul / √ 5/7 / 1 5/6 /
102 Kingfisher, Belted FY86 occasionally overwinters 1
10-May / √ 8-May T √ 4/7 X 1 1/9 X
103 WOODPECKER, RED-HEADED FL85 decreasing in area 1
10-May √ 2-May T √ 4/30 X 1 6/28 X
104 Red-bellied FL85 resident 1 3-May X √ 14-Apr T √ 4/9 FL 1 1/9 T
105 Sapsucker, Yellow-bellied migrant √ 14-Apr X √ 4/9 1 3/30
106 Woodpecker, Downy FL86 resident 1 3-May T √ 14-Apr √ 4/9 X 1 2/7 FL
107 Hairy FL88 resident 1 2-Jul FL √ 8-May √ 7/29 X 1 2/17 T
108 Flicker, Northern FL85 breeds 1 3-May NB √ 14-Apr FL √ 4/9 X 1 1/1 FG
109 WOODPECKER, PILEATED P94 not many in County 1 2-Jul X √ 14-Apr T √ 4/8 P 1 3/17 T
110 Flycatcher, Olive-sided migrant
111 Pewee, Eastern 0N85 breeds 1 10-May FL √ 31-Jul FL √ IM 1 5/6 X
112 Yellow-bellied migrant
113 ACADIAN NB94 occasionally breeds 1 10-May
114 Alder migrant
115 Willow FY89 breeds √ 7/29 X 1 6/22 X
116 Least X86 occasionally summers 1
10-May √ 8-May 1 5/6
117 Phoebe, Eastern FL94 breeds 1 3-May ON √ 8-May UN √ 4/9 ON 1 3/17 FL
118 Flycatcher, Great Crested ON83 breeds 1
10-May X √ 2-May T √ 5/7 T 1 5/6 FG
119 Kingbird, Eastern ON85 breeds 1 FL √ 8-May ON √ 5/7 T 1 5/6 FG
120 SHRIKE, LOGGERHEAD* NY91 now a rare breeder
121 Vireo, White-eyed NY85 breeds 1 2-May X √ 8-May
122 BELL'S NY85 breeds in few places in County
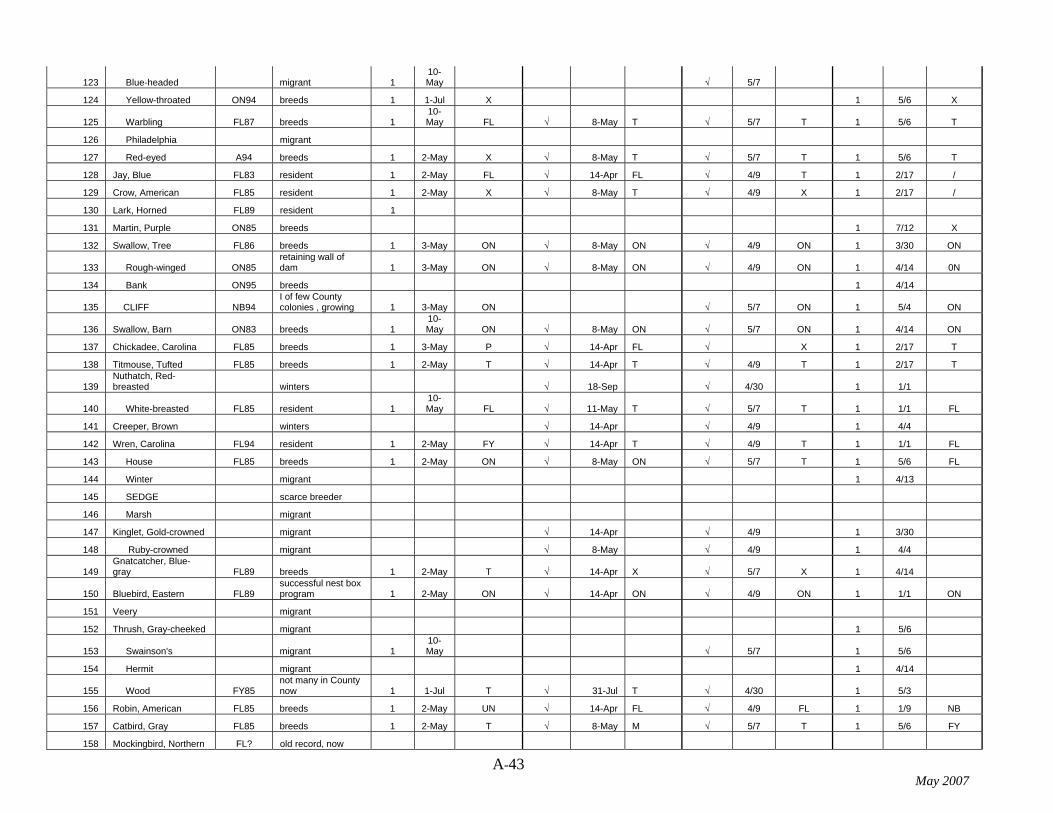
A-43 May 2007
123 Blue-headed migrant 1 10-May √ 5/7
124 Yellow-throated ON94 breeds 1 1-Jul X 1 5/6 X
125 Warbling FL87 breeds 1 10-May FL √ 8-May T √ 5/7 T 1 5/6 T
126 Philadelphia migrant
127 Red-eyed A94 breeds 1 2-May X √ 8-May T √ 5/7 T 1 5/6 T
128 Jay, Blue FL83 resident 1 2-May FL √ 14-Apr FL √ 4/9 T 1 2/17 /
129 Crow, American FL85 resident 1 2-May X √ 8-May T √ 4/9 X 1 2/17 /
130 Lark, Horned FL89 resident 1
131 Martin, Purple ON85 breeds 1 7/12 X
132 Swallow, Tree FL86 breeds 1 3-May ON √ 8-May ON √ 4/9 ON 1 3/30 ON
133 Rough-winged ON85 retaining wall of dam 1 3-May ON √ 8-May ON √ 4/9 ON 1 4/14 0N
134 Bank ON95 breeds 1 4/14
135 CLIFF NB94 I of few County colonies , growing 1 3-May ON √ 5/7 ON 1 5/4 ON
136 Swallow, Barn ON83 breeds 1 10-May ON √ 8-May ON √ 5/7 ON 1 4/14 ON
137 Chickadee, Carolina FL85 breeds 1 3-May P √ 14-Apr FL √ X 1 2/17 T
138 Titmouse, Tufted FL85 breeds 1 2-May T √ 14-Apr T √ 4/9 T 1 2/17 T
139 Nuthatch, Red-breasted winters √ 18-Sep √ 4/30 1 1/1
140 White-breasted FL85 resident 1 10-May FL √ 11-May T √ 5/7 T 1 1/1 FL
141 Creeper, Brown winters √ 14-Apr √ 4/9 1 4/4
142 Wren, Carolina FL94 resident 1 2-May FY √ 14-Apr T √ 4/9 T 1 1/1 FL
143 House FL85 breeds 1 2-May ON √ 8-May ON √ 5/7 T 1 5/6 FL
144 Winter migrant 1 4/13
145 SEDGE scarce breeder
146 Marsh migrant
147 Kinglet, Gold-crowned migrant √ 14-Apr √ 4/9 1 3/30
148 Ruby-crowned migrant √ 8-May √ 4/9 1 4/4
149 Gnatcatcher, Blue-gray FL89 breeds 1 2-May T √ 14-Apr X √ 5/7 X 1 4/14
150 Bluebird, Eastern FL89 successful nest box program 1 2-May ON √ 14-Apr ON √ 4/9 ON 1 1/1 ON
151 Veery migrant
152 Thrush, Gray-cheeked migrant 1 5/6
153 Swainson's migrant 1 10-May √ 5/7 1 5/6
154 Hermit migrant 1 4/14
155 Wood FY85 not many in County now 1 1-Jul T √ 31-Jul T √ 4/30 1 5/3
156 Robin, American FL85 breeds 1 2-May UN √ 14-Apr FL √ 4/9 FL 1 1/9 NB
157 Catbird, Gray FL85 breeds 1 2-May T √ 8-May M √ 5/7 T 1 5/6 FY
158 Mockingbird, Northern FL? old record, now

A-44 May 2007
scarce
159 Thrasher, Brown FL83 breeds 1 2-May FL √ 14-Apr FL √ 4/9 / 1 4/7 P
160 Starling, European FY85 resident 1 2-May √ 14-Apr FL √ 4/9 ON 1 3/17 M
161 Waxwing, Cedar ON 85 breeds 1 10-May X √ 8-Jun ON √ 7/31 IM 1 5/6 T
162 Warbler, Blue-winged migrant √ 8-May
163 Golden-winged migrant 1 5/6
164 Tennessee migrant 1 10-May √ 8-May √ 5/7
165 Orange-crowned migrant
166 Nashville migrant 1 10-May √ 8-May √ 5/7 1 5/6
167 Parula, Northern T 94 a few breeding records 1
10-May X √ 2-May T √ 4/30 1 4/15 X
168 Warbler, Yellow A 94 breeds 1 2-May T √ 8-May T √ 4/30 1 5/6 T
169 Warbler, Chestnut-sided migrant 1
10-May
170 Magnolia migrant 1 10-May √ 8-May 1 5/6
171 Cape May migrant 1 10-May √ 8-May √ 5/7
172 Black-throated Blue migrant √ 23-Sep √ 5/7
173 Yellow-rumped migrant 1 10-May √ 14-Apr √ 4/9 1 1/9
174 BLACK-THROATED GREEN X 02
migrant, unusual summer 1
13-May √ 8-May √ 5/7 1 5/6
175 Blackburnian migrant √ 8-May √ 8/27
176 YELLOW-THROATED T 06
breeds at Lake-of Woods 1 6/28 T
177 Pine migrant 1 10-May 1 5/6
178 PRAIRIE X 03 Unusual in summer in area 1 2-Jul X √ 12-May
179 Palm migrant 1 10-May √ 8-May √ 5/7 1 5/6
180 Bay-breasted migrant 1 10-May √ 19-Sep √ 5/7
181 Blackpoll migrant 1 10-May √ 5/7 1 5/6
182 Cerulean migrant √ 5/7
183 BLACK & WHITE migrant, few summer records 1
10-May √ 12-May √ 5/7 1 5/6
184 Redstart, American T 85 migrant, some summer records 1
10-May √ 8-May √ 5/7
185 Warbler, Prothonotary migrant, has nested in County √ 5/7
186 Worm-eating migrant
187 OVENBIRD X 04 migrant, used to nest in area √ 6-May X √ 5/7 1 5/6
188 Waterthrush, Northern migrant 1 13-May √ 8-May √ 5/7 1 5/6
189 Louisiana migrant
190 Warbler, Kentucky T05 Unusual in summer in area

A-45 May 2007
191 Mourning migrant
192 Yellowthroat, Common NY85 breeds 1 10-May T √ 8-May T √ 5/7 X 1 5/6 T
193 Warbler, Hooded migrant
194 Wilson's migrant 1 10-May
195 Canada migrant
196 Chat, Yellow-breasted T85 breeds 1 10-May T
197 Tanager, Summer T76 migrant, occasional summer 1
13-May
198 Tanager, Scarlet FL86 breeds 1 10-May √ 8-May √ 5/7 1 5/3 X
199 Towhee, Rufous-sided FL85 breeds 1 2-May T √ 8-May T √ 4/9 X 1 2/17 T
200 Sparrow, Tree winter visitor √ 1 2/17
201 Chipping FY85 breeds 1 2-May FL √ 14-Apr FL √ 4/9 FL 1 4/4 FL
202 Field FL83 breeds 1 2-May P √ 8-May FL √ 3/22 T 1 4/4 FL
203 Vesper T86 breeds
204 SAVANNAH X 86 breeds, scarce
205 GRASSHOPPER T86 breeds, scarce
206 Fox migrant √ 14-Apr 1 3/17
207 Song FL85 breeds 1 2-May X √ 8-May X √ 4/9 X 1 2/17 T
208 Lincoln's migrant 1 10-May √ 6-May √ 4/30 1 5/6
209 Swamp migrant 1 10-May √ 14-Apr 1 3/17
210 White-throated migrant 1 10-May √ 14-Apr √ 4/9 1 2/17
211 White-crowned migrant 1 10-May √ 6-May √ 5/7 1 5/6
212 Junco, Dark-eyed winter visitor 1 √ √ 1 2/17
213 Longspur, Lapland winter visitor
214 Bunting, Snow winter visitor
215 Cardinal, Northern FL85 resident 1 2-May FL √ 14-Apr FL √ 7/29 FL 1 2/17 FL
216 Grosbeak, Rose-breasted NY85 breeds 1 2-May X √ 8-May FL √ 5/7 1 4/20 A
217 Bunting, Indigo FY85 breeds 1 2-May T √ 8-May T √ M 1 5/6 FL
218 Dickcissel FL85 breeds √ 8-Jun M 1 6/21 M
219 BOBOLINK T85 migrant, scarce breeder
220 Blackbird, Red-winged NE85 breeds 1 10-May X √ 8-May X √ 4/9 X 1 3/17 A
221 Meadowlark, Eastern FY85 breeds 1 10-May X √ 14-Apr T √ 5/7 X 1 2/17 T
222 BLACKBIRD, YELLOWHEADED rare migrant
223 Rusty migrant 1 3/13
224 Grackle, Common FL83 breeds 1 2-May FL √ 8-May / √ / 1 2/17 FL
225 Cowbird, Brown-headed FL85 breeds 1 2-May X √ 8-May P √ / 1 3/17 FL

A-46 May 2007
226 Oriole, Orchard FL89 breeds 1 2-May X √ 15-Jun P √ 5/7 X 1 5/6 P
227 Baltimore ON85 breeds 1 2-May FL √ 8-May P √ 5/7 NB 1 5/6 P
228 Finch, Purple winter visitor √ 14-Apr 1 4/4
229 House FL89 resident 1 FL √ 8-May P √ X 1 X
230 Siskin, Pine winter visitor 1 2/17
231 Goldfinch, American FL85 resident 1 2-May P √ 14-Apr P √ 4/9 X 1 3/17 P
232 House Sparrow FL85 resident 1 2-May ON √ 8-May ON √ 5/10 ON 1 2/17 FL
KEY
CAPITAL LETTERS CAPITAL LETTERS*
indicate unusual species
State threatened species
CAPITAL LETTERS** from Checklist of Endangered
State endangered species
and Threatened Animals and
Plants of Illinois, 1999
Confirmed evidence of breeding: Illinois Endangered Species Board
Possible evidence of breeding:
FL-fledgling, IM immature bird
/- present during breeding season
FY- adult with food for young
X- singing in suitable habitat
MP-many nesting pairs
NY- nest with young F- flying over area
NE-nest with eggs O-observed during the breeding season
Probable evidence of breeding: ON-on nest
P -pair
T- holding territory
M- multiple singing males (7 or more)
C- courtship
A-agitated behaviour or calls from adult
N-visiting probable nest site

A-47 May 2007
Boneyard Creek Bibliography (compiled by Berns, Clancy & Associates)

A-48 May 2007
A-49 May 2007

A-50 May 2007