water treatment technology - ibw
TRANSCRIPT

Water treatment technology Water is the most precious component on earth and more than 70 % of the blue planet’s surface is
covered by it, making a total volume of 1,36.109 km
3. Water is used as solvent for nutrients that are
taken up by plants, animals and humans. It is used for basic hygiene, recreation and religious purposes.
Electricity is generated with the help of water in hydro-electric, thermic and nuclear power stations.
However, only 0.6 % of all available water can be used for these purposes. Careful use, management
and/or recycling of water is therefore essential, especially in view of the ever growing world
population. Several engineering techniques can be applied for water treatment and (re-)use. This
chapter reviews the most important techniques. In the first part techniques that can be applied for the
production of process water and drinking water will be discussed. In the second part techniques that
are used for the treatment of waste water are discussed. Off course some overlap between both parts
will occur.
The following literature was consulted for the elaboration of this chapter:
1. Crittenden, J.C., Hand, D.W., Tchobanoglous, G. and Trussel R.R. (2005). Water Treatment:
Principles and Design . Wiley & Sons, New York, USA.
2. Henze, M., Harremoes, P., Cour Jansen, J.l., Arvin, E. (2001). Wastewater Treatment
Processes: Biological and Chemical 3rd ed., Springer, 420 p.
3. Metcalf, & Eddy, Inc., Revised by Tchobananoglous, G. & Burton, F.L. (1991). Wastewater
engineering: treatment, disposal and reuse. McGraw-Hill, McGraw-Hill series in water
resources and environmental engineering, New York, USA.
4. Perry, R.H. & Green, D. (1998). Perry’s chemical engineer’s handbook. McGraw-Hill, New
York, USA, 2300p.
5. Vesilind, P.A. (2003). Wastewater Treatment Plant Design. IWA Publishing, London, UK
6. www.lentech.com
7. http://ga.water.usgs.gov/edu/
8. Verstraete, W. (2001). Biotechnological processes in environmental technology. Ghent
University course.
9. http://ocw.mit.edu
10. www.vito.be
11. Wangnick, K. (2002). 2002 IDA Worldwide Desalting Plants Inventory Report No. 17
12. Hamed, Osman A. (2005). “Overview of hybrid desalination systems – current status and
future prospects.” Desalination, 186, 207-214.
13. Dickie, Phil. Desalination: Option or Distraction for a Thirsty World? World Wildlife Fund,
2007.

Process water and drinking water
Earth’s natural water resources
Freshwater represents only about 3 percent of all water on Earth. Most of this freshwater is stored in
icecaps and glaciers (69%) and groundwater (30%). Freshwater lakes and swamps account for a mere
0,29% of the Earth's freshwater. Twenty percent of all stored freshwater is present in Lake Baikal in
Asia. Another twenty percent is stored in the Great Lakes in North America. Rivers hold only about
0,006% of total freshwater reserves. Life on Earth survives thus on a very small part of Earth’s water
reserves, often a part of which the quantity and quality is negatively influenced by man.
Figure 1. The watercycle on Earth.
Surface and ground water are important natural resources used for many purposes in industry,
agriculture and public supply (supplying people with drinking water and for everyday uses). About 74
percent of the freshwater used in the United States in 2000 came from surface-water sources (7). The
other 26 percent came from ground water. The pie charts below shows the percentage of fresh surface
and ground water that was used in 2000 in the United States for various categories of water use. For
most categories, surface water is used more than ground water.
The direct use of ground water or surface water as process water or drinking water is however only
possible in a few cases. In West-Flanders, a Belgian province, for example the use of ground water by
the industry is demoted in favour of process water re-use because of the fact that ground water levels
are becoming too low. Further, only ground water of excellent quality, i.e. without odour, taste or
colour, can be used for the production of drinking water. Surface water is generally to polluted and/or
to saline for direct use. As such the treatment of ground and surface water before use is necessary.
This chapter will review the most important techniques.

Figure 2. Pies charts showing the percentage of total freshwater withdrawals in the US in year 2000
coming from ground and surface water.
STATISTICS DRINKING WATER BELGIUM, 2005
Surface water withdrawal (m3): 257.062.000 35 %
Groundwater withdrawal (m3): 473.369.000 65 %
Total production (m3): 730.431.000 100%
Paid consummation (m3): 579.421.000
Domestic consummation (liter/cap/day): 206
Number of companies in water distribution: 72
Number of employees active in water companies: 7.148
Number of connected consumers: 4.013.313
Total Length of the distribution network (km) 101.026
Table 1. Overview of the main statistics related to the Belgian drinking water industry in 2005. (Pidpa)
Groundwater The removal of iron, manganese, humic acids and nitrate is necessary before groundwater can be used
for drinking water. Iron and manganese cause unwanted precipitation and coloring of the water.
Nitrates can be reduced to nitrite. Nitrite in drinking water can lead to oxygen shortage of newly borns
(‘blue baby syndrome’) and, during chlorination of drinking water, carcinogenic nitrosamines may be
formed by the interaction of nitrite with compounds containing organic nitrogen. Humic acids in water
can significantly lower the success of chemical disinfection processes.
Iron and manganese removal
Iron and manganese removal is based on the controlled precipitation of iron and manganese. It is
normally done by combining the oxidation (with air, O3, Cl2, ClO2 or another chemical oxidant) of
iron and manganese with sand filtration. The oxidized metal forms metal oxides which can be
removed by sand filtration. For iron for example the following oxidation reaction will occur:
2 Fe2+
+ 0.5 O2 + H2O -> 2 Fe3+
+ 2OH-

The Fe3+
ion will precipitate in the form of Fe2O3 and can consequentially be filtered off. Of
importance is the pH value of the water. The removal of manganese is normally more difficult
compared to the removal of iron, i.e. stronger oxidants are necessary. High iron concentration should
be treated with two or more systems in series. Complex bound iron and manganese, e.g. complex
bound with humic acids, can be very difficult to remove. In this case oxidation with ozone can be a
solution. Ion exchange should be considered only for the removal of small quantities of iron and
manganese. For practical purposes in an everyday working softener, the upper limit is about 5 to 7
ppm.
Next to chemical removal of iron and manganese, there exists also a biotechnological method. This
biotechnological technique requires the ground water first to be intensively aerated..Subsequently the
aerated water is filtered through a sand bed in which bacteria are growing that enzymatically
precipitate iron and manganese.
Removal of humic acids
Humic acids can be removed by adsorption on activated carbon or by ion exchange (these techniques
will be discussed later). The Flemish Water Company (www.vmw.be) has tested the MIEX process for
the removal of humic acids and concluded that this MIEX process increased the stability and
decreased chemical use and production costs of the water purification plant (Rogge et al., 2007).
The name MIEX (www.miexresin.com) comes from “Magnetic Ion EXchange”, because the ion
exchange resin beads contain a magnetized component within their structure which allows the beads to
act as weak individual magnets. The magnetic component results in the beads forming agglomerates
that will settle rapidly or fluidize at high hydraulic loading rates, thus allowing small unit process
footprints. The very small resin bead size provides a high surface area allowing rapid exchange
kinetics of select ions. MIEX resins are available for a variety of ion exchange applications (both
anion and cation) for water and wastewater treatment.
Nitrate removal
Nitrate removal can be accomplished with membrane filtration (reverse osmosis). Further, nitrate can
also be removed biologically by assimilation and/or denitrification. Both techniques will be discussed
further.
Surface water
Water production in practice
In the figures below the flow diagrams of the drinking water production plants of Amsterdam (the
Netherlands, Bosklopper et al., 2004) and Kluizen (Belgium) are depicted.
Amsterdam Water Supply has two production units, the River-Dune Waterworks at Leiduin and the
River-Lake Waterworks at Loenderveen and Weesperkarspel. The latter accounts for one-third of the
total drinking water production of about 94 million m3 per year. Drinking water is distributed without
residual chlorine.

Figure 3. The process scheme of the drinking water production plant of Weesperkarspel (The Nederlands)
Water from the Bethune Polder, sometimes mixed with water from the Amsterdam Rhine Canal
(ARC), is coagulated with ferric chloride in an horizontal settling tank, resulting in the removal of
suspended solids, phosphate, and heavy metals. The quality of the water improves further, due to
sedimentation, biodegradation and other auto-purification processes in a reservoir of 130 hectares and
a retention time of 100 days. With rapid sand filtration the reservoir water is pre-treated (removal of
ammonium, suspended solids, algae) before it is transported to the Weesperkarspel production plant.
The first process in the post-treatment is ozonation to increase biodegradability of the organic carbon
content of the water and for disinfection. Thereafter, pellet reactors are used to reduce hardness and as
a third step biological granular activated carbon filtration is applied to remove DOC (Dissolved
Organic Carbon), AOC (Assimilable Organic Carbon) and micro-pollutants. The last step in the
treatment is slow sand filtration for further reduction of suspended solids. This process is also the
second important barrier in the treatment against pathogens and especially important to remove
persistent pathogens with low susceptibility for ozone (Cryptosporidium).
The drinking water purification site of the Vlaamse Maatschappij voor Watervoorziening (VMW,
www.vmw.be) in Harelbeke (Belgium) withdraws water from the Kortrijk-Bossuit Canal (Cromphout
and Rogge, 2002). This canal is fed by the Schelde River, which is the most important river in Flan-
ders. The Schelde River is heavily polluted by industrial and municipal wastewaters over its entire
course, although river water quality has improved during the past years because of the installation of
several industrial and municipal wastewater treatment plants. At the current capacity the installation
can produce 20 000 m³ drinking water per day, although in the future this capacity will be increased to
25 000 m³ of drinking water per day.
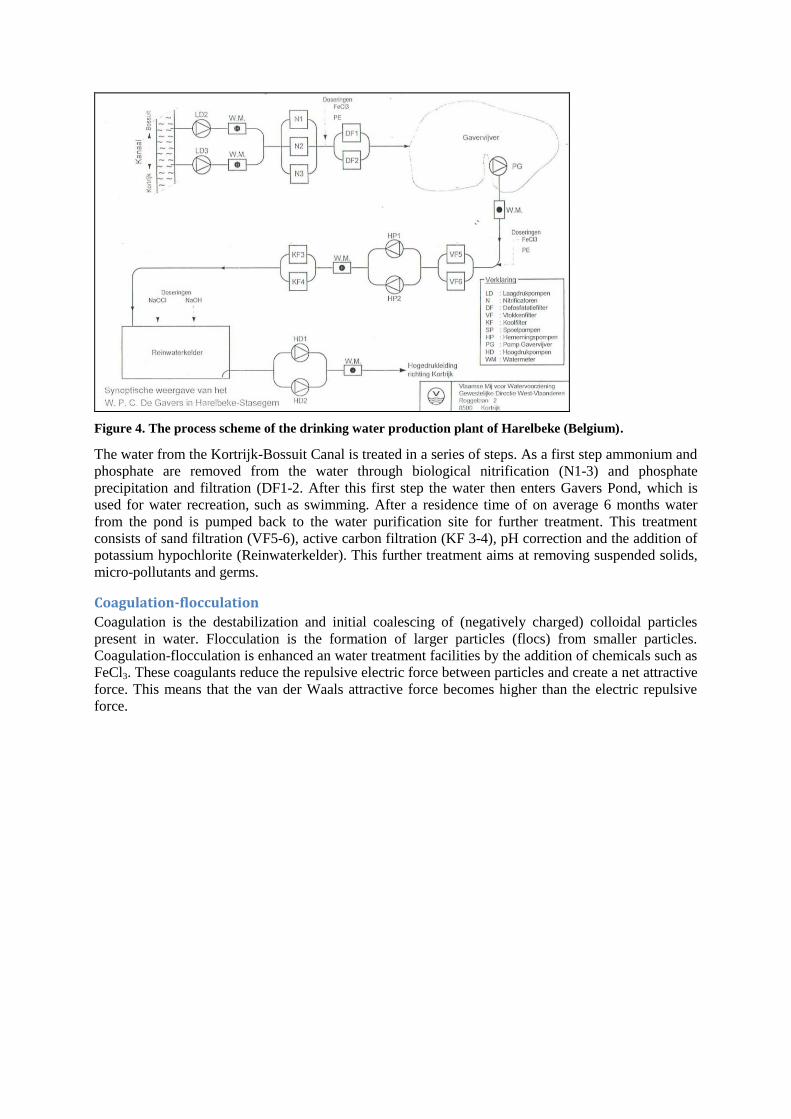
Figure 4. The process scheme of the drinking water production plant of Harelbeke (Belgium).
The water from the Kortrijk-Bossuit Canal is treated in a series of steps. As a first step ammonium and
phosphate are removed from the water through biological nitrification (N1-3) and phosphate
precipitation and filtration (DF1-2. After this first step the water then enters Gavers Pond, which is
used for water recreation, such as swimming. After a residence time of on average 6 months water
from the pond is pumped back to the water purification site for further treatment. This treatment
consists of sand filtration (VF5-6), active carbon filtration (KF 3-4), pH correction and the addition of
potassium hypochlorite (Reinwaterkelder). This further treatment aims at removing suspended solids,
micro-pollutants and germs.
Coagulation-flocculation
Coagulation is the destabilization and initial coalescing of (negatively charged) colloidal particles
present in water. Flocculation is the formation of larger particles (flocs) from smaller particles.
Coagulation-flocculation is enhanced an water treatment facilities by the addition of chemicals such as
FeCl3. These coagulants reduce the repulsive electric force between particles and create a net attractive
force. This means that the van der Waals attractive force becomes higher than the electric repulsive
force.
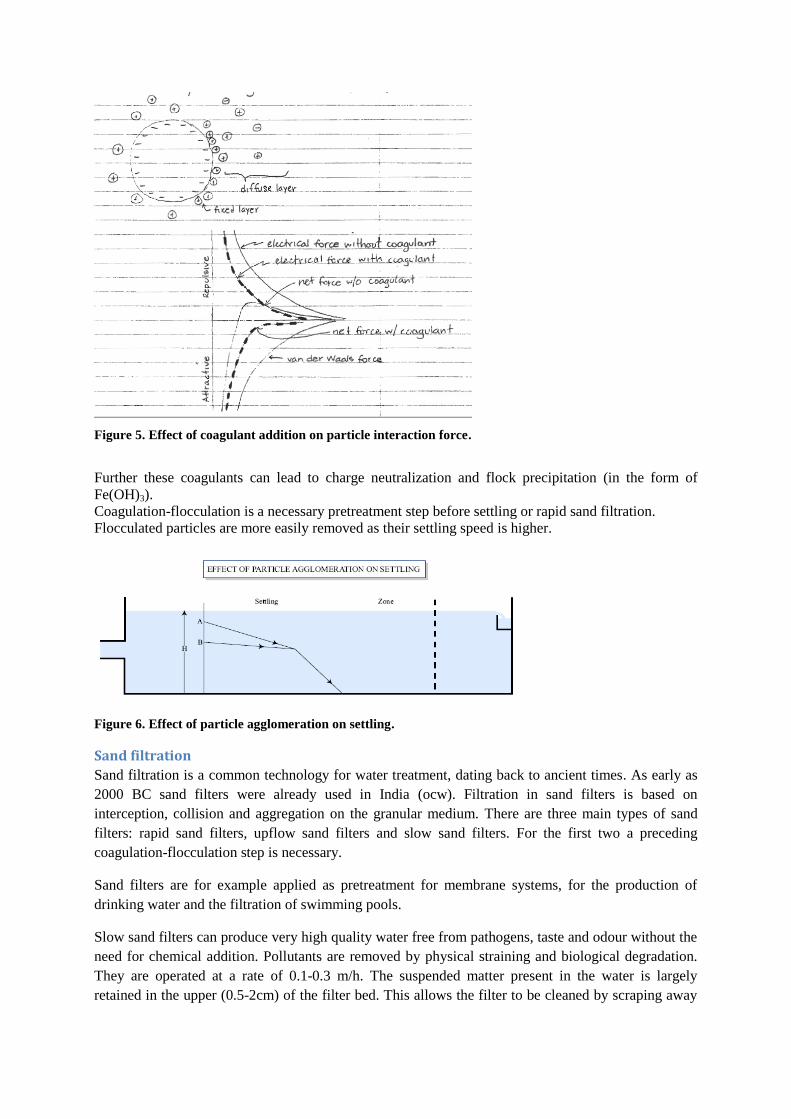
Figure 5. Effect of coagulant addition on particle interaction force.
Further these coagulants can lead to charge neutralization and flock precipitation (in the form of
Fe(OH)3).
Coagulation-flocculation is a necessary pretreatment step before settling or rapid sand filtration.
Flocculated particles are more easily removed as their settling speed is higher.
Figure 6. Effect of particle agglomeration on settling.
Sand filtration
Sand filtration is a common technology for water treatment, dating back to ancient times. As early as
2000 BC sand filters were already used in India (ocw). Filtration in sand filters is based on
interception, collision and aggregation on the granular medium. There are three main types of sand
filters: rapid sand filters, upflow sand filters and slow sand filters. For the first two a preceding
coagulation-flocculation step is necessary.
Sand filters are for example applied as pretreatment for membrane systems, for the production of
drinking water and the filtration of swimming pools.
Slow sand filters can produce very high quality water free from pathogens, taste and odour without the
need for chemical addition. Pollutants are removed by physical straining and biological degradation.
They are operated at a rate of 0.1-0.3 m/h. The suspended matter present in the water is largely
retained in the upper (0.5-2cm) of the filter bed. This allows the filter to be cleaned by scraping away
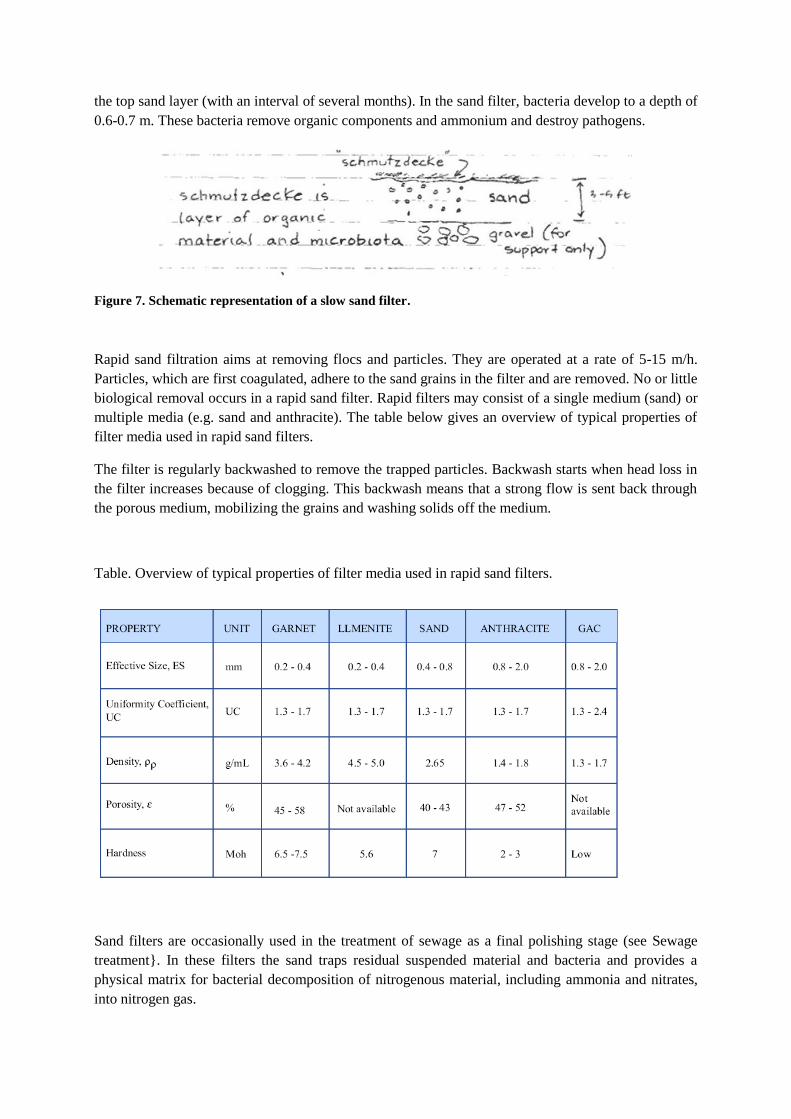
the top sand layer (with an interval of several months). In the sand filter, bacteria develop to a depth of
0.6-0.7 m. These bacteria remove organic components and ammonium and destroy pathogens.
Figure 7. Schematic representation of a slow sand filter.
Rapid sand filtration aims at removing flocs and particles. They are operated at a rate of 5-15 m/h.
Particles, which are first coagulated, adhere to the sand grains in the filter and are removed. No or little
biological removal occurs in a rapid sand filter. Rapid filters may consist of a single medium (sand) or
multiple media (e.g. sand and anthracite). The table below gives an overview of typical properties of
filter media used in rapid sand filters.
The filter is regularly backwashed to remove the trapped particles. Backwash starts when head loss in
the filter increases because of clogging. This backwash means that a strong flow is sent back through
the porous medium, mobilizing the grains and washing solids off the medium.
Table. Overview of typical properties of filter media used in rapid sand filters.
Sand filters are occasionally used in the treatment of sewage as a final polishing stage (see Sewage
treatment}. In these filters the sand traps residual suspended material and bacteria and provides a
physical matrix for bacterial decomposition of nitrogenous material, including ammonia and nitrates,
into nitrogen gas.

(Biological) active carbon filtration
Activated carbon is used to adsorb organic contaminants and remove these contaminants from water.
Examples of organic contaminants that are typically removed for drinking water application are taste
and odour causing chemicals, synthetic organic chemicals and color forming organics. Most bonding
of contaminants is physical and reversible, although some irreversible bonding occurs. Contact time in
an activated carbon reactor is 5 to 20 minutes.
Figure 8. Adsorption process on activated carbon.
Adsorption of these organics depends on the properties of the activated carbon, chemistry of the
adsorbate, pH and temperature. As such, each application requires development of an adsorption
isotherm. This isotherm relates the amount of contaminant that can be adsorbed to the contaminant
concentration present. Typically this relation is summarized mathematically as an isotherm. A
Freundlich Adsorption Isotherm for example is mathematically expressed as
x/m=Kc1/n
where
x = mass of adsorbate
m = mass of adsorbent
c = Equilibrium concentration of adsorbate in solution
In the figure below an adsorption isotherm of shower water by 2 commercial activated carbon types
(organosorb and airpel, www.desotec.com) is demonstrated. This curve was measured in order to
determine the ability of activated carbon to treat waste water from the Dranouter Music Festival
(Audenaert et al. 2008).
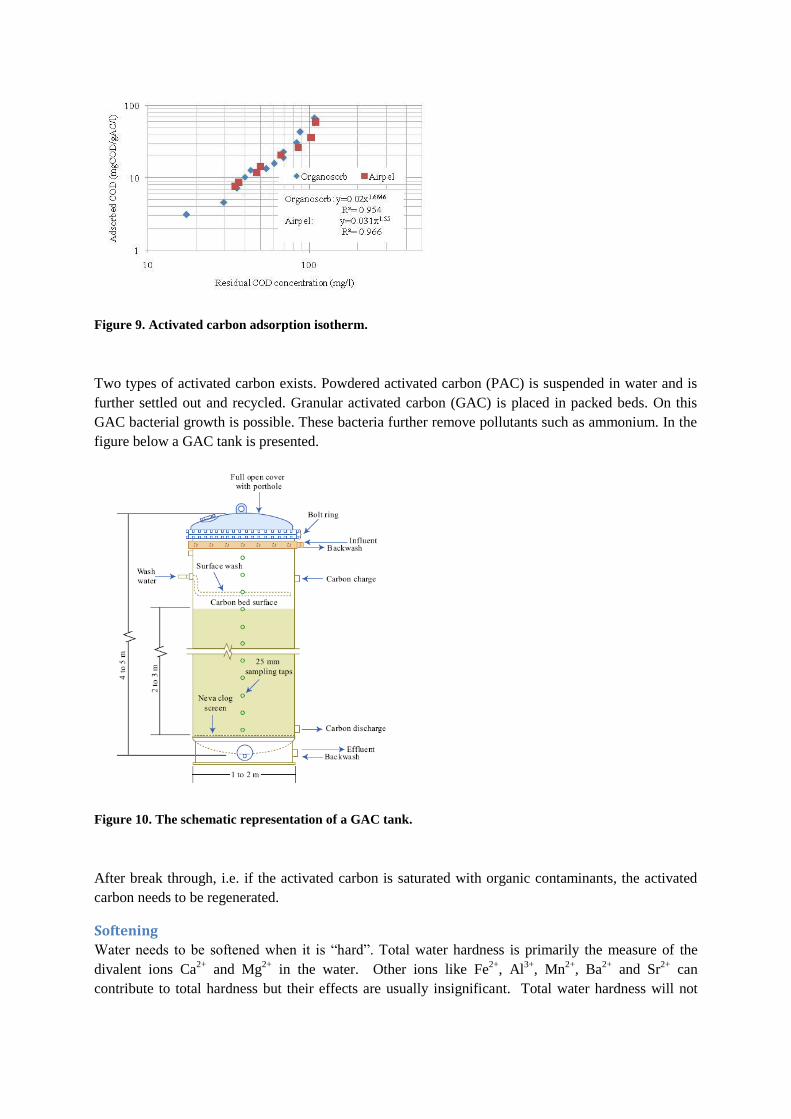
Figure 9. Activated carbon adsorption isotherm.
Two types of activated carbon exists. Powdered activated carbon (PAC) is suspended in water and is
further settled out and recycled. Granular activated carbon (GAC) is placed in packed beds. On this
GAC bacterial growth is possible. These bacteria further remove pollutants such as ammonium. In the
figure below a GAC tank is presented.
Figure 10. The schematic representation of a GAC tank.
After break through, i.e. if the activated carbon is saturated with organic contaminants, the activated
carbon needs to be regenerated.
Softening
Water needs to be softened when it is “hard”. Total water hardness is primarily the measure of the
divalent ions Ca2+
and Mg2+
in the water. Other ions like Fe2+
, Al3+
, Mn2+
, Ba2+
and Sr2+
can
contribute to total hardness but their effects are usually insignificant. Total water hardness will not
directly affect pH although "hard" water is generally alkaline due to interaction with carbonates in the
water.
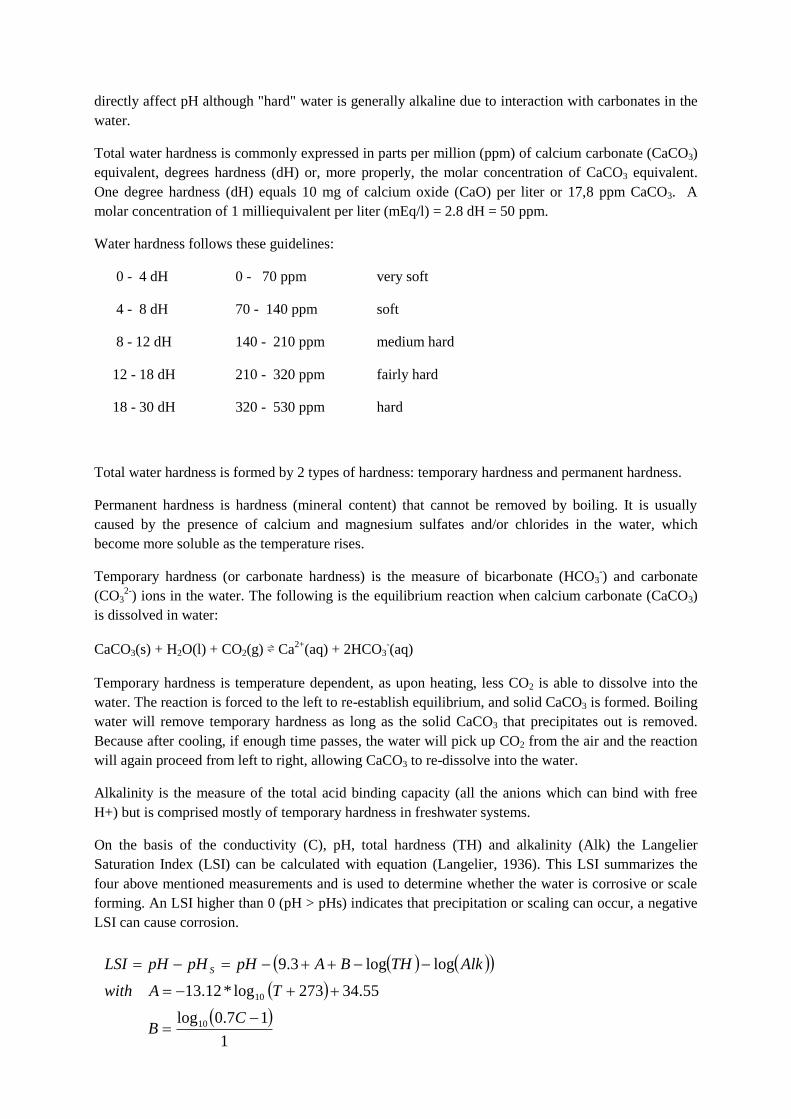
Total water hardness is commonly expressed in parts per million (ppm) of calcium carbonate (CaCO3)
equivalent, degrees hardness (dH) or, more properly, the molar concentration of CaCO3 equivalent.
One degree hardness (dH) equals 10 mg of calcium oxide (CaO) per liter or 17,8 ppm CaCO3. A
molar concentration of 1 milliequivalent per liter (mEq/l) = 2.8 dH = 50 ppm.
Water hardness follows these guidelines:
0 - 4 dH 0 - 70 ppm very soft
4 - 8 dH 70 - 140 ppm soft
8 - 12 dH 140 - 210 ppm medium hard
12 - 18 dH 210 - 320 ppm fairly hard
18 - 30 dH 320 - 530 ppm hard
Total water hardness is formed by 2 types of hardness: temporary hardness and permanent hardness.
Permanent hardness is hardness (mineral content) that cannot be removed by boiling. It is usually
caused by the presence of calcium and magnesium sulfates and/or chlorides in the water, which
become more soluble as the temperature rises.
Temporary hardness (or carbonate hardness) is the measure of bicarbonate (HCO3-) and carbonate
(CO32-
) ions in the water. The following is the equilibrium reaction when calcium carbonate (CaCO3)
is dissolved in water:
CaCO3(s) + H2O(l) + CO2(g) ⇌ Ca2+
(aq) + 2HCO3-(aq)
Temporary hardness is temperature dependent, as upon heating, less CO2 is able to dissolve into the
water. The reaction is forced to the left to re-establish equilibrium, and solid CaCO3 is formed. Boiling
water will remove temporary hardness as long as the solid CaCO3 that precipitates out is removed.
Because after cooling, if enough time passes, the water will pick up CO2 from the air and the reaction
will again proceed from left to right, allowing CaCO3 to re-dissolve into the water.
Alkalinity is the measure of the total acid binding capacity (all the anions which can bind with free
H+) but is comprised mostly of temporary hardness in freshwater systems.
On the basis of the conductivity (C), pH, total hardness (TH) and alkalinity (Alk) the Langelier
Saturation Index (LSI) can be calculated with equation (Langelier, 1936). This LSI summarizes the
four above mentioned measurements and is used to determine whether the water is corrosive or scale
forming. An LSI higher than 0 (pH > pHs) indicates that precipitation or scaling can occur, a negative
LSI can cause corrosion.
1
17.0log
55.34273log*12.13
loglog3.9
10
10
CB
TAwith
AlkTHBApHpHpHLSI S
The symbol T stands for temperature.
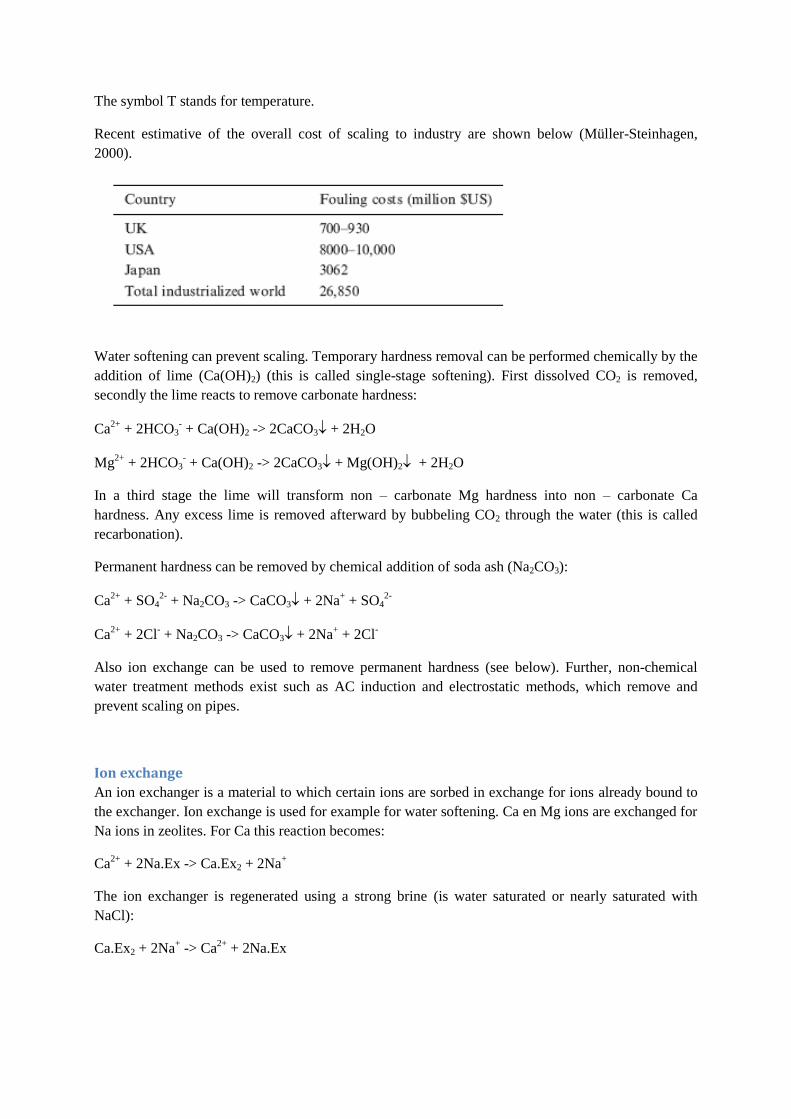
Recent estimative of the overall cost of scaling to industry are shown below (Müller-Steinhagen,
2000).
Water softening can prevent scaling. Temporary hardness removal can be performed chemically by the
addition of lime (Ca(OH)2) (this is called single-stage softening). First dissolved CO2 is removed,
secondly the lime reacts to remove carbonate hardness:
Ca2+
+ 2HCO3- + Ca(OH)2 -> 2CaCO3 + 2H2O
Mg2+
+ 2HCO3- + Ca(OH)2 -> 2CaCO3 + Mg(OH)2 + 2H2O
In a third stage the lime will transform non – carbonate Mg hardness into non – carbonate Ca
hardness. Any excess lime is removed afterward by bubbeling CO2 through the water (this is called
recarbonation).
Permanent hardness can be removed by chemical addition of soda ash (Na2CO3):
Ca2+
+ SO42-
+ Na2CO3 -> CaCO3 + 2Na+ + SO4
2-
Ca2+
+ 2Cl- + Na2CO3 -> CaCO3 + 2Na
+ + 2Cl
-
Also ion exchange can be used to remove permanent hardness (see below). Further, non-chemical
water treatment methods exist such as AC induction and electrostatic methods, which remove and
prevent scaling on pipes.
Ion exchange
An ion exchanger is a material to which certain ions are sorbed in exchange for ions already bound to
the exchanger. Ion exchange is used for example for water softening. Ca en Mg ions are exchanged for
Na ions in zeolites. For Ca this reaction becomes:
Ca2+
+ 2Na.Ex -> Ca.Ex2 + 2Na+
The ion exchanger is regenerated using a strong brine (is water saturated or nearly saturated with
NaCl):
Ca.Ex2 + 2Na+ -> Ca
2+ + 2Na.Ex

Figure 11. Schematic representation of water softening through ion exchange.
Most ion exchangers are now synthetic resins. Design of the ion exchange process is very similar to
the activated carbon process and aims add determining breakthrough curves.
Membrane filtration
A membrane process is a gaseous and/or liquid separation process where a feed stream is separated in
two flows. The flow which contains the components that are stopped by the membrane is called the
retentate stream, whereas the components that pass through the membrane are called the permeate
stream.
Figure 12. The membrane filtration process.
The transport through the membrane can be caused by a pressure difference, a concentration difference
or a chemical or electric potential difference. The membrane itself forms semi-permeabele partition
where some particles are transported more rapidly through than other. As such a separation of particles
is feasible.
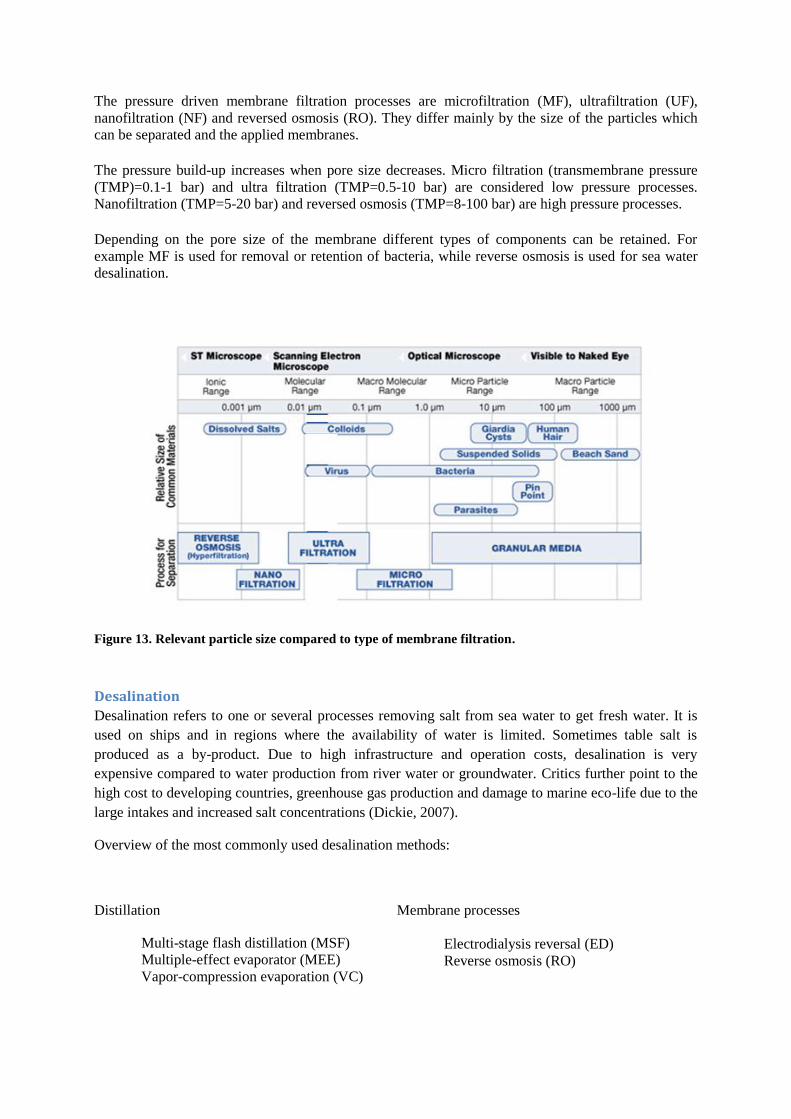
The pressure driven membrane filtration processes are microfiltration (MF), ultrafiltration (UF),
nanofiltration (NF) and reversed osmosis (RO). They differ mainly by the size of the particles which
can be separated and the applied membranes.
The pressure build-up increases when pore size decreases. Micro filtration (transmembrane pressure
(TMP)=0.1-1 bar) and ultra filtration (TMP=0.5-10 bar) are considered low pressure processes.
Nanofiltration (TMP=5-20 bar) and reversed osmosis (TMP=8-100 bar) are high pressure processes.
Depending on the pore size of the membrane different types of components can be retained. For
example MF is used for removal or retention of bacteria, while reverse osmosis is used for sea water
desalination.
Figure 13. Relevant particle size compared to type of membrane filtration.
Desalination
Desalination refers to one or several processes removing salt from sea water to get fresh water. It is
used on ships and in regions where the availability of water is limited. Sometimes table salt is
produced as a by-product. Due to high infrastructure and operation costs, desalination is very
expensive compared to water production from river water or groundwater. Critics further point to the
high cost to developing countries, greenhouse gas production and damage to marine eco-life due to the
large intakes and increased salt concentrations (Dickie, 2007).
Overview of the most commonly used desalination methods:
Distillation
Multi-stage flash distillation (MSF)
Multiple-effect evaporator (MEE)
Vapor-compression evaporation (VC)
Membrane processes
Electrodialysis reversal (ED)
Reverse osmosis (RO)

RO
45%
VC
5%
MEE
2% OTHER
2%
ED
6%
MSF
40%
Figure 14. Installed capacity by process.
Multiple-stage flash (MSF) is the most commonly used thermal process, where brine (salt water) is
successively heated and injected in chambers with gradually lower pressure. Immediate conversion to
the vapour phase takes place (flashing). This vapour is afterwards condensed, forming the fresh water.
Most desalination plants dating from the 20th century use this technology.
In recent years many of the new water production plants use reverse osmosis (RO) because of
technological breakthroughs in membrane technology. These plants perform at significantly lower
operation costs, due to lower energy consumption.
Co-generation is the process of using excess heat from power production to produce fresh water. In
modern, hybrid installations, this distillate is mixed with water from RO-desalination. The advantage
here is that through blending, the final water quality can be chosen (Hamed, 2005).
Disinfection
Disinfection aims at removing microbiological contaminants out of the water. Primary disinfection is
related to the inactivation of micro-organisms in the water. Secondary disinfection aims at keeping the
distribution system free from micro-organisms. In 1902, Belgium was the first country to use
chlorination as a water disinfectant.
Disinfection can be performed chemically with chlorine, ozone, H2O2 and chlorine dioxide.
Alternatively UV light can be used.
A number of researchers have used models to describe experimental disinfection data (www.who.int).
The simplest disinfection model is a combined one proposed by Chick (1908) and Watson (1908). In
the Chick–Watson model, the rate of inactivation of a microorganism is dependent upon the
concentration of the disinfectant (C) and contact time (t).
ln (N/No) = –kCnt
where:
k, n = empirical constants
N = microorganism concentration at time t, #/V
No = microorganism concentration at t0, the time of disinfectant addition, #/V

Figure 15. Ct values (for n1) to achieve 99% removal by various technologies.
Chlorine disinfection is the most widely used disinfection. It is inexpensive, effective at low
concentrations, but forms suspected human carcinogens such as tri-halo methanes as side-products.
Chlorine acts by oxidizing enzymes of cells, preventing metabolic processes.
Examples of products used for chlorine disinfection are chlorine gas (Cl2) and sodium hypochlorite
(NaOCl). Both products form in situ the disinfectants OCl- and HOCl. These chemicals react with
ammonia and form chloramines, which are also effective against bacteria, e.g. to prevent bacterial
growth in the distribution system.
Chlorine dosage is determined so as to ensure adequate residual (breakpoint chlorination). Adding
chlorine to water with ammonia forms chloramines. With additional application, chlorine residuals
increase and reach a maximum when the ratio of chlorine to ammonia is equal. As greater dosages of
chlorine are applied more dichloramines and trichloramines are formed. Trichloramine is unstable,
breaks down to N2 and reduces the chlorine residual until the breakpoint is reached. Beyond
breakpoint, the residual consists of free available residual chlorine, which is needed for disinfection in
the distribution system. .

Figure 16. Chlorine dosage.
Ozone (O3) is a more powerfull oxidant than HOCl and inactivates micro-organisms by direct
oxidation and decomposition into OH radicals, which are also strong reactants. Ozon is an excellent
disinfectant, but is more expensive than chlorine. Further, no residual disinfection is possible and
ozone gas is toxic to human. In order to reduce risks, ozone is generated from oxygen (O2) on-site in a
corona discharge-electric arc generated by high voltage between 2 plates separated by an air gap.
Typically ozone contact chambers are constructed as tanks in series and ozone is introduced as
bubbles.
Figure 17. Example of ozone contact chambers in series.
Electrolysis cells contain specially coated, permanent electrodes. A direct current with low voltage
level sees to it that oxygen and chlorine radicals are formed from the water itself (without adding
chemicals), resulting in disinfection. Both radicals reinforce one another and in their turn activate

reactive disinfectants (e.a. free chlorine), which provide for any remaining disinfection and residual
effects. The electric use per m³ of water to be treated is typically 20 - 50 Watt per m³ of treated water.
UV radiation is also used as disinfection process. UVradiation (wavelength 200-300 nm) damages
DNA and RNA and forms OH• radicals which are strong oxidants. Low pressure UV lamps have 1
wavelength only (254 nm), while medium pressure UV lamps are emitting in the 210- 300 nm range.
These medium pressure lamps disinfect more, but require more power. UV contacters are slightly
more expensive than chlorination. UV lamps are placed in the piping.
Figure 18. Example of a UV-light unit.
UV-Ozone Water Oxidation is the combination of ozone and a UV lamp. This combination results in
constant creation and destruction of ozone, which encourages the formation of atomic oxygen (O•), an
exceptionally strong oxidizing agent.

Waste water The direct discharge, without treatment, of domestic and industrial waste water into rivers and brooks
is not desirable because of the environmental impact and health risks associated with this direct
discharge. Oxygen depletion and eutrophication, i.e. undesirable growth of aquatic plants and algae, in
rivers are 2 examples of consequences of direct discharge. This chapter will review the most important
techniques for waste water treatment.
Several techniques that are used for drinking water of process water production, such as sand filtration
and disinfection, are also applied in waste water treatment. As such only specific waste water
treatment techniques will be reviewed.
Waste water treatment plant (WWTP) overview In the figure below a schematic overview of a classic domestic WWTP is demonstrated. Influent
consists of rain water collected in the sewer system, domestic water and possibly some industrial
discharges. More and more countries and regions such as Flanders, the northern part of Belgium, are
trying to separate the rain water collection system from the waste water sewer system because dilution
of waste water with rain water makes the WWTP treatment efficiency go down. Re-use of this rain
water as e.g. toilet flushing water or infiltration of the rain water in the soil are encouraged.
The waste water is first treated in a series of physic-chemical treatment steps. The aim of these process
units is the removal of heavy, corrosive and/or non-biodegradable components. As a second step the
waste water is send to a series of activated sludge reactors where carbon containing components (e.g.
glucose) expressed as COD (chemical oxygen demand), nitrogen components (e.g. ammonium) and
phosphor components (e.g. phosphate) are removed by bacterial action. The aim of the secondary
clarifier is the separation of the activated sludge, i.e. the bacterial population responsible for water
treatment, and the treated water. The activated sludge is recycled to the aeration tank and the treated
water is discharged after potential tertiary treatment such as chlorination. The excess sludge that is
produced in the WWTP is further dewatered and digested after which it is removed from the plant.
Figure 19. Schematic of a waste water treatment plant.
In most WWTP a flow equalization tank is also foreseen to cope with variable influent flow rate due to
daily variations or rain events.
Primary treatment Primary treatment consists of a series of mechanical and or physic-chemical treatment steps in order to
remove large debris, abrasive particles such as sand and difficultly biodegradable components such as
oil and fat.
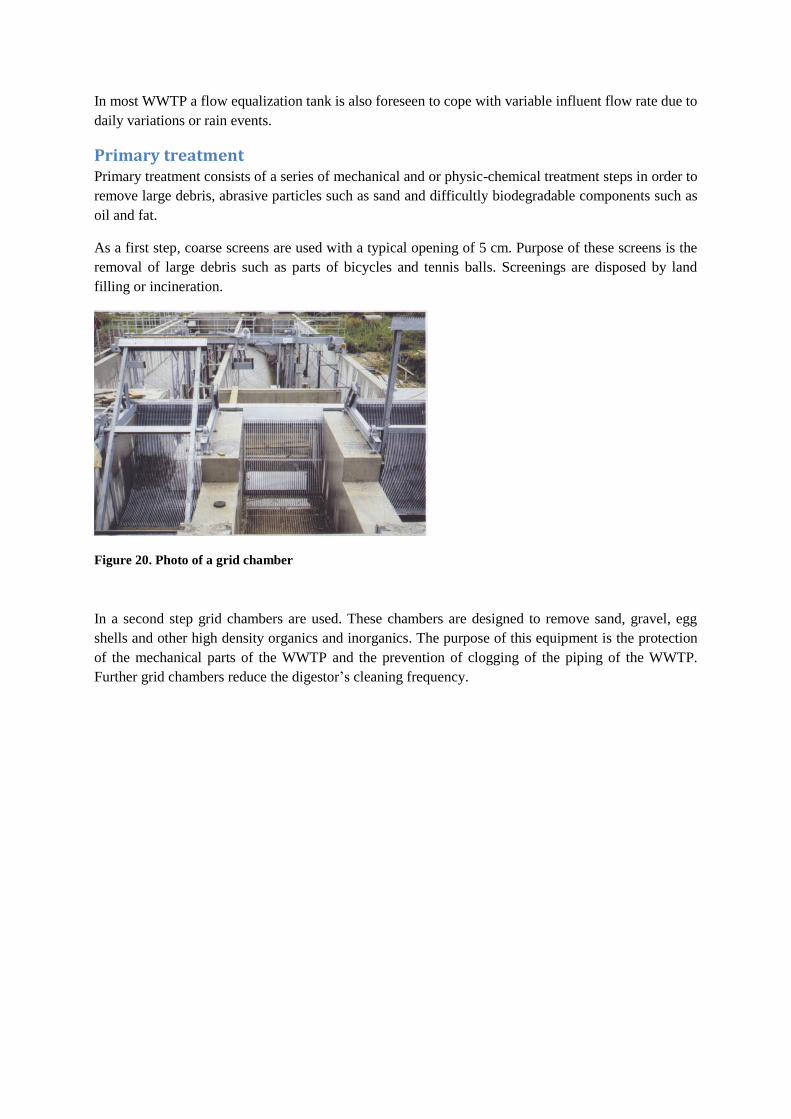
As a first step, coarse screens are used with a typical opening of 5 cm. Purpose of these screens is the
removal of large debris such as parts of bicycles and tennis balls. Screenings are disposed by land
filling or incineration.
Figure 20. Photo of a grid chamber
In a second step grid chambers are used. These chambers are designed to remove sand, gravel, egg
shells and other high density organics and inorganics. The purpose of this equipment is the protection
of the mechanical parts of the WWTP and the prevention of clogging of the piping of the WWTP.
Further grid chambers reduce the digestor’s cleaning frequency.

Figure 21. Sections of a grid chamber.
Together with the grid chambers, often a fat trap is used in order to remove floating grease, oil and fat
by scraping it of the water surface.
As a third step a primary clarifier is used to remove the last part of settle able material before the waste
water is send to the biological treatment unit. By removing as much as possible biodegradable material
before the biological treatment unit a significant cost saving can be accomplished because less oxygen
will have to be supplied for biodegradation of the pollutants. In most cases, primary clarifiers have a
rectangular shape.
Figure 22. Schematic of clarifier.
Secondary or biological treatment

In the biological treatment, bacteria remove carbon containing components (COD), nitrogen
components and phosphor components. An oxidation method can be used where bacteria are attached
to a surface such as lava rock.
Figure 23. Photo of a trickling filter.
An activated sludge process can also be used. In such as process, bacteria are suspended in a reactor as
flocs. Aeration of these reactors is necessary for air supply, keeping the biomass in suspension and
circulation of the activated sludge through the different reactor compartments. Aeration itself can be
performed through surface aerators or bubble aerators.
Figure 24. Photo of an activated sluge

Biological reactions
Heterotrophic bacteria use organic carbon as energy and carbon source for new growth. As such they
transform carbon containing components into CO2 (which results in a “pollution shift”: harmful
components present in water are transformed to a green house gas). Casein, which is present in dairy
waste, is degraded as follows:
C8H12N2O3 + 3O2 -> C5H7O2N + NH3 + 3CO2 + H2O
In this equation C5H7O2N represents newly formed heterotrophic biomass. Instead of oxygen also
other electron acceptors can be used such as nitrate. This is what happens during denitrification, which
is a reaction in which nitrate is reduced to nitrogen gas. The choice of electron acceptor is governed by
the energy that is produced by the biological reaction, which is highest when oxygen is used.
Ammonium removal is accomplished by a combination of nitrification by autotrophic bacteria and
denitrification by heterotrophic bacteria. Autotrophic bacteria use CO2 as carbon source. Nitrification
is a 2 step process in which ammonium is first oxidized to nitrite and than to nitrate by ammonium and
nitrite oxidizing organisms:
2 NH4+ + 3 O2 -> 2 NO2
- + 4H
+ + 2H2O
2 NO2- + O2 -> 2 NO3
-
In the denitrification reaction nitrate is reduced to nitrogen gas:
5 C6H12O6 + 24 NO3-+ 24 H
+ -> 30 CO2 + 42 H2O +12 N2
In order to accomplish this denitrification reaction anoxic, i.e. oxygen free, conditions need to be
imposed. For this different reactor configurations exist.
Figure 25. Substrate-driven denitrification.

Figure 26. Postanoxic denitrifcation.
Phosphor removal can also be accomplished biologically by combining an anaerobic zone, i.e. without
oxygen or nitrate, and an aerobic zone in the WWTP. In the anaerobic zone phosphorous will be
released by the biomass if sufficient volatile fatty acids are present. In the aerobic zone phosphorous is
taken up by the biomass. The net result of this release and uptake is a reduction of phosphorous
concentration in the water.
Figure 27. Typical profile of soluble phosphorus concentrations in a biological nutrient removal process
(ATP - adenosine triphophate, ADP - adenosine triphosphate, ADP -adenosine diphosphate.

Figure 28. Typical configurations to accomplish COD, N and P removal are the UCT (University of
Bardenpho) process (b) and the Bardenpho process (a) in which anaerobic, anoxic and aerobic zones are
combined.
Typically however biological phosphorous removal will not work. As such metal salt such as FeCl3 or
polymers are dosed in order to precipitate phosphorous:
FeCl3 + H2PO4- + 2HCO3- -> FePO4 + 3 Cl
- + 2CO2 + 2H2O
This is a very effective, although not a sustainable technique.
Secondary settling The purpose of a secondary settler is the separation of the activated sludge, which is recycled to the
activated sludge reactors and the treated waste water. Separation secondary clarifiers is based on
gravity and generally circular clarifiers are used. Part of the return sludge is wasted from the WWTP.
This excess sludge is further treated by dewatering, digestion and drying.
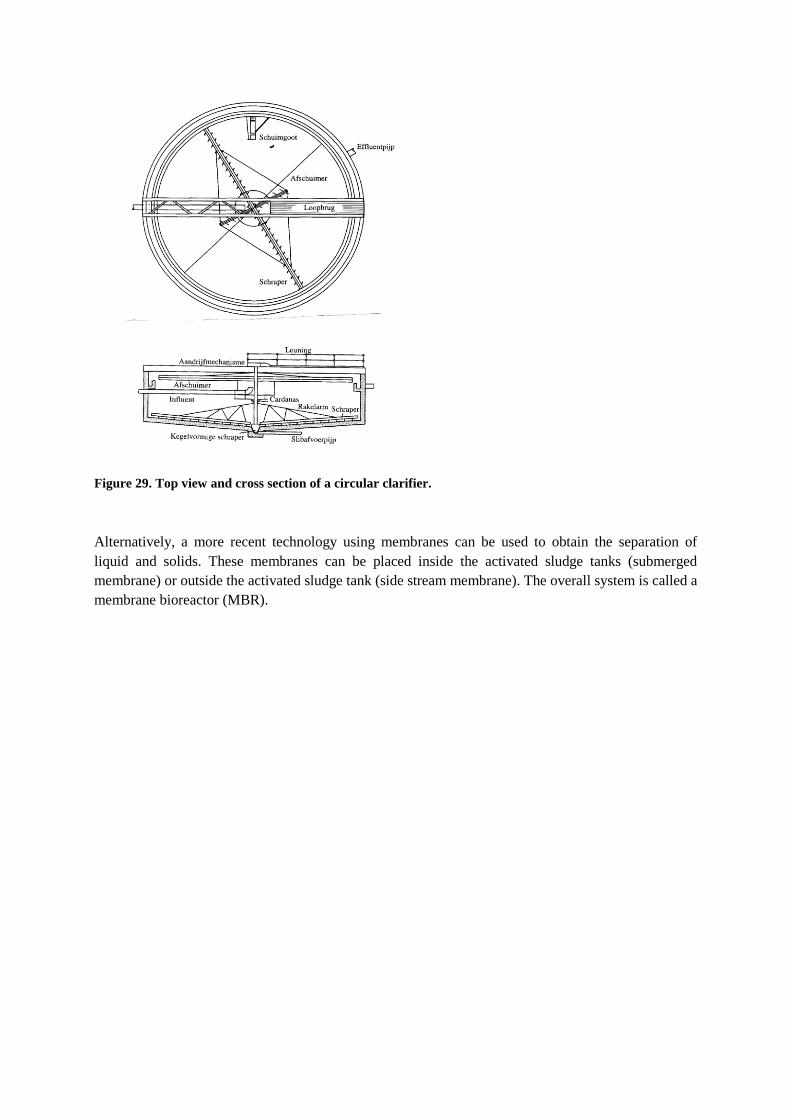
Figure 29. Top view and cross section of a circular clarifier.
Alternatively, a more recent technology using membranes can be used to obtain the separation of
liquid and solids. These membranes can be placed inside the activated sludge tanks (submerged
membrane) or outside the activated sludge tank (side stream membrane). The overall system is called a
membrane bioreactor (MBR).
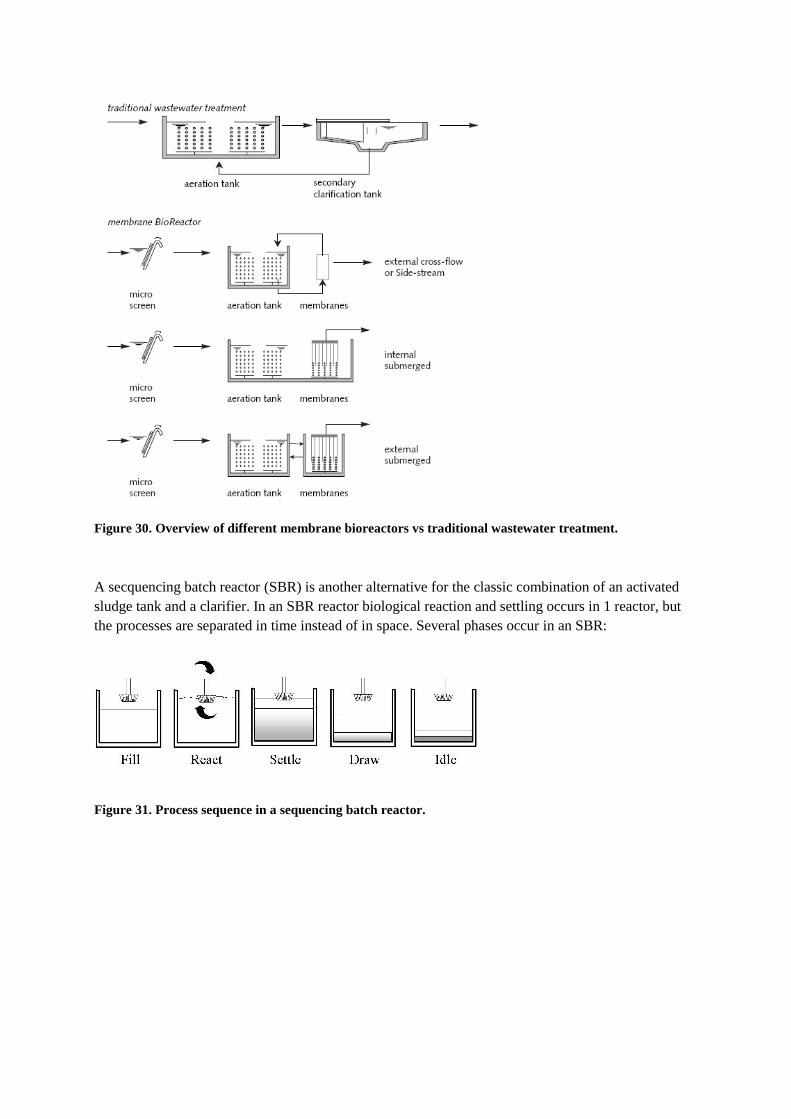
Figure 30. Overview of different membrane bioreactors vs traditional wastewater treatment.
A secquencing batch reactor (SBR) is another alternative for the classic combination of an activated
sludge tank and a clarifier. In an SBR reactor biological reaction and settling occurs in 1 reactor, but
the processes are separated in time instead of in space. Several phases occur in an SBR:
Figure 31. Process sequence in a sequencing batch reactor.

The table below gives an overview of typical design parameters for activated sludge processes:
(OCW)
Anaerobic digestion Anaerobic digestion is used to treat waste water streams containing high amounts of COD and excess
sludge. Further the technique is used to process energy crops. The advantage of anaerobic digestion
over aerobic water treatment is the fact that biogas (methane) is formed. This biogas can be used to
produce energy and heat. Anaerobic digestion occurs in four steps. First hydrolysis occurs: complex
organic matter is decomposed into simple soluble organic molecules using water to split the chemical
bonds between the substances. Then fermentation or acidogenesis occurs: the chemical decomposition
of carbohydrates by enzymes, bacteria, yeasts, or molds in the absence of oxygen. With acetogenesis
the fermentation products are converted into acetate, hydrogen and carbon dioxide by what are known
as acetogenic bacteria. With methanogenesis methane is produced from acetate and hydrogen/carbon
dioxide by methanogenic bacteria. The acetogenic bacteria grow in close association with the
methanogenic bacteria during the fourth stage of the process. The reason for this is that the conversion
of the fermentation products by the acetogens is thermodynamically feasible only if the hydrogen
concentration is kept sufficiently low. This requires a close relationship between both classes of
bacteria.

The anaerobic process only takes place under strict anaerobic conditions. It requires specific adapted
bio-solids and particular process conditions, which are considerably different from those needed for
aerobic treatment.
Figure 32. The anaerobic digestion process.
Sludge thickening and dewatering On a yearly basis about 20 kg excess sludge per inhabitant (equivalent) is produced in a municipal
WWTP. This sludge is first dewatered mechanically by a filter press or a centrifuge, stabilized by
digestion and dried. After this it is used as fuel for electricity production or cement ovens.
Figure 33. Centrifuge used for sludge thickening

Figure 34. Scheme of a gravity belt thickener.
Summary water treatment techniques Various contaminants can be removed using various techniques. The next table gives an overview of
common pollutants and the techniques by with they are removed:
Pollutants Water treatment technique
large debris coarse screens
high-density sediments grid chamber
oils, fats fat trap
settle able BOD + COD sedimentation; filtration
colloidal BOD + COD biological treatment (aeration)
flocculation (+ sedimentation; filtration)
dissolved BOD + COD biological treatment (aeration); activated
carbon filtration
ammonia Nitrification
nitrate denitrification; biomass assimilation;
reverse osmosis

phosphorous
substrate adsorption; biomass assimilation;
addition of chemical reagents; reverse
osmosis
organic compounds ion exchange; activated carbon filtration;
ozone
volatile organic compounds air stripping
excess sludge sedimentation; anaerobic digestion
micro organisms
sand/lava filtration; microfiltration; ozone;
chlorine; UV-irradiation; electrolysis;
ultrasone; heating; …
Figures reference list
Figure 1. U.S. Geographical Survey, 2008. http://ga.water.usgs.gov/edu/
Figure 2. U.S. Geographical Survey, 2008. http://ga.water.usgs.gov/edu/
Figure 3. Bosklopper, Th.G.J., Rietveld, L.C., Babuska, R., Smaal, B., Timmer, J., 2004. Integrated
operation of drinking water treatment plant at Amsterdam Water Supply. IWA 4th World
Water Congress and Exhibition 20-24 September 2004 – Marrakech
Figure 4. By kind permission of the “Vlaamse Maatschappij voor Watervoorziening” (VMW).
Figure 5. Shanahan, P., 2008. MIT OCW Lecture notes: Water and Wastewater Treatment
Engineering.
Figure 6. MIT OCW, 2008. Adapted from: Camp, T.R. Studies of sedimentation Basin Design.
Sewage and Industrial Wastes 25, no. 1 (1953): 1-12.
Figure 7. Shanahan, P., 2008. MIT OCW Lecture notes: Water and Wastewater Treatment
Engineering.
Figure 8. MIT OCW, 2008. Adapted from: Culp, G.L., Culp, R.L., 1974. New Concepts in Water
Purification. New York, NY: Van Nostrand Reinhold Co.
Figure 9. S.W.H. Van Hulle, W. Audenaert, B. Decostere, J. Hogie, P. Dejans, 2008. Sustainable
water treatment of temporary events: the Dranouter Music Festival case study. In:
Proceedings 5th IWA Leading-Edge Conference. 1-4 juni 2008, Zurich, Zwitserland
Figure 10. Metcalf, & Eddy, Inc., Revised by Tchobananoglous, G. & Burton, F.L., 1991.
Wastewater engineering: treatment, disposal and reuse. McGraw-Hill, McGraw-Hill series
in water resources and environmental engineering, New York, USA.
Figure 11. Zeoliet site, 2008. www.zeoliet.nl
Figure 12. Vlaamse instelling voor technologisch onderzoek, 2008. www.vito.be
Figure 13. www.zenon.com

Figure 14. Wangnick, K., 2002. IDA Worldwide Desalting Plants Inventory Report No. 17
Figure 15. MIT OCW, 2008. Adapted from: MWH, J. C. Crittenden, R. R. Trussell, D. W. Hand, K.
J. Howe, and G. Tchobanoglous. Water Treatment: Principles and Design. 2nd ed.
Hoboken, NJ: John Wiley & Sons, 2005, p. 1063.
Figure 16. Global Security, 2008. http://www.globalsecurity.org/military/library/policy/army/fm/10-
52-1/Ch1.htm#s5
Figure 17. MIT OCW, 2008. Adapted from: MWH, J. C. Crittenden, R. R. Trussell, D. W. Hand, K.
J. Howe, and G. Tchobanoglous. Water Treatment: Principles and Design. 2nd ed.
Hoboken, NJ: John Wiley & Sons, 2005, p. 1121.
Figure 18. MIT OCW, 2008. Adapted from: Mancl, Karen M. "Bacteria in Drinking Water." The
Ohio State University Extension Bulletin. Bulletin 795 (1989).
Figure 19. Metcalf, & Eddy, Inc., Revised by Tchobananoglous, G. & Burton, F.L., 1991.
Wastewater engineering: treatment, disposal and reuse. McGraw-Hill, McGraw-Hill series
in water resources and environmental engineering, New York, USA.
Figure 20. unknown author
Figure 21. MIT OCW, 2008. Adapted from: Reynolds, T. D., and P. A. Richards. Unit Operations
and Processes in Environmental Engineering. 2nd ed. Boston, MA: PWS Publishing
Company,1996, p. 141.
Figure 22. MIT OCW, 2008. Adapted from: Reynolds, T. D., and P. A. Richards. Unit Operations
and Processes in Environmental Engineering. 2nd ed. Boston, MA: PWS Publishing
Company, 1996, p. 249. ISBN: 0534948847.
Figure 23. unknown author
Figure 24. unknown author
Figure 25. Shanahan, P., 2008. MIT OCW Lecture notes: Water and Wastewater Treatment
Engineering
Figure 26. Shanahan, P., 2008. MIT OCW Lecture notes: Water and Wastewater Treatment
Engineering
Figure 27. MIT OCW, 2008. Adapted from: Rittman, Bruce E., and Perry L. McCarty.
Environmental Biotechnology: Principals and Applications. New York, NY: McGraw-
Hill, 2001.
Figure 28. Typical configurations to accomplish COD, N and P removal are the UCT (University of
Cape Town) process (b) and the Bardenpho process (a) in which anaerobic, anoxic and
aerobic zones are combined.
Figure 29. Metcalf, & Eddy, Inc., Revised by Tchobananoglous, G. & Burton, F.L., 1991.
Wastewater engineering: treatment, disposal and reuse. McGraw-Hill, McGraw-Hill series
in water resources and environmental engineering, New York, USA.
Figure 30. Metcalf, & Eddy, Inc., Revised by Tchobananoglous, G. & Burton, F.L., 1991.
Wastewater engineering: treatment, disposal and reuse. McGraw-Hill, McGraw-Hill series
in water resources and environmental engineering, New York, USA.

Figure 31. Figure by Napier University Edinburg, 2008.
http://www.lifesciences.napier.ac.uk/smaefiles/kinneil/kinneil.htm
Figure 32. Virginia’s Community Colleges, 2008. http://water.me.vccs.edu/
Figure 33. MIT OCW, 2008. Adapted from: G. Tchobanoglous, F.L. Burton, and H.D. Stensel.
Wastewater Engineering: Treatment and Reuse. 4th ed. Metcalf & Eddy Inc., New York,
NY: McGraw-Hill, 2003, p. 1469.
Figure 34. MIT OCW, 2008. Adapted from: G. Tchobanoglous, F.L. Burton, and H.D. Stensel.
Wastewater Engineering: Treatment and Reuse. 4th ed. Metcalf & Eddy Inc., New York,
NY: McGraw-Hill, 2003, p. 1469.