water services trust fund sanitation service levels in nairobi …and beyond presentation for the...
TRANSCRIPT
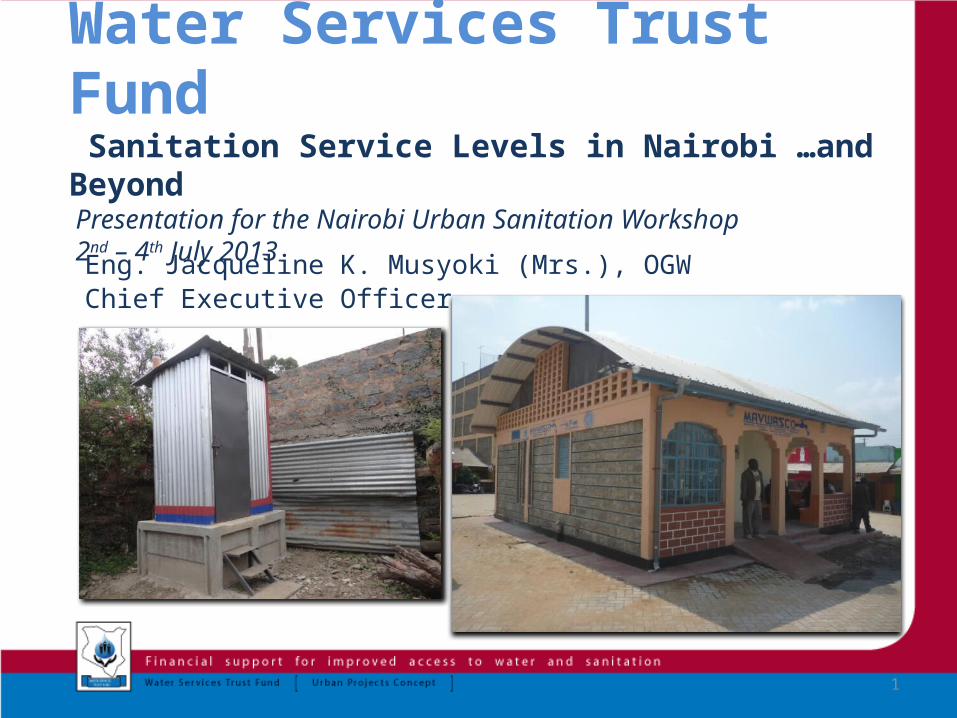
Water Services Trust Fund Sanitation Service Levels in Nairobi …and Beyond Presentation for the Nairobi Urban Sanitation Workshop 2nd – 4th July 2013
Eng. Jacqueline K. Musyoki (Mrs.), OGW Chief Executive Officer
1
Urban Low Income Areas & Sanitation
Low income areas in Kenya and Nairobi: • There are slightly over 2,000(*) low income areas (LIAs) in Kenya, 383 of
which are found in Nairobi
• In Nairobi approximately 2.9 million people are residing in a LIA
• More than 65% of all Nairobians are living in a low income area
• In Nairobi’s LIAs only 51% (Kenya 47%) of all dwellings have access to an improved sanitation facility (JMP & WSTF definition)
• Approximately 28% of all LIA dwellings use a pit latrine and 15% a fee-paying toilet
• Open defecation (e.g. “flying toilets”) is mainly practiced in a number of informal settlements with very high population densities (0.5% of all LIA dwellings in Nairobi)
*): MajiData is the source of all figures used unless mentioned otherwise
2
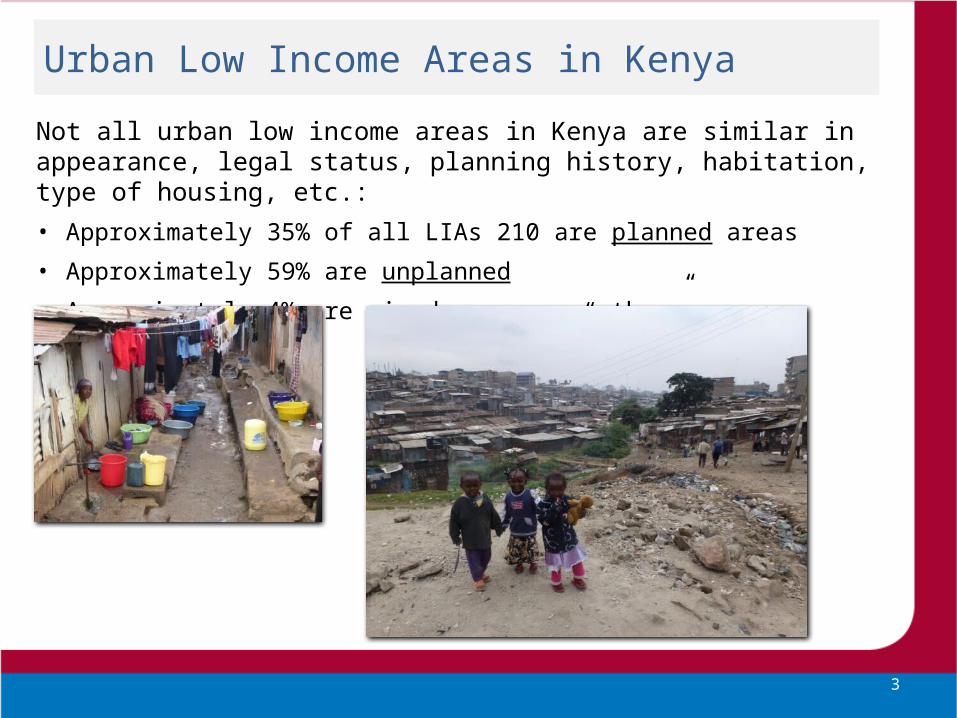
Urban Low Income Areas in Kenya
Not all urban low income areas in Kenya are similar in appearance, legal status, planning history, habitation, type of housing, etc.:• Approximately 35% of all LIAs 210 are planned areas
• Approximately 59% are unplanned
• Approximately 4% are mixed areas or “other”
3
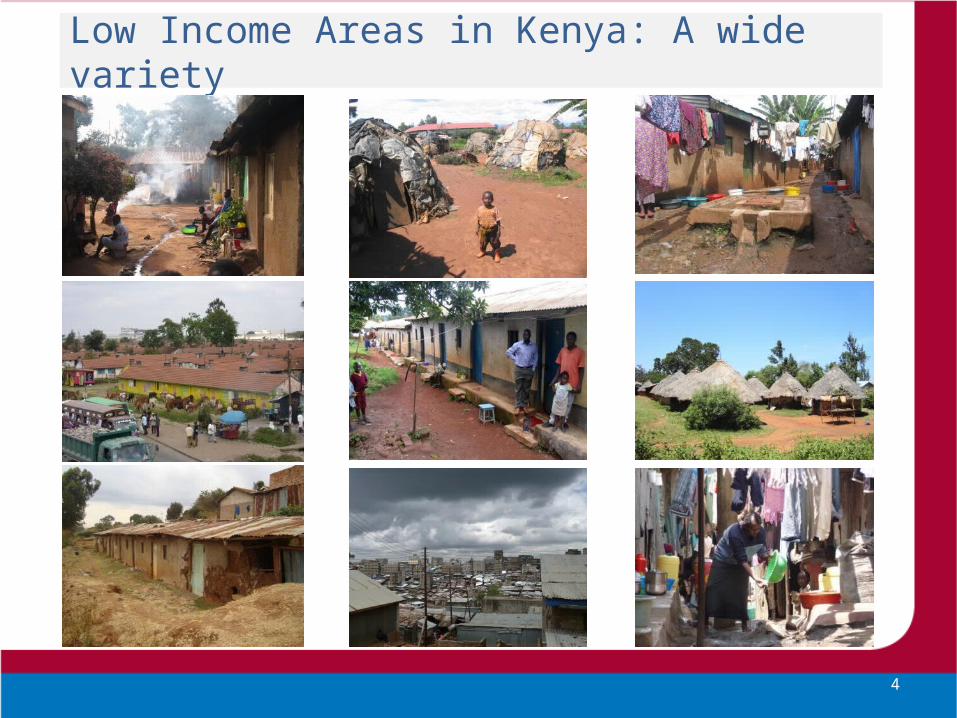
Low Income Areas in Kenya: A wide variety
4

Urban Low Income Areas in Nairobi
Not all urban low income areas are similar in appearance, legal status, planning history, habitation, type of housing, etc.:• Out of the 383 Nairobi, LIAs 210 are unplanned and 149 are planned (23 mixed
areas)
• Some areas (planned & unplanned) have formal housing, others have informal housing
5
Settlement Percentage Population
Area with informal housing 7.9 229 564Area with planned low income housing 40.8 1 195 473Informal settlement 40.2 1 175 288Large rural centre with urban characteristics 0.01 431Mixed area (residential, commercial or industrial 0.1 3 125Other 11.0 321 796Urban refugee (IDP) camp 0.01 265
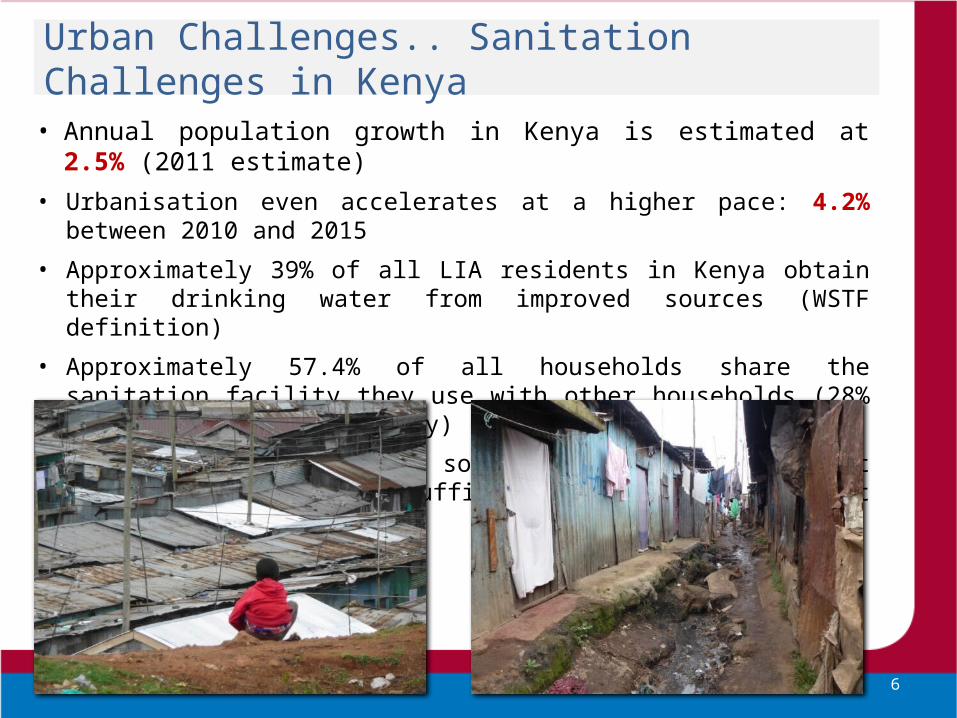
Urban Challenges.. Sanitation Challenges in Kenya
• Annual population growth in Kenya is estimated at 2.5% (2011 estimate) • Urbanisation even accelerates at a higher pace: 4.2% between 2010 and 2015
• Approximately 39% of all LIA residents in Kenya obtain their drinking water from improved sources (WSTF definition)
• Approximately 57.4% of all households share the sanitation facility they use with other households (28% share an improved facility)
• Population densities in some LIAs are so high that there is simply no sufficient space to construct toilets
6
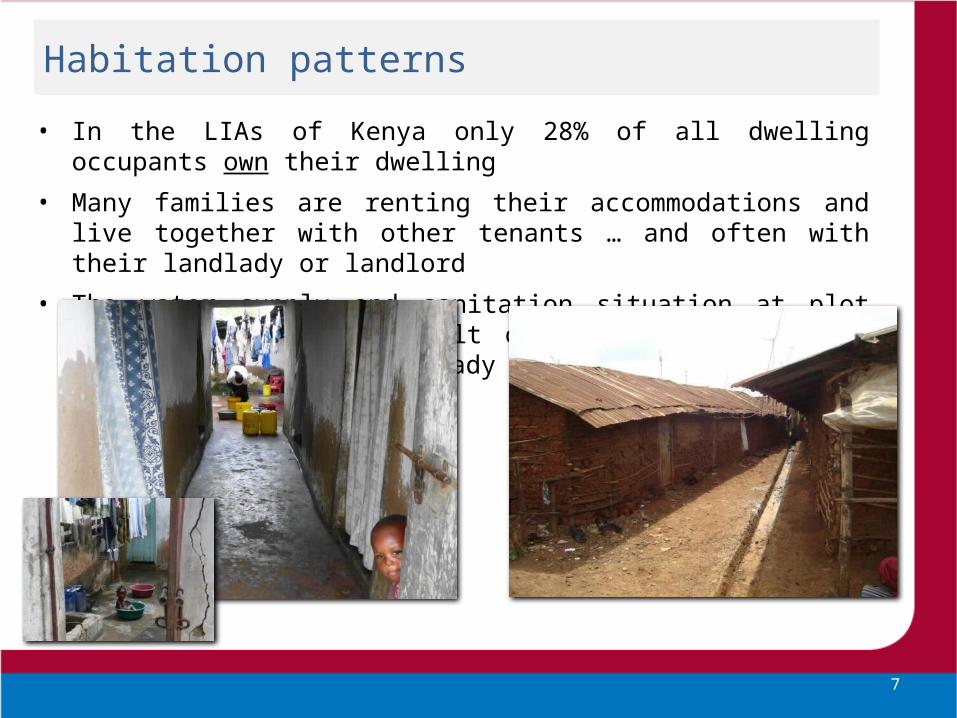
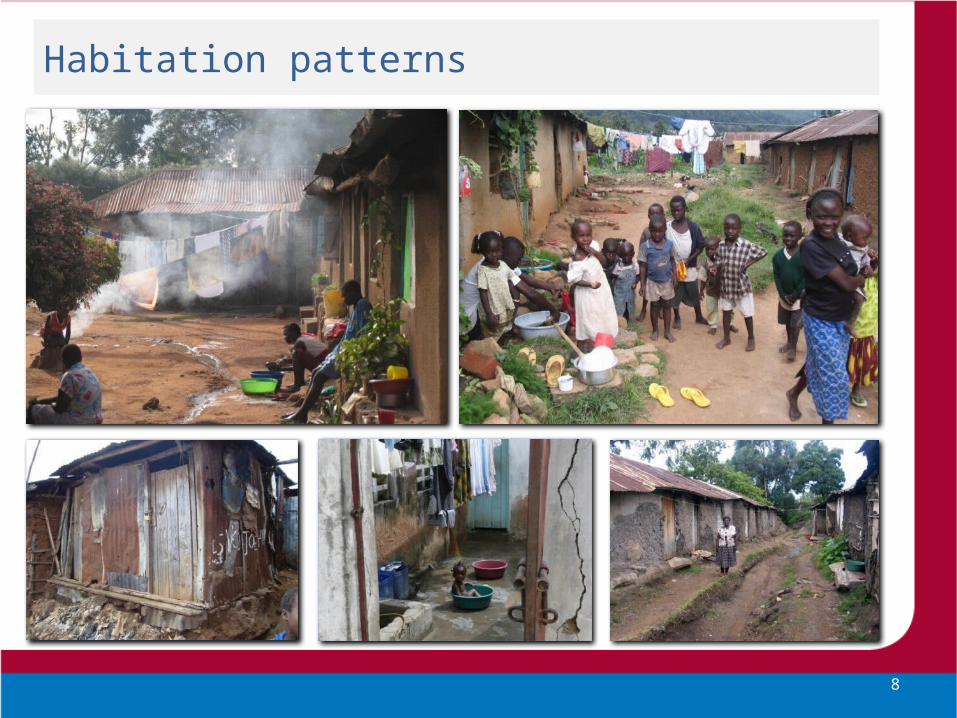
Habitation patterns
• In the LIAs of Kenya only 28% of all dwelling occupants own their dwelling
• Many families are renting their accommodations and live together with other tenants … and often with their landlady or landlord
• The water supply and sanitation situation at plot level is often the result of decisions that are usually made by the landlady or landlord
7
Habitation patterns
8
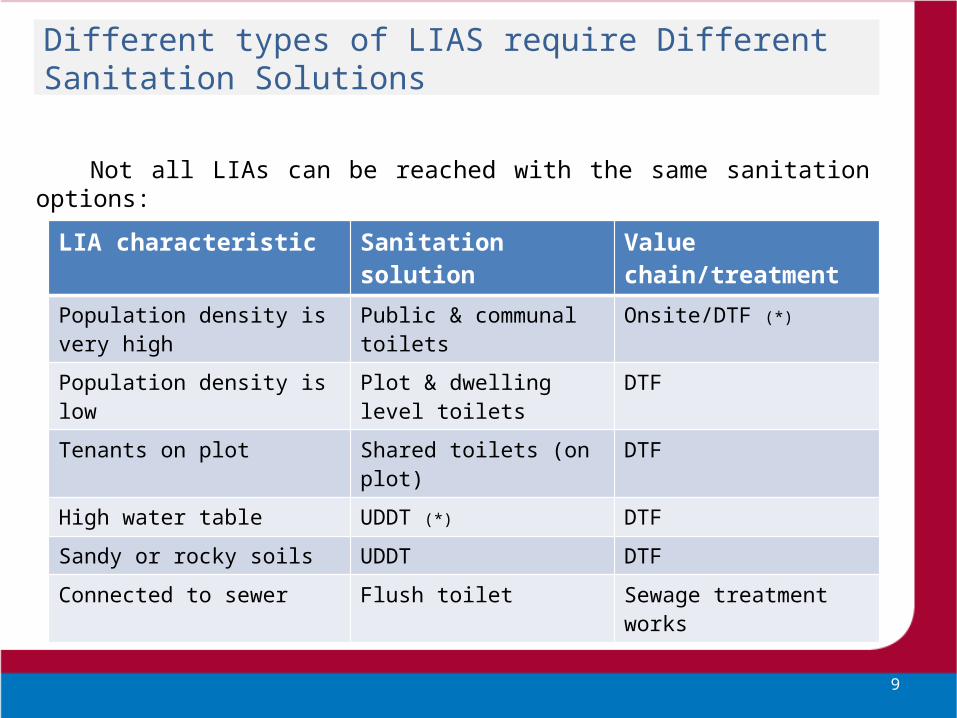
Different types of LIAS require Different Sanitation Solutions
Not all LIAs can be reached with the same sanitation options:
*): DTF = Decentralised treatment facility; UDDT: Urine diverting dry toilet
9
LIA characteristic Sanitation solution Value chain/treatment
Population density is very high Public & communal toilets Onsite/DTF (*)
Population density is low Plot & dwelling level toilets DTF
Tenants on plot Shared toilets (on plot) DTF
High water table UDDT (*) DTF
Sandy or rocky soils UDDT DTF
Connected to sewer Flush toilet Sewage treatment works
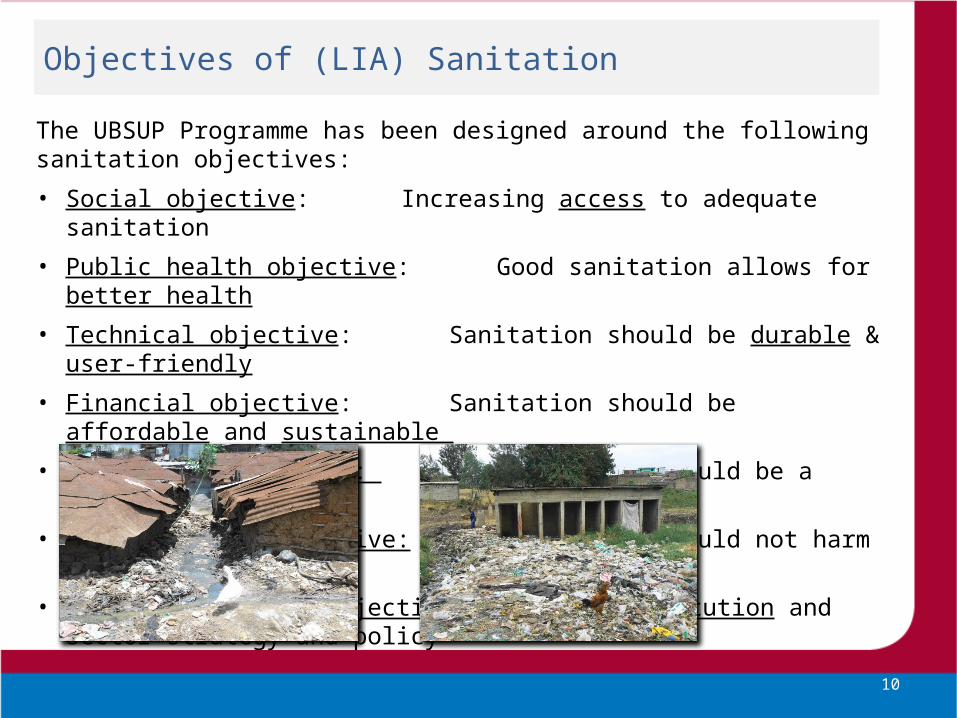
Objectives of (LIA) Sanitation
The UBSUP Programme has been designed around the following sanitation objectives:
• Social objective: Increasing access to adequate sanitation
• Public health objective: Good sanitation allows for better health
• Technical objective: Sanitation should be durable & user-friendly
• Financial objective: Sanitation should be affordable and sustainable
• Commercial objective: Sanitation should be a business
• Environmental objective: Sanitation should not harm the environment
• National & sector objectives: The Constitution and sector strategy and policy
10
Objectives of (LIA) Sanitation
All these sanitation objectives have been addressed:
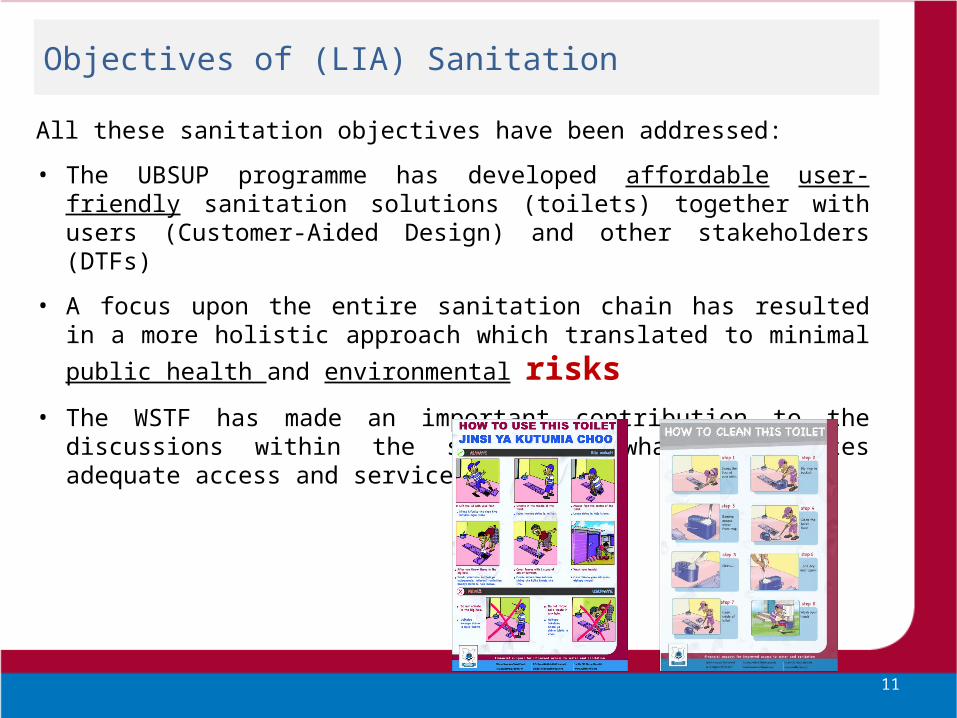
• The UBSUP programme has developed affordable user-friendly sanitation solutions (toilets) together with users (Customer-Aided Design) and other stakeholders (DTFs)
• A focus upon the entire sanitation chain has resulted in a more holistic approach
which translated to minimal public health and environmental risks • The WSTF has made an important contribution to the discussions within the sector
on what constitutes adequate access and service level
11
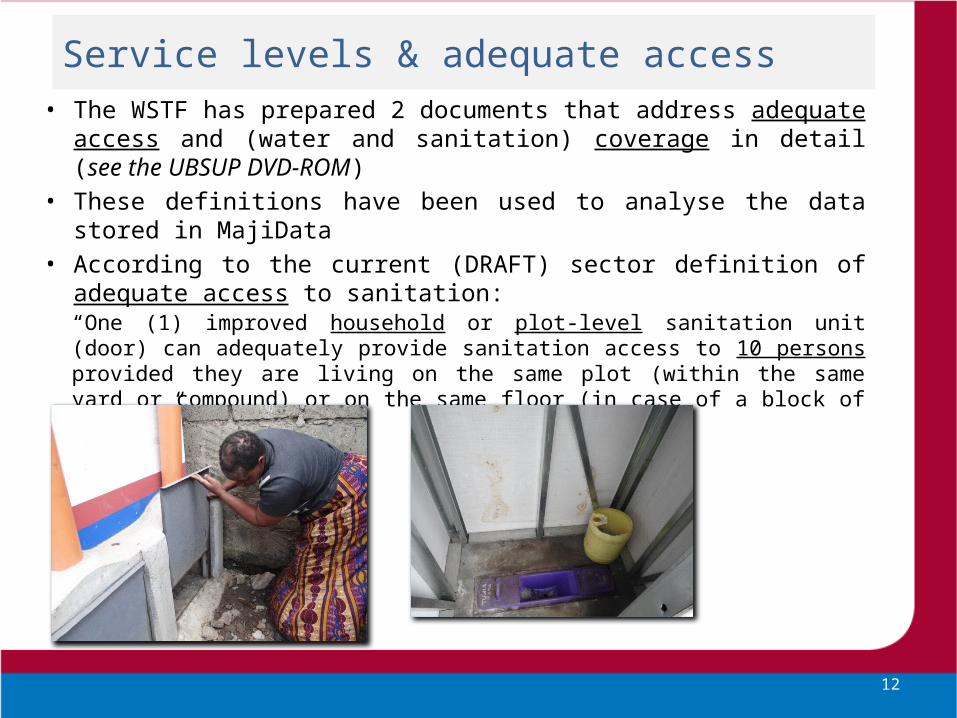
Service levels & adequate access• The WSTF has prepared 2 documents that address adequate access and (water
and sanitation) coverage in detail (see the UBSUP DVD-ROM)• These definitions have been used to analyse the data stored in MajiData• According to the current (DRAFT) sector definition of adequate access to
sanitation:“One (1) improved household or plot-level sanitation unit (door) can adequately provide sanitation access to 10 persons provided they are living on the same plot (within the same yard or compound) or on the same floor (in case of a block of flats).”
12

Service levels & adequate accessThe following sanitation options are considered to be improved sanitation facilities:
13
Type of sanitation facility/practice(X = improved facility)
Improved facility (sanitation)WASREB JMP
Urban areas
Rural areas
All areas
Flush or pour flush to piped sewer system (not shared) X (4) X XFlush or pour flush to septic tank (not shared) X X XFlush or pour flush to pit latrine (not shared) X X XFlush/pour-flush to piped sewer system (plot-level, shared by max. 10 persons) X X Flush or pour flush to septic tank (plot-level, shared by max. 10 persons) X X Flush or pour flush to pit latrine (plot-level, shared by max. 10 persons) X X Public sanitation facility (1) X X Ventilated improved pit latrine (VIP) X X XPit latrine with slab X X XComposting toilet X X XFlush of pour flush to elsewhere (2) Pit latrine without slab Bucket Hanging toilet or hanging latrine No facility or use of bush or field (3) 1): Only an improved sanitation facility in certain urban settings such as urban slums with very high population densities 2): E.g. excreta are flushed to the street, yard or plot, open sewer, a ditch, a drainage way or other location 3): In rural areas with very low population densities open defecation or “cat system” defecation may not pose a risk to
public health and to the environment. 4): The fact that a sanitation facility is improved does not imply that the sludge, excreta and/or compost are managed in a
sustainable and environmentally- and public health-friendly manner.

Service levels & adequate access• UBSUp’s SafiSan toilets have been designed on the basis of the following criteria:
1. A toilet is not to be shared by more than 10 persons2. A vault should be used for a minimum of 6 months
3. A vault should be given a minimum storage period of 6 months
14
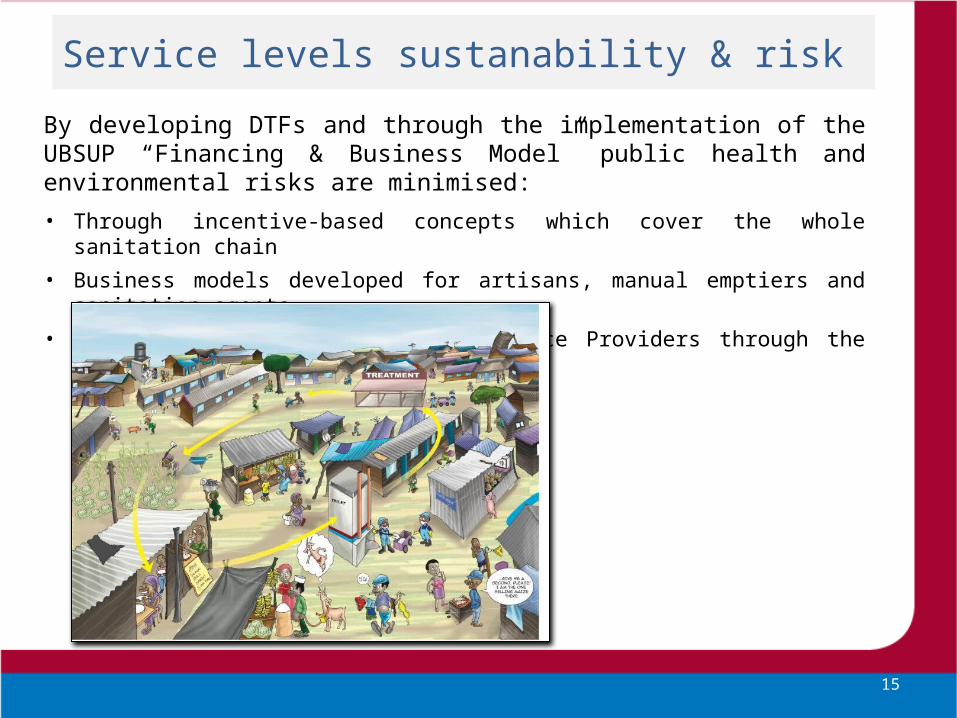
Service levels sustanability & risk
By developing DTFs and through the implementation of the UBSUP “Financing & Business Model” public health and environmental risks are minimised:
• Through incentive-based concepts which cover the whole sanitation chain• Business models developed for artisans, manual emptiers and sanitation agents• Incentives provided for Water Service Providers through the Water Sector Regulary Board
(WASREB)
15
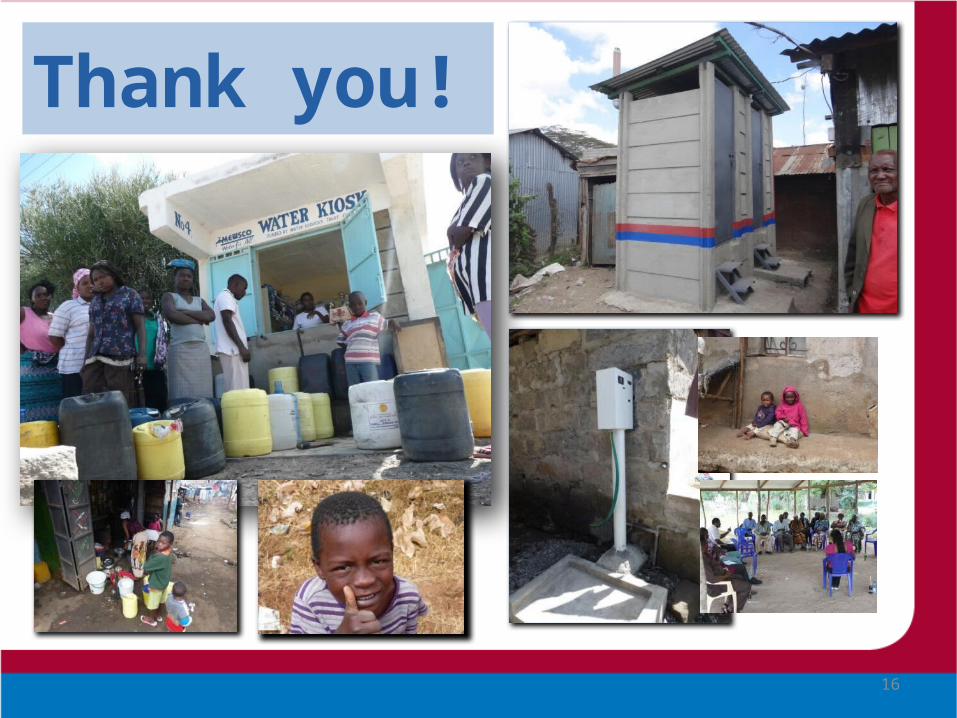
Thank you!
16