water resources of the yadkin-pee dee river basin, · pdf filewater resources of the...
TRANSCRIPT

Water Resources of the Yadkin-Pee Dee River Basin, North Carolina
GEOLOGICAL SURVEY WATER-SUPPLY PAPER 1415
Prepared in cooperation with Division of Water Resources, Inlets and Coastal Waterways, North Carolina Depart ment of Conservation and Development
Water Resources of the Yadkin-Pee Dee River Basin, North CarolinaBy R. E. FISH, H. E. LEGRAND and G. A. BILLINGSLEY
GEOLOGICAL SURVEY WATER-SUPPLY PAPER 1415
Prepared in cooperation with Division of Water Resources, Inlets and Coastal fPaterways, North Carolina Depart ment of Conservation and Development
UNITED STATES GOVERNMENT PRINTING OFFICE, WASHINGTON : 1951
UNITED STATES DEPARTMENT OF THE INTERIOR
FRED A. SEATON, Secretary
GEOLOGICAL SURVEY
Thomas B. Nolan, Director
For sale by the Superintendent of Documents, U. S. Government Printing Office Washington 25, D. C. - Price $1.00 (paper cover)
PREFACE
The report on the water resources of the Yadkin-Pee Dee River basin is one of a series of river basin reports describing the wa ter resources of North Carolina. When the contemplated series is completed, information for the entire State will be available to assist in the orderly planning and development of the water facil ities required for municipal and industrial expansion, and for the expansion of the uses pf water in agriculture.
This report was prepared by the U. S. Geological Survey, with the financial assistance of the Division of Water Resources, Inlets, and Coastal Waterways of the North Carolina Department of Con servation and Development. E. B. Rice, district engineer, Surface Water Branch, H. E. LeGrand, district geologist, Ground Water Branch, and G. A. Billingsley, district chemist, Quality of Water Branch were in charge of the project and many individuals in the Water Resources Division contributed to the collection, compila tion, and interpretation of data used in preparing this report.
Most of the data summarized in this report have been collected over a period of many years by the U. S. Geological Survey in cooperation with the North Carolina Department of Conservation and Development, the State Board of Health, and the Corps of En gineers, U. S. Army, Charleston, S. C. Other data and information presented in this report are based on data collected by, in co operation with, or are from technical reports, or publications of the U. S. Weather Bureau, North Carolina State Stream Sanitation Committee, and the North Carolina State Highway and Public Works Commission.
Ill


CONTENTS
Abstract................................. _ ........................................................ _ ................................ 1........................................................... 2........ .....»...~..............j..r..r.r.ir."^ 2................. ...................................^...[1^^ 2Topography ........ _ ................................ .. . . "" """"""""" """"" " " "" ^
Climate .................................................. J.1."1V.^ 4Agricultural and industrial development .......... ...«.....»...«..»rt.............^I!1.3/r.'."!Z! 4
Definition of terms .......................................................................M.......................[.[...[.".i., 7Occurrence and quality of water ......... _ ............ .......... ...............................................". 8
The hydrologic cycle ...................................................................................................... 8Sources of water ...................................................................................................i...^ _ ... 9Significance of quality of water ............................................................................... 10
Surface water ..................................................... _ ................................................................... 12Stream-gaging sites ...... ........................................................................................... _ ..... 12Flow characteristics.................................................................^.........................^............ 19
Duration of flow ........... _ ...................................................................................... 19Low-flow frequency ........................................................ .............................................. 30Maximum period of deficient discharge..................... _ ............................................. 42Storage requirements ................................................................................................ 45Flood frequencies ............................................................. .............................. _ ........... 51
Quality of surface waters................................................................................................... 59Ground water ......................................................................................................................... 71
Occurrence of ground water ......................................................................................... 71Geology........................... _ ........................ _ .................................................................... 74
Rocks of the Piedmont ......................................................................................... _ . _ 74Rocks of the Coastal Plain ............................................................................... _ ...... 75
Ground-water provinces ...... ......................................................................................... 76Crystalline-rock province............................................................................................... 77Slate province ............................................................................................................... 83Triassic province........................................................................................................ 83Cretaceous clay province ................ _ ............................................................ ........ 84Cretaceous sand province .......................................................................................... 84
Water levels ............ .. ......................_........................................................................ 85Public water-supply systems ............................................................................................. 88
Aberdeen, Moore County .................................................................................................. 88Albemarle, Stanly County .............._... ....... ......................... ........................................ 89Asheboro, Randolph County ............................................................................................ 89Badin, Stanly County ....................................................................................................... 89Biscoe, Montgomery County ........................................................................................... 89Bladenboro, Bladen County ........................................................................................... 94Boonville, Yadkin County ............................................................................................. 94Brunswick, Columbus County ........................................................................................ 94Candor, Montgomery County ....................................................................... ............. 94Chadbourn, Columbus ................................................................................................ 94China Grove, Rowan County ._.. .................. ............... ............................................ 94Clarkton, Bladen County .............................................................................. ............. 95Cleveland, Rowan County ........................................................................................... 95Concord, Cabarrus County ........................................................................................... 95Cooleemee, Davie County .......................................................................... .............. 95Denton, Davidson County ................................................................................................ 95Elkin, Surry County .................................................................................................... 96Ellerbe, Richmoad County ....................................................~.............. . 96
VI CONTENTS
Public water-supply systems ContinuedFair Bluff, Columbus County.......................................................................................... 96Fairmont, Robeson County...... ..............................................................."*"]'^."'""."""] 96Gibson, Scotland Coirnty.......................................................'^ %Hamlet, Richmond County ......................,..................................................................|""^ 97Huntersville, Mecklenburg County ......................................................"!!!!!"i"!"]."^"i!"]] 97Kannapolis, Cabarrus County .....................................................................]'.1.^""'"|'"^" 97Kernersville, Forsyth County ...............................................L'. ..!.'.'.!.".".""..'."!!'.!!!."!!!!!!!!! 97Landis, Rowan County...................................................................................................... 98Laurinbttrg, Scotland County........................................................................................... 98Lexington, Davidson County ................«...................................................']!!^]'^^'.i]."" 98Lilesville, Anson County .........................................................................,."..> ....'<'..^.*.'^" 98Lumberton, Robeson County............................................................................................ 99Maxton, Robeson County ._.................. ... .......................,........................................'....... 99Mocksville, Davie County................................................................................................ 99Monroe, Union County ...................................................................................................... 99Morven, Anson County................................................................................^^^^^ 100Mount Airy, Surry County ................................................................................................. 100Mount Gilead, Montgomery County.................................................................................. 100Mount Pleasant, Cabarrus County.......................................M...............................M.......... 100North Wilkesboro, Wilkes County ................................................................................... 101Norwood, Stanly County.................................................................................................... 101Oakboro, Stanly County ................................................................................................... 101Pembroke, Robeson County ........................................................................................... 101Pilot Mountain, Surry County.......................................................................................... 101Pinebluff, Moore County.................................................................................................... 102Red Springs, Robeson County.......................................................................................... 102Roberdell, Richmond County............................................................................................ 102Rockingham, Richmond County .................................................................................... 102Rockwell, Rowan County ................................................................................................. 102Rowland, Robeson County................................................................................................ 103Rural Hall, Forsyth County............................................................................................. 103Saint Pauls, Robeson County........................................................................................... 103Salisbury, Rowan County ................................................................................................. 103Spencer, Rowan County ................................................. ................................................. 103Star, Montgomery County.................................................................................................. 104Statesville, Iredell County................................................................................................ 104Tabor City, Columbus County.......................................................................................... 104Thomasville, Davidson County........................,....................................... ..................... 104Troutmans, Iredell County ................................................................................................ 104Troy, Montgomery County . ................................................. ................... ............... ..., 105Wadesboro, Anson County..................................................................................... ... 105Wagram, Scotland County.................................................................................................. 105Whiteville, Columbus County.......................................................................................... 105Wilkesboro, Wilkes County ............................................................................................. 105Winston-Salem, Forsyth County....................................................................................... 106Yadkinville, Yadkin County..........................................................-- .-. .....-. 106
Present water use................................................................................................................... 106Private industrial supplies...................................................................,.................... 107Public supplies ..................................................... .........................>«,"."...".....". . 107Rural domestic supplies.......................................... .. .... . 107Agricultural use................................................................................. ............................. 167Other uses................................................................................................................ . 108
Potential supply....................................................................."...-."-"."..."" j08Surface water........................................................... . .................................................... 108Ground water . ......... ......................... . ..... .. " """ *"9
Water laws........................................................................... . ................................. 110Selected bibliography................................................... . . Index. 113
CONTENTS VII
ILLUSTRATIONS
[All plates in pocket]
PagePlate 1. Isohyetal map of Yadkin-Pee Dee River basin showing mean annual
precipitation.2. Map of Yadkin-Pee Dee River basin showing location of stream-gaging
stations and quality-of-water sampling sites.3. Map of the Yadkin-Pee Dee River basin showing ground-water provinces.4. Hardness and dissolved-solids content of water from public supplies in
the Yadkin-Pee Dee River basin. Figure 1. Monthly and annual precipitation computed as the average of Lumberton,
Mount Airy, Rockingham, and Salisbury......................................................... 52. Maximum, minimum, and average air temperature at Lumberton, Mount
Airy, Rockingham, and Salisbury.................................................................... 63. Duration of records at gaging stations in the Yadkin-Pee Dee River basin,.. 134. Duration curve of daily flow, Yadkin River at Wilkesboro and Fisher
River near Copeland........^............................................................................... 205. Duration curve of daily flow, Yadkin River at Yadkin College........................ 216. Duration curve of daily flow, Rocky River near Norwood, Lumber River
at Boardman, and Waccamaw River at Freeland............................................. 227. Magnitude and frequency of annual.low flows, Yadkin River- at Wilkesboro.. 308. Magnitude and frequency of annual low flows, Fisher River near Copeland
and Rocky River near Norwood......................................................................... 319. Magnitude and frequency of annual low flows, Yadkin River at Yadkin
College ................................................................................................................ 3210. Magnitude and frequency of annual low flows, Lumber River at Boardman
and Waccamaw River at Freeland..................................................................... 3311. Maximum period of deficient discharge, Yadkin River at Wilkesboro............. 4512. Maximum period of deficient discharge, Fisher River near Copeland and
Rocky River near Norwood ................................................................................ 4613. Maximum period of deficient discharge, Lumber River at Boardman and
Waccamaw River at Freeland............................................................................ 4714. Storage requirements, Yadkin River at Wilkesboro............................................ 5015. Storage requirements, Fisher River near Copeland and Rocky River near
Norwood............................................................................................................... 5116. Storage requirements, Lumber River at Boardman and Waccamaw River
at Freeland.......................................................................................................... 5217. Flood-stage frequencies, Yadkin River at Wilkesboro...................................... 5918. Flood-stage frequencies, Yadkin River at Yadkin College ............................. 6019. Flood-stage frequencies, Rocky River near Norwood........................................ 6120. Flood-stage frequencies, Lumber River at Boardman and Waccamaw
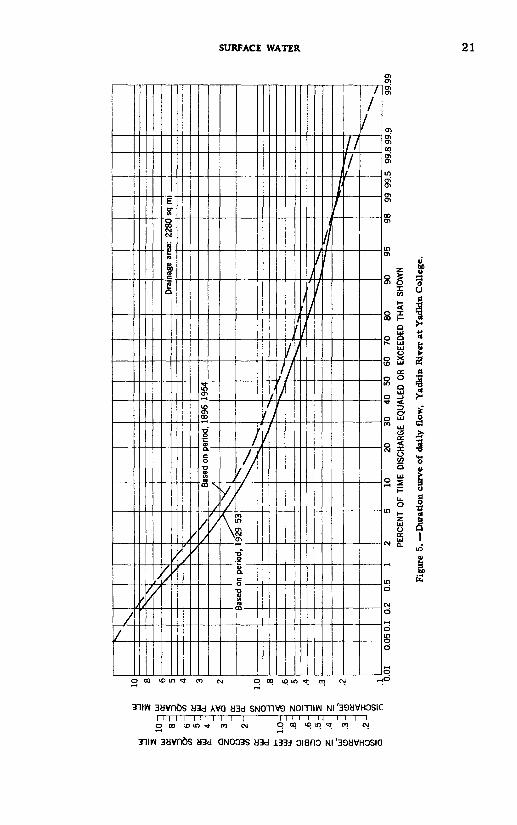
River at Freeland.................................................................................................. 6221. Average composition of dissolved solids in surface waters in the
Yadkin-Pee Dee River basin............................................................................. 6822. Relation of hardness to dissolved solids of surface waters in the
Yadkin-Pee Dee River basin............................................................................. 6923. Relation between streamflow and selected chemical and physical charac
teristics of Rocky River near Norwood, 1947-48.......................................... 7024. Relation between streamflow and suspended sediment in Yadkin River
at Yadkin College, 1952-53.............................................................................. 7225. Chemical character of selected ground waters in the Yadkin-Pee Dee
River basin.................................M......................................^............................... 7926. Cumulative frequency curves of yield of wells in the crystalline-rock
province .............................................................................................................. 8227. Graph showing water levels in two wells in the Yadkin-Pee Dee River
basin and precipitation at Salisbury ................................................................ 87
VIII CONTENTS
TABLES
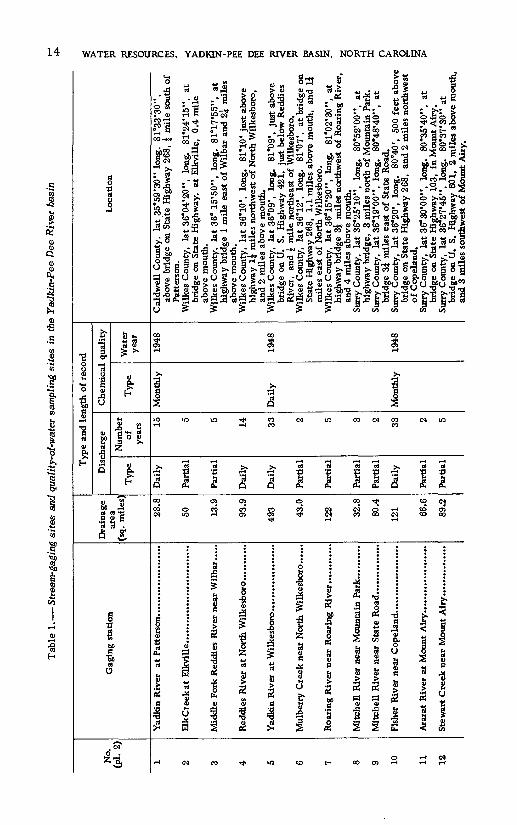
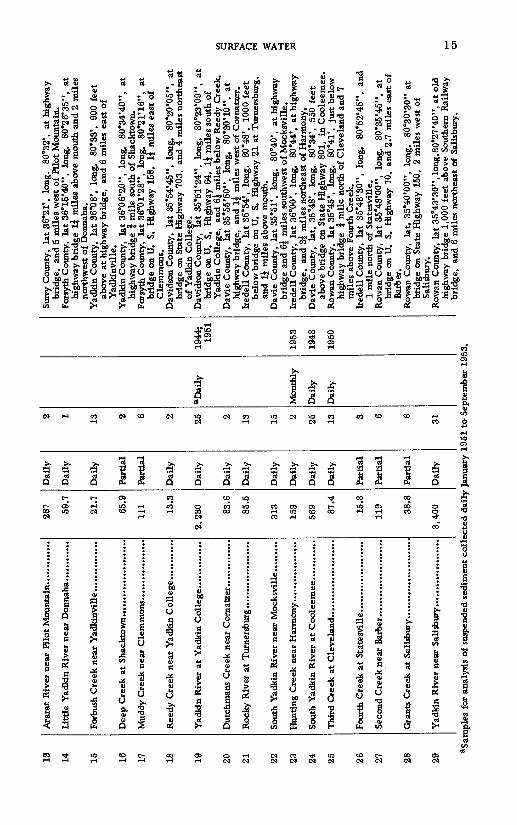
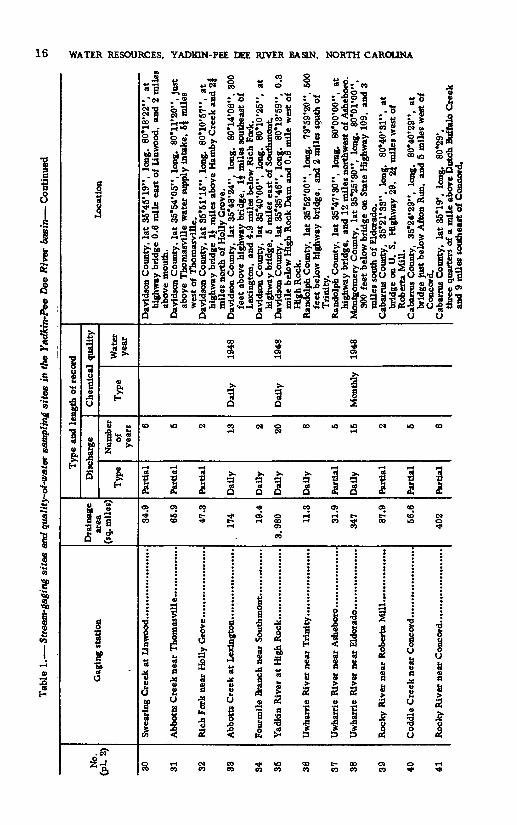
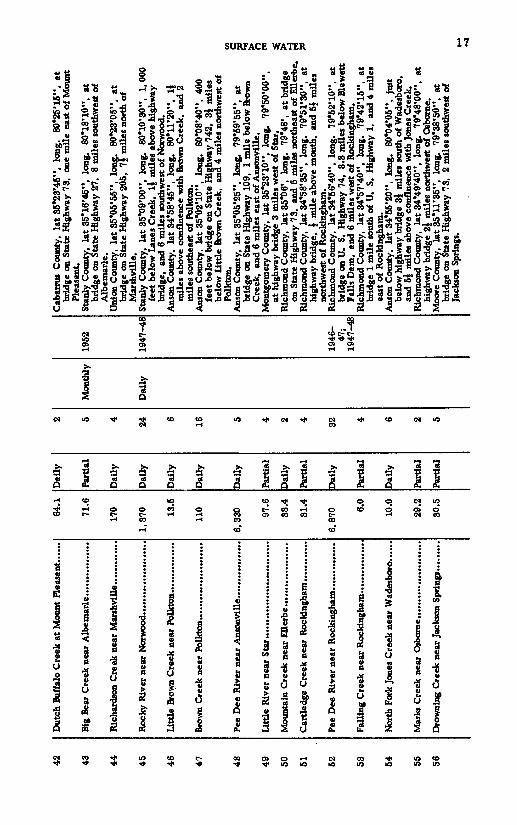
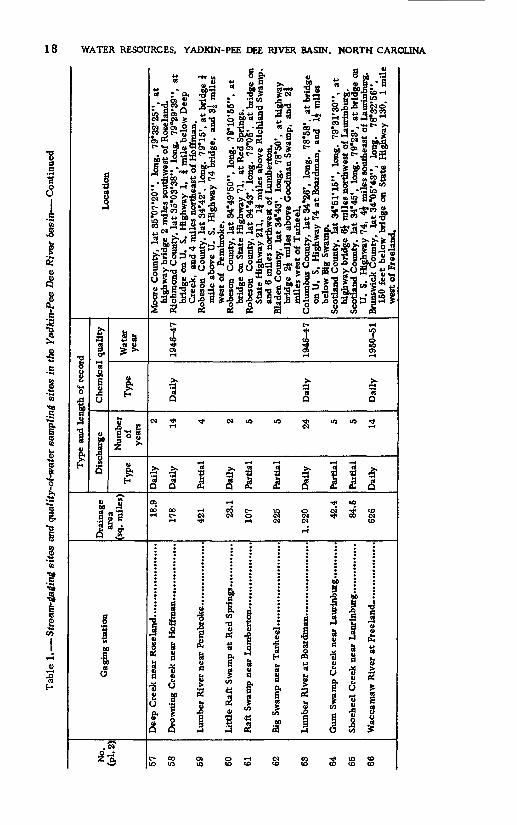
PageTable 1. Stream-gaging sites, and quality-of-water sampling sites in the Yadkin-Pee
Dee River basin.................................................................................................. .142. Duration table of daily flow in Yadkin-Pee Dee River basin.......................... 233. Magnitude and frequency of annual low flow in the Yadkin-Pee Dee River
basin..........^...^...............^.........,...................................................................... 344. Lowest average flow for 7 consecutive days in every year at gaging
stations in Yadkin-Pee Dee River basin......................................................... 435. Maximum number of days when discharge in the Yadkin-Pee Dee River
basin was less than that indicated.................................................................. 486. Storage requirements in the Yadkin-Pee Dee River basin................................ 537. Summary of chemical analyses of water from streams in the Yadkin-Pee
Dee River basin ................................................................................................... 638. Summary of analyses of ground waters in the Yadkin-Pee Dee River
basin...................................................................................................................... 789. Chemical analyses of water from public water supplies in the Yadkin-
Pee Dee River basin........................................................................................... 90

WATER RESOURCES OF THE YADKIN-PEE DEE RIVER BASIN
NORTH CAROLINA
By R. E. Fish, H. E. LeGrand, and G. A. Billingsley
ABSTRACT
Sufficient water is available in the basin of the Yadkin and Pee Dee Rivers to meet present requirements and those for many years to come if water use increases at about the present rate. Data presented in this report show that the average annual streamflow from approximately 82 percent of the basin area during the 25-year period, 1929-53, was about 6,200 mgd, representing essentially the total available water supply. Com parison of the available water supply to the estimated withdrawal use (excluding water power) of both surface and ground water of 600 mgd indicates the relative utilization of the water resources of the basin at present. If proper pollution controls are observed and practiced so that water in the various streams may be reused several times, the potential water available is even greater than indicated by the above comparison. Pre liminary studies indicate that the quantity of water now being withdrawn from ground- water reservoirs in the basin is only a fraction of the total that may be obtained from this source.
Twenty-eight of the 64 municipalities having public water-supply systems use surface water, however, as the largest cities in the area use surface supplies, about 85 percent of the water used for public supplies is from surface sources.
Of the 20 complete-record stream-gaging stations now in operation in this area 7 have been in operation for 24 years or longer. Periodic measurements of the rate of flow have been made at 31 additional sites on streams scattered widely over the basin. All avail able streamflow data including those for 1953 are summarized in either graphic or tabular form, or both. Because of the critically low flows occurring during the drought of 1954, several illustrations include data for 1954 and the early months of 1965 for comparison with the minima of previous years.
Adequate water for domestic use is avnilable from wells throughout the basin. The consolidated rocks of the Piedmont furnish water for small industries and for municipal ities whose population is less than about 1,500. The yields of wells in rock range from less than 1 gpm to as much as 200 gpm with local, rather than regional, geologic factors controlling the yield. The average municipal well in consolidated rocks yields about 30 gpm. In contrast, the sands of the Coastal Plain, in the eastern part of the basin, furnish as much as 500 gpm to individual wells, and ground-water conditions are gen erally similar throughout that region. A cumulative deficiency in rainfall from 1953 to 1955, has caused ground-water levels to fall below the seasonal averages, but the de cline is thought not to indicate a long-term trend. The most serious problem involving future use of ground water is the lack of knowledge of the characteristics of the ground- water provinces in the basin.
Generally the chemical quality of the surface waters in the Yadkin-Pee Dee River basin is good. They are low in mineral matter and soft, although some of the surface water contains excessive quantities of iron. In some local areas the streams have been polluted by municipal and industrial wastes. During periods of high runoff many of the streams transport large quantities of suspended sediment. Tributary streams in die lower eastern part of the basin are highly colored because of drainage from swampy areas.
1

2 WATER RESOURCES, YADKIN-PEE DEE RIVER BASIN, NORTH CAROLINA
Ground water from the consolidated rocks in the Piedmont region is more variable in quality than water from other areas in the basin. The dissolved solids in water from the consolidated rocks ranged from 26 to 1,480 ppm with a median of 109 ppm. Wells in the Cretaceous clay province normally yield slightly acid waters. The pll ranges from 4.7 to 7.7 with a median of 5.3. Generally ground water in this province is extremely soft and low in dissolved solids. Wells in the Cretaceous sand province yield a sodium bicarbonate type of water ranging in hardness from 2 to 130 ppm.
INTRODUCTION
Among the many factors that influence the economic growth of the Yadkin-Pee Dee River basin, none plays a more important role than water. A basic need of any region is adequate water supplies for municipal, industrial, rural domestic, agricultural, and other uses. These supplies must furnish not only a sufficient quantity of water but also water of satisfactory chemical and physical quality. The natural increase in population, the expansion of industrial fa cilities, and the demands on agricultural production, have focused attention on the need for accurate and continuing appraisals of the water resources of the basin. Such appraisals are prerequisite to plans for the development of the resources to meet the accelera ting demands for water.
PURPOSE
This report has been prepared to summarize and evaluate the data now available on the quantity and quality of both surface and ground waters in the part of the Yadkin-Pee Dee River basin that lies in North Carolina. It is hoped that the report will assist in the location, development, or expansion of municipal, industrial, agricultural, and other water supplies and, perhaps, be a guide for the future study of water resources in the area.
GEOGRAPHY
The basin of the Yadkin and Pee Dee Rivers trends southeast ward through west-central North Carolina. The Yadkin River rises along the eastern edge of the Blue Ridge in Caldwell, Watauga, and Wilkes Counties in North Carolina and flows northeastward for about 100 miles before turning southeastward near Winston-Salem. The Pee Dee River is formed by the confluence of the Yadkin and Uwharrie Rivers in the vicinity of Albemarle. The Pee Dee River continues southeastward through South Carolina before emptying into Winyah Bay and thence into the Atlantic Ocean near George town. The Waccamaw River, which also flows into Winyah Bay,

INTRODUCTION 3
drains a small area adjacent and to the east of the lower Pee Dee River basin. In this report the areas drained by the Yadkin, Pee Dee, and Waccamaw Rivers are treated as one basin and are called the Yadkin-Pee Dee River basin.
The length of the basin in North Carolina is about 235 miles and its width above the point where the Pee Dee River enters South Carolina averages about 65 miles. The Yadkin-Pee Dee River basin, as defined, drains a total area in North Carolina of 10, 650 square miles. Of this total, 1, 350 square miles are tributary to the Waccamaw River.
Slightly more than 1 million people live in the basin, or about 25 percent of the population of North Carolina. The only city with more than 100,000 people is Winston-Salem, although there are 64 municipalities large enough to have public water-supply sys tems. About 40 percent of the population is urban and about 60 percent rural.
TOPOGRAPHY
The Yadkin and Pee Dee Rivers flow over igneous and meta- morphic rocks of the Piedmont region before entering South Carolina. The streams of the southeastern part of the area covered by this report, including the parts of the Lumber and Waccamaw River basins lying in North Carolina, flow over sands and clays of the Coastal Plain.
The surface features in the Piedmont are directly or indirectly the result of the streams lowering their channels into the rocks for long periods of geologic time. This degrading by streams, coupled with the humid climate, has resulted in a close network of perennial streams, separated chiefly by well-drained, rolling up land areas. The rocks have been altered through physical and chemical processes, so that a moderately deep layer of reddish soil underlain by soft, decayed rock is characteristic of the up land areas. The streams, in most places, are bordered by flat bottom land, or flood plains.
In the western part of the Coastal Plain the topography is similar to that of the Piedmont region. Closely spaced perennial streams and intervening rounded hills are characteristic. However, a conspicuous mantle of coarse sand on the interstream areas has resulted in this region being known as the "Sand Hills. " Owing to the infertility of the surface sand, vegetation is sparse in the Sand Hills. Coastward from the Sand Hills, the upland surface is relatively flat and smooth. Stream channels are as much as 30 to 50 feet below the upland surface. Swampy terraces lie along
4 WATER RESOURCES. YADKIN-PEE DEE RIVER BASIN, NORTH CAROLINA
most of the streams, and are bordered by a low but pronounced scarp leading to the upland plain.
CLIMATE
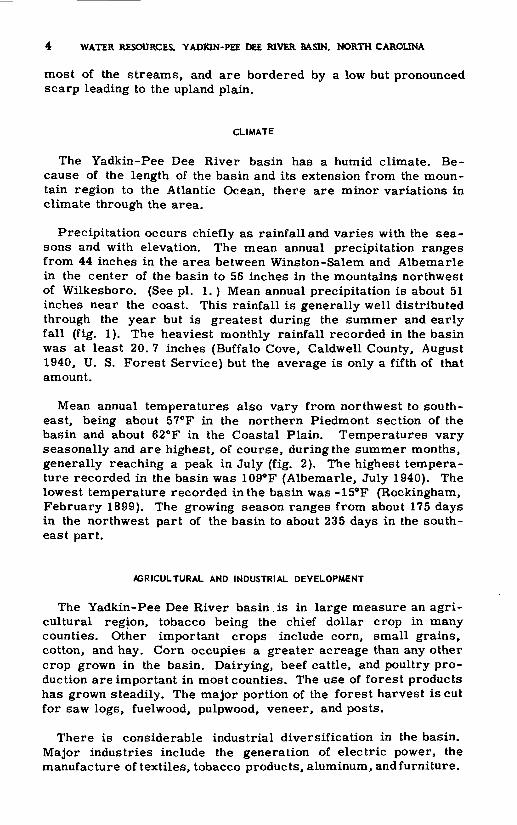
The Yadkin-Pee Dee River basin has a humid climate. Be cause of the length of the basin and its extension from the moun tain region to the Atlantic Ocean, there are minor variations in climate through the area.
Precipitation occurs chiefly as rainfall and varies with the sea sons and with elevation. The mean annual precipitation ranges from 44 inches in the area between Winston-Salem and Albemarle in the center of the basin to 56 inches in the mountains northwest of Wilkesboro. (See pi. 1. ) Mean annual precipitation is about 51 inches near the coast. This rainfall is generally well distributed through the year but is greatest during the summer and early fall (fig. 1). The heaviest monthly rainfall recorded in the basin was at least 20. 7 inches (Buffalo Cove, Caldwell County, August 1940, U. S. Forest Service) but the average is only a fifth of that amount.
Mean annual temperatures also vary from northwest to south east, being about 57°F in the northern Piedmont section of the basin and about 62°F in the Coastal Plain. Temperatures vary seasonally and are highest, of course, during the summer months, generally reaching a peak in July (fig. 2). The highest tempera ture recorded in the basin was 109°F (Albemarle, July 1940). The lowest temperature recorded in the basin was -15°F (Rockingham, February 1899). The growing season ranges from about 175 days in the northwest part of the basin to about 235 days in the south east part.
AGRICULTURAL AND INDUSTRIAL DEVELOPMENT
The Yadkin-Pee Dee River basin.is in large measure an agri cultural region, tobacco being the chief dollar crop in many counties. Other important crops include corn, small grains, cotton, and hay. Corn occupies a greater acreage than any other crop grown in the basin. Dairying, beef cattle, and poultry pro duction are important in most counties. The use of forest products has grown steadily. The major portion of the forest harvest is cut for saw logs, fuelwood, pulpwood, veneer, and posts.
There is considerable industrial diversification in the basin. Major industries include the generation of electric power, the manufacture of textiles, tobacco products, aluminum, and furniture.

INTRODUCTION
Figure 1. Monthly and annual precipitation computed as the average of Lunlberton, Mount Airy, Rocltingham, and Salisbury.
The manufacture of cigarettes and other tobacco products is con centrated at Wins ton-Salem, and aluminum is produced at Badin. Other industries include the processing of food and other agricul tural products.

WATER RESOURCES, YADJON-PEE DEE RIVER BASIN, NORTH CAROLINA
4 I I I I I t ITEMPERATURE AT ROCKINGHAM TEMPERATURE AT SALISBURY
Figure 2. Maximum, minimum, and average air temperature at Lumberton, Mount Airy, Rockingham, and Salisbury.
A great variety of minerals occurs in the basin, but only the production of sand and gravel and of dimension and crushed stone has been consistently important. Mining of granite is significant in the vicinity of Mount Airy and Salisbury. Production of sand and gravel is centered at Lilesville.
The many small towns and the several cities are important commercial centers. The usual commercial enterprises are well represented in the basin; one of the most important is that of buying and selling tobacco at the many warehouses and markets in the basin.
INTRODUCTION 7
Several railroads serve the area but the extensive network of all-weather roads has made trucking an important means of trans port. Airlines serve the area through ports at Hickory, Winston- Salem, Greensboro, Charlotte, Pinehurst, Fayetteville, and Wilmington.
DEFINITION OF TERMS
The records for quantities of water are expressed in various terms in the presentation of hydrologic data. Some of these terms have become associated with certain types of works and may be divided into two general groups: those that represent a rate of flow such as million gallons per day (mgd), gallons per minute (gpm), cubic feet per second (cfs), million gallons per day per square mile, and cubic feet per second per square mile, and those that represent volume of water, as million gallons, million gallons per square mile, and runoff depth in inches on the drainage basin.
The gallon is the volumetric unit commonly used in North Carolina in connection with pumping rates, storage for water supplies, and sprinkler-type irrigation systems, whereas the cubic foot is the volumetric unit generally used in connection with power generation and with flood flows.
The units in which hydrologic data are given in this report may be defined as follows:
A cubic foot per second is the rate of discharge equivalent to that of a stream whose channel is 1 square foot in cross-sectional area and whose average velocity is 1 foot per second.
A million gallons per day per square mile is defined as 1 million gallons of water per day flowing from each square mile of area drained, on the assumption that runoff is distributed uniformly as regards time and area.
Cubic feet per second per square mile is the average number of cubic feet of water per second flowing from each square mile of area drained, on the assumption that the runoff is distributed uniformly as regards time and area.

8 WATER RESOURCES. YADKIN-PEE DEE RIVER BASIN, NORTH CAROLINA
The water-year begins October 1 and ends September 30 and is the year for which most streamflow data are reported. The water- year is used in analysis and presentation of data on low flow in this report except that magnitude and frequency analyses of low flows are based on a climatic-year beginning April 1 and ending March 31.
One part per million (ppm) is a unit weight of a constituent in a million unit weights of water. In the chemical analysis of water samples, it is necessary to determine the presence of various substances usually found in minute amounts; therefore, the results are usually expressed in parts per million rather than in per centages. One part per million equals one ten-thousandth of one percent (0. 0001 percent).
The hydrogen-ion concentration in an aqueous solution or in water is represented on the pH scale by a number which is the negative logarithm of the hydrogen-ion concentration in moles per liter of solution. A solution having a pH value of 7. 0 is neutral that is, it is neither acid nor alkaline. Progressive pH values below 7. 0 denote increasing acidity, and progressive pH values above 7. 0 denote increasing alkalinity.
Specific conductance is a measure of the ability of a water to con duct an electrical current and is expressed in micromhos at a temperature of 25°C. It varies directly with the concentration and degree of ionization of the different minerals in solution and with the temperature. The conductance furnishes a rough measure of the mineral content of the water, it does not indicate the relative quantities of different salts in solution.
OCCURRENCE AND QUALITY OF WATER
THE HYDROLOGIC CYCLE
The water we use, whether it is from surface or ground water sources, has its origin in precipitation. In the natural sequence of events, the water that is evaporated from the ocean by the energy of the sun is carried inland as vapor, and falls on the land from clouds as rain, snow, sleet, or hail. Some of the precipi tation is returned to the atmosphere by evaporation and transpi ration but the remainder percolates into the soil or flows overland in surface streams. Much of the water that enters the soil is evaporated or transpired, and the remainder percolates downward to the water table and enters the zone of saturation where most of it moves laterally toward streams, maintaining their fair-weather flow. That water which moves beneath or upon the land surface
OCCURRENCE AND QUALITY OF WATER 9
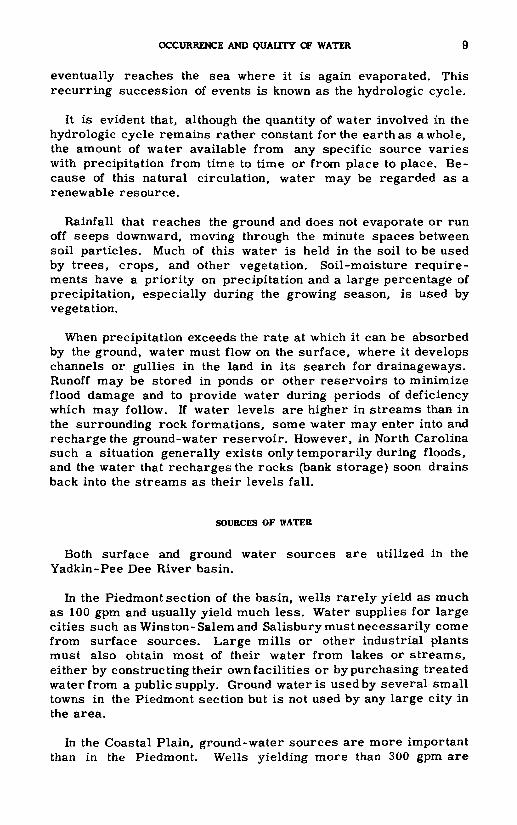
eventually reaches the sea where it is again evaporated. This recurring succession of events is known as the hydrologic cycle.
It is evident that, although the quantity of water involved in the hydrologic cycle remains rather constant for the earth as a whole, the amount of water available from any specific source varies with precipitation from time to time or from place to place. Be cause of this natural circulation, water may be regarded as a renewable resource.
Rainfall that reaches the ground and does not evaporate or run off seeps downward, moving through the minute spaces between soil particles. Much of this water is held in the soil to be used by trees, crops, and other vegetation. Soil-moisture require ments have a priority on precipitation and a large percentage of precipitation, especially during the growing season, is used by vegetation.
When precipitation exceeds the rate at which it can be absorbed by the ground, water must flow on the surface, where it develops channels or gullies in the land in its search for drainageways. Runoff may be stored in ponds or other reservoirs to minimize flood damage and to provide water during periods of deficiency which may follow. If water levels are higher in streams than in the surrounding rock formations, some water may enter into and recharge the ground-water reservoir. However, in North Carolina such a situation generally exists only temporarily during floods, and the water that recharges the rocks (bank storage) soon drains back into the streams as their levels fall.
SOURCES OF WATER
Both surface and ground water sources are utilized in the Yadkin-Pee Dee River basin.
In the Piedmont section of the basin, wells rarely yield as much as 100 gpm and usually yield much less. Water supplies for large cities such as Wins ton-Salem and Salisbury must necessarily come from surface sources. Large mills or other industrial plants must also obtain most of their water from lakes or streams, either by cons true ting their own facilities or by purchasing treated water from a public supply. Ground water is used by several small towns in the Piedmont section but is not used by any large city in the area.
In the Coastal Plain, ground-water sources are more important than in the Piedmont. Wells yielding more than 300 gpm are

10 WATER RESOURCES, YADKIN-PEE DEE RIVER BASIN, NORTH CAROLINA
common. Because of the low relief over much of the Coastal Plain, the construction of large dams for water supplies or other purposes is not generally feasible and only three public supplies, those for Lumberton, Laurinburg, and Hamlet, are obtained from surface water. Large supplies for public, industrial, and irrigation uses are available from ground-waters sources.
In general, large water supplies are obtained from surface sources in the Piedmont section and from wells in the Coastal Plain. Of the 64 cities and towns in the Yadkin-Pee Dee River basin that have public water supplies, 56 percent, serving 43, 000 persons, use ground water, while 44 percent, serving 329,000 persons, have surface-water sources. (Spe pi. 4. ) Ground water is used for domestic supplies by about 65 percent of the basin's population, including the rural population.
SIGNIFICANCE OF QUALITY OF WATER
An adequate water supply is a determining factor in the selection of an industrial site. Sharing importance with quantity is a knowl edge of the chemical quality, degree of pollution, and seasonal amount of suspended sediment carried by the stream.
Chemical analyses of water for municipal or industrial uses are necessary to determine whether the water is suitable for specific purposes, and, if not, to determine the type and cost of the treatment needed to make it satisfactory. The analyses aid in determining the suitability of the water for drinking, steam pro duction and heating, manufacturing, laundering, and other uses. Comprehensive analyses can also be used to determine the cost of softening water, its scale-forming properties, and its tendency to corrode plumbing.
The chemical requirements for water used by different in dustries are so variable that it is impossible to establish specifi cations to fit all uses. In general, however, most industries re quire clear water low in total mineral content and hardness. Wa ter temperature is also an important factor in determining the value of water for industrial use.
Generally accepted chemical specifications have been estab lished for waters used domestically. These chemical specifica tions are independent of any sanitary specifications established for protection of the public health. In 1946 the United States Public Health Service established chemical and physical specifications for drinking water used on interstate carriers as follows:
OCCURRENCE AND QUALITY OF WATER 11
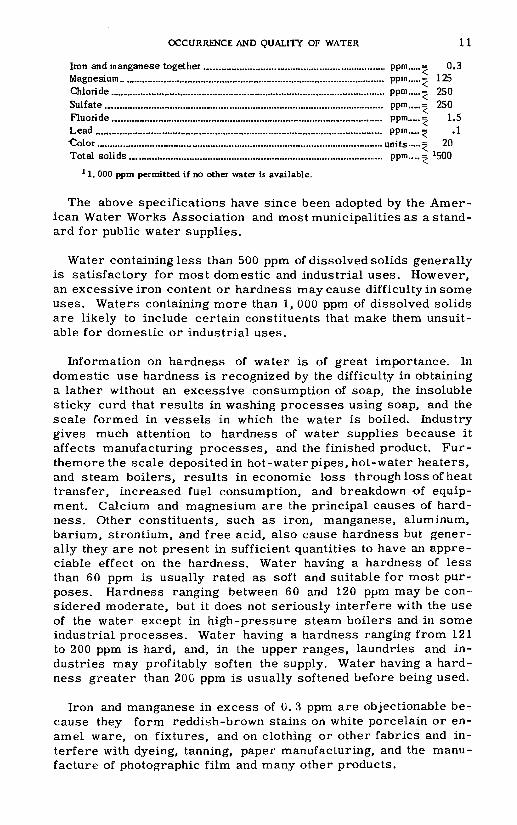
Iron and manganese together .................................................................... ppm.....= 0.3Magnesium.. ................................................................................................. ppm.....= 125Chloride ._....................................................,............................................... ppm..«.= 250Sulfate ......._..................................................... ....................................... ppm.....= 250Fluoride..................................................................................................... ppm..... = 1.5Lead ............................................................................................................ ppm._. =; .1"Color ............,............_........................................................ ....................... units ..^ 20Total solids .............................................................................................. ppm....= ^00
1 1, 000 ppm permitted if no other water is available.
The above specifications have since been adopted by the Amer ican Water Works Association and most municipalities as a stand ard for public water supplies.
Water containing less than 500 ppm of dissolved solids generally is satisfactory for most domestic and industrial uses. However, an excessive iron content or hardness may cause difficulty in some uses. Waters containing more than 1, 000 ppm of dissolved solids are likely to include certain constituents that make them unsuit able for domestic or industrial uses.
Information on hardness of water is of great importance. In domestic use hardness is recognized by the difficulty in obtaining a lather without an excessive consumption of soap, the insoluble sticky curd that results in washing processes using soap, and the scale formed in vessels in which the water is boiled. Industry gives much attention to hardness of water supplies because it affects manufacturing processes, and the finished product. Fur- themore the scale deposited in hot-water pipes, hot-water heaters, and steam boilers, results in economic loss through loss of heat transfer, increased fuel consumption, and breakdown of equip ment. Calcium and magnesium are the principal causes of hard ness. Other constituents, such as iron, manganese, aluminum, barium, strontium, and free acid, also cause hardness but gener ally they are not present in sufficient quantities to have an appre ciable effect on the hardness. Water having a hardness of less than 60 ppm is usually rated as soft and suitable for most pur poses. Hardness ranging between 60 and 120 ppm may be con sidered moderate, but it does not seriously interfere with the use of the water except in high-pressure steam boilers and in some industrial processes. Water having a hardness ranging from 121 to 200 ppm is hard, and, in the upper ranges, laundries and in dustries may profitably soften the supply. Water having a hard ness greater than 200 ppm is usually softened before being used.
Iron and manganese in excess of 0. 3 ppm are objectionable be cause they form reddish-brown stains on white porcelain or en amel ware, on fixtures, and on clothing or other fabrics and in terfere with dyeing, tanning, paper manufacturing, and the manu facture of photographic film and many other products.

12 WATER RESOURCES, YADKIN-PEE DEE RIVER BASIN, NORTH CAROLINA
Color, in water analysis, refers to the appearance of water that is free of suspended material. Generally waters are colored by organic matter leached from plants, tree roots, and organic com ponents of soils. Highly colored waters may foam in boilers and can stain processed products. It is more difficult to remove iron and to soften the water with hot phosphate solutions in highly col ored waters than in clear water. Also, color is objectionable in public water supplies for esthetic reasons.
SURFACE WATER
STREAM-GAGING SITES
Early use of the Yadkin-Pee Dee River and tributaries consisted of a few small water-powered gristmills. At present the streams still furnish power for operation of grist and sawmills and the ad ditional jobs of supplying water for generation of electric power, municipal and industrial use, recreation, and other purposes.
The rivers and creeks are valuable assets to the area, but at times they can be liabilities. On occasion streamflow was inade quate to meet the established requirements of many users in the ba sin, notably during the drought in 1954. At times floods have men aced extensive areas, for example, the upper Yadkin River valley in 1940.
Streamflow information consists of continuous records of flow at gaging stations on the rivers and smaller streams and periodic and occasional measurements of flow at other sites. At present 20 gaging stations are operated within the basin, some having been maintained since 1920. (See fig. 3.) The gaging station on Yadkin River near Salisbury was established in 1895, and was one of the earliest records in the State. This station was discontinued when the High Rock reservoir was filled in 1927. However, a gaging station on Yadkin River at Yadkin College draining an area of about two-thirds that at the Salisbury gage was established in 1928, and a relation between the low flow at the two sites has been established using the overlapping record for the station at High Rock. By use of this, relation and by use of relations with other stations during periods when neither the Yadkin College or Salisbury stations were operating, the low-flow characteristics of the Yadkin River at Yadkin College have been computed for the period 1896 to 1954.
On many small streams where continuous records of flow are not available, measurements of streamflow have been made during periods of Iow41ow to supply a more intense coverage of the area. Records of daily flow and results of miscellaneous measurements are published in annual Water-Supply Papers of the U. S. Geolog ical Survey. Gaging sites at which continuous records of flow are

SURFACE WATER 13
ndtti nos.
1
IP13M
18
20
2223 24 25
343536
4l
46 4748bO
54
bO
66
8 ' 8 S 2 -
Index number; to pi. 2
refer
Water years ending Sept. 30
§ m o m Q ir ^ *** S * ""
I
mmmm mmmi
i
i
i
i
mmmm
s §
HS mm
mmmm
\i
i
i
mmmmm
m
tmmmmi
t
mm
m> .
mt
mmmm
mmmm
mmmm
mm
mm
, Gaging station!
Yadkin River at PattersonReddies River at North Wilkesboro Yadkin River at Wilkesboro Fisher River near Copeland Ararat River near Pilot Mountain Little Yadkin River near Donnaha
Reedy Creek near Yadkin College
Dutchman Creak near Comatzer
South Yadkin River near Mocksvilte Hunting Creek near Harmony South Yadkin River at Cooleamea Third Creek at ClevelandYadkin River near Salisbury Abbotts Creek at Lexington Fourmile Branch near Southmont Yadkin River at High Rock Uwharrie River near Trinity
Dutch Buffalo Creek at Mount Pleasant Richardson Creek near Marshvilte
Little Brown Creek near Polkton
Pee Dee River near Ansonville Mountain Creek near Ellerbe
North Fork Jones Creek near Wadeaboro Deep Creek near Roseland
Little Raft Swamp at Red Springs
Waccamaw River at Freeland
Figure 3. Duration of records at gaging stations in the Yadkin-Pee Dee River basin.
not obtained are known as partial-record stations. Locations of complete-record gaging stations and partial-record stations are shown on plate 2 and pertinent descriptive data are given in table 1.
In evaluating and comparing the flow characteristic of streams, it is advantageous to have these characteristics computed for a common period of record, often called the base period.
In this report the period October 1, 1928 to September 30, 1953 (water years 1929 53) was selected as the base period. This base period was chosen because several records beginning in 1928 were available for use in a regional analysis, and because the records subsequent to September 30, 1953, had not been computed in final form at the time the report was being prepared. Some of the more noteworthy floods and droughts occurred during the base period, but on many streams the flow during the 1954 drought was lower than at any time during the base period. However, comparison with earlier records that are available at a few stations indicate that in general the average flow during the base period was less than during the period 1896 to 1954.
Tab
le 1
. S
trea
m-g
agin
g si
tes
and
qual
ity-
of-w
ater
sam
plin
g si
tes
in t
he Y
adki
n-P
ee D
ee R
iver
bas
in
No.
(p
l. 2
)
1 2 3 4 5 6 7 8 9 10 11
12
Gag
ing
stat
ion
Elk
Cre
ekat
Elk
viU
e.............................
Mid
dle
Fork
Red
dies
Riv
er n
ear
Wil
bar
.....
Yad
kin
Riv
er a
t W
ilke
sbor
o....
. ....... ..
....
..
Mul
berr
y C
reek
nea
r N
orth
Wil
kesb
oro.
.....
Dra
inag
e ar
ea
(sq.
mil
es]
28.8
50
13.9
93.9
493 43
.0
122 32
.8
80.4
121 66
.6
89.2
Typ
e an
d le
ngth
of
reco
rd
Dis
char
ge
Typ
e
Dai
ly
Par
tial
Par
tial
Dai
ly
Dai
ly
Par
tial
Par
tial
Par
tial
Par
tial
Dai
ly
Par
tial
Par
tial
Num
ber
of
year
s 15 5 5 14
33 2 5 3 2 33 2 5
Che
mic
al q
uali
ty
Typ
e
Mon
thly
Dai
ly
Mon
thly
Wat
er
year
1948
1948
1948
Loc
atio
n
Cal
dweU
Cou
nty,
la
t 35
°59'
30"
long
. 8
1'3
3'3
0",
ab
ove
brid
ge o
n S
tate
Hig
hway
268
, £
mil
e so
uth
of
Pat
ters
on.
Wilk
es C
ount
y,
lat
36°0
4'20
",
long
. 8r2
4*15",
at
br
idge
on
Sta
te H
ighw
ay,
at E
lkvi
lle,
0.
4 m
ile
abov
e m
outh
. W
ilke
s C
ount
y,
lat
36°
15'5
0",
lo
ng.
81'1
7I5
5",
at
hi
ghw
ay b
ridg
e 1
mil
e ea
st o
f W
ilba
r an
d 2?
mil
es
abov
e m
outh
. W
ilke
s C
ount
y,
lat
36°1
0',
long
. 81
010'
jus
t ab
ove
high
way
1?
mil
es n
orth
wes
t of
Nor
th W
ilke
sbor
o,
and
2 m
iles
abo
ve m
outh
. W
ilke
s C
ount
y,
lat
36°0
9',
long
. 81
*09'
, ju
st a
bove
br
idge
on
U.
S.
Hig
hway
421
, ju
st b
elow
Red
dies
R
iver
, an
d 2
mil
e no
rthe
ast
of W
ilke
sbor
o.
Wil
kes
Cou
nty,
la
t 3612' ,
long
. 81
'07
f, at
bri
dge
on
Sta
te H
ighw
ay 2
68,
1.1
mil
es a
bove
mou
th,
and
lj
mil
es e
ast
of N
orth
Wil
kesb
oro.
W
ilke
s C
ount
y,
lat
36°1
5'20
",
long
. 81
°02'
30",
at
hi
ghw
ay b
ridg
e 85
mil
es n
orth
wes
t of
Roa
ring
Riv
er,
and
4 m
iles
abo
ve m
outh
. Su
rry
Cou
nty,
la
t 36
*25'
10",
lo
ng.
80°5
2tO
O",
at
hi
ghw
ay b
ridg
e,
3 m
iles
nor
th o
f M
ount
ain
Park
. Su
rry
Cou
nty,
la
t 36
°19'
00lt
, lo
ng.
80*4
8'40
",
at
brid
ge 3
? m
iles
eas
t of
Sta
te R
oad.
Su
rry
Cou
nty,
la
t 36
020'
, lo
ng.
80°4
0',
500
feet
abo
ve
brid
ge o
n S
tate
Hig
hway
268
, an
d 2
mil
es n
orth
wes
t of
Cop
elan
d.
Surr
y C
ount
y,
lat
36°3
0'00
",
long
. 80
*35*
40",
at
br
idge
on
Sta
te H
ighw
ay 1
03,
in M
ount
Air
y.
Surr
y C
ount
y,
lat
36*2
7*45
",
long
. 80
°37'
30"
at
brid
ge o
n U
. S.
H
ighw
ay 6
01,
2 m
iles
abo
ve m
outh
, an
d 3
mil
es s
outh
wes
t of
Mou
nt A
iry.
iq 14 15 16 17 18 19 20 21 22 23 94.
25 26 97 28 29
Lit
tle
Yad
kin
Riv
er n
ear
Don
naha
. ...........
287 59
.7
9-1
7
65.9
111 13
.3
2,28
0 83.6
85.5
313
153
569 87
.4
15.8
11
9 38.8
3,40
0
Dai
ly
Dai
ly
Dai
ly
Par
tial
Par
tial
Dai
ly
Dai
ly
Dai
ly
Dai
ly
Dai
ly
Dai
ly
Dai
ly
Pa
i*1-
i a 1
Par
tial
Part
1! 3
1
Dai
ly
2 1 13 2 6 2 25 2 13 15 2 25 13 3 6 6
31
aDai
ly
Dai
ly
Dai
ly
1944
;19
51
1953
104.
0
1950
aSam
ples
for
ana
lysi
s of
sus
pend
ed s
edim
ent
coll
ecte
d d
aily
Jan
uary
195
1 to
- S
epte
mbe
r 19
53.
Surr
y C
ount
y, la
t 3
6°2
r,
long
. 80
°32'
, at
hig
hway
brid
ge,
and
5 m
iles
wes
t of
Pil
ot M
ount
ain.
Fo
rsyt
h C
ount
y, la
t 36
°15'
40",
lo
ng.
80*2
6*35
",
athi
ghw
ay b
ridg
e li
mil
es a
bove
mou
th a
nd 2
mil
esno
rthw
est
of D
onna
ha.
Yad
kin
Cou
nty,
la
t 36
°08'
, lo
ng.
80°3
3*,
900
feet
abov
e at
hig
hway
bri
dge,
an
d 6
mil
es e
ast
ofY
adki
nvil
le.
Yad
kin
Cou
nty,
la
t se
'Oe^
O",
lon
g.
80°3
414
0",
at
high
way
bri
dge
f m
ile
sout
h of
Sha
ckto
wn.
Fo
rsyt
h C
ount
y, la
t 36
°01'
28M
, lo
ng.
80°2
1'16
",
atbr
idge
on
U.
S.
Hig
hway
158
, if
mil
es e
ast
ofC
lem
mon
s.
Dav
idso
n C
ount
y,
lat
35"5
4t4
5",
lo
ng.
8002
0'0
5",
at
brid
ge o
n S
tate
Hig
hway
703
, an
d 4
mil
es n
orth
east
of Y
adki
n C
olle
ge.
Dav
idso
n C
ount
y, la
t 35
°51'
24",
lo
ng.
80°2
3'09
", at
brid
ge o
n U
. S.
H
ighw
ay 6
4, li
mil
es s
outh
of
Yad
kin
Col
lege
, an
d 6j
mil
es b
elow
Ree
dy C
reek
. D
avie
Cou
nty,
la
t 35
055'5
0",
lo
ng.
80°3
0'10
", at
high
way
bri
dge,
an
d li
mil
es w
est
of C
orna
tzer
. Ir
edel
l C
ount
y, la
t 35
"54t
, lo
ng.
80°4
8',
1000
fee
tbe
low
bri
dge
on U
. S.
H
ighw
ay 2
1 at
Tur
ners
burg
,an
d l£
mil
es a
bove
mou
th.
Dav
ie C
ount
y, l
at 3
5°51
', lo
ng.
80°4
0',
at h
ighw
aybr
idge
and
6|
mil
es s
outh
wes
t of
Moc
ksvi
lle.
Ir
edel
l C
ount
y,
lat
3600
0',
long
. 80
°44'
, at
hig
hway
brid
ge,
and
3i
mil
es n
orth
east
of
Har
mon
y.
Dav
ie C
ount
y,
lat.
35°
48',
long
. 80
034'
, 55
0 fe
etab
ove
brid
ge o
n S
tate
Hig
hway
801
, in
Coo
leem
ee.
Row
an C
ount
y,
lat
35°4
5',
long
. 80
°41'
, ju
st b
elow
high
way
bri
dge
f m
ile
nort
h of
Cle
vela
nd a
nd 7
mil
es a
bove
Fou
rth
Cre
ek.
Ired
ell
Cou
nty,
lat
35°
48f3
0ff,
lo
ng.
80°5
2'45
",
and
1 m
ile
nort
h of
Sta
tesv
ille
. R
owan
Cou
nty,
la
t 35
°43'
00",
lo
ng.
80"3
5f4
5",
at
brid
ge o
n U
. S.
H
ighw
ay 7
0,
and
2.7
mil
es e
ast
ofB
arbe
r.
Row
an C
ount
y,
lat.
35°
40'0
0",
long
. 80
"30'
30ft
atbr
idge
on
Sta
te H
ighw
ay 1
50,
2 m
iles
wes
t of
Sal
isbu
ry.
Row
an C
ount
y, l
at 3
5043
*30
M, I
ong.
80d2
7'4
0",
at
old
high
way
bri
dge
1,00
0 fe
et a
bove
Sou
ther
n R
ailw
aybr
idge
, an
d 6
mil
es n
orth
east
of
Sal
isbu
ry.
16 WATER RESOURCES, YADWN-PEE DEE RIVER BASIN, NORTH CAROLINA
J1
IQ
t
&H
t rS J« . I I
> 21 -»
i «I f
<# 10
fr a
3 3
2 I
! i
42
43 44 45 46 47 48 AQ 50 51 52 53 54 55 56
Dut
ch B
uffa
lo C
reek
at
Mou
nt P
leas
ant.
.....
Ric
hard
son
Cre
ek n
ear
Mar
shvi
lle.
... ..
.......
64.1
71.6
170
1<n
fl 13.5
110
6,33
0 Q-7
ft
33.4
31.4
6,87
0 6.0
10.0
OQ
9
30.5
Dai
ly
Par
tial
Dai
ly
Dai
ly
Dai
ly
Dai
ly
Dai
ly
Par
tial
Dai
ly
Par
tial
Dai
ly
Par
tial
Dai
ly
Par
tial
2 5 4 24 6 16 4 2 4 32 4 6 2 5
Mon
thly
Dai
ly
1952
1947
-48
1946
- 47
;19
47-4
8
Cab
arru
s C
ount
y,
lat
35*2
3*45
'', l
ong.
80
*25'
16",
at
brid
ge o
n St
ate
Hig
hway
73,
on
e m
ile
east
of
Mou
ntPl
easa
nt.
Stan
ly C
ount
y, la
t 35
*16'
45",
lo
ng.
80*1
8'10
",
atbr
idge
on
Sta
te H
ighw
ay 2
7,
8 m
iles
sou
thw
est
ofA
lbem
arle
. U
nion
Cou
nty,
lat
35*
05'5
5",
long
. 80
*23'
05",
at
brid
ge o
n S
tate
Hig
hway
205
, 7$
mil
es n
orth
of
Mar
shvi
Ue.
St
anly
Cou
nty,
la
t 35
*09'
00",
lo
ng.
80*1
0'30
",
1,00
0fe
et b
elow
Lan
es C
reek
, l£
mil
es a
bove
hig
hway
brid
ge,
and
6 m
iles
sou
thw
est
of N
orw
ood.
A
nson
Cou
nty,
la
t 34
*58*
45",
lon
g.
80*1
1*20
",
1$m
iles
abo
ve c
onfl
uenc
e w
ith B
row
n C
reek
, an
d 2
mil
es s
outh
east
of
Pblk
ton.
A
nson
Cou
nty,
la
t 35
*02'
10",
lo
ng.
80 0
8*40
",
400
feet
bel
ow b
ridg
e on
Sta
te H
ighw
ay 7
42,
3i m
iles
belo
w L
ittl
e B
row
n C
reek
, an
d 4
mil
es n
orth
wes
t of
Polk
ton.
A
nson
Cou
nty,
lat
35*
05*2
5",
long
. 79
*59*
55",
at
brid
ge o
n St
ate
Hig
hway
109
, 1
mil
e be
low
Bro
wn
Cre
ek,
and
6 m
iles
eas
t of
Ans
onvi
lle.
Mon
tgom
ery
Cou
nty,
la
t 35
*23*
10",
lo
ng.
79*5
0*00
",at
hig
hway
bri
dge
3 m
iles
wes
t of
Sta
r.
Ric
hmon
d C
ount
y,
lat
35*0
6*,
long
. 79
*48'
, at
bri
dge
on S
tate
Hig
hway
73,
an
d 5
mil
es n
orth
east
of
Elle
rbe.
R
ichm
ond
Cou
nty,
la
t 34
*58'
35",
lo
ng.
79*5
1'30
",
athi
ghw
ay b
ridg
e, i
,mil
e ab
ove
mou
th,
and
5$ m
iles
nort
hwes
t of
Roc
king
ham
. R
ichm
ond
Cou
nty,
la
t 34
*56'
40",
lon
g.
79*5
2'10
",
atbr
idge
on
U.
S.
Hig
hway
74,
3.
3 m
iles
bel
ow B
lew
ett
Falls
Dam
, an
d 6
mil
es w
est
of R
ocki
ngha
m.
Ric
hmon
d C
ount
y,
lat
34*5
7'40
",
long
. 79
*42*
15",
at
brid
ge 1
mil
e so
uth
of U
. S.
Hig
hway
1,
and
4 m
iles
east
of
Roc
king
ham
. A
nson
Cou
nty,
la
t 34
'55'
20",
lo
ng.
80*0
4'05
", j
ust
belo
w h
ighw
ay b
ridg
e 3i
mil
es s
outh
of
Wad
esbo
ro,
and
5i m
iles
abo
ve c
onfl
uenc
e w
ith J
ones
Cre
ek.
Ric
hmon
d C
ount
y,
lat
34*4
9*40
", l
ong.
79
*48'
00",
at
high
way
bri
dge
2i m
iles
nor
thw
est
of O
sbor
ne.
Moo
re C
ount
y, la
t 35
*11'
35",
lo
ng.
79*3
8'50
",
atbr
idge
on
Stat
e H
ighw
ay 7
3,
2 m
iles
sou
thw
est
ofJa
ckso
n Sp
ring
s.
18 WATER RESOURCES, YADKIN-PEE DEE RIVER BASIN, NORTH CAROLINA
bit
;-, o co SJ.rt T c~.S«-* o ton . « - * IQ § 8 .°S-|§* S^S 8 ^.-^ ^ 5sS^?§Fl!l«| ili'i!!^? 5|5*«jS'aaals .s's|'srii2 ll'S'a2-iaTrS?'a SU V4 n *M pH {/) P-Q rH MH FH !» "Jj ** B 5 e
J ^i^lfiff!%ftJftfiffgao.
Q Q

SURFACE WATER 19
The Yadkin-Pee Dee River basin is one of the more highly in dustrialized areas of the State. The flow of many of the streams is considerably affected by the artificial controls of man in sup plying municipal and industrial requirements. The flow of the Yadkin and Pee Dee Rivers is regulated by the operation of hydro electric plants at Idols, High Rock, Narrows, .Falls, Tillery, and Blewett Falls dams. Tributary streamflows are regulated by water- power plants on Reddies, Elkin, Ararat, South Yadkin, Uwharrie, and Little Rivers and some smaller streams. Streamflow is di verted locally for water supplies at many places.
FLOW CHARACTERISTICS
Streamflow varies greatly from day to day, season to season, and from year to year. (See fig. 23. ) The long-term average Streamflow varies considerably from place to place within the ba sin but is relatively constant for a particular area. A study of Streamflow records indicates that runoff during individual years or during a succession of several years may deviate sharply from the long-term average, but the records show that this is the usual pattern of occurrence in long periods of time. In the Yadkin-Pee Dee River basin the average annual Streamflow varies from ap proximately 0. 5 mgd per square mile in some areas to as much as 1. 0 mgd per square mile in other areas. This variation in av erage Streamflow reflects differences in rainfall, topography, geol ogy, vegetation, size of drainage area, and other factors.
Curves showing Streamflow characteristics are sometimes pre pared for the period of record for each station. However, through regional analysis, curves for short-term stations can be adjusted to longer periods and curves for long-term stations can be com pared with each other and modified on the basis of the experience at surrounding gaging stations. These adjusted and modified curves, although not a completely accurate record of recorded flows, serve as a better basis for predicting the probable occur rence of future flows than the actual record. Regional analysis of the low-flow data was used in this report to adjust all records to the base period October 1, 1928 to September 30, 1953.
DURATION OF FLOW
The flow-duration curve shows the percentage of time during which a specific daily discharge was equaled or exceeded during the period of record. Flow-duration curves for six representative gaging stations in the basin are given in figure 4 6. Flow-duration data and average discharge for all gaged sites are given for the period 1929-53 in table 2. Although the flows of some streams

to o
s £10-
,
ui
5-
2 8 3
Ul
V) K.
2
"-1.0
- o
m
.8 .5. .3
>
DISCHARGE,
IN
MILLION
GALLONS
PER DAY
PER SQUA
RE MIL
E oi^
is»
to
'*.
<><
bt
be o M u> *. oiooo
"V Y
N\^
\ \ >
y
> Y« \ \
\ .X >»
^ V \ \ \\_ l>^ -«
.
^v
^v
\ad
kin
Riv
er a
t W
ilkes
boro
. D
rain
age
area
: 49
3 sq
mi~
~F
isli D
vN
er R
iver
r
rain
age
a
^
Bf
tear
Co
rea:
V
^*~
*
ised
orpe
lan
Isq " >.
,
perio
1 ni ~^^
d, 1
9
Base
h^
"^«^
19-5
:d on
~«^ ^^ ///
Exa
mi
jerio
d,
h^.^
/ "^
.^'
>le
: T
he d
aily
fl
\
equa
l to
o jy
x \N
L929
-53
\ \ \\ \
^" "*
^^
\"
^^"-
*^^
^^i.
uare
mi
\\
\\
_^
^^.
jw m
ay
r gr
eate
r e
for
98
\ \\ \\ \
\
^^W
J ^^
^-^
.x e
xp
than
5
pen
\«-~
."X
i_
ecte
d 0.
25
cent
o
to b
e m
gd p
er
f the
tim
e-'
-
^^_
*^
_ -^.
01
0.05
0.1
0.
2 0.
5 1
2 5
10
20
30
40
50
60
70
80
90
95
98
99
99.5
99
.8 9
9.
PE
RC
EN
T
OF
TIM
E
DIS
CH
AR
GE
E
QU
ALE
D
OR
E
XC
EE
DE
D
TH
AT
S
HO
WN
Figu
re 4
. D
ura
tio
n c
urve
of
dail
y fl
ow,
Yad
kin
Riv
er a
t W
ilkes
boro
and
Fis
her
Riv
er n
ear
Cop
elan
d.
.8-
o
-§
.6-
O
.5;
Z
.4-
in 8 6 5 4 3 2
1.0 .8 .6
.5
.4 .3
.2 "I
V\
t
>v\j X
3ase
d
*v Xs
^V
an p
e
'V . %
\^ * s
riod,
'
^ >, \ \ N
^
92
9-5
3
BV
/
\<^
ased
on
f
^x
lerio
d,
^^
^^
"^ ^
^^^^
L896
-
»^_
__i19
54
*» -^
»«^
_
^"*
1^.
^^*««
^^^^^
^^^^
Dra
^^^_
^"^
^_
>^^-^
nage
are
a: 2
280
sq m
^
--""
""^-^-^
"^
-*
"^^^
01
0.05
0.1
0.2
0.5
1 2
5 10
20
30
40
50
60
70
80
90
95
98
99
99
.5
99
.89
9.9
99
.99
PER
CEN
T O
F TI
ME
DIS
CH
ARG
E EQ
UAL
ED O
R
EXC
EED
ED T
HA
T SH
OW
N
Figu
re 5
. D
ura
tio
n c
urve
of
dail
y fl
ow,
Yad
kin
Riv
er a
t Y
adki
n C
olle
ge.

22 WATER RESOURCES, YADKIN-PEE DEE RIVER BASIN, NORTH CAROLINA
1 -.08-
* .04-
.01 -
.008-
.006-
.006
.004
.003
.002-
.001 0008
20
10
8
6 5 4
3
2
1.0
| .1i *c .3
> .2
1 > .1
I M
*Si -03
E .02
.006
.006
.004
.008
.002
.001
0008
0006 .0005 .0004
0003 0
<,\
01 OS.
~^
60 i a
^-
2 0.
s
5 1
\
;
\\
^^^
l
\ "X
0 2
^\^*
s.\
0 3
^
\
0 4
s
\
Z^;
0 51
v
) a
\
^
) 7(
\
V
) «
=^:
X\ ^ v
- V
91
\
H y
Drain B«sec
R
Wacean
\-
\
i 3
"%'»
"&
BKK
nawf
-A
8 9
e»: 1 mod
liver ^'
rvera !rtod.
t^-
\,
3 99.
220*va^-
~__
warN TO: 1 Kriod
itFroet 1929-
\
5 99.
tf*
Hwa 170 929
and, 53
^
89"
~ *
Dd. %-
S
.9 99
PERCENT OF TIME DISCHARGE EQUALED OR EXCEEDED THAT SHOWN
Figure 6. Duration curve of daily flow, Rocky River near Norwood, Lumber River at Boardman, and Waccamaw River at Freeland.
listed in this table are affected by regulation or diversion, the effect is not appreciable except for those streams (marked by an asterisk) for which data is applicable only at the gaging station site and are given in million gallons per day.
A flow-duration curve shows the cumulative frequency of occur rence of different rates of daily flow at a given point. Assuming that future flow will follow the pattern of that measured in the past, the flow-duration curve may be used to estimate the probable occurrence of a specified discharge. In planning dams, reservoirs and other works to develop streamflow, however, this assumption must be made with the knowledge that possible errors may result. For example, figure 5 illustrates how the flow-duration data for the base period on Yadkin River at Yadkin College compares with that for the period October 1, 1895 to September 30, 1954. At this station the duration curve for the base period shows about a 20 percent lower discharge between 5 and 95 percent duration, and

SURFACE WATER 23
Table 2. Duration table of daily flow in Yadkin-Pee Dee River basin, 1929-53
[Data for stations 24, 30, 32, 35, 41, 45, 48 and 52 (marked by asterisks, *) are applicable only at gaging station sites and are in million gallon per day]
Drainage area sq miles..
Percent of time: 0.1... .......... ..0.5...............2. ................5. ................10................20................30 .............. ..50 ............. ...70 ................80................90. ............. ..95................98................99 ........ ........99.5..............99.8..............99.9..............
Drainage area sq miles..
Percent of time:o.i...............0.5. ............ ..2..................5..................10................20................30................50 ............ ....70 .............. ..80. ...............90 ................95................98................99................99.5..............99.8..............99.9..............
Flow, in million gallons per day per square mile, that was equaled or exceeded at indicated gaging stations
1. Yadkin River at Patterson
28.8
1.05
15.5 7.09 3.47 2.27 1.66 1.20
.999
.729
.559
.460
.393
.330
.280
.260
.244
.227
.217
2. Elk Creek at Elkville
50.0
1.0
1.66 1.19
.995
.700
.519
.425
.360
.300
.250
.235
.212
.201
.195
3. Middle Fork Reddies River near Wilbar
13.9
1.4
2.95 2.15 1.65 1.50 1.09
.860
.740
.609
.515
.455
.409
.385
.365
.335
4. Reddies River at North Wilkesboro
93.9
0.977
22.6 6.43 3.13 2.03 1.48 1.13 1.02
.743
.595
.519
.494
.396
.347
.320
.306
.279
.272
5. Yadkin River at Wilkesboro
493
1.03
12.1 6.55 3.44 2.12 1.56 1.15
.969
.747
.587
.517
.431
.373
.322
.299
.280
.262
.252
6. Mulberry Creek near North Wilkesboro
43.0
1.1
1.65 1.25 1.14
.840
.670
.600
.500
.445
.390
.360
.345
.310
.305
Flow, in million gallons per day per square mile, that was equaled or exceeded at indicated gaging stations
7. Roaring River near Roaring River
122
0.96
2.03 1.45 1.13 1.02
.745
.595
.519
.425
.372
.315
.290
.275
.245
.239
8. MitcheU River near Mountain Park
32.8
1.0
1.55 1.20 1.10
.810
.650
.590
.495
.445
.385
.360
.345
.315
.305
9. MitcheU River near State Road
80.4
1.1
1.55 1.22 1.05
.815
.605
.595
.495
.435
.375
.355
.345
.305
.302
10. Fisher River near Copeland
121
0.983
26.9 7.45 3.47 2.22 1.63 1.15
.935
.694
.534
.460
.375
.318
.264
.232
.211
.188
.174
11. Ararat River at Mount Airy
66.6
0.87
1.05 .825 .615 .475 .420 .335 .285 .235 .208 .190 .165 .155
12. Stewart Creek near Mount Airy
89.2
0.89
2.05 1.50 1.05
.845
.630
.495
.430
.355
.305
.255
.235
.211
.190
.178
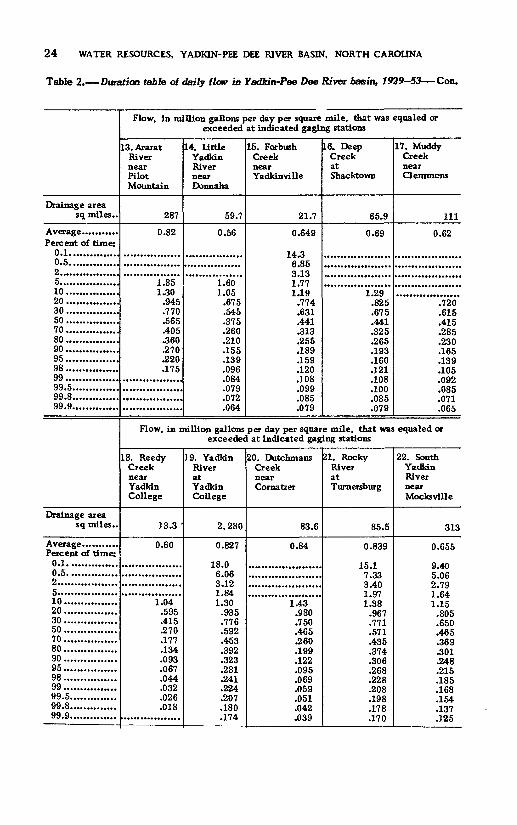
24 WATER RESOURCES, YADKIN-PEE DEE RIVER BASIN, NORTH CAROLINA
Table 2. Duration table of daily flow in Yadkin-Pee Dee River basin, 1929-53 Con.
Drainage area sq miles..
Percent of time: 0.1...............0.5...............2..................5..................10................20 ................30................50 ................70................80................90................95................98................99................99.5..............99.8..............99.9..............
Drainage area sq miles..
Percent of time: 0.1. ..............0.5...............2..................5.......... ....... .10................20................30................50................70................80................90................95................98................99................99.5..............99.8..............99.9..............
Flow, in million gallons per day per square mile, that was equaled or exceeded at indicated gaging stations
13. Ararat River near Pilot Mountain
287
0.82
1.85 1.30
.945
.770
.565
.405
.360
.270
.220
.175
14. Little Yadkin River near Donnaha
59.7
0.56
1.60 1.05
.675
.545
.375
.260
.210
.155
.139
.096
.084
.079
.072
.064
15. Forbush Creek near Yadkhwille
21.7
0.649
14.3 6.85 3.13 1.77 1.19
.774
.631
.441
.313
.255
.189
.159 .120 .108 .099 .085 .079
16. Deep Creek at Shacktown
65.9
0.69
1.29 .825 .675 .441 .325 .265 .193 .160 .121 .108 .100 .085 .079
17. Muddy Creek near Clemmcns
111
0.62
.720
.615
.415
.285
.230
.165
.139
.105
.092
.085
.071
.065
Flow, in million gallons per day per square mile, that was equaled or exceeded at indicated gaging stations
18. Reedy Creek near Yadkin College
13.3 '
0.60
1.04 .595 .415 .270 .177 .134 .093 .067 .044 .032 .026 .018
19. Yadkin River at Yadkin College
2,280
0.827
18.0 6.06 3.12 1.84 1.30
.935
.776
.592
.453
.392
.323
.281
.241
.224
.207
.180
.174
20. Dutchmans Creek near Cornatzer
83.6
0.84
1.43 .980 .750 .465 .260 .199 .122 .095 .069 .059 .051 .042 .039
21. Rocky River at Turnersburg
85.5
0.839
15.1 7.33 3.40 1.97 1.38
.967
.771
.571
.435
.374
.306
.268
.228
.208
.198
.178
.170
22. South Yadkin River near Mocks ville
313
0.655
9.40 5.06 2.79 1.64 1.15
.805
.650
.465
.369
.301
.248
.215
.185
.168
.154
.137
.125
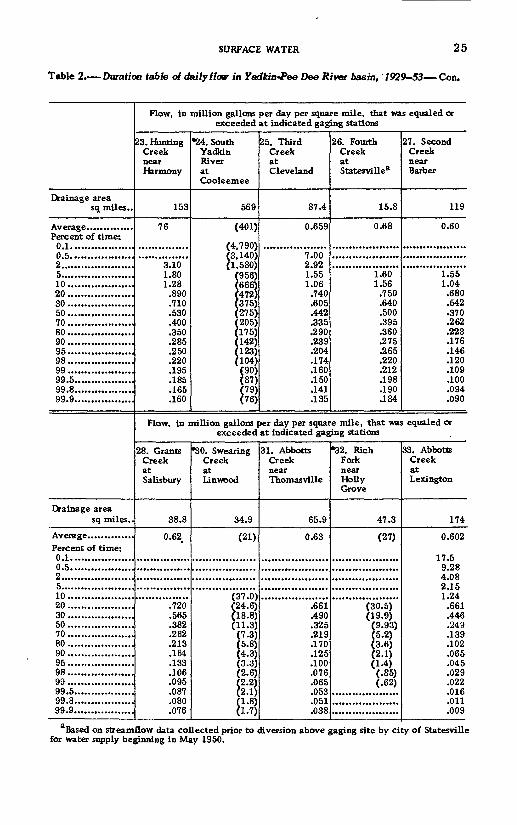
SURFACE WATER 25
Table 2. Duration table of daily flow in Yadkin-Pee Dee River basin, 1929-53 Con.
Drainage area sq miles..
Percent of time: 0.1..... ............ ..0.5...................2......................5......................10 .................. ..20....................Of)
50....................70....................80....................90....................95....................98....................QQ
99.5..................99.8..................qq a
Drainage area sq miles..
Percent of time: 0.1...................0.5...................2......................5......................10....................20....................on
50....................70....................80....................90....................95....................98....................99....................99.5..................99.8..................99.9..................
Flow, in million gallons per day per square mile, that was equaled or exceeded at indicated gaging stations
23. Hinting Creek near Harmony
153
76
3.10 1.80 1.28
.890
.710
.530
.400
.350
.285
.250
.220
.195
.185
.165
.160
"24. South Yadkin River at Cooleemee
569
(
8(i401)
790) 140) 580) 956) 666} 472) 375) 275) 205) 175) 142) 123) 104) (90) (87) (79) (76)
25. Third Creek at Cleveland
87.4
0.659
7.00 2.92 1.55 1.06
.740
.605
.442
.335
.290
.239
.204
.174
.160
.150
.141
.135
26. Fourth Creek at Statesville3
15.8
0.68
1.60 1.56
.750
.640
.500
.395
.360
.275
.265
.220
.212
.198
.190
.184
27. Second Creek near Barber
119
0.60
1.55 1.04
.680
.542
.370
.262
.223
.176
.146
.120
.109
.100
.094
.090
Flow, in million gallons per day per square mile, that was equaled or exceeded at indicated gaging stations
28. Grants Creek at Salisbury
38.8
0.62<
.720
.565
.382
.262
.213
.164
.133 .106 .095 .087 .080 .076
*30. Swearing Creek at Linwood
34.9
(21)
f
(
37.0) 24.6) 18.8) 11.3) (7.3) 5.8) 4.3) 3.3)
[2.6) [2.2) [2.1);i.8>(1.7)
31. Abbotts Creek near Thomasville
65.9
0.63
.661
.490
.325
.219
.170
.125
.100
.076
.065
.053
.051
.038
32. Rich Fork near Holly Grove
47.3
(27)
(30.5) (19.9) (9.93) (5.2) (3.6) (2.1) (1.4) (.85) (.62)
33. Abbotts Creek at Lexington
174
0.602
17.5 9.28 4.08 2.15 1.24
.661
.446
.249
.139
.102
.065
.045
.029
.022
.016
.011
.009
Based on streamflow data collected prior to diversion above gaging site by city of Statesville for water supply beginning in May 1950.
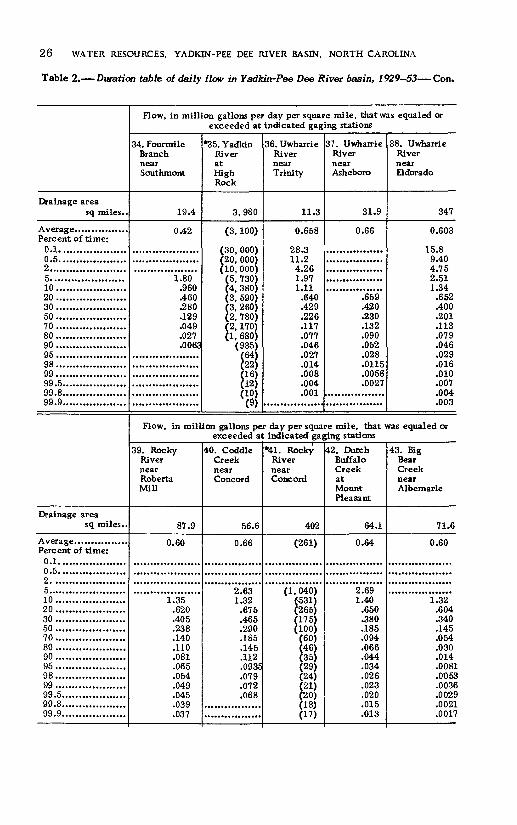
26 WATER RESOURCES, YADKIN-PEE DEE RIVER BASIN, NORTH CAROLINA
Table 2. Duration table of daily flow in Yadkin-Pee Dee River basin, 1929-53 Con.
Drainage area sq miles..
Percent of time; 0.1....................0.5....................2.......................5......................10.....................20.....................30.....................50.....................70.....................80.....................90.....................95.....................98.....................99 ................... ..99.5...................99.8...................99.9...................
Drainage area sq miles..
Percent of time: 0.1....................0.5....................2. .....................5.......................10.....................20 .....................ofl
50.....................70.....................80.....................90.....................95.....................98.....................qq99.5...................99.8...................99.9...................
Flow, in million gallons per day per square mile, thatwas equaled or exceeded at indicated gaging stations
34. Fourmile Branch near Southmont
19.4
0.42
1.80 .960 .460 .280 .129 .049 .027 .0063
35. Yadkin River at High Rock
3,980
(3, 100)
(30, 000) (20, 000) (10, 000)
5, 730) 4, 380) 3, 590) 3, 260) 2. 780) 2, 170) 1, 680)
(935) (64) (22) (16) (12) (10) (9)
36. Uwharrie River near Trinity
11.3
0.658
28.3 11.2 4.26 1.97 1.11
.640
.429
.226
.117
.077
.046
.027
.014
.008
.004
.001
37. Uwharrie River near Asheboro
31.9
0.66
.659
.420
.230
.132
.090
.052
.028
.0115
.0056
.0027
38. Uwharrie River near Eldorado
347
0.603
15.8 9.40 4.75 2.51 1.34
.652
.400
.201
.113
.079
.046
.029
.016
.010
.007
.004
.003
Flow, in million gallons per day per square mile, that was equaled or exceeded at indicated gaging stations
39. Rocky River near Roberta Mill
87.9
0.60
1.35 .620 .405 .238 .140 .110 .081 .065 .054 .049 .045 .039 .037
40. Coddle Creek near Concord
56.6
0.66
2.63 1.32
.675
.465
.290
.185
.145
.112
.0935
.079
.072
.068
^41. Rocky River near Concord
402
(261)
(1,040) (531) (265) (175) (100) (60) (46) (35) (29) (24) (21) (20) (18) (17)
42. Dutch Buffalo Creek at Mount Pleasant
64.1
0.64
2.69 1.40
.650
.380
.185
.094
.066
.044
.034
.026
.023
.020
.015
.013
43. Big Bear Creek near Albemarle
71.6
0.60
1.32 .604 .340 .145 .054 .030 .014 .0081 .0-053 .0036 .0029 .0021 .0017

SURFACE WATER 27
Table 2 Duration table of daily flow in Yadkin-Pee Dee Rivet basin, 1929-53 Con.
Drainage area sq miles..
Percent of time: 0.1...............0.5...............2..................5..................10................20................30................50................70................80................on95................98................99 ............... ..99.5.. ........... .,99.8...............99.9...............
Drainage area sq miles..
Percent of time: 0.1...............0.5...............2..................5..................10................20................30................50................70................80................90................95................98................99................99.5..............99.8..............99.9..............
Flow, in million gallons per day per square mile, that was equaled or exceeded at indicated gaging stations
44. Richardson Creek near Marshville
170
0.50
5.90 2.79 1.32
.505
.258
.090
.027
.0125
.0066
.0035
.0014
45. Rocky River near Norwood
1,370
(815)
(fi3, 600) (13, 200)
(6, 780) (3, 550) (1,810)
(827) (490) (240) (119) (84) (56) (42) (33) (29) (26) (22) (21)
46. Little Brown Creek near Polkton
13.5
0.50
6.44 3.20 1.60
.590
.206
.036
.0038
.0012
47. Brown Creek near Polkton
110
0.489
17.3 10.3
5.20 2.70 1.44
.573
.256
.068
.015
.005
.001
*48. Pee Dee River near Ansonville
(6, 330)
(80, 700) (15, 500) (8, 290) (5, 680) (4, 200) (3, 500J (2, 840) (2, 100) (1,610) (1,000)
(610) (320) (i230) (150) (120>
Flow, in million gallons per day per square mile, that was equaled or exceeded at indicated gaging stations
49. Little River near Star
97.6
0.580 .330 .207 .153 .098 .066 .038 .023 .014 .0054
50. Mountain Creek near Ellerbe
33.4
0.64
2.0 1.40 1.03
.79
.492
.290
.198
.117
.096
.049
.040
.033
.028
.026
51. Cartledge Creek near Rockingham
31.4
0.55
2.19 .159 .107 .750 .352 .140 .074 .031 .023 .0050
*52. Pee Dee River near Rockingham
6,870
(5,090)
(74, 200> (39, 200) (23, 300) (12, 900) (8, 380) (5, 690) (4, 590) (3, 620) (2,780) (2,230) (1,480)
(893) (360) (230) (160) (110) (89)
53. Falling Creek near Rockingham
6.0
0.95
2.21 1.71 1.33 1.10
.800
.560
.450
.335
.302
.210
.190
.174
.158
.152
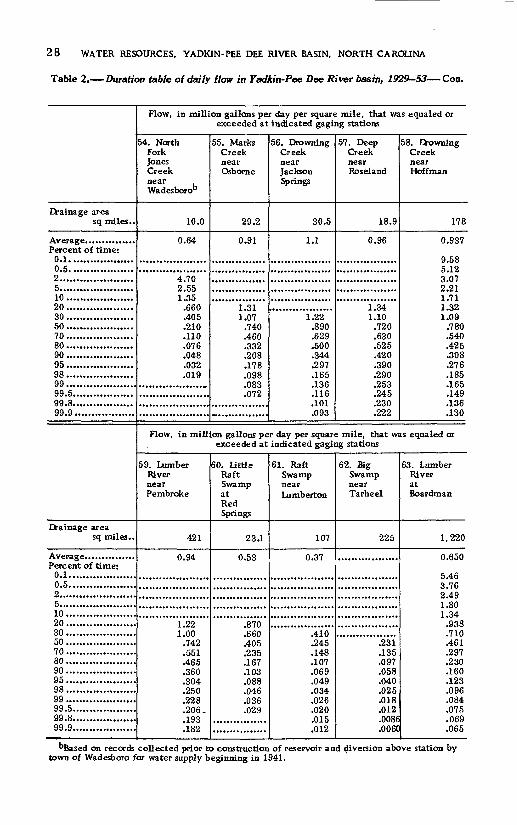
28 WATER RESOURCES. YADKIN-PEE DEE RIVER BASIN, NORTH CAROLINA
Table 2. Duration table of daily flow in Yadkin-Pee Dee River basin, 1929-53 Con.
Drainage area sq miles..
Percent of time: 0.1...................0.5. ................. .2......................5.......... ........... .10....................20....................30....................50 ....................70....................80....................90 ............... .....95....................98....................99.....................99.5..................99.8..... ....... ......qq q
Drainage area sq miles..
Percent of time: 0.1....................0.5....................2......... ............ ..5.... .................. .10 .....................20.....................30.....................50.....................70.....................80 ................... ..90 .....................95 .....................989999.5...................99.8...................99.9..... ..............
Flow, in million gallons per day per square mile, that was equaled or exceeded at indicated gaging stations
54. North Fork Jones Creek near Wadesborob
10.0
0.64
4.70 2.55 1.35
.660
.405
.210
.110
.076
.048
.032
.019
55. Marks Creek near Osborne
29.2
0.91
1.31 1.07
.740
.460
.332
.208
.178
.098
.083
.072
56. Drowning Creek near Jackson Springs
30.5
1.1
1.22 .890 .629 .500 .344 .297 .165 .136 .116 .101 .093
57. Deep Creek near Roseland
18.9
0.96
1.34 1.10
.720
.630
.525
.420
.390
.290
.253
.245
.230
.222
58. Drowning Creek near Hoffman
178
0.937
9.58 5.12 3.07 2.21 1.71 1.32 1.09
.780
.540
.425
.308
.276
.185
.165
.149
.136
.130
Flow, in million gallons per day per square mile, that was equaled or exceeded at indicated gaging stations
59. Lumber River near Pembroke
421
0.94
1.22 1.00
.742
.551
.465
.360
.304
.250
.228
.206-
.193
.182
60. Little Raft Swamp at Red Springs
23.1
0.53
.870
.660
.405
.235
.167
.103
.088
.046
.036
.029
61. Raft Swamp near Lumberton
107
0.37
.410
.245
.148
.107
.069
.049
.034
.026
.020
.015
.012
62. Big Swamp near Tarheel
225
.231
.135
.097
.058
.040
.025
.018
.012
.0086
.0060
63. Lumber River at Boardrnan
1,220
0.650
5.46 3.76 2.49 1.80 1.34
.938
.710
.461
.297
.230
.160
.123
.096
.084
.075
.069
.065
''Based on records collected prior to construction of reservoir and diversion above station by town of Wadesboro for water supply beginning in 1941.
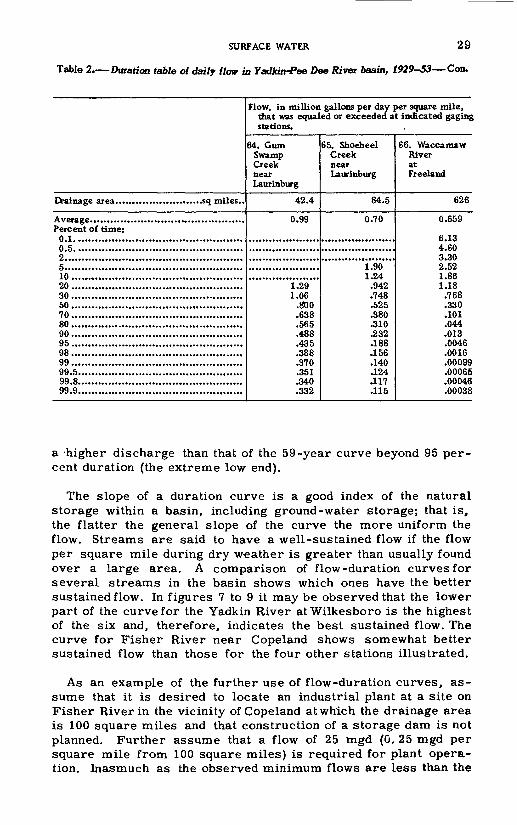
SURFACE WATER 29
Table 2. Duration table of daily flow in Yadkin-Pee Dee River basin, 1929-53 Con.
Percent of time: 0.1...... ............................................0.5. ............................................. ....2.....................................................5................ .....................................10 ...................................................20...................................................Of)
50...................................................70...................................................80...................................................of)
95...................................................98...................................................99...................................................99.5.................................................99.8.................................................99.9.................................................
Flow, in million gallons per day per square mile, that was equaled or exceeded at indicated gaging stations.
64. Gum Swamp Creek near Laurinburg
42.4
0.99
1.29 1.06
.800
.638
.565
.488
.435
.388
.370
.351
.340
.332
65. Shoeheel Creek near Laurinburg
84.5
0.70
1.9*0 "
1.24 .942 .748 .525 .380 .310 .232 .188 .156 .140 .124 .117 .115
66. Waccamaw River at Freeland
626
0.659
6.13 4.60 3.30 2.52 1.86 1.18
.768
.330
.101
.044
.013
.0046
.0016
.00099
.00065
.00046
.00038
a higher discharge than that of the 59-year curve beyond 95 per cent duration (the extreme low end).
The slope of a duration curve is a good index of the natural storage within a basin, including ground-water storage; that is, the flatter the general slope of the curve the more uniform the flow. Streams are said to have a well-sustained flow if the flow per square mile during dry weather is greater than usually found over a large area. A comparison of flow-duration curves for several streams in the basin shows which ones have the better sustained flow. In figures 7 to 9 it may be observed that the lower part of the curve for the Yadkin River atWilkesboro is the highest of the six and, therefore, indicates the best sustained flow. The curve for Fisher River near Copeland shows somewhat better sustained flow than those for the four other stations illustrated.
As an example of the further use of flow-duration curves, as sume that it is desired to locate an industrial plant at a site on Fisher River in the vicinity of Copeland at which the drainage area is 100 square miles and that construction of a storage dam is not planned. Further assume that a flow of 25 mgd (0. 25 mgd per square mile from 100 square miles) is required for plant opera tion. Inasmuch as the observed minimum flows are less than the
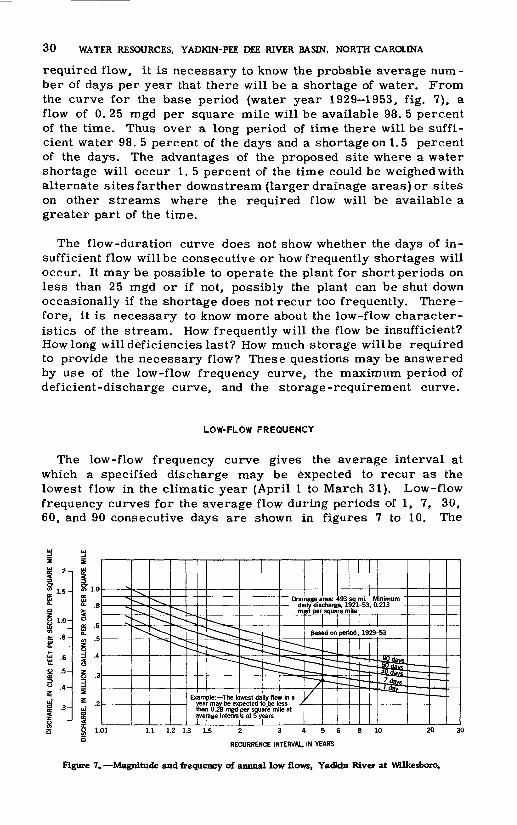
30 WATER RESOURCES, YADKIN-PEE DEE RIVER BASIN, NORTH CAROLINA
required flow, it is necessary to know the probable average num ber of days per year that there will be a shortage of water. From the curve for the base period (water year 1929 1953, fig. 7), a flow of 0. 25 mgd per square mile will be available 98. 5 percent of the time. Thus over a long period of time there will be suffi cient water 98. 5 percent of the days and a shortage on 1.5 percent of the days. The advantages of the proposed site where a water shortage will occur 1. 5 percent of the time could be weighed with alternate sites farther downstream (larger drainage areas) or sites on other streams where the required flow will be available a greater part of the time.
The flow-duration curve does not show whether the days of in sufficient flow will be consecutive or how frequently shortages will occur. It may be possible to operate the plant for short periods on less than 25 mgd or if not, possibly the plant can be shut down occasionally if the shortage does not recur too frequently. There fore, it is necessary to know more about the low-flow character istics of the stream. How frequently will the flow be insufficient? How long will deficiencies last? How much storage will be required to provide the necessary flow? These questions may be answered by use of the low-flow frequency curve, the maximum period of deficient-discharge curve, and the storage-requirement curve.
LOW-FLOW FREQUENCY
The low-flow frequency curve gives the average interval at which a specified discharge may be expected to recur as the lowest flow in the climatic year (April 1 to March 31). Low-flow frequency curves for the average flow during periods of 1, 7, 30, 60, and 90 consecutive days are shown in figures 7 to 10. The
Drainage area: 493 so mi. Minimum daily discharge, 1921-53, 0.213 m id per square mile_____
Example: The lowest daily flow in a year may be expected to _be less than 0.28 mgd per square mile, at average intervals of 5 yearsII II,
2 3456
RECURRENCE INTERVAL, IN YEARS
Figure 7. Magnitude and frequency of annual low flows, Yadkin River at Wilkesboro.

SURFACE WATER 31
3 -°8z ul .06
Fisher River near Copeland. Drainage area: 121 sq mi Based on period 1929-53
Example The lowest daily flow in a year may be expected to be less than 0.25 mgd per square mile at average intervals of 3 years. The lowest 7-day flow in a year may be expected to be less than 0.25 mgd per square mile at average intervals of 4^4 years. The lowest 30-day flow In a year may be expected to be less than 0.25 mgd per square mile at average inter vals of 9 years
Rocky River near Norwood. Drainage area: 1370 sq mi Based on period 1929-53
2 34568 10 20
RECURRENCE INTERVAL, IN YEARS
Figure 8. Magnitude and frequency of annual low flows, Fisher River near Copeland and RockyRiver near Norwood.
amount and frequency of annual low flows for the same num ber of consecutive days are given in table 3. The data in the figures and tables are based on the period 1929 53 and although the flows of some streams in the table are affected by regulation or diver sion, the effect is not appreciable except for those streams for which data are applicable only at the gaging station site and are given in million gallons per day.
If records from 1896 to 1928 and for 1954 had been included the net effect on the shape and position of the curves would be similar to that shown in figure 8. The dashed line shows the average re currence interval for annual 7-day minimum flow atYadkin College during the 59-year period, April 1, 1896, to March 31, 1955. At short recurrence intervals the flow shown by the dashed line is slightly higher than that shown by the curve based on a. regional analysis of records for the period 1929 53 (solid line) and at longer intervals the position of the two curves is reversed. Therefore, if data for the period 1896 1955 had been used to prepare this table the flow would be increased at the 2-, 3-, 5-, and 10-year recur rence intervals and would be decreased at the 25-year interval. For stations such as Yadkin River at Yadkin College that have a high flow per square mile during droughts the maximum change would be about 20 percent, but for stations such as Waccamaw River at Freeland that have low discharge per square mile during

DISCHARGE, IN CUBIC F£ET PER SECOND PER SQUARE MILE
DISCHARGE, IN MILLION GALLONS PER DAY PER SQUARE MILE
VNI1OHVD HXHON 'NISVH H3AIH 33Q 33d-NMQVA 'H3XVM

DIS
CH
ARG
E, I
N
CU
BIC
FEE
T PE
R SE
CO
ND
PER
SQ
UAR
E M
ILE
fliis
s
s g
s s
§I
-IN>
GO
i*
ui
bi
bo
b
I II
I I
I I
I I
I
a. Sf
N si | a 25
DIS
CH
ARG
E, I
N
MIL
LIO
N G
ALL
ON
S P
ER
DAY
PER
SQ
UAR
E M
ILE
»
£
Ol
Ch
00
i->
fS
wjh
(JiO
)O
D»->
en
01
00
o
CO
CO

Tab
le 3
. M
agni
tude
and
fre
quen
cy o
f an
nual
low
flo
w i
n th
e Y
adki
n-P
ee D
ee R
iver
bas
in f
or p
erio
ds o
f 1,
7,
30,
60,
and
90 d
ays,
bas
ed o
n re
cord
sA
pril
1,
1929
to
Mar
ch 3
1, 1
953
[Dat
a fo
r st
atio
ns 3
0,
32,
39,
41,
and
45 (
mar
ked
wit
h as
teri
sks)
are
app
lica
ble
only
at
gagi
ng s
tati
on s
ite
and
are
in m
illi
on g
allo
ns p
er d
ay]
No.
(P
i. 2)
1 2 3 4 5 6 7
Gag
ing
site
s
Elk
Cre
ek a
t E
lkvi
lle
Mid
dle
Fork
Red
dies
Riv
er n
ear
Wil
bar
....
. ...............
Yad
kin
Riv
er a
t W
ilkes
boro
....
....
....
....
....
....
....
....
...
Dra
inag
e ar
ea
(squ
are
mil
es)
28.8
50.0
13.9
93.9
493 43
.0
122
Min
imum
da
ily
disc
harg
e of
rec
ord
a (m
gd) 3.
4
15
73
Peri
ods
(con
secu
ti
ve
days
) 1 7 30
60
90 1 7 30
60
90 1 7 30
60
90 1 7 30
60
90 1 7 30
60
90 1 7 30
60
90 1 7 30
60
90
Low
est
flow
, in
mil
lion
gal
lons
per
day
per
squ
are
mil
e,
and
recu
rren
ce i
nter
vals
, in
yea
rs
2 0.30
1 .3
41
.408
.4
73
.534
.2
73
.312
.3
80
.445
.5
01
.502
.5
70
.680
.7
67
.853
.3
78
.420
.4
82
.533
.5
85
.356
.3
94
.460
.5
15
.570
.4
25
.470
.5
45
.595
.6
53
.352
.3
93
.464
.5
19
.575
3 0.26
5 .2
94
.343
.3
97
.449
.2
40
.268
.3
15
.368
.4
20
.443
.4
97
.583
.6
48
.725
.3
41
.372
.4
23
.464
.5
09
.316
.3
43
.398
.4
45
.493
.3
83
.417
.4
73
.520
.5
68
.310
.3
42
.399
.4
42
.493
5 0.23
3 .2
56
.296
.3
34
.377
.2
10
.232
.2
69
.306
.3
48
.383
.4
22
.500
.5
57
.618
.3
04
.329
.3
74
.409
.4
47
.278
.3
04
.346
.3
86
.424
.3
42
.368
.4
20
.457
.5
00
.273
.2
99
.345
.3
83
.422
10 0.20
7 .2
24
.260
.2
89
.314
.1
84
.201
.2
37
.263
.2
88
.337
.3
67
.423
.4
78
.528
.2
72
.292
.3
29
.361
.3
93
.246
.2
69
.308
.3
39
.368
.3
05
.328
.3
67
.406
.4
37
.240
.2
62
.299
.3
32
.364
15 0.19
3 .2
15
.242
.2
76
.301
.1
73
.193
.2
19
.252
.2
74
.310
.3
52
.410
.4
59
.500
.2
55
.282
.3
20
.350
.3
74
.233
.2
57
.293
.3
24
.351
.2
86
.316
.3
59
.392
.4
19
.223
.2
52
.289
.3
21
.345
25 0.18
6 .2
06
.236
.2
65
.287
.184
.2
12
.241
.2
63
.330
.3
90
.436
.4
72
.244
.2
68
.307
.3
36
.359
.2
20
.245
.2
83
.310
.3
37 .'361
.345
.3
76
.404
.237
.2
76
.306
.3
30
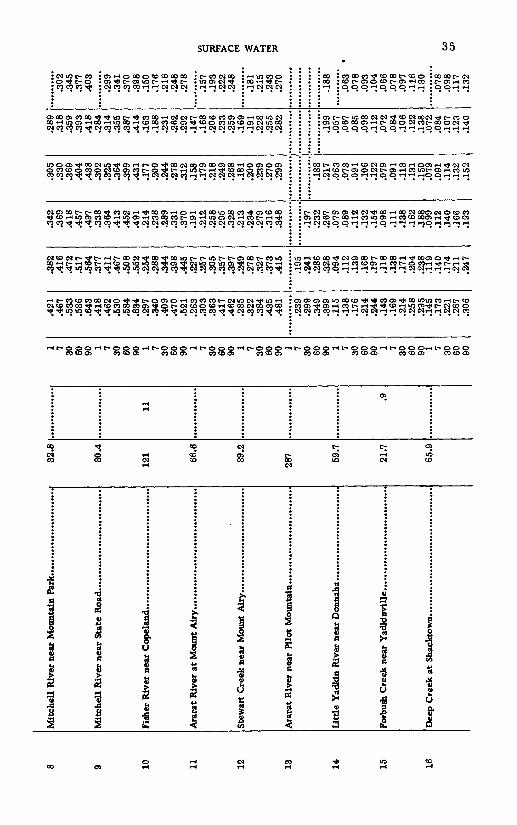
10 11 12 13 14 15 16
Mit
chel
l R
iver
nea
r M
ount
ain
Par
k.
Mit
chel
l R
iver
nea
r S
tate
Roa
d.
Fis
her
Riv
er n
ear
Cop
elan
d.
Ara
rat
Riv
er a
t M
ount
Air
y.
Ste
war
t C
reek
nea
r M
ount
Air
y.
Ara
rat
Riv
er n
ear
Pil
ot M
ount
ain.
Lit
tle
Yad
kin
Riv
er n
ear
Don
naha
.
Forb
ush
Cre
ek n
ear
Yad
kinv
ille
.
Dee
p C
reek
at
Sha
ckto
wn.
32.8
80.4
121 66
.6
89.2
287 59
.7
21.7
65.9
11
.9
1 7 30 60 90 1 7 30 60 90 1 7 30 60 90 1 7 30 60 90 1 7 30 60 90 1 7 30 60 90 1 7 30 60 901 7 30 60 90 7 30 60 90
.421
.467
.533
.5
86
.643
.4
18.462
.530
.584
.634
.297
.340
.409
.470
.521
.2
63.303
.363
.417
.462
.285
.322
.384
.435
.481
.239
.299
04.Q
.399
.115
.138
.176
.214
.244
.143
.169
.214
.2
58
.295
.1
45.1
73
.221
.267
.306
.382
.416
.4
72
.517
.564
.377
.411
.467
.508
.552
.2
54
.288
.344
.398
.445
997
.257
.305
.357
.3
97
.249
.278
.327
.373
.415
.195
.241
.286
.328
.094
.112
.139
.168
.197
.118
.138
.171
.2
04
.238
11Q
.140
.174
.211
.247
.342
.369
.418
.457
.497
.338
.364
.4
13
.452
.491
.214
.2
38
.289
.331
.370
1Q1
.212
.2
58
.295
.328
.213
.234
.2
79
.316
.3
48
1Q7
O09
.267
.079
.089
.1
12
.132
.1
54
.098
.111
.138
.1
62
J.88
.0
99.1
12
.140
.166
.193
.305
.330
.369
.404
.4
38
.302
.325
.364
.3
99
.431
.177
.200
.244
.278
.312
.158
.179
.2
18
.249
.2
68
.181
.200
.239
.270
.299
.188
.217
.063
.073
.0
91
.106
.122
.079
.091
.113
.131
.150
.0
79.0
91
.114
.132
.152
.289
.318
.359
.393
.4
18
984.
.314
.355
.387
.414
.163
.188
.231
.262
.292
.147
.168
.206
.233
.2
59
"Ifi
Q.191
.228
.255
.282
.199
.057
.067
.085
.098
.1
12
.072
.084
.1
06
.122
.1
38O79
.084
.107
.123
.140
.302
.345
.377
.403
.299
.3
41
.370
.3
98
.150
.176
.216
.248
.2
78
.157
.193
.2
22
.248
.181
.215
.243
.270
.188
.063
.0
78
.093
.104
.066
.0
78
.097
.116
.130
.078
.0
98
.117
.132
CO
U
I

Tab
le 3
.-*
Mag
nitu
de a
nd fr
eque
ncy
of
annu
al l
ow f
low
in
the
Yad
kin-
Pee
Dee
Riv
er b
asin
for
per
iods
of
1,
7,
30,
60,
and
90 d
ays,
ba
sed
on r
ecor
dsA
pril
1,
1929
to
Mar
ch 3
1, 1
953
Conti
nued
No.
(p
i. 2)
17
18
19
20
21
22 23
Gag
ing
site
s
Yad
kin
Riv
er a
t Y
adki
n C
oUeg
e.. .
..........................
Dra
inag
e ar
ea
(squ
are
mile
s)
111 13
.3
2,28
0 83.6
85.5
313
153
Min
imum
da
ily
disc
harg
e of
rec
ord*
(m
gd)
223 8.
4
25
18
Peri
ods
(con
secu
ti
ve
days
)
1 7 30
60
90 1 7 30
60
90 1 7 30
60
90 1 7 30
60
90 1 7 30
60
90 1 7 30
60
90 1 7 30
60
90
Low
est f
low
, in
mil
lion
gal
lons
per
day
per
squ
are
mil
e,
and
recu
rren
ce i
nter
vals
, in
yea
rs
2 0.12
3 .1
48
.190
.2
32
.268
.0
77
.099
.1
41
.182
.2
23
.268
.2
98
.349
.3
97
.439
.0
87
.111
.1
56
.204
.2
58
.255
.2
87
.339
.3
87
.431
.2
00
.225
.2
71
.26Q
.3
51
.237
.2
67
.313
.3
57
.399
3 0.10
2 .1
19
.150
.1
82
.213
.0
57
.073
.1
03
.134
.1
66
.235
.2
56
.300
.3
40
.377
.0
66
.080
.1
11
.145
.1
82
.222
.2
44
.287
.3
27
.364
.1
74
.193
.2
27
.310
.2
95
.208
.2
27
.267
.3
01
.337
5 0.08
3 .0
94
.119
.1
42
.167
.0
41
.050
.0
73
.095
.1
17
.207
.2
27
.259
.2
92
.323
.0
50
.059
.0
82
.105
.1
31
.194
.2
12
.248
.2
80
.311
.1
52
.167
.1
93
.219
.2
46
.180
.1
98
.229
.2
60
.290
10 0.06
6 .0
77
.097
.1
13
.130
.0
29
.036
.0
53
.068
.0
85
.180
.1
98
.229
.2
54
.275
.045
.0
61
.077
.0
94
.167
.1
85
.215
.2
41
.265
.1
30
.145
.1
69
.188
.2
09
.156
.1
73
.201
.2
25
.246
15 0.06
0 .0
70
.090
.1
04
.119
.032
.0
48
.061
.0
75
.170
.1
90
.220
.2
42
.260
.056
.0
69
.084
.1
57
.176
.2
06
.228
.2
51
.122
.1
35
.160
.1
79
.197
.1
47
.164
.1
93
.213
.2
34
25 0.06
5 .0
82
.098
.1
12
.029
.0
42
.054
.0
68
.159
.1
79
.208
.2
31
.253
.050
.0
62
.077
.1
47
.167
.1
95
.216
.2
40
.114
.1
29
.152
.1
70
.186
.156
.1
82
.202
.2
23

24 25 26 27 28 30 31 32 33
Sout
h Y
adki
n R
iver
at
Coo
leem
ee.
Thi
rd C
reek
at
Cle
vela
nd.
Fou
rth
Cre
ek a
t S
tate
svil
leb
.
Sec
ond
Cre
ek n
ear
Bar
ber.
Gra
nts
Cre
ek a
t S
alis
bury
.
Sw
eari
ng L
ake
at l
inw
ood.
Abb
otts
Cre
ek n
ear
Tho
mas
vill
e.
Ric
h Fo
rk n
ear
Hol
ly G
rove
.
Abb
otts
Cre
ek a
t L
exin
gton
.
569 87
.4
15.8
119
38.8
34.9
65.9
47.3
174
15 7.1
1.3
1 7 30 60 90 1 7 30 60 90 1 7 30 60 901 7 30 60 90 1 7 30 60 90 1 7 30 60 901 7 30 60 901 7
30 60 90 1 7 30 60 90
.228
.2
74
.312
.3
49
.194
.2
18
.256
.2
92
.324
.274
^1
9O
4.fi
.377
.137
.158
.1
91
.223
.2
52
.123
.145
.1
79
.215
.2
50
3.0
3.6
4.7
5.8
6.8 .0
84
.103
.1
43
.193
.2
41
.95
1.5
2.6
4.4
6.
4 .033
.0
48
.080
.1
23
.169
.197
.2
31
.264
.2
96
.171
.1
88
.218
.2
48
.273
.274 on
o.3
28.1
18.1
32
.158
.1
83
.207
.1
03.1
18
.145
.1
72
.197
2.
42.
9 3.
6 4.
5 5.
3 .065
.0
84
.117
.1
51
.190
1.0
1.8
2.9
4.3 .0
22
.034
.0
57
.085
.1
19
.170
.1
98
.222
.2
51
.151
.1
64
.189
.2
11
.236
.265
.291
.101
.113
.1
33
.152
.1
73
.087
.099
.1
18
.138
.1
62
2.0
2.3
2.9
3.5
4.1 .0
49
.065
.0
91
.116
.1
47
1.1
1..8
2.
7 .014
.0
22
.039
.0
56
.082
.145
.1
70
.190
.2
09
.132
.1
44
.166
.1
84
.201
.257
.087
.097
.1
14
.128
.1
43
.073
.083
.1
00
.115
.1
30
1.6
1.9
2.3
2,8
3.2 .0
38
.049
.0
69
.094
.1
14
.66
1.2
1.8 .008
7 .0
14 '
.0
24
.040 .ose
.140
.1
64
.182
.1
99
.124
.1
37
.159
.1
74
.189
.082
.091
.1
08
.121
.1
33
.067
.077
.0
94
.107
.1
18
1.5
1.7
2.2
2.6
2.9 .0
32
.042
.0
60
.084
.1
01
.95
1.4 .006
6 .0
10
.019
.0
33
.046
.131
.1
54
.175
.1
90
.118
.1
31
.152
.1
68
.182
.086
.1
02
.116
.1
27
.072
.0
88
.102
.1
13
1.6
2.1
2.4
2.7 .0
27
.036
.0
52
.071
.0
86
.71
1.0 .0
049'
.007
9 .0
15
.026
.0
35
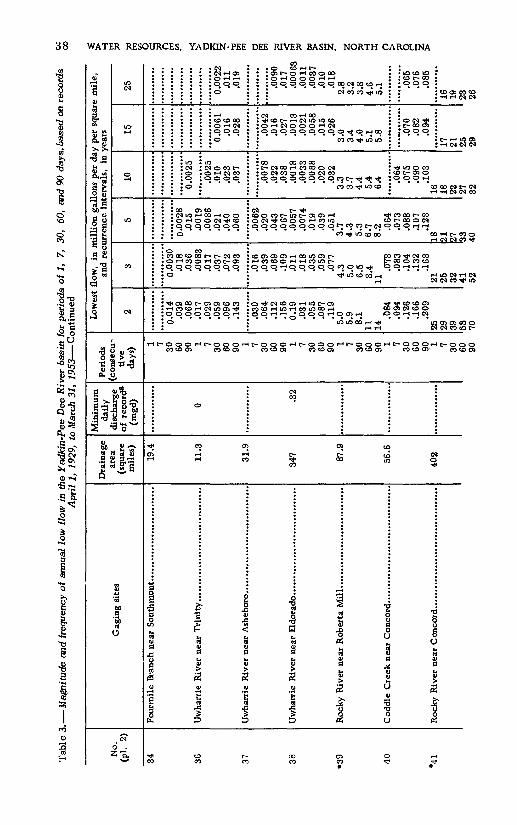
Tab
le 3
. M
agni
tude
and
fre
quen
cy o
f an
nual
low
flo
w i
n th
e Y
adki
n-P
ee D
ee R
iver
bas
in f
or p
erio
ds o
f 1,
7,
30
, 60
, an
d 90
da
ys,b
ase
d o
n re
cord
sA
pril
1,
1929
, to
Mar
ch 3
1, 1
953 C
onti
nued
No.
(p
i. 2)
34
36
37
38
39
40
"41
Gag
ing
site
sD
rain
age
area
(s
quar
e m
iles
)
19.4
11.3
31.9
347 87
.9
56.6
402
Min
imum
da
ily
disc
harg
e of
rec
ord*
(m
gd) 0 .3
2
Per
iods
(c
onse
cu
tive
da
ys) 1 7 30
60
90
1 7 30
60
90 1 7 30
60
90 1 7 30
60
90 1 7 30
60
90 1 7 30
60
90 7 30
60
90
Low
est
flow
, in
mil
lion
gal
lons
per
day
per
squ
are
mil
e,
and
recu
rren
ce i
nter
vals
, in
yea
rs
2
0.01
4 .0
39
.068
.0
17
.029
.0
59
.096
.1
43
.030
.0
64
.112
.1
56
0.19
.0
31
.055
.0
87
.119
5.
0 5.
9 8.
1 11
14
.084
.0
94
.126
.1
66
.209
25
29
39
53
70
3
0.00
30
.018
.0
36
.008
3 .0
17
.037
.0
72
.093
.016
.0
39
.069
.1
09
.011
.0
18
.035
.0
59
.077
4.
3 5.
0 6.
5 8.
4 11
.073
.0
83
.104
.1
32
.163
21
25
32
41
52
5
0.00
28
.015
.0
019
.008
6 .0
21
.040
.0
60
.006
2 .0
20
.043
.0
67
.005
7 .0
074
.019
.0
39
.051
3.
7 4.
3 5.
3 6.
7 8.
2 .064
.0
73
.088
.1
07
.128
18
21
27
33
40
10
0.00
25
.002
5 .0
10
.023
.0
37
.007
8 .0
22
.038
.0
018
.003
3 .0
088
.020
.0
32
3.3
3.7
4.4
5.4
6.4 .0
64
.075
.0
90
.103
16
18
22
27
32
15
0.00
61
.016
.0
28
.004
2 .0
16
.027
.0
013
.002
1 .0
058
.015
.0
26
3.0
34
4.0
5.1
5.8 .0
70
.082
.0
94
17
21
25
29
25 0.00
22
.011
.0
19
.009
0 .0
17
.000
63
.001
1 .0
037
.010
.0
18
2.8
3.2
3.8
4.6
5.1 .0
65
.076
.0
85
16
19
23
26
CO
00

42
Dut
ch B
uffa
lo C
reek
at
Mt.
Ple
asan
t.
43 44 45
46 47 49 50 51
Big
Bea
r C
reek
nea
r A
lbem
arle
.
Ric
hard
son
Cre
ek n
ear
Mar
shvi
lle.
Roc
ky R
iver
nea
r N
orw
ood.
Lit
tle
Bro
wn
Cre
ek n
ear
Pol
kton
.
Bro
wn
Cre
ek n
ear
Pol
kton
.
Lit
tle
Riv
er n
ear
Sta
r.
Mou
ntai
n C
reek
nea
r E
ller
be.
Car
tled
ge C
reek
nea
r R
ocki
ngha
ra.
64.1
71.6
170
1,37
0 13.5
110 97
.6
33.4
31.4
12
1 7 30 60 901 7 30 60 901 7 30 60 90 1 7 30 60 901 7 30 60 901 7 30 60 901 7 30 60 901 7 30 60 901 7 30 60 90
.028
.035
.051
.080
.114
.0
057
.009
0 .020
.042
.073
.002
0.0
038
.009
3.0
21
.039
36
44
67
101
L45 .0
025
00<14
.000
08.0
0036
.002
3.0
093
.025
.045
.070
.114
.165
.217
.070
.086
.130
.194
.245
.013
.019
.038
.073
.107
.023
.028
.040
.056
.0
76
.0037
.0057
.012
.022
.039
.002
0.0
051
.010
.020
29
36
51
71
99
.00051
0099
.00007
.000
70.0
0028
.008
5 .0
26.0
43.0
77.120
.150
.044
.061
.088
.127
.163
.0049
.009
8.020
.036
.0
54
.018
.023
.031
.041
.054
.0
025
.003
7 .0
068
.012
'.
021
.002
8.0
056
.009
9 25
29
38
52
68
.000
16.0
0068
.002
5 .010
.015
.045
.085
.106
.035
.041
.059
.082
.1
03
.001
6.0
090
.018
.0
26
.012
.017
.024
.0
32
.038
.0
016
.002
4 .0
040
.007
3 .011
.000
56.0
030
.005
0 19
23
30
40
49
.00019
.000
68
01Q
.048
.0
72
.027
.033
.044
.059
.077
.002
8.0
090
.016
.008
5 .0
16
.021
.0
28
.034
.0
013
.001
9 .0
032
.0058
.008
5
.002
0 .0
036
18
22
27
36
42
.00007
.00031
.011
.036
.060
.024
.030
.038
.0
53
.068
.006
6 .013
.0048
.011
.017
.025
.029
.001
0 .0
015
.002
6 .0042
.0061
.001
0 .0024
16
19
25
32
37
.00009
.023
.043
.021
.026
.0
34
.045
.059
.0034
.009
0
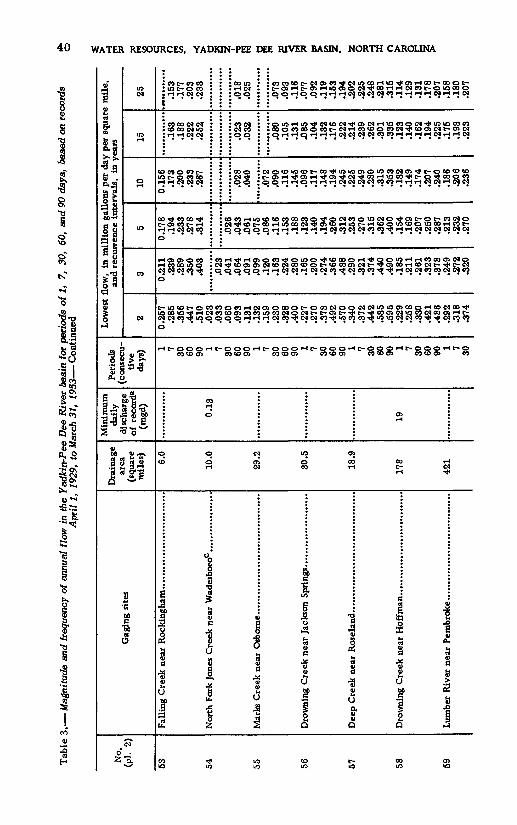
Tab
le 3
. M
agni
tude
and
fre
quen
cy o
f an
nual
flo
w i
n th
e Y
adki
n-P
ee D
ee R
iver
bas
in f
or p
erio
ds o
f 1,
7,
30
, 60
, an
d 90
day
s, b
ased
on
reco
rds
Apr
il I,
192
9, t
o M
arch
31,
1953 C
ontin
ued
No.
(p
i. 2)
53
54
55
56
57
58
59
Gag
ing
site
sD
rain
age
area
(s
quar
e m
iles
)
6.0
10.0
29.2
30.5
18.9
178
421
Min
imum
da
ily
disc
harg
e of
rec
orda
(m
gd)
0.13
19
Peri
ods
(con
secu
ti
ve
days
) 1 7 30
60
90 1 7
30
60
90 1 7 30
60
90 1 7 30
60
90 1 7 30
60
90 1 7 30
60
90 1 7 30
Low
est
flow
, in
mil
lion
gal
lons
per
day
per
squ
are
mil
e,
and
recu
rren
ce i
nter
vals
, in
yea
rs
2
0.25
7 .2
85
.356
.4
47
.510
.0
23
.033
.0
60
.093
.1
31
.132
.1
59
.230
.3
28
.400
.2
27
.270
.3
73
.492
.5
70
.340
.3
72
.442
.5
35
.595
.2
29
.258
.3
30
.421
.4
86
.292
.3
18
.374
3 0.21
1 .2
39
.289
.3
50
.403
.023
.0
41
.064
.0
91
.099
.1
20
.163
.2
24
.280
.1
65
.200
.2
74
.366
.4
38
.290
.3
21
.374
.4
40
.490
.1
85
.211
.2
61
.323
.3
78
.249
.2
72
.320
5
0.17
8 .1
94
.233
.2
78
.314
.026
.0
43
.061
.0
75
.086
.1
16
.153
.1
88
.123
.1
40
.194
.2
60
.312
.2
53
.270
.3
15
.362
.4
00
.154
.1
69
.207
.2
50
.287
.2
13
.232
.2
70
10
0.15
6 .1
73
.200
.2
33
.267
.028
.0
40
.072
.0
90
.116
.1
45
.096
.1
17
.148
.1
94
.245
.2
25
.249
.2
80
.315
.3
53
.132
.1
49
.174
.2
07
.240
.1
86
.206
.2
36
15 .163
.1
88
.222
.2
52
.023
.0
32
.080
.1
05
.131
.0
85
.104
.1
32
.176
.2
22
.214
.2
39
.262
.3
01
.335
.1
23
.140
.1
62
.194
.2
25
.175
.1
93
.223
25 .153
.1
77
.203
.2
33
.018
.0
25
.073
.0
93
.116
.0
77
.092
.1
19
.153
.1
94
.202
.2
25
.248
.2
81
.315
.1
14
.129
.1
31
.178
.2
07
.158
.1
80
.207

60 e-i 62 CO 64 /»c 66
91 1
107
225
1 99fl 4.9
4.
84.5
626
60 0.06
60
90 1 7
30
60
90 1 7 30
60
90 1 7 30
60
90 1 7
30
60
90 1 7 30
60
90 1 7 30
60
90 1 7 30
60
90
.450
.505
.0
66.079
.113
.165
.202
.046
.054
.0
74
.102
.1
24
.036
.044
.064
.093
.114
.117
.132
.1
69
.221
.262
4.99.
.448
.495
.555
.600
.180
.200
.241
.300
.340
.003
6.0060
.015
.039
.069
.370
.413
.046
.058
.081
.112
.140
.032
.038
.055
.073
.087
.024
.030
.045
.063
.078
.094
.106
.133
.167
.195
.385
.405
.450
.495
.527
.153
.167
.202
.239
.270
.001
5.0
026
.006
1 .0
14
.026
.310
.341
.0
31.038
.055
.076
.093
099
.027
.038
.052
.062
.014
.019
.030
.042
.0
52
.078
.086
.105
.1
28
.147
.357
.372
.405
.440
.465
.142
.1
67
.195
.217
.000
76.0
010
.0024
.005
2 .0
089
.272
.3
03
.029
.040
.055
.0
71
.014
.020
.029
.040
.049
.0
072
.012
.0
21
.030
.039
.067
.075
.088
.106
.123
.337
.351
.375
.405
.4
34
.117
.127
.145
.167
.189
.0
0043
.000
64
.0012
.002
5 .0
044
.260
.288
.035
.049
.064
.0094
.016
.025
.036
.0
44
.0050
.009
1 .017
.027
.035
.063
.070
.082
.099
.115
.327
.341
.365
.395
.420
.112
.121
.137
.160
.178
.00031
.000
59
.00091
.001
9 .0034
.243
.272
.030
.042
.055
.003
4.0
11
.021
.030
.040
.006
0 .013
.022
.030
.057
.065
.076
.0
91
.106
.314
.331
.3
53
.380
.405
.103
.114
.129
.149
.167
.00022
.00035
.00066
.001
3 .0
025
For
peri
ods
of r
ecor
d se
e fi
gure
3.
Dat
a in
clud
e lo
w f
low
s to
Sep
tem
ber
30,
1954
."B
ased
on
stre
amfl
ow d
ata
coll
ecte
d p
rior
to
dive
rsio
n ab
ove
gagi
ng s
ite
by c
ity
of
Sta
tesv
ille
for
wat
er s
uppl
y be
ginn
ing
in M
ay 1
950.
c
Bas
ed o
n re
cord
s co
llec
ted p
rior
to
cons
truc
tion
of
rese
rvoi
r an
d di
vers
ion
abov
e st
atio
n by
tow
n of
Wad
esbo
ro f
or w
ater
sup
ply
begi
nnin
g in
194
1.

Tab
le 4
. L
owes
t av
erag
e fl
ow f
or 7
con
secu
tive
day
s in
eve
ry y
ear
at g
agin
g st
atio
ns i
n tr
ie Y
adki
n-P
ee D
ee R
iver
bas
in
[Mill
ion
gallo
ns p
er d
ay]
Yea
r be
ginn
ing
Apr
il 1
1921..............
1922..............
1923..............
1924..............
1925..............
1926
.. ..
....
....
..19
27. .
....
....
... .
1928..............
1929..............
1930..............
1931..............
1932..............
1933..............
1934..............
1935..............
1936...... ..
....
. .1937..............
1938..............
1939..............
1940..............
1941..............
1942
.. ..
....
....
. .19
43..
....
....
... .
1044
..............
1945..............
1946..............
1947..............
1948..............
Gag
ing
stat
ion
and
no.
(pi.
2)
3 £a
2 § c
si
sf « sS*
i-i 9.7
9.6
17 9.6
7.6
7.8
6.7
10
12
5 o
>1
2j
8g
**
«S
| *'
38
33
48
39
36
40
39
34
44
rt Is S 0:3
'S
$*
03
235
285
202
250
117
109
162
369
300
154
132
131
171
207
251
207
239
217
172
193
154
244
202
152
182
163
185
273
3 «i
Cat
fe
*U 11 JS E o
1-1
44
58
33
54
14
22
28
49
63
16
26
18
24
35
47
41
54
43
39
41
21
47
50
39
44
42
51
42
S »
£s
01 IS 1* fa 3 .
Vm
o 3.9
2.1
3.4
4.0
5.0
3.4
3.8
3.4
3.6
*j rt
S
60
II
nU
*fl
p]
2^
^
o» rH 1,10
01,
180
489
462
448
525
814
860
698
963
756
586
872
453
879
730
737
750
637
743
808
3 >§>
2|
fa H
iH
IN
21
17
24
27
22
20
24
27
29
«i S a
! ||
rt
O>-
2
s S
18 a
«i
<M «
73
74
60
48
61
72
68
60
72
68
78
V«
«»|a
8
$rt
M >-8
50 3
w *; si 118 83
80
82
12
9 15
1 15
4 14
8 19
5 11
9 11
4 11
4 77
127
121
115 96
11
6 11
8 13
2
*j rt
.X
V T
3ss
o^ _
«* ?
>la
M Po
w M ....
.... 17
13
17
21
19
19
18
17
18
rt 8 V.O
U 6
o "ri
^J
?? ........ 8.6
1.8
6.0
5.9
4.3
4.3
13 3.8
7.5
1 **
«* '
3 ! *i CD
W 0.35
.3
3oa
.42
.30
.51
.44
.002
.
J{ f
fc
|a *i oo CO ........
16 4.6 .4
6 20
9.5
10
16
23 9.3
14
*! ' 4 S 25
27
29
27
64
53
40
55
35
38
26
18
49
43
45
44
64
51
46
M V v a
uj
11V
^
0-# 0 0 0 0
.37
0 0 .0
3 .0
6 .0
5 0
M V
V * c
u§ "1 0
bA
8 0 oo
in
20
34
38
50
81
62
85
58
52
3 S 2 c
ll
S
92
129
115 95
186
100
220
178
196
198 87
107
185
167
295
199
289
189
193
> 1]
8
Vrt
w
o
**
y t
e
rt w
^
rt
CD
CO 23 .3
9 .4
5 3.
6 16
8.5
14
81
25
15
Yea
r be
ginn
ing
Apr
il 1 18
95
1896
18
97
1898
18
99
1900
19
01
1902
19
03
1904
19
05
1906
19
07
1908
19
09
1910
19
11
1912
19
13
1914
19
15
1916
19
17
1918
19
19
1920
19
21
1922
29.
Yadkin
River near
Salisbury
905
704
711
931
995
1,11
0 2,
120
1.14
0 1.
210
769
1,14
0 1,
670
1,17
0 1.
610
1,36
0
989
1,23
0 87
2 1.
110
1,53
0 1,
110
950
1.32
0 1,
300
969
1.11
0
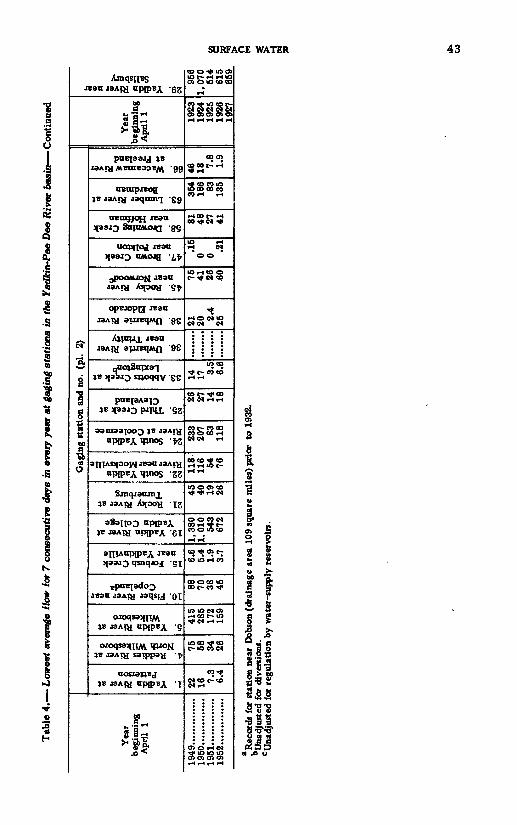
,_> |_> h-> h->
g$3£ »a>-> o to
MMoi-a cow Us
toco en -a a & oocn
l-»l-» tOrfken -a oo t-» to to en en
*k CO -3 00en oo o oo
to H" en co ^a JoJUco
MM
OiCn O CO -3$. MOO K) WOO
(O >- *t <kco too en
>- >- -a en >- »- cni^ooo
i-> »aioooco -aw
MMM to OOlt^-3O>
H«»-« C5CO-J ifr.
CO en
»a »a»a en»ao>->^
CO tO J»--J O CO t-1 en
° °. to M >- en
*k tOlt>-00 >- -4 COM
|-> Hi COCO go oo en en wo>*>.
Mltk M-3OOCO
to oo
SSSSiS -a eo cn ilico>-
sssss <o enroot
a*0"
!lr«g
1. Yadkin River at Patterson
4. Reddies River at North Wilkesboro
5. Yadkin River at Wilkesboro
10. Fisher River near Copeland3
15. Forbush Creek near Yadkinville
19. Yadkin River at Yadkin College
21. Rocky River at Turnerburg
22. South Yadkin River near Mocksville
siA. South Yadkin River at Cooleemee
25. Third Creek at Cleveland
33. Abbotts Creek at Lexington"
36. Uwharrie River near Trinity
38. Uwharrie River near Eldorado
45. Rocky River near Norwood0
41. Brown Creek near Polkton
58. Drowning Creek near Hoffman
63. Lumber River at Boardman
66. Waccamaw River at Freeland
if*2: B » ^* § n
M
Gaging station and no. (pi. 2)
29. Yadkin River near Salisbury
V3J.VM aovjans
44 WATER RESOURCES, YADKIN-PEE DEE RIVER BASIN. NORTH CAROLINA
droughts (fig. 10) the percentage change would be much greater; the flow at the 2-, 3-, 5-, and 10-year interval might be increased as much as 100 percent and the flow at the 25-year interval might be decreased as much as 50 percent. These curves do not imply a regularity of occurrence but rather the probable average interval between specified low flows. Assuming that the flow during the period April 1929 to March 1953 was normal and that future flow will follow the pattern of that measured in the past, these curves may be used to predict future streamflow.
For example, the curves in figure 9 show that daily flow will be insufficient to satisfy the needs of the hypothetical industrial plant that requires 25 mgd (0. 25 mgd per square mile from 100 square miles) at average intervals of 3 years. The average flow for 7 consecutive days will be insufficient at average intervals of 4. 4 years and the average flow for 30 consecutive days will be in sufficient at average intervals of 9 years.
The pattern of low flow in many streams becomes irregular in the lower reaches of the stream owing to regulation of the dis charge at some upstream point. The regulation frequently causes a period of very low flow of short duration within a longer period of relatively uniform flow. The minimum daily flow of these streams is often considered too limited a measure of the flow characteristics for many uses of the water. Where the regulation is minor and when it occurs in uniform weekly patterns, the aver age 7-day flow is a better indication of the flow characteristics of the stream. The lowest average 7-day flow for each year of rec ord at gaging stations in the Yadkin-Pee Dee River basin is shown in table 4.
MAXIMUM PERIOD OF DEFICIENT DISCHARGE
Useful analyses of low-flow characteristics may also include curves that indicate the maximum number of consecutive days during which the flow was less than a specified discharge. The maximum period of deficient discharge that may be expected for gaging stations in the Yadkin-Pee Dee River basin for a 25-year period in which the flow pattern was similar to that for 1929 53 is shown in figures 11, 12, and 13 and listed in table 5. Although the flows of some streams listed in this table are affected by regulation or diversion, the effect is not appreciable. Again using the hypothetical industrial plant site, assume it is necessary to know the maximum number of consecutive days, even in unusual years, when the flow will be less than 25 mgd. On figure 12 the curve for the period 1929-53 shows that the flow at the plant site may be expected to be less than 0. 25 mgd per square mile, or 25 mgd where the drainage area is 100 square miles for not more than 24 consecutive days.
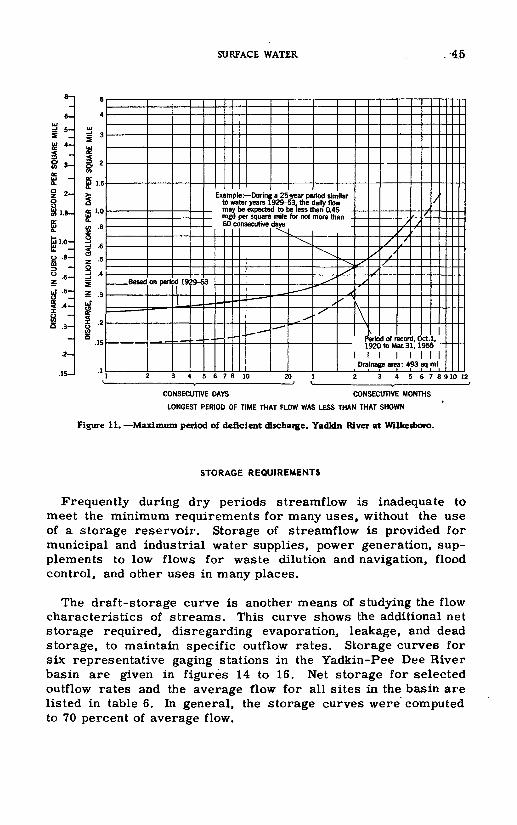
SURFACE WATER .-4.5
.2-
.15-
4
85 1.5
1oc 1.0
a) .8
I'z * o3 *sZ 3
DISCHARGE, 1
5 N> i
___ Based
.
on peri
-
x!19
!9-S 3
Example: During a 25-year period sin- to water years 1929-53, the daily fkn may be expected to be less than 0.4 mgd per square mile for not more th 60 consecutive days
p» MP> .
.---*"""
^^^
--
^
^^\
^s
,^
ilarV
_s^
J' ^
Y*
/*
\ti
Dra
/
f
eric 92C
ina
/'
/
//
f
e/
d of record, C to Mac 31, 1
1 1 ;e area: 493
/
ct. 95
X)
/
i
ml
5678 10 4 5 6 7 8 910 12
CONSECUTIVE DAYS CONSECUTIVE MONTHS
LONGEST PERIOD OF TIME THAT FLOW WAS LESS THAN THAT SHOWN
Figure 11. Maximum period of deficient discharge. Yadldn River at Wilkesboro.
STORAGE REQUIREMENTS
Frequently during dry periods streamflow is inadequate to meet the minimum requirements for many uses, without the use of a storage reservoir. Storage of streamflow is provided for municipal and industrial water supplies, power generation, sup plements to low flows for waste dilution and navigation, flood control, and other uses in many places.
The draft-storage curve is another means of studying the flow characteristics of streams. This curve shows the additional net storage required, disregarding evaporation, leakage, and dead storage, to maintain specific outflow rates. Storage curves for six representative gaging stations in the Yadkin-Pee Dee River basin are given in figures 14 to 16. Net storage for selected outflow rates and the average flow for all sites in the basin are listed in table 6. In general, the storage curves were computed to 70 percent of average flow.

46 WATER RESOURCES. YADHN-PEE DEE RIVER BASIN. NORTH CAROLINA
1.0-
8.2^ toatE.i5-b £M - 1:3.oe-z uT .06
< 05 X _
M .04-
DAY PER SQUARE MILE
K> u '*. in bi bo c
ILLION GALLONS PER
US 8 -
DISCHARGE, IN M 2 S 8 2 S
Based Oct.l. 1
/
^ ~-
Dnmi
KOtok
n ""'
. -
or River ne linage area IS
Base
S ofrec K31,
- -
don
srd, IKS*~~
^
F
HI I'**
,. '
+H1
vCopebn 121squt
per
"
-
as«
»
-XI
-^
lor
»-
1
t»
1i< ire
2!^
S
J
-'
mat
* ""
^\
53
V-
,192»-5
b
^"
^^^
^^\
' \
^\
>'/
\
/'^y*
XX
Based on period of record, 1929-'Example: During a 25-year period
similar to 1929-53, Hie daUyflow may be expected to be less man 0.25 mgd per square mite (or not more then 24 consecutive days
3
^^^-^
/
X
/
V?
_ BaOct
//J
\ \
sod 1,1
/,^
>3
U'
^\
mo KS
.
//^
1
1-hAr \
Drain
k sriodo to Mac
/',
4-4-/
/
\>
RiW «ea
free 31,
\ rne rea:
%
ar! 13
onraoc 70sqmi
2 345678 10 20 1 2 3456789 10 12
CONSECimVE DAYS CONSECUTIVE MONTHS
LONGEST PERIOD OF TIME THAT FLOW WAS LESS THAN THAT SHOWN
Figure 12. Maximum period of deficient discharge. Fisher River near Copeland and Rocky- River near Norwood.
As an example of the use of the storage curve, assume that the* hypothetical industrial plant at a site on Fisher River (with a drainage area of 100 square miles) is to be expanded and that the total water requirement is to be 40 mgd. With this new water supply criterion, the stream will be able to meet the demand only 86 percent of time (fig. 4) and production stoppages or cutbacks will be more frequent and of greater proportions than before the expansion. If such a restricted schedule of operation is un^ economical, it will be necessary to build a storage reservoir to maintain the flow required for continuous plant operation. The curve for the period 1929-53, figure 15, shows that a storage capacity of 12. 5 million gallons per square mile of drainage area or a total of 1, 250 million gallons, will be required to meet the sustained demand of 40 mgd (or 0. 40 mgd per square mile). To this volume must be added the amount of dead storage below the reservoir outlet and an allowance for evaporation and leakage from the reservoir.

CJ§
§, ,,,,
,DI
SCHA
RGE,
IN C
UBIC
FEE
T PE
R SE
COND
PER
SQU
ARE
MIL
E
* &
'Q fe
* i
i i
i i
i i
S 8
§ 8
8
8 b
_?
i ?
L i. rf
. f.r
»* » ?l
DISC
HARG
E, IN
MIL
LIO
N G
ALLO
NS P
ER D
AY P
ER S
QUAR
E M
ILE
fcj
S3
Q
S
fi
S
w
w
'8
82
38
82
S
S S
8
-III
--S
K§-
s^|
'git"
\\
'<
:n§
-il
sS.
s.

Tab
le 5
. M
axim
um n
umbe
r of
con
secu
tive
day
s w
hen
disc
harg
e in
the
Yad
kin-
Pee
Dee
Riv
er b
asin
was
les
s th
an t
hat
indi
cate
d, 1
929
53
No.
(p
i.
2)
1 2 3 4 5 6 7 8 9 10
11
12 13
14 15
16
17
18 19
20 21
22 23
24
Gag
ing
Sta
tion
Elk
Cre
ek a
t E
lkvil
le..... .
....
...
Mid
dle
Fork
Red
dies
Riv
er
nea
r W
ilba
r.
Red
dies
Riv
er a
t N
orth
W
ilke
sbor
o.
Yad
kin
Riv
er a
t W
ilke
sbor
o....
. M
ulbe
rry
Cre
ek n
ear
Nor
th
Wil
kesb
oro.
R
oari
ng R
iver
nea
r R
oari
ng
Riv
er.
Mit
chel
l R
iver
nea
r M
ount
ain
Park
. M
itch
ell
Riv
er n
ear
Sta
te R
oad
Ara
rat
Riv
er a
t M
ount
Air
y......
Ste
war
t C
reek
nea
r M
ount
A
iry.
A
rara
t R
iver
nea
r P
ilot
M
ount
ain.
L
ittl
e Y
adki
n R
iver
nea
r D
onna
ha.
Fo
rbus
h C
reek
nea
r Y
adki
nvil
le
Mud
dy C
reek
nea
r C
lem
mon
s...
Ree
dy C
reek
nea
r Y
adki
n C
olle
ge.
Yad
kin
Riv
er a
t Yad
kinC
olle
ge..
Dut
chm
ans
Cre
ek n
ear
Cor
natz
er.
Roc
ky R
iver
at
Tum
ersb
urg.
....
Sout
h Y
adki
n R
iver
nea
r M
ocks
vill
e.
Hun
ting
Cre
ek n
ear
Har
mon
y...
Sout
h Y
adki
n R
iver
at
Coo
leem
ee.
Dra
inag
e ar
ea
>q m
iles
)
28.8
50
13
.9
93.9
493 43
.0
122 32
.8
80.4
12
1 66.6
89
.2
287 59
.7
21.7
65
.9
111 13
.3
2.28
0 83.6
85
.5
313
153
569
Max
imum
num
ber
of c
onse
cuti
ve d
ays
duri
ng w
hich
dis
char
ge,
in m
illi
on
gal
lons
per
day
per
squ
are
mil
e,
was
les
s th
an t
hat
ind
icat
ed.
0.00
050.
002
0.01
20.
020.
034 8
0.06
1 1 25 21
0.08 12 3 3 9 37 36
0.10 26 12
12
22 47 45
0.12 39 23
23
34
58 55
0.17 1 3 8 2 64 48
48
58
76 1 72
3 20
6
0.20 2 6 4 10
16
10 34
76 61
60
69 85 8 82
15
35 22
35
0.25 15
23
1 3 6 15 22
30
24 52
94 80
76
89
100 30 92
37
55 45
56
0.30 32
43
1
10 17 3 20
26 4 36
46
40 65
110 95
91
10
3 11
1 48 98
55 72 62
75
0.50 86
92
35 72 74
54 78
76 61
88
101
100
112
140
138
146
105
128
109
130
116
130
0.60 10
5 11
5 54 96 97
80 98
96 82
110
126
121
131
158
126
142
129
155
140
0.70 12
3 12
8 71 118
116
100
120
118
108
130
145
141
151
165
145
150
0.80 14
0 14
3 84 136
135
118
139
136
146
160
160
172
180
163
1.0
168
170
115
174
165
174
'1*85
......

9^ 26 97 28 O A
01
°.°.
°.A
Q£
°.7 38 40 49 43 44 46 47 40 50 51 CO 54 5S 56 err
58 CQ
Cft 61 62 CO 64 65 66
mon
t.
Plea
sant
.
Mar
shvi
lle.
Roc
king
ham
.
Wad
esbo
rob.
Sprin
gs.
Lau
rinb
urg.
Wac
cam
aw R
iver
at
Fre e
land
...
87.4
15.8
38.8
QA
Q
65.9
174
1Q
A
11
.3
31.9
347 56
.664
.1
71.6
170
1 o
c
110 97
633
.4<*i
&.
6.0
10.0
29.2
30.5
18.9
178
421 23
.110
722
51,
220 42
.4
84.5
626
59 5 34 60
9
63 i <* 8 10 43 Q
O 77 OR 1
47
11 78 qq 35 40 6 64 88 125
106 25 64 4 15 110
27 87 51 47 56 21 80 104
135
116 33 88 39 16 28 128
44 102 65 60 75 34 98 120
145
129 45 15 119 56 20 41 59 151
Ifi
97 67 118 83 87 100 89 118
139
155
142 65 39
14.Q 89
,
60 01
113 3
177
1 7 34 41 80 Q4 94 112 39 105
1 °.
fi
148
162
150 77 80 161
OR 20 89 130
148 21 193
12 23 46 55 93 138
104
105
125 60 118
135
154
1 fiQ 155 88 100
175
110 39 8
110
161
174 42
28 36 58 66 10
414
5
110
114
1 1A
.
76 128
149
159
171
161 98 118
1 fi
c.
120 54 16 i
130
9f>
41
Qfi 70
25 55 62 80 96 123
158
128
131
155
108
146
155
180
171
11 q
145 13 140
94
40 9fi 4
160
240
258
120 52
41 69 73 90 105
133
167
135
139
121
154
183
178
130
160 30 14Q
11
0 54 47 19 178
265
271
146 92
63 39 90 91 108
126
147
14
915
0
140
i on
183
144 64 160
131 80 15 82 40 300
182
120
81 63 108
105
120
141
158
161
158
151
9ft
1
190
158 Qfi
150 qa 49 110
CO
215
150
145
130
163
158
165
9O
Q
209
175
160
14Q
183
186
120
170
163
175
190.
235
280
250
300
£ Bas
ed o
n st
ream
flow
dat
a co
llec
ted
prio
r to
div
ersi
on a
bove
gag
ing
site
by
city
of
Sta
tesv
ille
for
wat
er s
uppl
y be
ginn
ing
in M
ay 1
950.
B
ased
on
reco
rds
coll
ecte
d pr
ior
to c
onst
ruct
ion
of r
eser
voir
and
div
ersi
on a
bove
sta
tion
by
tow
n of
Wad
esbo
ro f
or w
ater
sup
ply
begi
nnin
g in
194
1.

en
O
B_
6-
5 -
4-
3-
.5-
lz
.6-
.5-
.4-
.3-
.2-
N
MILLION
GALLONS SQUA
RE MILE
bo i- ro <*> * t»
REGULATED
FLOW,
1 PER
DAY
PER
- to c*> * bi
bt
MM
M
Exa
mpl
e: D
urin
g a
25-y
ear
perio
d si
mila
r to
192
9-53
, a
stor
age
of 6
.0 m
illio
n ga
l pe
r squ
are
mile
may
be
expe
cted
to b
e re
quire
d to
mai
ntai
n a
flow
of 0
.40
m*d
pe
r sq
uare
mile
. N
o al
low
ance
mad
e fo
r ev
a so
ratio
n or
oth
er lo
sses
MM
MM
M M
MM
«
MM
M M
MM
' i
p,
MH
N c-
l"i
rain
MM
!
P*
ag
ssa
m~ ea
V »«* re
"- a.
s.
« Js V.
Ba<
"^^^
^ "^»
i
>3sq
mi
ed o
r
^^"^
-
pe
,^ . Be
O
ct
io( -^ *
ise
.17
i; Sa » d ,2
1! \» f m
91
12 «
-* f9-\
= :
e.
er tc
53 \
\ \\ \
^. ^
.*--
''"
'
tod
of re
cc
> M
ar. 3
1,
^^
^^'
>rd.
19
55
^* ^, *
*"'^
^ ^ '
^
.02
.03.
04
.06.
08.1
.2
.3
.4 .
5.6
.8
1
2 3
45
68
10
ST
ORA
GE,
IN
MIL
LIO
N G
ALLO
NS
PER
SQU
ARE
MIL
E20
30
40
60
100
I I
I I
I I
.002
.003
.0
05T
T I
I I
T
T
I i T
TH
I
I I
I I
I I
I I
I I
I I
I I
IT 1
.01
.02
.03.
04
.06
.1
.2
.3
.4
.5.6
.8
1
2 3
4 5
6 8
10
STO
RAG
E. I
N M
ILLI
ON
CU
BIC
FEE
T PE
R SQ
UAR
E M
ILE
Figu
re 1
4. S
tora
ge
requ
irem
ents
, Y
adki
n R
iver
at
Wilk
esbo
ro

SURFACE WATER 51
8 .2£
.06
o 04
36**% ,IR MY PER
«-6
1.2iz
2-<*
5.04
§£
005
. « -
Fishe Drai
rRK »K
«rnear area: 1 Ml «
Ess*
_ -
.01 .02 .0* .06
Copeland. 21 sqjniJS.
<n eriod, l
1BM ' ' ^
iased
)29-!\
^
on
ff
r^
Exa
r«f*
-4-Hperiod.
E = =
.--
Based ctl, 1
g_ v
tnpte: Ourin) 1929-53. a s
er square mile tquired to mai er square mile raporationor-w 1929-53
...->-ffR'm period of re 20 to Mar.31
-^
-'.' ^
;a2torag may
ntain . Me >ther
-- "
sord. 194
y^
>-y«:eof be aft alh
loss
^^ **
1 -
-~ Based on period of Oct.l, 1930 to Mar. 3
III 1 1
\BXPnw UKes
H.»
wriod } mill «cted of 0.4) ncen~^v
L--"
_ e
'~-
T&5
II
similar on gal toteOmgd | ladefor
^Tl"-*-^***'."***'
^
Rocky Rtw
^
jrnec rea:
f*f
<?
irH 137
-? =
V*
orwood. )sqmi
.1 .2 .4 .6 1 2 4 6 10 20 40 60
...
t*'
100
STORAGE. IN MILLION GALLONS PER SQUARE MILE l l I l 004 006 .01 KB. .04 .06 .1 .2 .4 .6
STORAGE. IN MILLION CUBIC FEET PER SQUARE MILE
Figure 15. Storage requirements, Fisher River near Copeland and Rocky River near Norwood.
FLOOD FREQUENCIES
A State-wide study of flood frequency has recently been com pleted by the Geological Survey (Riggs 1955). Results of this study allow reliable flood-frequency relations to be established for Yadkin-Pee Dee River tributaries and for Yadkin River main stem upstream from High Rock reservoir. These relations are shown for five gaging stations in the basin in figures 17 to 20. Regulation of Yadkin-Pee Dee River downstream from High Rock reservoir precludes determination of flood frequency by the usual methods.
Each frequency curve shows the average interval, in years, between floods that equal or exceed a given elevation. This does not mean that floods occur with any regularity; the recurrence intervals are average values only. It would be possible to have two floods of 50-year interval in successive years or in the same year.
Although frequency curves give average recurrence intervals only, they have much practical utility. For example, the frequency curve might be used to determine the elevation of a building in the flood plain of a river so that flood waters would reach it, on the average, only once in 50 years. Similarly, the average frequency of flooding of a road fill could be determined from the curve.
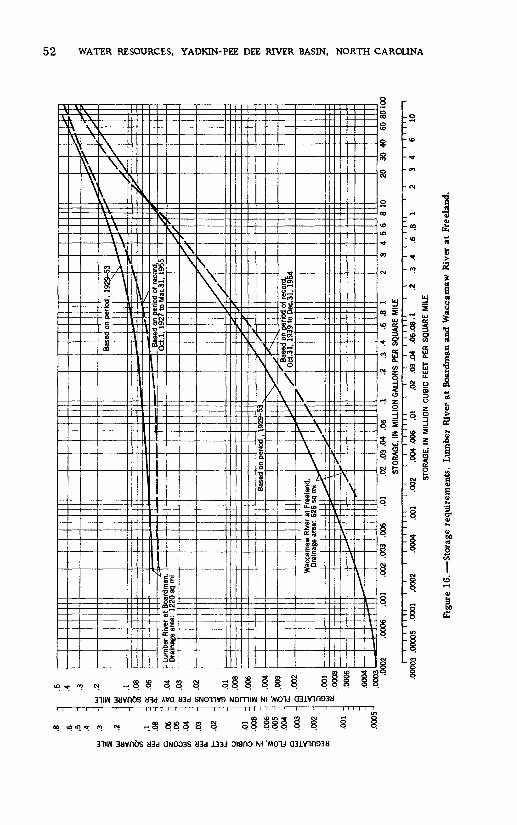
.1 .08
.06
.05
.04
.03
.02
s -01
^z
-008
H-.-
.0
06
3o
.0
05
-ui
.0
04
-
S
.003
-
=
.002
-
.001
.000
5 J
.4
.3 .2 .1
.08
.06
.04
.03
.02
.01
.008
.006
.004
.003
.002
.001
.0
008
.000
6
.000
4.0
003 .O
C-Lur
r D
ra
KI2
ber
Riv
er a
t 1
nage
are
a: 1
<
«^"
--
-1- 1 1
/
220
sq m
i
; W
acca
maw
R
Dra
inag
e ar
, «"
^^~
-^
1
*^^"^
-*
M
vera
t ea
: 62
f[~
H4
'"t
T". .
«=
?
Base
d
:reel
and,
>
sqm
i
''"^-\ \
- J>
^
i
«
on p
<
^j s^
"TIO
C
S*
,, S
^ 19 ^
^
p«
29-5 ^
^
....
3-V
^
"V X"
s^w
_
"*
/ /
Ba B Oe s ^
sed
S K^
ase
t.l ^ X1
^
0 9
d 1 7 ^-
n !>< s*
i od
, 19
29-
= '=
=
]
~>^_
Dn p
erio
d ot
rec
c 92
7 to
Mar
.31,
rf'
.j,
^
//
,'
>3 >--
ird,
95^5 / X
'Ba
se
d o
n pe
riod
of r
ecor
d,
Oct
.31,
193
9 to
Dec
.31,
195
4
^"
X
»^ *? /
''-' ,'*
r*
;::^
~ A X
X..^j_
<'
^ ^
^ * /
& /
*'
r~ -
1* ^X
(,'
/ --
.000
6 .0
01
.002
.0
03
.006
.0
1 .0
2 .0
3.0
4
.06
.1
.2
.3
.4
.6
.8
1 2
3 4
5 6
S 1
0 20
30
40
6
08
01
00
STO
RAG
E, I
N M
ILLI
ON
GAL
LON
S PE
R SQ
UAR
E M
ILE
.000
03 .00005
.0001
.000
2.0
004
.001
.002
.0
04.0
06
.01
.02
.03.
04
.06
.08
.1
.2
STO
RAG
E, I
N M
ILLI
ON
CU
BIC
FEE
T PE
R SQ
UAR
E M
ILE
.3
.4
.6
.8
13
410
Fig
ure
16. S
tora
ge r
equi
rem
ents
, L
umbe
r R
iver
at
Boa
rdm
an a
nd W
acca
maw
Riv
er a
t Fr
e el
and.
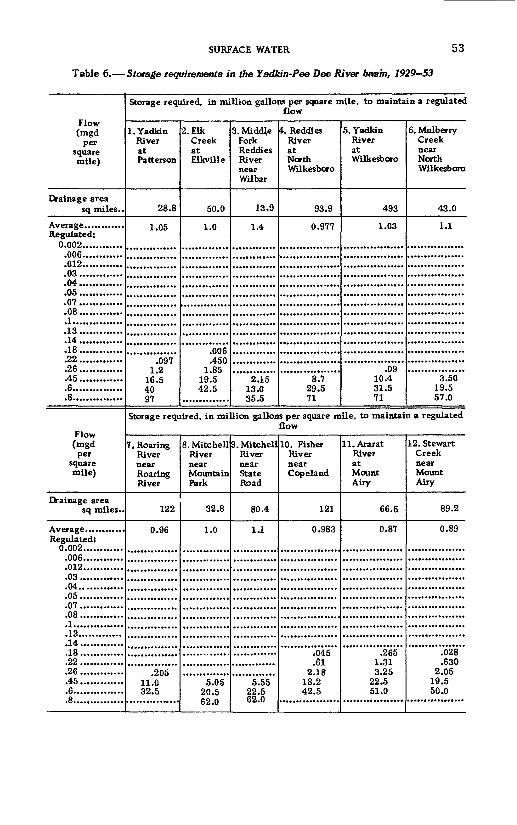
SURFACE WATER 53
Table 6. Storage requirements in the Yadkin-Pee Dee River basin, 1929 53
Flow (mgd
per square mile)
Drainage area sq miles..
AveraeeRegulated:
0.002.............006.............012.............03 ............ ..04..............05 ..............07 ..............08 ............ ..1................13 ............ ..14 ............ ..18..............22..............26..............45 ..............6................8...............
Flow (mgd per
square mile)
Drainage area sq miles..
Regulated: 0.002.............006.............012.. ...........03 ..............04..............05..............07..............08 ..............1......... .......13..............14 ........... ...18 ..............22 ..............26 .......... ....45 ..............6...............
Storage required, in million gallons per square mile, to maintain a regulated flow
1. Yadton River at Patterson
28.8
1.05
.097 1.2
16.5 40 97
2. Elk Creek at Elkville
50.0
1.0
.006
.450 1.85
19.5 42.5
3. Middje Fork Reddies River near Wilbar
13.9
1.4
2.15 13.0 35.5
4. Reddies River at North Wilkesboro
93.9
0.977
8.7 29.5 71
5. Yadkin River at Wilkesboro
493
1.03
.09 10.4 31.5 71
6. Mulberry Creek near North Wilkesboro
43.0
1.1
3.50 19.5 57.0
Storage required, in million gallons per square mile, to maintain a regulated flow
7. Roaring River near Roaring River
122
0.96
9ft 1*
11.0 32.5
8. Mitchell River near Mountain Park
32.8
1.0
5.05 20.5 62.0
9. Mitchell River near State Road
80.4
1.1
5.55 22.5 62.0
10. Fisher River near Cop eland
121
0.983
,045 .61
2.18 18.2 42.5
11. Ararat River at Mount Airy
66.6
0.87
.265 1.31 3.25
22.5 51.0
12. Stewart Creek near Mount Airy
89.2
0.89
.028
.630 2.05
19.5 50.0
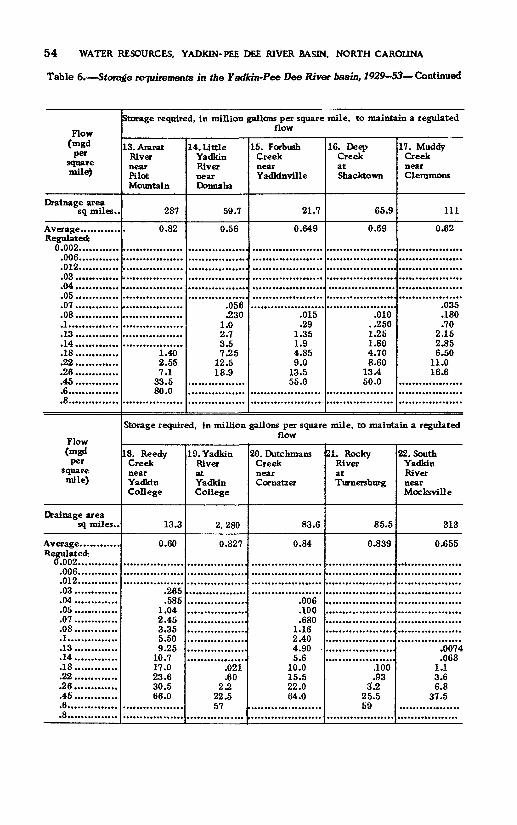
54 WATER RESOURCES. YADKIN-PEE DEE RIVER BASIN, NORTH CAROLINA
Table 6. Storage requirements in the Yadkin-Pee Dee Rivet basin, 1929-53 Continued
Flow (mgd
per square mile)
Drainage area sq miles..
Regulated: 0.002.............006............m9(M.04..............05 ..............07 ..............08..............1................13 ..............14..............18..............22..............26.............45.6................8...............
Flow (mgd
per square mile)
Drainage area sq miles..
Regulated; 0.002.............006.............012.............03..............04..............05..............07..............08..............1................13..............14..............18..............22..............26..............45..............6................8...............
Storage required, in million gallons per square mile, to maintain a regulated flow
13. Ararat River near Pilot Mountain
287
0.82
1.40 2.55 7.1
33.5 80.0
14. Little Yadkin River near Donnaha
59.7
0.56
.056
.230 1.0 2.7 3.5 7.25
12.5 18.9
15. Forbush Creek near Yadkinville
21.7
0.649
.015
.29 1.35 1.9 4.85 9.0
13.5 55.0
16. Deep Creek at Shacktown
65.9
0.69
.010 ..250 1.25 1.80 4.70 8.60
13.4 50.0
17. Muddy Creek near Clemmons
111
0.62
.035
.180
.70 2.15 2.85 6.50
11.0 16.6
Storage required, in million gallons per square mile, to maintain a regulated flow
18. Reedy Creek near Yadkin College
13.3
0.60
.265
.585 1.04 2.45 3.35 5.50 9.25
10.7 17.0 23.6 30.5 66.0
19. Yadkin River at Yadkin College
2,280
0.827
.021
.60 2.2
22.5 57
20. Dutchmans Creek near Cornatzer
83.6
0.84
.006
.100
.680 1.16 2.40 4.90 5.6
10.0 15.5 22.0 64.0
21. Rocky River at Turnersburg
85.5
0.839
.100 .93
3'.2 25.5 59
22. South Yadkin River near Mocksville
313
0.655
.0074
.068 1.1 3.6 6.8
37.5
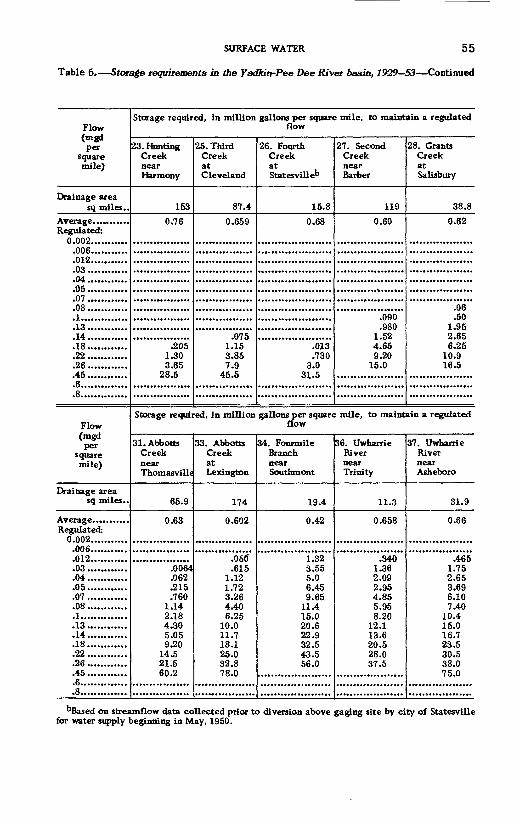
SURFACE WATER 55
Table 6. Storage requirements in the Yadkin-Pee Dee Rivet basin, 1929 53 Continued
Flow (mgd per
square mile)
Drainage area sq miles..
Regulated: 0.002............006............012...........f)0
(VI.05 .............07 .............08 ........... ..1..............11
.14 ........... .
.18 ........... .
.22............
.26............
.45............
.6..............
.8..............
Flow (mgd per
square mile)
Drainage area sq miles..
Regulated: 0.002............006............012...........f)0
.04............
.05............
.07 ............
.08............
.1..............1^
.14............
.18............
.22............
.26............
.45............
.6..............
.8..............
Storage required, in million gallons per square mile, to maintain a regulatednow
23. Hunting Creek near Harmony
153
0.76
.205 1.30 3.65
28.5
25. Third Creek at Cleveland
87.4
0.659
.075 1.15 3.85 7.9
45.5
26. Fourth Creek
StatesvUleb
15.8
0.68
.013
.730 3.0
31.5
27. Second Creek near Barber
119
0.60
.090
.980 1.52 4.65 9.20
15.0
28. Grants Creek at Salisbury
38.8
0.62
.06
.50 1.95 2.65 6.25
10.9 16.5
Storage required, in million gallons per square mile, to maintain a regulated now
Sl.Abbotts Creek near Thomasvillt
65.9
0.63
.0064
.062
.215
.760 1.14 2.18 4.30 5.05 9.20
14.5 21.5 60.2
33. Abbotts Creek at Lexington
174
0.602
.050'
.615 1.12 1.72 3.26 4.40 6.25
10.0 11.7 18.1 25.0 32.8 78.0
34. Fourmile Branch near Southmont
19.4
0.42
1.32 3.55 5.0 6.45 9.65
11.4 15.0 20.6 22.9 32.5 43.5 56.0
36. Uwharrie River near Trinity
11.3
0.658
.340 1.36 2.09 2.95 4.85 5.95 8.20
12.1 13.6 20.5 28.0 37.5
37. Uwharrie River near Asheboro
31.9
0.66
.465 1.75 2.65 3.69 6.10 7.40
10.4 15.0 16.7 23.5 30.5 38.0 75.0
bBased on streamflow data collected prior to diversion above gaging site by city of Statesville for water supply beginning in May, 1950.

56 WATER RESOURCES, YADKIN-PEE DEE RIVER BASIN, NORTH CAROLINA
Table 6. Storage requirements in the Yadkin-Pee Dee River basin, 1929 53 Continued
Flow (mgd
per square mile)
Drainage area sq miles..
Regulated: 0.002............006............012...........no
.04 ............
.05 ............
.07 ............
.08............
.1..............
.13............14..18............99
.26 ............
.45 ............
.6..............
.8..............
Flow (mgd
per square mile)
Drainage area sq miles..
Regulated: 0.002...........006...........012...........03 .......... .04.
.05 .......... .
.07 .......... .
.08...........
.1.............
.13...........
.14 .......... .
.18...........
.22...........
.26 ...........
.45 ...........
.6.............
.8....... ......
Storage required, in million gallons per square mile, to maintain a regulated flow
38. Uwharrie River near Eldorado
347
0.603
.008
.10
.345 1.49 2.35 3.30 5.35 6.75 9.60
14.5 16.1 24.2 33.5 44.0
130
40. Coddle Creek \ near Concord
56.6
0.66
.250
.590 1.70 4.40 5.35
10.0 15.8 22.8
42. Dutch Buffalo Creek at Mount
Pleasant
64.1
0.64
.0175
.450 1.09 2.0 4.1 5.5 8.60
14.0 15.6 24.0 33.0 42.5
43. Big Bear Creek near Albexnarle
71.6
0.60
.006
.145
.570 2.45 3.75 5.20 8.30
10.1 14.0 20.1 22.5 32.5 42.5 54.0
44. Richardson Creek near Marshville
170
0.50
.380 1.08 3.65 5.10 7.10
11.0 14 17.1 24.5 27.5 39.5
Storage required, in million gallons per square mile, to maintain a regulated flow
46. Little Brown Cre<& near Polkton
13.5
0.50
960 2.1
.30 8.80
11.5 16.8 19.8 25.5 36.0 40.0 60.0 92.5
47. Brown Creek near Polkton
110
0.489
.191
.70 1.69 5.10 7.0 9.10
13.5 16.0 21.1 29.9 32.5 45.5 62.5 86.0
49. Little River near Star
97.6
0.985 1.60 2.25 3.55 4.35 6.0 9.05
10.4 15.4 21.5 29.0 76.5
50. Mountain Creek near Ellerbe
33.4
0.64
.060
.295
.710 1.91 2.65 4.50 8.0 9.20
15.1 22.0 30.5
51. Cartledge Creek near Rockingham
31.4
0.55
.520 2.05 3.15 4.50 7.40 9.05
13.0 19.1 21.9 32.9 45.0 60.0
155

SURFACE WATER 57
Table 6. Storage requirements in the Yadkin-Pee Dee River basin, 1929 53 Continued
Flow (mgd
per square mile)
Drainage area sq miles..
Regulated: 0.002............006...........ni9ni04.05.............07............nc.1..............1 1.14............1ft
.22 ............9fi.45 .............6...............8. .............
Flow (mgd per
square mile)
Drainage area sq miles..
Regulated: 0.002............006...........
A1 O
.03 ........... .
.04 ............
.05............
.07............
.08............
.1. .............
.13 ........... .
.14 ........... .
.18 ........... .
.22 ........... .
.26 ........... .
.45 ........... .
.6. . ........... .
.8..............
Storage required, in million gallons per square mile, to maintain a regulated flow
53. Falling Creek near Rocking ham
6.0
0.95
.0104
.540 2.15 4.65
27.0 82.0
120
54. North Fork Jones Creek near Wadesboroc
10.0
0.64
1.56 2.45 4.25 5.15 7.65
12.1 13.9 21.1 29.5 38.5
55. Marks Creek near Osborne
29.2
0.91
.010
.062
.355 1.35 1.75 4.15 7.15
11.0 37.0 66.5
115
56. Drowning Creek near Jackson Springs
30.5
1.1
.115
.680 1.00 2.65 5.00 8.10
31.5 58.0
100
57. Deep Creek near Roseland
18.9
0.96
.070
.70 14.5 37.5 88.5
Storage required, in million gallons per square mile, to maintain a regulated flow
58. Drowning Creek near Hoffman
178
0.937
.05
.150 1.3 3.35 6.25
31.5 64.0
59. Lumber River near Pembroke
421
0.94
.040
.500 1.65
20.5 48.5
110
60. Little Raft Swamp at Red Springs
23.1
0.53
.375
.900 2.20 3.05 5.00 8.70
10.1 16.8 24 33.6
115
61. Raft Swamp near Lumberton
107
0.37
.030
.405
.90 1.60 3.50 4.75 7.70
13.3 15.5 25.0 36.5 50
62. Big Swamp near Tarheel
225
.0165
.094
.785 1.45 2.30 4.70 6.10 9.70
16.0 19.0 30.5 46.0 64.0
cBased on records collected prior to construction of reservoir and diversion above station by town of Wadesboro for water supply beginning in 1941.

58 WATER RESOURCES, YADKIN-PEE DEE RIVER BASIN, NORTH CAROLINA
Table 6. Storage requirements in the Yadkin-Pee Dee River basin, 1929-53 Continued
Flow (mgd per
square mile)
Drainage area........sq miles..
Regulated: 0.002..............................006..............................012..............................03 ..............................04.05...............................07...............................08...............................1.............. ............... ....13 ........................... ....14...............................18...............................22...............................26...............................45...............................6.................................8................................
Storage required, in million gallons per square mile, to maintain a regulated flow
63. Lumber River at Boardman
1,220
0.650
.069
.245 1.10 3.35 4.0 8.6
15.0 22.5 74.0
64. Gum Swamp Creek near Laurinburg
42.4
0.99
5.25 26.5 85.0
65. Shoeheel Creek near Laurinburg
84.5
0.70
.003
.30
.60 2.60 5.80
10.0 46.0
100
66. Waccamaw River at Freeland
626
0.659
.060
.405 1.23 3.85 5.80 7.90
12.5 15.0 20.5 29.0 32.5 45.0 60.5 79.0
191
However, there are problems in which data on flood frequencies at certain times of the year are needed. To meet this need, sum mer and winter flood frequency curves are presented. The sum mer period extends from May 1 to October 31, and the winter period is the remaining 6 months of the year. These curves may be used to determine the probability of occurrence of a given flood in the selected season.
For example suppose that a construction project is proposed for a location in the vicinity of Rocky River near Norwood at an elevation of 237 feet above sea level. By use of figure 19 recurrence interval of winter floods reaching that height may be determined as 5.3 years. This means that there is about a 1 to 5 chance that the work will be interrupted by flooding if it is done in a winter season. Similarly, from the curve for summer floods the chances are about 1 to 4 that the work would be interrupted if it is done in a summer season. In the example cited the probability of flooding is greater in summer than in winter. Conversely, if the elevation at the pro posed project site is lower than 234 feet above mean sea level the curves in figure 19 indicate that the probability of flooding in sum mer is less than in winter but, of course, much greater than at higher elevations. The curve for summer floods could also be used to evaluate the risk of farming on a flood plain or of putting the flood plain to other seasonal use.

SURFACE WATER 59
970
960
950
/ Summer floods (MayltoOct.31)
Winter floods (Nov. 1 to Ape 30)
.4 .5 .6 .7.8 1.0 202 3 45678 10
RECURRENCE INTERVAL, IN YEARS
Figure 17. Flood-stage frequencies, Yadkin River at Wilkesboro.
30 40
In general, the curve for frequency of all floods should be used in design of structures that are made to last for several years and the seasonal curves to evaluate the risk of flooding in a single sea son. The design of dam spillways or other structures, whose failure will result in considerable damage or loss of life down stream, is usually based on analyses involving maximum known floods rather than a flood of a specified frequency.
QUALITY OF SURFACE WATERS
Chemical quality of water in the Yadkin-Pee Dee River basin was first studied in 1906. Daily samples were collected from the Pee Dee River near Pee Dee for a period of 1 year and samples were collected intermittently and analyzed during the year 1925 26. A continuing cooperative program to determine the chemical quality of surface waters in North Carolina was established in 1943. between the U. S. Geological Survey and the North Carolina

60 WATER RESOURCES, YADKIN-PEE DEE RIVER BASIN, NORTH CAROLINA
670
660
650
>
/
/
/
/
j,
/
/
/
f
'
t
/
/
t
/
,.'
f-
/
/ A
//
/
/
+
/
//X
/f
' ' ,
/
t
X
/
/
'
i*
/
i
'
All floods^
/$/Summer fk '(May 1 to Ck
.X
/t
Mds ±31)
^Winter floods (Nov. 1 to Apr. 30)
/
/
-
\ .5.6.7.8514) 2 3 45678 910 20 304051
RECURRENCE INTERVAL, IN YEARS
Figure 18. Flood-stage frequencies, Yadkin River at Yadkin College.
Department of Conservation and Development. Eleven daily and 5 monthly sampling stations for chemical quality studies have been in operation on streams in the Yadkin-Pee Dee River basin for at least 1 year since 1943. Data for these stations are sum marized in table 7. In addition to the daily and monthly sampling stations, samples for chemical analyses have been collected in termittently at all complete and partial-record gaging stations

SURFACE WATER 61
250
240
230
220
/s'
/
/
/
'
/
/
/
/
f
/
f
/i
//
/ t/
f
J
A
//
j/^
/ff
Al
/
/
'*
Exar ft avsu A ex
floods
,'
I
.
\nple may erag mm< flood pect wint
/
-i
1
r A be e in ;ra rec
edt era
//f
sf
fit exp ter tav ch0 Cta
t' ,
/
X)Ctec rat ler ng cc vei
/ *
tSi
(Mi
'
n te sc ag «
jr ag
/'
//f
\
/
\ immer floods yltoOctSl) /
/
A
'
\ Winter floods
(Nov.ltoApr.30)
tajtf e i lis ei
ching an eleve o occur in the 5.3 years and ntervals of 4.C same elevatii her during th ntervals of 2.
tion of : winter < in the ) years, in may e summ 2 years
Y
137 it
ie er
.6 .8 2 34 6 8 10
RECURRENCE INTERVAL, IN YEARS
20 30 40
Figure 19. Flood-stage frequencies, Rocky River near Norwood.
within the basin. These data are published annually in North Carolina Department of Conservation and Development, Bulletin 52. Figure 21 shows the average chemical composition of the dissolved solids of the surface water at each of the daily sampling stations in the basin during the period 1943 53. The relation of hardness to dissolved solids in surface waters in the Yadkin-Pee River basin is shown in figure 22.
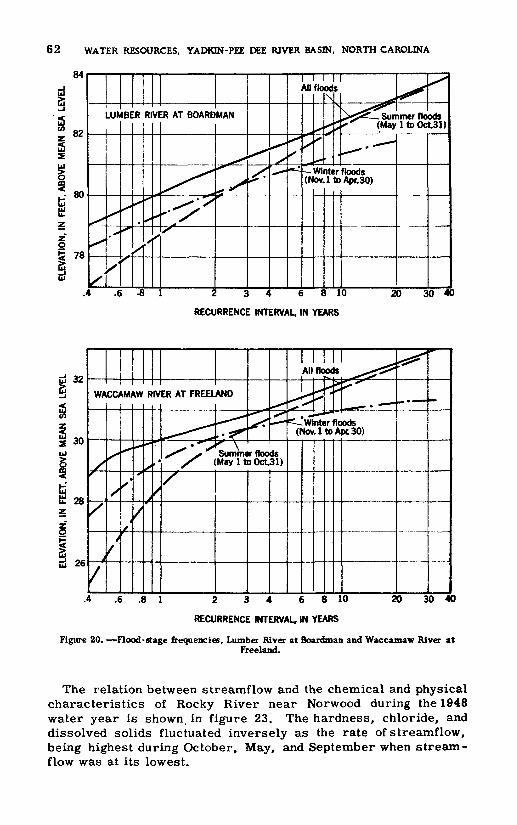
62 WATER RESOURCES. YADKIN-PEE DEE RIVER BASIN, NORTH CAROLINA
84
82
- 80
LUII
X^
^
,
X"
"
x-
IBE
X
X*
^
.R
X
X
Rl
X1
X
,/
VI
X
X
[R AT BOARD
X<<xx
MAN
^
x-^
^
x^*
Xx*-
X**
X
All
X
flo
xx
x-
odN
x ^
,
!
» ^
-- *
>^^-_Sun ^^ (May
-Winter floods (Nov.ltoApr.30)
x>"
imerflo ItoOc
-
X^
>ds t31)
4 .6 -8 1 2 34 68 10 20 30 4C
RECURRENCE INTERVAL, IN YEARS
78
.4 .6 .8 1 2 34 6 8 10
RECURRENCE INTERVAL, IN YEARS
20 30
Figure 20. Flood-stage frequencies, Lumber River at Boardman and Waccamaw River atFreeland.
The relation between streamflow and the chemical and physical characteristics of Rocky River near Norwood during the 1948 water year is shown, in figure 23. The hardness, chloride, and dissolved solids fluctuated inversely as the rate of streamflow, being highest during October, May, and September when stream - flow was at its lowest.

Tab
le 7
. S
umm
ary
of c
hem
ical
ana
lyse
s of
wat
er f
rom
str
eam
s in
the
Yad
kin-
Pee
Dee
Riv
er b
asin
[Che
mic
al c
onst
itue
nts
in p
arts
per
mil
lion
. Se
e fi
gure
5 f
or l
ocat
ion
of g
agin
g st
atio
ns]
Sil
ica
(SiO
j)...
. ...
....
....
....
....
....
....
....
....
....
....
....
. .Ir
on (
Fe)
....
. ...
....
....
....
....
....
....
....
....
....
....
....
....
..
Pota
ssiu
m (
K).
. ...
....
....
....
....
....
....
....
....
....
....
....
..B
icar
bona
te (
HC
Og)
... ..
....
....
....
....
....
....
....
....
....
...
Sul
fate
(S04
)....
........... .
....................................
Chl
orid
e (C
l) ...
....
....
.. ......................................
Flu
orid
e (F
)..... ..
....
....
....
....
....
....
....
....
....
....
....
...
Nit
rate
<N
Os)
......
. .............................................
Dis
solv
ed s
olid
s (r
esid
ue o
n ev
apor
atio
n at
180
*C).
....
pH
.................................................................
1,
Yad
kin
Riv
er a
t P
atte
rson
O
ct.
1947
to
Sep
t. 19
48
Max
imum 40
2
12 .0
6 3.
2 1.
3
} 5.
0 19
2.6
1.8 .3
.6
32
13
24
7.4
Min
imum
17
8.9 .0
2 1.
4 .8
2.4
11 1.5
1.0 .0
.0
24
7 3 6.6
Ave
rage
56.3
11 .0
3 2.
2 1.
0
3.3
15 2.0
1.3 .1
.3
29
10 8 6.9
5,
Yad
kin
Riv
er a
t W
ilkes
boro
O
ct.
1947
to
Sep
t. 19
48
Max
imum
5,4
40
14 .1
3 3.
3 1.
4
5.3
20 3.0
2.2 .2
.5
37
14
14
7.6
Min
imum 27
7
9.7 .0
1 1.
8 .7 1.8
12 1.4
1.0 .0
,0
27
6 2 6.6
Ave
rage 94
6
12 .0
4 2.
3 1.
0
3.3
15 2.1
1.4 .1
.3
32
10
7 7.0
10,
Fis
her
Riv
er n
ear
Cop
ela
nd
Oct
. 19
47 t
o S
ept.
1948
Max
imum
1.52
0
11 .0
9 2.
8 1.
2
3.4
15 3.8
2.0 .1
.5
30
11
16
7.2
Min
imum
61
5.8 .0
1 1.
6 .8 .6
9 1.2 .9
.0
.1
22
7 2 6.5
Ave
rage 19
4
8.5 .0
4 2.
1 1.
0
2.2
11 2.4
1.2 .1
.2
25
9 5 6.8
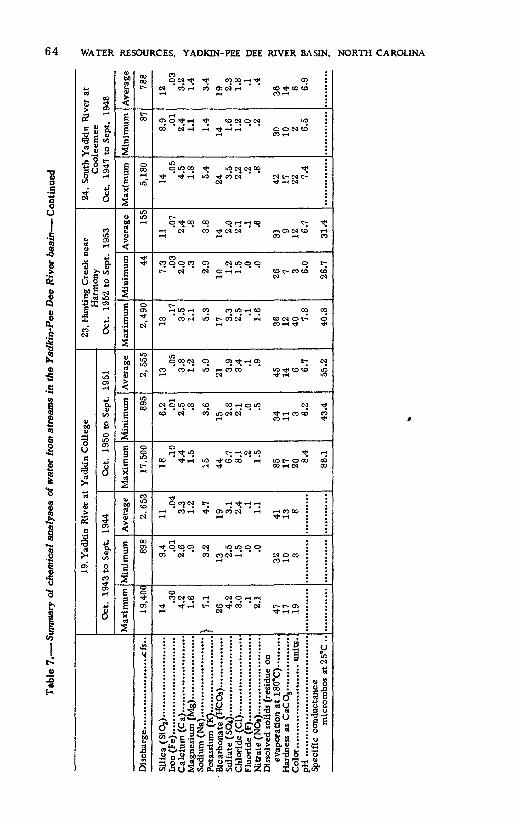
Tab
le 7
. S
umm
ary
of c
hem
ical
an
alys
es o
f w
ater
fro
m s
trea
ms
in t
he Y
adki
n-P
ee D
ee R
iver
bas
in C
on
tin
ued
Sil
ica
(SiO
j)..
....
.. ..
..............
Iron
(F
e)..... .
....
....
....
....
....
.. .
Sodi
um (
Na)
... ..
....
....
....
....
...
Sul
fate
(S
04).
............ ..
.........
Chl
orid
e (C
l)........................
Nit
rate
(N
Os)
........... .
............
Dis
solv
ed s
olid
s (r
esid
ue o
n
»T
Spe
cifi
c co
nduc
tanc
e
19, Y
adki
n R
iver
at
Yad
kin
Col
lege
Oct
. 19
43 t
o S
ept.
1944
Max
imum
19,4
00
14 .3
0 4.
2 1.
6
}
26 4.2
3.0 .1
2.
1
47
17
19
Min
imum 89
8
9.4 .0
1 2.
6 .9 3.2
13 2.5
1.5 .0
.0
32
10 3
Ave
rage
2,65
3
11 .0
4 3.
3 1.
2
4.7
19 3.1
2.4 .1
1.
1
41
13 8
Oct
. 19
50 t
o S
ept.
1951
Max
imum
17,5
00
18 .1
0 4.
4 1.
5
15 44 6.7
8.1 .2
1.
5
85
17
20 8.4
88.1
Min
imum 89
5
6.2 .01
2.5 .8 3.6
15 2.8
2.1 .0
.5
34
, 11
3 6.2
43.4
Ave
rage
2,55
5
13 .0
5 3.
8 1.
2
5.9
21 3.9
3.4 .1
.9
45
14 6 6.7
55.2
23,
Hun
ting
Cre
ek n
ear
Har
mon
y O
ct.
1952
to
Sep
t. 19
53
Max
imum
2,49
0
13 .1
7 3.
5 1.
1
5.3
17 3.3
2.5 .1
1.
6
36
12
407.
8
40.8
Min
imum 44
7.3 .0
3 2.
0 .3
2.9
10 1.2
1.5 .0
.0
26 7 3 6.0
26.7
Ave
rage 15
5
11 .0
7 2.
4 .8
3.8
14 2.0
2.1 .1
.6
319 12 6.7
31.4
24,
Sou
th Y
adki
n R
iver
at
Coo
leem
ee
Oct
. 19
47 t
o S
ept.
19
48
Max
imum
5,18
0
14 .0
5 4.
5 1.
8
5.4
24 3.5
2.2 .2
.8
42
17
22 7.4
Min
imum 87
8.9 .0
1 2.
4 1.
1
1.4
14 1.6
1.2 .0
.2
30
10 2 6.5
Ave
rage
788
12 .0
3 3.
2 1.
4
3.4
19 2.3
1.8 .1
.4
36
14 6 6.9
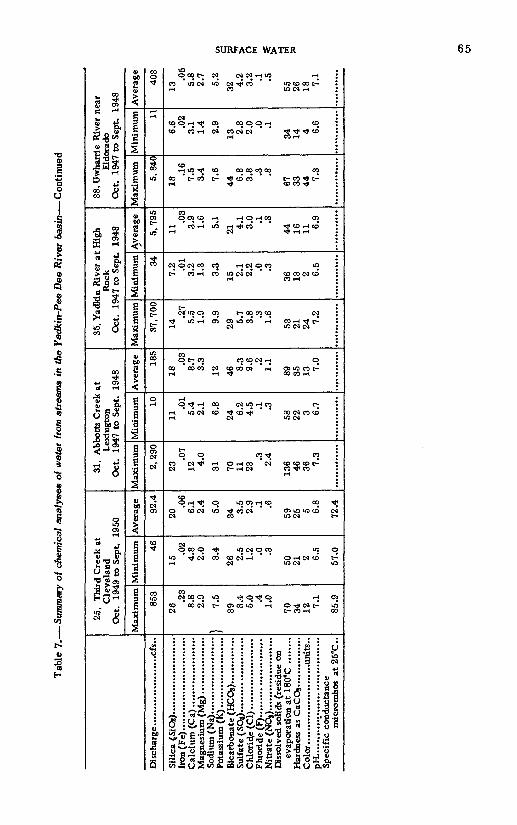
Tab
le 7
. S
um
mar
y o
f ch
emic
al a
naly
ses
of w
ater
fro
m s
trea
ms
in t
he Y
adki
n-P
ee D
ee R
iver
ba
sin
Con
tinue
d
Dis
char
ge. .
....
....
....
. ......c
fs..
Sil
ica
<S
iOz)
....
....
....
....
....
...
Sul
fate
(S
Qi)
......... .............
Chl
orid
e (C
l) .....................
Nit
rate
(N
O,)
....
... .
....
....
....
..D
isso
lved
sol
ids
(res
idue
on
Col
or. .
.................... ..
unit
s..
PH
....
....
....
....
....
....
....
....
...
Spe
cifi
c co
nduc
tanc
e m
icro
mho
s at
25*
C..
25,
Thi
rd C
reek
at
Cle
vel
and
Oct
. 19
49 t
o S
ept.
1950
Max
imum 85
3
26 .2
3 8.
8 2.
9
} 7.
5
39 8.4
5.0 .4
1.
0
70
34
12 7.1
85.9
Min
imum 46
15 .0
2 4.
8 2.
0
3.4
26 2.5
1.2 .0
.3
50
21 2 6.5
57.0
Ave
rage 92
.4
20 .0
6 6.
1 2.
4
5.0
34 3.5
2.9 .1
.6
59
25 5 6.8
72.4
31,
Abb
otts
Cre
ek a
t L
exin
gton
O
ct.
1947
to
Sep
t. 19
48
Max
imum
2,2
90
23 .0
7 12
4.0
31 70
11
23 .3
2.
4
136 46
36 7.3
Min
imum 10
11 .0
1 5.
4 2.
1
6.8
24 6.2
4.5 .1
.3
58
22 3 6.7
Ave
rage 18
5
18 .0
3 8.
7 3.
3
12 46 8.3
9.6 .2
1.
1
89
35
13 7.0
35, Y
adW
n R
iver
at
Hig
h R
ock
Oct
. 19
47 t
o S
ept.
1948
Max
imum
37,7
00
14 .3
7 5.
5 1.
9
9.9
29 5.7
3.8 .3
1.
6
53
21
24 7.2
Min
imum 34
7.2 .0
1 3.
2 1.
3
3.3
15 2.1
2.2 .0
.3
36
13 2 6.5
Ave
rage
5.79
5
11 .0
3 3.
9 1.
6
5.1
21 4.1
3.0 .1
.8
44
16
11 6.9
38, U
wha
rrie
Riv
er n
ear
Eld
orad
o O
ct.
1947
to
Sep
t. 19
48
Max
imum
5,84
0
18 .1
6 7.
5 3.
4
7.6
44 6.8
3.8 .3
.8
67
33 447.
3
Min
imum
11
6.6 .0
2 3.
1 1.
4
2.9
13 2.8
2.0 .0
.1
34
14 4 6.6
Ave
rage 40
3
13 .0
5 5.
8 2.
7
5.2
32 4.2
3.2 .1
.5
55 26
18 7.1

Tab
le 7
. S
umm
ary
of c
hem
ical
ana
lyse
s of
wat
er fr
om s
trea
ms
in t
he Y
adki
n-P
ee D
ee R
iver
bas
in C
ontin
ued
en
en
<H
li<
-a fS
iCl*
}
Iron
(F
e).................. ..
....
.....
Sodi
um (
Na)
. .......................
Sulf
ate
($04).
........ ..
............
Chl
orid
e (C
l) ...
....
....
....
....
...
Nit
rate
(N
Oj)
....
....
....
....
....
...
Dis
solv
ed s
olid
s (r
esid
ue o
n
Col
or. .
............ ..
.... ..
...un
its.
. PH
....
....
....
....
....
....
....
....
....
.S
peci
fic
cond
ucta
nce
mic
rom
hos
at 2
5"C
..
43,
Bea
r C
reek
nea
r A
lbem
arle
O
ct.
1951
to
Sep
t. 19
52
Max
imum
13 .2
1 7.
4 3.
0
} 8.
3
34 8.1
8.6 .2
22 82
30
25
7.4
94.8
Min
imum 4.
8 .03
3.3
1.7
3.7
8 3.3
4.0 .0
.2
40
15 4 5.7
.54.
2
Ave
rage
9.9 .0
8 5.
1 2.
3
5.9
23 5.6
5.7 .1
2.
6
53
22
13 6.7
75.3
45,
Roc
ky R
iver
nea
r N
orw
ood
Max
imum
30,6
00
16 .2
3 11
4.8
45 109 14
30
.3
2.4
172 47
34 7.7
Min
imum 69
3.8 .01
3.4
1.8
5.5
16 5.9
4.0 .1
.1
43
16 6 6.5
Ave
rage
1,78
3
11 .0
3 6.
4 2.
9
14 41 8.4
10 .2
.8
79
28
15 7.1
52,
Pee
Dee
Riv
er n
ear
Roc
king
ham
Oct
. 19
46 t
o Se
pt.
1947
Max
imum
43,9
00
13 .0
9 5.
2 2.
1
9.8
30 6.5
8.8 .2
1.
7
57
21
52 7.25
Min
imum 31
4
4.7 .0
2 3.
8 1.
6
4.9
18 3.8
3.1 .0
.4
44
16 3 6.4
Ave
rage
6,09
1
9.9 .0
3 4.
3 1.
8
6.6
24 4.8
4.6 .1
.9
50
18
20 6.9
Oct
. 19
47 t
o S
ept.
1948
Max
imum
78, 3
00
12 .2
4 5.
5 2.
6
9.4
32 5.7
6.9 .9
2.
7
54
24
36 7.5
Min
imum 45
8
7.7 .0
1 3.
2 1.
3
4.1
15 3.4
2.5 .0
.5
38
13 3 6.5
Ave
rage
9,73
5
10 .0
4 4.
1 1.
7
5.5
22 4.6
3.9 .2
.9
46
17
13 6.9

Tab
le 7
. S
um
mar
y o
f ch
emic
al a
naly
ses
of w
ater
fro
m s
trea
ms
in t
he Y
adki
n-P
ee D
ee R
iver
ba
sin
Co
nti
nu
ed
Sil
ica
(SiO
j)............ ..
....
... .
.............................. .
Iron
(F
e)...... ..
................................................. .
Bic
arbo
nate
(H
CO
s)...
.........................................
Sul
fate
(S
O*)
.... .
............................................... .
Chl
orid
e (C
l)..
....
. .............................................
Nit
rate
(N
O,)
....
... .
............................................
Dis
solv
ed s
olid
s (r
esid
ue o
n ev
apor
atio
n at
180
*C).
....
TJ
56, D
row
ning
Cre
ek n
ear
Hof
fman
O
ct.
1946
to
Sep
t. 19
47
Max
imum
1,04
0
6.8 .0
6 2.
4 .7j
4.0
8.0
2.7
4.0 .1
.
.6
37 9 88 6.3
Min
imum 73
1.3 .0
2 .7
.3
1.8
5.0
1.3
2.5 .0
.1
19
3 28 5.25
Ave
rage
241
3.9 .0
3 1.
1 .5
2.9
6.0
1.9
2.9 .0
.2
26
5 49
6.0
63, L
umbe
r R
iver
at
Boa
rdm
an
Oct
. 19
46 t
o S
ept.
1947
Max
imum 3,75
0
9.1 .3
6 2.
6 1.
2 5.
4
10 6.7
6.5 .2
1.
0 59
11
17
0 6.05
Min
imum 28
0
0.8 .0
2 1.
2 .6
2.1
4.0
2.5
3.4 .0
.1
28
6 52 5.05
Ave
rage
1,11
2
5.5 .0
7 1.
8 .8
3.7
6.2
3.6
4.8 .0
.3
45
8 10
3 5.6
66, W
acca
maw
Riv
er a
t Fr
e ela
nd
Oct
. 19
50 t
o S
ept.
1951
Max
imum
1,25
0
9.4 .42
8.2
1.6
20 41
15
16 .2
1.
2 11
6 27
220 6.
9 15
5
Min
imum
15
2.2 .0
5 3.
2 .8
1.6
6 2.2
7.4 .0
.1
56
12
75
5.3
46.2
Ave
rage 37
7
6.0 .2
0 4.
8 1.
1 4.
8
10 4.9
9.0 .0
.3
72
16
12
0 5.8
59.2

68 WATER RESOURCES, YADKIN-PEE DEE RIVER BASIN, NORTH CAROLINA
*« -Is Its? -its> 5 2* SJ > ^-^ fftSE s"~' OS Ix^1
^p OC w -2 C« ..or*. ai ° C
100& is I2ss IP p 1 il 1 s I >-"'-« < »l-l > 0> I-H DEC,-! Q. C"< " *- " Qt- l-H I'"
Figure 21. Average composition of dissolved solids in surface waters in the Yadkin-Pee DeeRiver basin.
The Yadkin River at Patterson, the uppermost stream gaging station in the basin where chemical quality of water is determined, is of excellent chemical quality that is uniformly low in mineral content. For the period October 1947 to September 1948 the dis solved solids ranged from 24 to 32 ppm and the hardness ranged from 7 to 13 ppm. The mineral content of the water from the Yadkin River at Wilkesboro is comparable to that from the river at Patterson. A daily sampling station for chemical quality of water studies was in operation tin the Yadkin River at Yadkin Col lege during the period October 1943 to September 1944 and again from October 1950 to September 1951. The range in quality of the water was small during the two periods; however, a greater range in chemical quality was noted for the 1951 water year than for the 1943 water year. During the 1943 water year the dissolved solids ranged from 32 to 47 ppm whereas during the 1951 water year the dissolved solids ranged from 34 to 85 ppm.
The water from South Yadkin River, a maior tributary to the Yadkin River, would generally be suitable for an industrial or pub lic water supply on the basis of mineral content. The uniformity of the low dissolved solids and low hardness makes it very desir able for most uses. During periods of high runoff the stream appears to carry large quantities of suspended sediment.

SURFACE WATER 69
\\\\\\\\\\\\ \\\\\\\\\

70 WATER RESOURCES, YADKIN-PEE DEE RIVER BASIN, NORTH CAROLINA
I -
*CaO>j
Figure 23. Relation between streamflow and selected chemical and physical characterisitcs of Rocky River near Norwood, 1947-48.

GROUND WATER
Abbotts Creek, source of water supply for Lexington, is more variable in chemical quality than many of the tributaries of the Yadkin River. The dissolved solids ranged from 58 to 136 ppm and the hardness ranged from 22 to 46 ppm during the 1948 water year. Objectionable amounts of color (as much as 36 units) oc curred during the period of record.
According to the data obtained, the chemical character of the water from Rocky River near Norwood varied more than from any of the other streams in the Yadkin-Pee Dee River basin. The dissolved solids ranged from 43 to 172 ppm, and hardness ranged from 16 to 47 ppm. The chloride ranged from 4.0 to 30 ppm, which is considerably greater than for other streams in the area, in dicating either ground-water inflow or pollution.
Although the chemical quality of the water from the Pee Dee River near Rockingham is good, the mineral content increased slightly from Wilkesboro to Rockingham.
Except for excessive iron and color, the chemical quality of the water from Waccamaw River at Freeland and Lumber River at Boardman is good. Swamp drainage flowing into the two streams contributes colored waters.
In 1951 a sedimentation program to determine the amount of suspended sediment being transported by the Yadkin River was begun. One daily-sampling station was established on the Yadkin River at Yadkin College. The relation between streamflow and the amount of suspended sediment being transported on the Yadkin River at Yadkin College for the 1953 water year is shown in figure 24.
GROUND WATER
OCCURRENCE OF GROUND WATER
Ground water occurs throughout the Yadkin-Pee Dee River basin in the open spaces within the rock materials below the water table. There is a great range in number, size, and shape in the open spaces containing the water. In the sedimentary rocks, such as sand and clay, a large number of relatively small interstices occur, whereas in igneous and metamorphic rocks, such as granite and slate, the pore spaces are restricted to fractures. The nature of the open spaces determines the porosity, which is generally ex pressed as the percentage of total volume not occupied by solid material. Rocks of low porosity are not .capable of absorbing, holding, or yielding much water. Rocks of high porosity may yield considerable water, although this is not necessarily true. Some
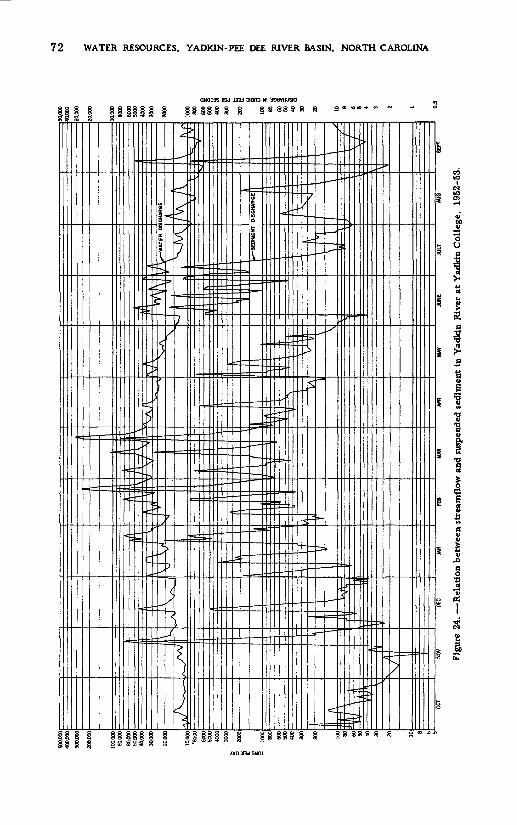
NOV
DEC
JAN
FEB
APR
MAY
JU
NE
JULY
AU
G
SEPT
Figu
re 2
4.
Rel
ati
on
bet
wee
n st
ream
flow
and
sus
pend
ed s
edim
ent
in Y
adki
n R
iver
at
Yad
kln
Col
lege
, 19
52-5
3.

GROUND WATER 73
sands and some clays have approximately the same porosity, al though the sands will yield water to wells or springs more readily than will the clays. The difference lies in the ability of the clays to hold much water by molecular attraction (high specific reten tion) and in the ability of the sands to allow the water to move by gravity through the pore space (high permeability). The capacity of rock formations to absorb water during periods of surplus and to store it where it can be withdrawn from wells on a perennial basis is an important asset to any area, the larger the storage capacity and the more productive the wells the greater the asset.
Although the storage facilities of the rock formations, or under ground reservoirs, are good, the sustained yield of water to wells and springs is not necessarily assured. The openings must be interconnected sufficiently to allow water to be transmitted in the rocks as in a network of pipes. Water can thus be transmitted from distant parts of the underground reservoir to a pumped well. As pumping of a well continues, more water is drawn from storage and water levels decline. Unless the reservoir has facilities for taking in new water to replenish that withdrawn, there can be no sustained yield. The limit of perennial yield is controlled by the replenishment, or recharge, to the reservoir. Fortunately, in the Yadkin-Pee Dee River basin, precipitation is great enough and is distributed throughout the year evenly enough to keep the under ground reservoirs full to overflowing most of the time,.
Water leaks out of the underground reservoirs through springs or seeps. This disdharge demonstrates the existance of natural movement of water, but movement is extremely slow, generally not exceeding a few feet per day. Ground water moves by gravity from recharge areas through the reservoir to areas of natural dis charge, and through the years the average recharge to the reser voir is equal to the average discharge from it. Discharge facili ties, and the consequent movement of water from the recharge area, are necessary to purge the underground reservoir of highly mineralized water. Some of the artesian formations in the south east part of the basin still contain salty water that has not been flushed out since the beds were filled with it.
When wells are put down, unsaturated sand, clay, and other rock materials are found to extend from the surface to a depth ranging from a few inches to as much as 60 feet in this basin. Beneath the unsaturated zone is a zone where all the pore spaces are filled with water under hydrostatic pressure. This is known as the zone of saturation and the top of it is the water table. In a general sense the water table is a subdued image of the surface topography. It rises higher under the hills than in valleys, although it lies deeper under the hills. Water-table conditions exist in the near-surface rocks throughout the basin area.
74 WATER RESOURCES YADKIN-PEE DEE RIVER BASIN, NORTH CAROLINA
In the Coastal Plain there are many alternating layers of per meable sand and impermeable clay sloping southeastward. The slope of the beds is slightly greater than the slope of the land sur face, and water, entering the sand beds at high elevations, moves southeastward to exert pressure on the water already confined in the sand beds between clay beds. Water thus confined under pres sure is known as artesian water. The artesian water level of each sand bed is generally within a few feet of the land surface, even though the bed itself may lie hundreds of feet below, and in much of the low areas to the southeast artesian wells wiH overflow.
GEOLOGY
The geology of the basin influences both the ground-water and surface-water resources. In general, steep slopes and imper meable rocks favor rapid runoff and low infiltration capacity. Con versely gentle slopes and permeable materials at the surface favor recharge to the underground reservoirs,so that the streams have a relatively good flow in long periods of fair weather. The movement and storage of ground water depend on several geologic factors, including the type of rock, the compactness and arrange ment of the mineral grains, and the way the rocks are fractured.
The western or Piedmont half of the basin is underlain by dense, ancient rocks of complex character and structure. In general, they include granite and related crystalline rocks, slate, and some compact shale and sandstone. Their porosity and permeability are generally low. In the eastern half of the basin (the Coastal Plains) the ancient rocks are overlain by beds of younger, relatively un- consolidated sand and clay. These beds slope eastward a little more steeply than does the land surface, and, consequently, any given bed is buried progressively deeper toward the coast. These beds increase in total thickness to the east and reach a maximum thickness of more than 1, QUO feet in the easternmost part of the basin. With the exception of a thin mantle of sand and clay at the surface, the sediments of the Coastal Plain are composed of three Upper Cretaceous formations, which are, from oldest to youngest, the Tuscaloosa, Black Creek, and Peedee formations.
ROCKS OF THE PIEDMONT
Granite and schist. Northwest of a line extending northeastward through central Cabarrus, Rowan, and Davidson Counties is a sequence of crystalline rocks, composed principally of granite and schist. The schist is laminated and contains mica and quartz and varying amounts of feldspar and accessory minerals, repre senting sedimentary rocks that have been metamorphosed by great
GROUND WATER 75
heat and pressure, deformed, and tipped on edge. They have been invaded by molten magma which rose from below and solidified as it cooled. The cooled intrusive rocks are chiefly light-colored granite and dark-colored diorite, but for convenience in this re port all intrusive rocks are called granite. The granite occurs as large, massive bodies, such as those in the vicinity of Mount Airy in Surry County and Granite Quarry in Rowan County, and as thin lenticular bands enclosed in the schist. The schist and thin bodies of enclosed granite commonly trend northeastward, although no brief statement can adequately describe the complex arrangement of the rocks in the granite and schist sequence.
Volcanic rocks and slates . Southeast of the granite -schist belt is a northeastward-trending belt of slate or slatelike rocks. These rocks represent a series of old volcanic rocks and include inter - bedded tuff, lava flows, and slate. Most of the rocks of this series are dense and fine grained, being composed largely of minerals rich in silica. However, there is no basalt, a common type of volcanic rock in many other parts of the earth. The rocks have been folded and tilted so that the total thickness is obscured in the repetition of beds that occurs in the belt, which is more than 25 miles wide. Joints and other fractures are common in the ex posed rocks.
Newark group. In a belt roughly 10 miles wide, which lies along the eastern part of the Piedmont is a group of rocks of Triassic age, known as the Newark group from rocks of similar age and type at Newark, N. J. These rocks consist chiefly of red to brown shale, claystone, and sandstone beds. They were deposited as interbedded lenses in a subsiding inland basin or trough, which trends northeastward. They have been hardened by compaction and cementation so that the original pore spaces have been filled with cemented material. The strata commonly have a slight dip to the southeast.
ROCKS OF THE COASTAL PLAIN
Tuscaloosa formation . The basal formation of the Coastal Plain is the Tuscaloosa formation of Late Cretaceous age, which lies on the buried surface of the dense rocks exposed in the Piedmont region. It is the formation underlying the "Sand Hill country" of Moore, Richmond, Scotland, and Hoke Counties. It is composed of gray, red, and tan sand and clay. The strata are not well defined and generally do not contain well-sorted material. The formation increases in thickness from a featheredge at the western edge of the Coastal Plain to approximately 300 feet in Robeson County. It probably thickens even more to the southeast, although no wells have been drilled through it to the basement rocks in that area.

76 WATER RESOURCES, YADKIN-PEE DEE RIVER BASIN. NORTH CAROLINA
The Tuscaloosa dips southeastward at a rate greater than that of the land surface, probably greater than 15 feet per mile.
Black Creek formation. The Black Creek formation, also of Late Cretaceous age, crops out in a belt southeast of the belt of out crop of the Tuscaloosa formation. However, actual exposures of the Black Creek formation are rare because of an overlying thin cover of surficial sand and clay. The Black Creek is the near- surface formation throughout Robeson County. It dips gently to the southeast and increases wedgelike in thickness to several hundred feet in the eastern part of the basin. It consists of dark-gray to black laminated clay beds alternating with strata of fine- to medium-grained sand. The clay commonly contains black woody material, and some of the beds of sand in the upper part of the formation contain the green mineral\glauconite. A few beds con tain fossils. '
Peedee formation . The Peedee formation, also of Late Cretaceous age, overlies the Black Creek formation and constitutes the near- surface formation in the Columbus and Brunswick County part of the basin. It dips and thickens to the southeast, but its thickness and character beneath the surface have not been determined. Like the Black Creek formation that underlies it, the Peedee consists of interbedded strata of sand and dark clay. The sand commonly contains glauconite. Thin beds of limestone occur at various levels in the formation, becoming more prevalent toward the coast.
Vndifferentiatedsurficial deposits* Overlying the Black Creek and Pee dee formations are thin deposits of sand and clay that cannot everywhere be assigned to a geologic formation. Some of the de posits may have originated by weathering and by soil-forming processes from the underlying formations. In other places they are a thin veneer of sand and clay deposited when the sea invaded the area during the Pleistocene epoch, or Ice Age. In the eastern most part of the basin, scattered deposits of limestone, or shell rock, of Eocene or Miocene age, lie on the Peedee formation. The extent of the limestone has not been determined, but its maximum thickness probably does not greatly exceed 30 feet.
GROUND-WATER PROVINCES
The ground-water conditions are far from uniform throughout the Yadkin-Pee Dee River basin. Not only do they vary from one rock type, or formation, to another, they also vary to some extent from place to place within each formation. Several water-bearing units, or aquifers, are distinguished in the Yadkin-Pee Dee River basin on the basis of differences in the lithology and structure of
GROUND WATER 77
the rocks and in the yield of wells and quality of the water. These ground-water units may consist of one formation, or several formations, having similar hydrologic properties. The quantity and quality of water that can be obtained from each water-bearing unit varies with the type of well and its location and depth. The areal extent of these units is shown in plate 3. These units have been grouped in a simplified manner in order to depict the ground- water resources conveniently. The indicated boundaries between the provinces are approximate.
The chemical quality of the ground water in the Yadkin-Pee Dee River basin is summarized in table 8. Selected analyses of water from each ground-water province are presented graphically in figure 25.
CRYSTALLINE-ROCK PROVINCE
The crystalline-rock province is underlain by dense, massive granitelike rocks and schists or foliated rocks in the mountains and northwestern part of the Piedmont. The crystalline rocks are too dense to contain a continuous network of pore spaces. As a result, usable water in the hard rock occurs only in joints and along planes separating some of the beds. (All such openings hereinafter are called joints.) Above the hard rock is loose rock material that includes the soil zone near the surface and soft, de cayed rock material below. All this soft material is commonly called mantle rock and is the medium through which water passes from its infiltration at the surface to its entrance into the joints in the rocks beneath.
The mantle rock contains materials of different permeability but clay is present in sufficient amounts to give the mantle rock a low average permeability. The mantle rock ranges from a few feet to several tens of feet deep. In most places the water table lies in the mantle rock. As a result, shallow wells developed in the mantle rock generally yield a few gallons of water per mitoute, enough for normal rural domestic use. During some dry periods the water table declines below the bottom of some of the shallow wells, causing them to go dry.
For supplies greater than a few gallons per minute, deep wells may be drilled into the hard, dense rock. These wells draw water from the joints in the rocks. The joints are not evenly distributed, some being a few inches and others many feet apart. Some are only a fraction of an inch wide, although there is a great variation in size of openings. The size and number of joints decrease with depth. To a depth of about 150 feet many of the joints are inter connected sufficiently to allow water to circulate through them.
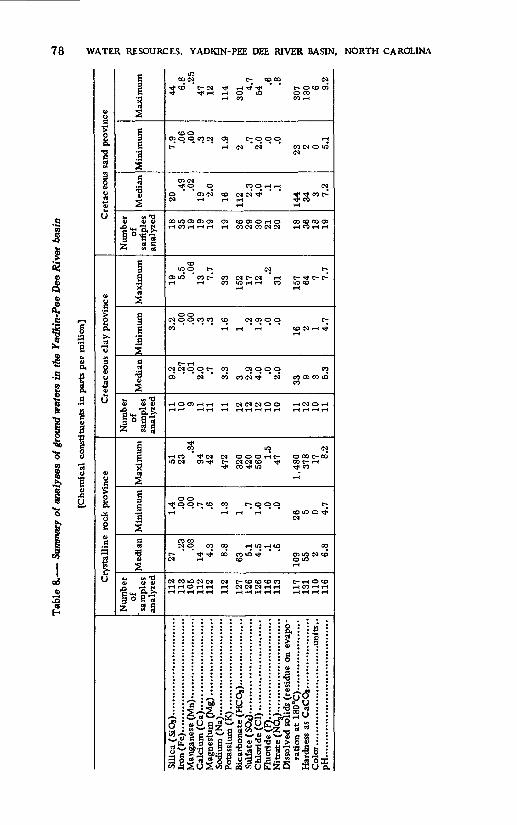
78 WATER RESOURCES, YADKIN-PEE DEE RIVER BASIN, NORTH CAROLINA
S
& -5
Vusand provii
10)
u
V
H1IX
7J
soa0)
u
V
rock provi
ofi3
u
Maximum
Minimum
5
1& $ V
Z S fi
Maximum
|E '2
Sfi «V
b M TJV V O
| o E g £ rt CA MO)
E 3rt2
'2
S3 V
2& So
2 US.
2 rt fi <n rt
10 OOlM
^< CO t- IM
CO O OJ O O CO IMt-!
TJ< O C3
O O) C3IM 'TH
OO LO 03 O5 O5
coLO O t-
O3 LO " CO C~TH TH
o oCQ O O CO CO
CO
t- TH IM IM 0 Ot-
O3 IM
i-l O O5 rH TH
«
TH CO Tl< IM LO IM O3 Tj«
O O ^* O O t- COTH
NO CO
N rH
N COlOlM IM rH rH O TH rH
Silica (SQs)... ...... ........ ... Iron (Fe)..... .................... Calcium (Ca)..... .............
TH
05
coTH
O3
CO CO
CO
TH
CO
CO
TH
IMC-
COTH
DO
DO
IMTH
j
e^ co oo
CO
tr; O OO
COO rH rH
IM IM Tft-t
CO Oi O rH O
IM t- IM ' THLO rH TH COrH
IM O3 O O
TH rH
Oi O O O
COIM * IM
OS IM IM O O
LO
O O O TH t- IM IM CO Tl< CO ^ LO
tr; O OO
rH iH
rH LO rH CO
CO lO * CO
t- CO CO CO CO IMlM IM THrH
Bicarbonate (HCO,).... ....... Sulfate (SO4).......... ......... Chloride (Cl) .................. Fluoride (F). ............. ....... Nitrate (NO,)... ................
t- o co oiO CO COrH
TH
CO <N O LO IM
^* ^ CO t~ ^ COr-l
oo co oo en
t- t- * t- t~LO CO TH
t-CO IM TH *TH
CO
GOO5 CO LO CO
TH IM O rH
IMO 00 t- OO 00 t- TH Tj< CO
IM
DO
O3 LO IM CO O LOTH
t-TH O COTH CO TH TH
|L: \B
Dissolved solids (residue on ration at 180°C). ........... Hardness as CaCOj. ........... Color............................. PH................................
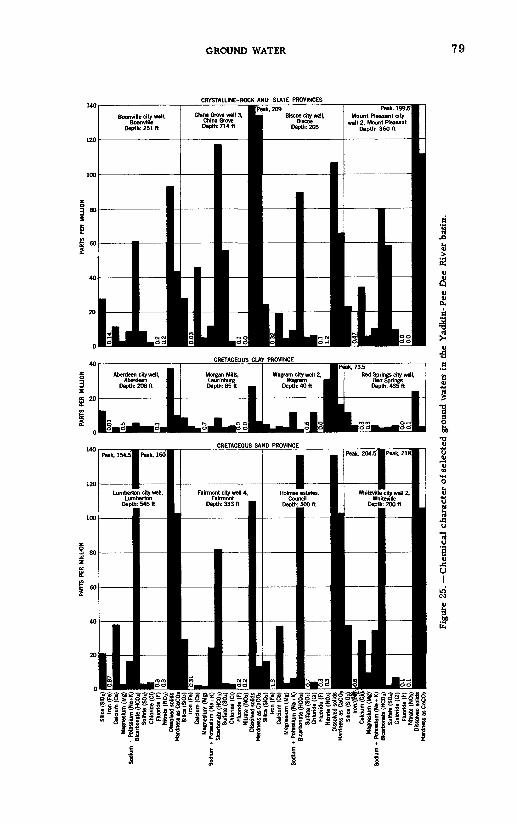
Sodi
i
Silic
a (S
i02)
Iro
n (F
e)
Cal
cium
(Ca
) M
agne
sium
(M
g)
Sodi
um +
Pot
assi
um (
Na+
K)
Bica
rbon
ate
(HC
03)
Sulfa
te (
SO.)
Chl
orid
e (C
l) Fl
uorid
e (F
) N
itrat
e (N
03)
Dis
solv
ed s
olid
s H
ardn
ess
as C
aCO
s Si
lica
(Si0
2)
Iron
(Fe)
C
alci
um (
Ca)
Mag
nesi
um (
Mg)
Po
tass
ium
(N
a +
K)
Bica
rbon
ate
(HCO
a)
Sulfa
te (
S04)
Chl
orid
e (C
l) Fl
uorid
e (F
) [6
.2
Nitr
ate
<N03
) 1 0
.2
Diss
olve
d so
lids
Hard
ness
as
CaCO
s,
Silic
a (S
iOz)
Iro
n (F
e)
Cal
cium
(Ca
) M
agne
sium
(M
g)
Pota
ssiu
m (
Na+
K)
Bica
rbon
ate
(HCO
s)
Sulfa
te (
S04
) C
hlor
ide
(Cl)
Fluo
ride
(F)
foT3
N
itrat
e <N
03)
1 0-3
Di
ssol
ved
solid
s Ha
rdne
ss a
s C
aCO
j Si
lica
(Si
ICa
lcii
Mag
nesiu
m (
Mg)
Sodi
um +
Pot
assi
um (
Na
+ K)
Bica
rbon
ate
(HC
03)
Sulfa
te (S
CU)
Chlo
nde
(Cl)
Fluo
ride
(F)
Nitr
ate
(N03
)Di
ssol
ved
solid
sH
ardn
ess
as C
aCO
s
Sodi
Fig
ure
25. C
hem
ical
char
acte
r of
sel
ecte
d g
roun
d w
ater
s in
the
Yad
kin-
Pee
Dee
Riv
er b
asin
.-J C
O
80 WATER RESOURCES, YADKIN-PEE DEE RIVER BASIN, NORTH CAROLINA
Depth of wells. Shallow wells, drawing water from the mantle rock, are generally no deeper than 50 feet and yield only a few gallons per minute. Deep wells, on the other hand, have a wide range in both depth and yield.
In attempting to develop an adequate water supply, the well owner generally is concerned only that his well be deep enough to give the required amount of water of suitable quality. Unfortu nately, the relation between the depth and yield of wells is not a simple one, and there is no assurance that the yield of a well will increase if its depth is made deeper; many wells fail to increase in yield with increasing depth, owing to the decrease in size and number of joints with depth. It is generally true that deeper wells in the crystalline rocks yield more than shallower wells. This apparent relationship is misleading because the greater yield of deep wells is due, not so much to greater depth, but to the fact that deep wells are generally for municipal and industrial use and consequently are pumped at greater rates and have a greater drawdown of the water level than shallow wells, most of which are drilled for domestic use.
If a satisfactory supply of water is not available at a certain depth, it is, of course difficult to decide how much deeper to drill. As a matter of hindsight it appears that some wells abandoned at depths greater than 400 feet because of lack of water should have been abandoned at much shallower depths; on the other hand, many wells abandoned at depths of about 150 feet might have yielded good supplies if they had been drilled deeper. The depth at which an inadequate well should be abandoned is largely an economic problem of the well owner. (LeGrand, 1954, p. 19).
Drilling to great depths in crystalline rocks is rarely justified. Unless a well shows an appreciable increase in yield between the depths of 200 to 300 feet, it generally is not worth while to drill deeper than 300 feet.
Yield of wells. Although considerable water is stored in the crys talline rocks, the rocks release the water slowly to wells, and consequently wells capable of yielding less than 25 gpm are common. Even where geologic conditions appear to be similar, individual drilled wells show a wide range in yield; one-well may yield too little water to pump, whereas another a few hundred feet away may yield as much as 100 gpm. At least one well in the basin yields more than 600 gpm, whereas many yield as little as 1 gpm, and the average well yields 25 to 40 gpm. This great variation in yield and the impossibility of predicting the yield of a prospective well gives the impression that getting a good well is a matter of luck or chance.
In a report on the Statesville area (LeGrand, 1954, p. 20), a graph shows the probability of obtaining a well whose yield is
GROUND WATER 81
equal to or more than a specified amount. Although the Statesville report includes data from two counties not in the present report and does not include the part of the crystalline-rock unit in the upper part of the basin, the graph (fig. 26) is thought to apply to this unit in the basin. The data used in making the graph are not altogether accurate because the yields and the drawdowns have been reported by well owners and well drillers, many of the re ports coming from memory. The reported yields are too great for some wells and too low for others. Nevertheless, it is likely that there is nearly complete compensation of the inaccuracies in the data, and consequently the curve is thought to be representative of actual conditions.
The lower curve is the cumulative frequency curve of yield of industrial, municipal, and domestic drilled wells that yield at least 59 gpm. The average static (nonpumping) water level is 29 feet below the land surface and the average pumping level is 104 feet below the surface. The middle curve is of yields of industrial and municipal wells, the average pumping level being 135 feet be low the land surface and the average static level, 30 feet. The upper curve is a hypothetical curve showing the expected yield-if wells were pumped sufficiently to lower the level to an average of 150 feet below the land surface, assuming an average static level of 30 feet.
The probability of obtaining successful wells, shown in figure 26, was based on records of wells whose locations were selected by the owners largely for convenience. Most wells are on hills where conditions for large supplies are unfavorable. The geologic factors that govern the yield of wells are complex and will not be discussed in this report. However, a study of the data indicate a greater likelihood of developing a large-yielding well in a draw, or other low ground, where the soil zone is thick and the rock commonly is relatively highly fractured, than on a sharp hill where bare rock is exposed.
Quality of water.. Generally the crystalline rocks yield water of good "chemical quality; the observed range in dissolved solids and hardness was 26 to 482 and 8 to 378 ppm, respectively. Calcium bicarbonate waters predominate. Except for one well near Winston- Salem, Forsyth County, waters from the crystalline rocks in Surry, Wilkes, Forsyth, and Yadkin Counties, in the upper part of the basin, are soft and low in dissolved solids. Only three wells yield water that contains more than 0. 60 ppm of iron. The chem ical character of the water from the crystalline rocks is more variable in Iredell, Davie, Davidson, Rowan, Cabarrus, and
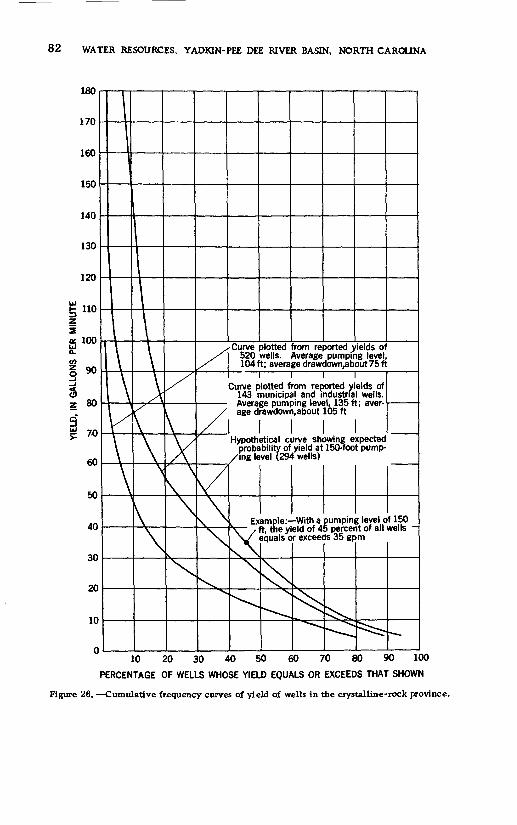
82 WATER RESOURCES, YADKIN-PEE DEE RIVER BASIN, NORTH CAROLINA
Curve plotted from reported yields of 520 wells. Average pumping level, 104ft; average drawdown.about 75 ft
Curve plotted from reported yields of 143 municipal and industrial wells. Average pumping level, 135 ft; aver age drawdown, about 105 ft
Hypothetical curve showing expected probability of yield at 150-foot pump-
/ing level (294 wells)
Example: With a pumping level of 150 V~ / ft, the yield of 45 percent of all wells
equals or exceeds 35 gpm
10 20 30 40 50 60 70 80 90 100
PERCENTAGE OF WELLS WHOSE YIELD EQUALS OR EXCEEDS THAT SHOWN
Figure 26. Cumulative frequency curves of yield of wells in the crystalline-rock province.

GROUND WATER 83
Mecklenburg Counties than in the counties in the upper part of the basin. Objectionable amounts of iron are present in water from some wells near Statesville, Troutmans, East Monbo, and Gold Hill. One sample from a well near Mooresville, Iredell County, contained 420 ppm of sulfate and had a hardness of 378 ppm.
SLATE PROVINCE
The slate province is underlain by volcanic rocks and slates. Most of the rocks of this sequence have a slaty cleavage and a cover of mantle rock, which makes them similar to the schists of the crystalline-rock province. The occurrence of ground water in the slate province is similar to that in the crystalline-rock province. Industrial and municipal wells generally yield more than 15 gpm, many yielding more than 35 gpm.
Quality of water.. The ground water in the slate province has a range in chemical character similar to that in the crystalline rocks. The light-colored rocks normally yield a soft water that ranges in hardness from 5 to 68 ppm and is low in dissolved solids, ranging from 28 to 130 ppm. The dark-colored rocks commonly yield a moderately hard to hard water ranging in hard ness from 90 to 262 ppm. Water from some wells at Southmont, Trinity, Biscoe, Candor, and Star contains objectionable amounts of iron.
TRIASSIC PROVINCE
The Triassic province includes the rocks of the Newark group, consisting of sandstone, shale, mudstone, and conglomerate. Mundorff (1945, p. 17), reports that the materials are poorly sorted, resulting in a low porosity and permeability, which has been further reduced by compaction and cementation. Conse quently, the movement of water is largely along bedding planes and joints. Joints are common in the dark-colored dikes that have intruded the sediments. The dikes commonly are only a few feet thick, but they are dispersed throughout the province.
A reconnaissance study of the ground-water resources in the Triassic province has been made by R. G. Schipf of the Geo logical Survey, who says (written communication):
Although adequate domestic supplies may be had from the Triassic rocks, the same cannot be said for industrial or public supplies. Several wells yield as much as 50 gal lons a minute but only one well listed in the well tables yields as much as 124 gallons a minute. It seems apparent that such large yields cannot be sustained over long periods of time without excessive drawdown............
84 WATER RESOURCES, YADKIN-PEE DEE RIVER BASIN, NORTH CAROLINA
Water from the Triassic rocks is alkaline and moderately hard to very hard. Significant amounts of chloride (up to 250 parts per million) are known in some well water, but the water is generally satisfactory for most purposes. Temperatures range from 58°F to 66°F.
CRETACEOUS CLAY PROVINCE
The Cretaceous clay province coincides with the outcrop area of the Tuscaloosa formation and includes a northeastward-trending belt including southeastern Richmond and Moore Counties and northwestern Scotland and Hoke Counties. Loose permeable sand, ranging in thickness from a few inches to 20 feet or more, is underfain by dense blue-gray clay. The thickness of the formation as a whole increases from a featheredge at the western border to more than 275 feet at the eastern border.
The loose sand at the surface absorbs the precipitation readily so that direct surface runoff is not great. Water percolates downward through the surface sand faster than the underlying clay can absorb it. As a result, much water passing through the sand on upland slopes reappears as hillside seeps to be discharged into the streams. A few sand beds are penetrated locally within the clay, but they cannot be traced far laterally and are probably lenticular. The clay does not yield water readily, and conse quently few drilled wells in the clay province yield more than 15 gpm. In an effort to obtain as much as 25 gpm many wells are drilled through the strata into the underlying slates. Wells in the eastern part of the province have penetrated more sand beds than those to the west, and the yields in the eastern part are greater.
Quality of water. Ground water from the Cretaceous clay province is low in mineral matter, the dissolved solids generally ranging from 16 to 95 ppm (one sample contained 157 ppm of dissolved solids) and the hardness ranging from 3 to 64 ppm. (See table 8. ) As the water from this province generally is slightly acid (pH as low as 4. 7) and the mineral content is low, the water tends to be corrosive to metal surfaces. Objectionable quantities of iron are present in water from a well at Wagram.
CRETACEOUS SAND PROVINCE
The Cretaceous sand province is east of the Cretaceous clay province. It is formed by the outcrop areas of the Black Creek and Peedee formations, and it includes the under lying Tuscaloosa formation insofar as that formation can be reached by wells. Water moves through the nearly flat lying beds of sand, which are interlayered with beds of clay. The beds are inclined slightly to the southeast, having a slope slightly greater than that of the land

GROUND WATER 85
surface. By entering the ground where the beds crop out, the water moves coastward in the beds of sand and becomes confined under artesian pressure beneath beds of clay.
All three principal formations of the province contain one or more beds of sand from which wells can draw water. Most of the municipal and industrial wells are drilled deep enough to tap several of the sand beds. Screens or slotted pipe are installed opposite the sands, so that water from all sands penetrated can enter the well. These wells range in depth from 100 to more than 600 feet, the aggregate yield generally increasing with depth. Properly developed industrial and municipal wells in this province are capable of yielding more than 300 gpm almost everywhere, and yields in excess of 500 gpm have been obtained.
Most of the rural domestic supplies in this province are obtained from driven wells, which rarely are more than 20 feet deep. The wells draw water from surfical sands that mantle the Cretaceous formations. Some rural domestic supplies are obtained from wells of small diameter commonly if- or 2-inch, which tap a bed of sand shallower than 200 feet. Such a well is developed by setting the casing on a hard, firm bed and by removing, with com pressed air, as much of the running sand in the underlying sand bed as possible. The well is open into the sand bed. Although the wells generally are capable of yielding more than 5 gpm, an ex cessive rate of pumping may bring in an objectionable amount of sand.
The water level of each sand bed in the province is separate and distinct from those of other sand beds. Too few measurements of water levels in individual beds have been made to determine the water levels in each bed. However, it is thought that, in most places, the deeper beds have higher water levels than do the shallow beds. Beneath the broad interstream areas the artesian water levels and the water table in the surfical sands generally lie at approximately the same depth - commonly 10 to 30 feet.
Quality of water . The Cretaceous sand province yields mostly soft water,having an observed range in hardness from 2 to 130 ppm and in dissolved solids from 23 to 307 ppm. Although objectionable amounts of iron occur at certain localities, such water would be suitable, with slight treatment, for domestic and most industrial purposes.
WATER LEVELS
Changes of water levels in wells reflect the changes of water in storage in underground reservoirs. During droughts, drying up of
86 WATER RESOURCES, YADKIN-PEE DEE RIVER BASIN. NORTH CAROLINA
many shallow wells is evidence of a falling water table. There is a continual discharge of ground water by seepage into streams and by evaporation and transpiration, generally along the streams. The discharge causes a gradual lowering of the water table except dur ing and immediately after periods of significant precipitation, when replenishment to the underground reservoir exceeds the discharge from it; as a result of these periods of precipitation the water table rises. Figure 27 shows the water-level fluctuations in two wells in the basin. The water levels in these wells are controlled only by natural conditions, and their fluctuations are typical of those in water-table wells throughout the basin. The water table generally rises quickly during periods of recharge and then declines slowly over a longer period as the water drains out; therefore, the water table is declining most of the time. In a year of normal precipita tion the recharge to the underground reservoir is approximately equal to the discharge from it, so that the water table at the end of the year is at about the same level as at the beginning of the year.
The relationship between the amount of precipitation and the po sition of the water table is not a simple one. In the basin there is a noticeable change in the water table with the seasons. The water table generally begins to decline in April and May because of in creasing evaporation and of the use of water by plants, which, by disposing of water from rainfall, prevent it from reaching the wa ter table. Generally the decline continues, interrupted for short periods by minor rises due to heavy rainfall, through the summer and early fall. In spite of relatively heavy rainfall during the sum mer, the average recharge does not keep pace with the discharge by seepage, evaporation, and transpiration. In late fall, generally in December when most of the vegetation is dormant and the evap oration capacity of the air is not great, any soil-moisture defi ciency that has*accumulated during the hot weather is made up and then the water level begins to rise. The winter rains are relatively gentle and steady and are more favorable for the infiltration of wa ter. The seasonal high in the water table commonly occurs in the early spring.
Measurements of artesian water levels of the Coastal Plain section have not been adequate to determine the extent of their fluctuations. Because the artesian beds are full of water and are capable of taking in only a part of the water available for recharge, the artesian pressures in downdip areas fluctuate only slightly in response to recharge.
The withdrawal of water by pumping of wells in the basin is not great, and the lowering of the water table around individual wells does not affect the regional water table. There appears to be no evidence to support the commonly held belief that the water table has been declining during recent years. Measurements of the water table during the past 20 years (see fig. 27) refute this
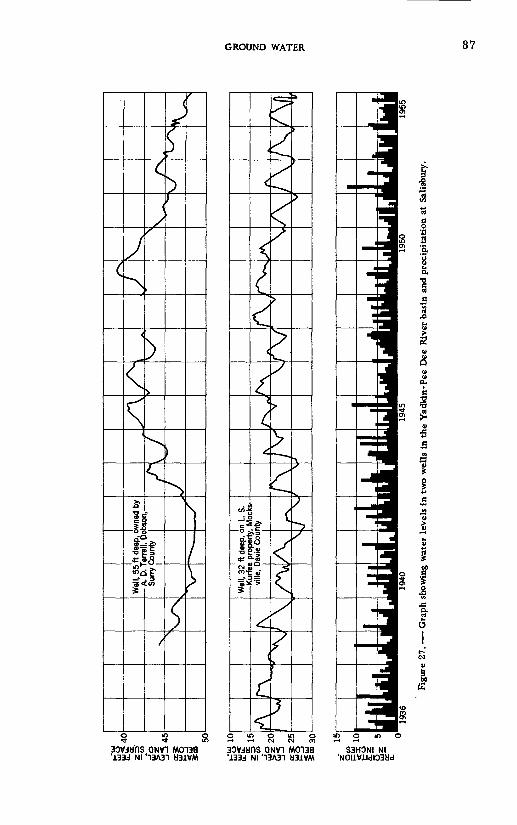
PRECIPITATION, WATER LEVEL, IN FEET, WATER LEVEL, IN FEET, IN INCHES BELOW LAND SURFACE BELOW LAND SURFACE
3OIOU1OOIO<J1OO <J1 O
\
-£ <X/\*
<
(
<
1s
4/>>) ^-^
s"~~^.
<<
^K
<
/sx
^-^.
/* +~
s^
>y}
7>
ii» : "^S
)avie Cou
4|1
7
>?
7>
><>>
>
t
,1
K« 3»
I
ri 15
<1
(
»
/
g>?
?-=1
]
>--v<
(<
I
^
I
1 o
f|
s>
/)

88 WATER RESOURCES, YADK1N-PEE DEE RIVER BASIN. NORTH CAROLINA
belief, and show, instead, that the water table in unpumped or lightly pumped areas has no trend except that associated with sea sonal changes in climate. A cumulative deficiency in precipitation from 1953 to the present time (May 1955)has caused ground-water levels to fall below the seasonal averages.
The water level is depressed around wells that are pumped, the water level forming a cone of depression. The lowest point in the water surface is at the well, and a hydraulic gradient is estab lished which causes water to flow toward the well. As pumping continues to lower the water level in the well, the cone of de pression extends farther away, inducing water to enter the well that ordinarily would have discharged elsewhere. If this inter cepted water approximates in quantity that pumped out, the water level will eventually stablize.
PUBLIC WATER-SUPPLY SYSTEMS
The Yadkin-Pee Dee River basin is served by 64 public water systems, 28 using surface water and 36 using ground water. Lo cation of the systems giving the source of supply, the dissolved solids content, and hardness of the waters is shown in plate 4. A summary of chemical analyses of raw and treated waters for the water-supply systems in the basin is given in table 9. Additional pertinent data relating to each of the systems in the basin are given below.
The data on yields of wells are not particularly significant in showing either the potential yield of the wells or that of the aquifer. Some of the reported yields apply to those derived in a short pumping test after the drilling of the well. The reported yield in this case is likely to be a near-maximum yield of the well in which the drawdown of the water table is considerable. Some of the yields, on the other hand, represent the pumping rate con trolled by the user, in which case the drawdown may or may not be great, depending on the user's needs.
ABERDEEN, MOORE COUNTY
Ownership: Municipal. Population served: 2,254. Source: Springs impounded in 75,000-gallon reservoir and 1 well, 208 feet deep. Treatment: Spring water chlorinated at pumping station. No treatment of well water. Elevated storage: 200,000-gallon elevated tank.

PUBLIC WATER- SUPPLY SYSTEMS 89
ALBEMARLE, STANLY COUNTY
Ownership: Municipal. Population served: 13, 100. Source: Yadkin River. Auxiliary supply: Long Creek impounded in200- million-gallon reservoir. Treatment: Prechlorination, coagulation with alum and soda ash, sedimentation, rapid sand filtration, ad dition of Calgon for corrosion control, fluoridation, final pH ad justment with soda ash. Rated capacity of treatment plant: 4 mgd. Raw-water storage: 32-million-gallon reservoir. Finished-water storage: 1 clear well, 1.5 million gallons; 1 standpipe, 500,000 gallons, and 1 elevated tank, 100,000 gallons. Filtration plant is located about 3 miles northeast of Albemarle.
ASHEBORO, RANDOLPH COUNTY
Ownership: Municipal. Population served: 12,000. Source: 3 lakes west of Asheboro. Treatment: Coagulation with alum and lime, prechlorination, sedimentation, rapid sand filtration, ad dition of Calgon for corrosion control, adjustment of pH with lime. Rated capacity of filtration plant: 1. 5 mgd. Ground storage: 1 clear well, 1 million gallons. Elevated storage: 500,000-gallon elevated tank. Location of filtration plant: 1.3 miles west of Asheboro.
BADIN, STANLY COUNTY
Ownership: Carolina Aluminum Co. Population served: 3, 000. Source: Yadkin River. Treatment: Coagulation with alum and lime, prechlorination, ammoniation, rapid sand filtration, post- chlorination, adjustment of pH with soda ash. Rated capacity of filtration plant: 1.5 mgd. Ground storage: None. Elevated storage: 2 elevated tanks, 250, 000 and 1 million gallons. Location of fil tration plant: 2 miles east of Badin.
BECOE, MONTOGOMERY COUNTY
Ownership: Municipal. Population served: 1, 100. Source: 9 wells (Nos. 1-9), 179, 2jp3, 400, 709, 425, 338, 200, 165, and 165 feet deep. The total yield of wells in use is reported to be 67 gpm. Treatment: None. Ground storage: None. Elevated storage: 75, 000- gallon elevated tank. Will change source of water to Little River about December 1955. A filter plant with capacity of 5UO, 000 gpd is under construction.
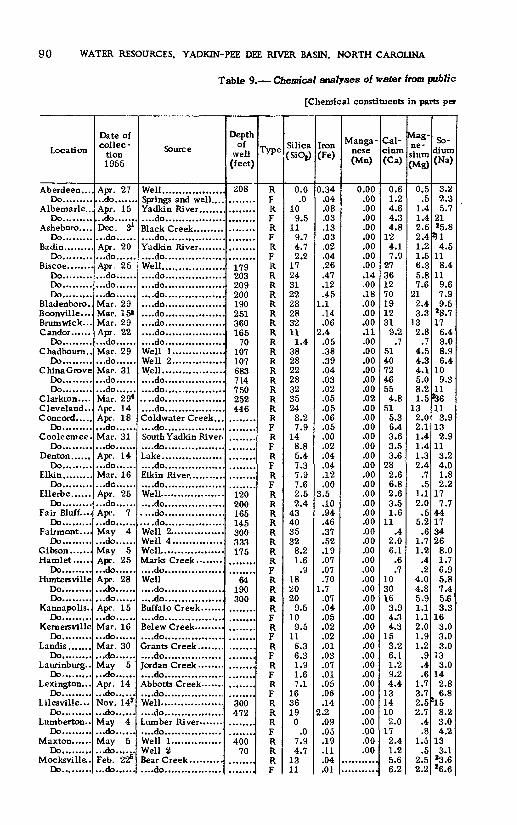
90 WATER RESOURCES. YADK1N-PEE DEE RIVER BASIN, NORTH CAROLINA
Table 9. Chemical analyses of water from public
[Chemical constituents in parts per
Location
Aberdeen... Do.........
Albemarle.. Do.........
Asheboro.... Do.........
Do.........
Do......... Do......... Do.........
Bladenboro.. Boonville.... Brunswick... Candor......
Do......... Chadbourn..
Do......... China Grove
Do......... Do.........
Clarkton.... Cleveland.. Concord.....
Do. ...... ..Cooleemee.
Do.........Denton......
Do.........Elkin.........
Do.........Ellerbe......
Do.........Fair Bluff....
Do. ...... .. Fairmont....
Do. ...... .. Gibson....... Hamlet......
Do......... Hunters ville
Do......... Do.........
Kannapolis.. Do.........
Kernersville Do.........
Landis. ...... Do.........
Laurinburg.. Do.........
Lexington... Do.........
Lilesville... Do.........
Lumberton.. Do. ....... .
Maxton...... Do.........
Mocks ville,. Do.........
Date of collec
tion1955
Apr. 27 ...do......Apr. 15
Dec. 31 ...do......Apr. 20
Apr. 25 ...do...... ...do...... ...do...... Mar. 29 Mar. 158 Mar. 29 Apr. 22 ...do...... Mar. 29 ...do...... Mar. 31 ...do...... ...do...... Mar. 29* Apr. 14 Apr. 18 ...do......Mar. 31 ...do......Apr. 14 ...do......Mar. 16
Apr. 25 ...do......Apr. 7 ...do...... May 4 ...do...... May 5 Apr. 25 ...do...... Apr. 28 ...do...... ...do...... Apr. 15 ...do......Mar. 16 ...do......Mar. 30 ...do......May 5 ...do...... Apr. 14 ...do......Nov. 14s ...do...... May 4 ...do...... May 5 ...do...... Feb. 22s ...do......
Source
Well..................Springs and well....
....do.................
....do..................
....do.................Well......................do................. ....do.................. ....do.................. ....do.................. ....do.................. ....do................. ....do.................. ....do.................. Well 1........ ........Well 2Well......................do.................. ....do.................. ....do.................. ....do..................
....do..................South Yadkin River. . ...do......... .........Lake......................do..................Elkin River..............do..................Well.. ........ ........ .....do......................do.................. ....do.................. Well 2................Well 4...............WelL.... ..............
....do.................. Well .. ..do..... ......... ... ....do..................
....do..................Grants Creek........ ....do.................
....do..................
....do.................Well.......................do..................
....do........ ......... Well 1...............Well 2
....do.................
Depth of
well (feet)
208
179 203 209 200 190 251 360 165
70 107 107 683 714 750 252 446
120 200 165 145 300 333 175
'"64"
190 300
.......
........
300472
'460"
70
Type
R F R F R F R F R R R R R R R R R R R R R R R R R F R F R F R F R R R R R R R R F R R R R F R F R F R F R F R R R F R R R F
Silica (SiC^)
0.0 .0
10 9.5
11 9.7 4.7 2.2
17 24 31 22 28 28 32 11
1.4 38 28 22 28 32 35 24
8.2 7.9
14 8.8 5.4 7.3 7.9 7.6 2.5 2.4
43 40 35 32
8.2 1.6
.9 18 20 20
9.5 10 9.5
11 6.3 6.3 1.9 1.6 7.1
16 36 19
0 .0
7.9 4.7
13 11
Iron (Fe)
0.34 .04 .08 .03 .13 .03 .02 .04 .26 .47 .12 .45
1.1 .14 .06
2.4 .05 .38 .39 .04 .03 .02 .05 .05 .06 .05 .00 .02 .04 .04 .12 .00
3.5 .10 .94 .46 .37 .52 .19 .07 .07 .70
1.7 .07 .04 .05 .02 .02 .01 .03 .07 .01 .05 .06 .14
2.2 .09 .05 .19 .11 .04 .01
Manga nese (Mn)
0.00 .00 .00 .00 .00 .00 .00 .00 .00 .14 .00 .18 .00 .00 .00.11.00 .00 .00 .00 .00 .00 .02 .00 .00 .00 .00 .00 .00 .00 .00 .00 .00 .00 .00 .00 .00 .00 .00 .00 .00 .00 .00 .00 .00 .00 .00 .00 .00 ,00 .00 .00 .00 .00 .00 .00 .00 .00 .00 .00
Cal cium (Ca)
0.6 1.2 4.6 4.3 4.8
12 4.1 7.9
27 36 12 70 19 12 31
9.2 .7
51 40 72 46 55 4.8
51 5.3 6.4 3.6 3.5 3.6
28 2.6 6.8 2.6 3.5 1.6
11 .4
2.0 6.1
.6
.7 10 30 16 3.9 4.3 4.3
15 3.2 6.1 1.2 9.2 4.4
13 14 10 2.0
17 2.4 1.2 5.6 6.2
Mag ne sium (Mg)
0.5 .5
1.4 1.4 2.6 2.4 1.2 1.5 6.3 5.8 7.6
21 2.4 3.3
13 2.8
.7 4.5 4.3 4.1 5.0 8.2 1.5
13 2.0 2.1 1.4 1.4 1.3 2.4
.7
.5 1.1 2.0
.5 5.2
.6 1.7 1.2
.4
.2 4.0 4.8 5.9 1.1 1.1 2.0 1.9 1.2
.9
.4
.6 1.7 3.7 2.5 2.7
.4
.8 1.5
.5 2.5 2.2
So dium (Na)
3.2 2.3 5.7
21 25.8
*L1 4.5
11 8.4
11 9.6 7.9 9.5
28.7 17 6.4 3.0 8.9 6.4
10 9.3
11 %6 11 3.9
13 2.9
11 3.2 4.0 1.8 2.2
17 7.7
44 17 34 26
8.0 1.7 6.9 5.8 7.4 5.6 3.3
16 3.0 3.0 3.0
13 3.0
14 2.8 6.8
Z158.2 3.0 4.2
13 3.1
23.6 26.6

PUBLIC WATER-SUPPLY SYSTEMS 91
water supplies in the Yadkin-Pee Dee River basin
million, R= Raw water; F = Finished water]
Po tas sium (K)
0.4.5
1.41.4
1.51.5
.7
.4
.1
.23.0
7.41.6
.62.03.12.83.23.0
3.01.61.61.01.61.41.1
.8
.81.3
.94.07.63.84.2
.7
.4
.4
.72.42.12.12.31.41.52.22.0
.8
.21.81.4
......."l*.6
.6
.41.8
.4..............
Bicar bonate (HCOs)
46
263634402030
1208081989361
19651
1174152114118116107103
2328213015371315
41496
100978319
35
4784672038243617294
2721418141
513
21
242
Sulfate(S04)
0.91.05.2
233 A u
178.8
218.6
593.5
1862.18.64.38.61.22.92.8
11556922.6
1137.2
243.08.84.5
492.5
11123.32.91.81.92.54.13.07.94.0
393.95.2
124.6
125.7
151.6
225.4
155.61.52.3
344.44.07.7
25
Chlo ride (Cl)
3.03.83.56.52.88.23.54.54.89.57.23.04.02.15.52.53.2
144.56.52.53.23.81.23.85.02.03.01.87.01.22.0
206.2
115.52 O
O
2.89.02.24.27.04.54.82.86.21.08.03.06.84.08 0
A
2.87.02.97.24.26.8
184.02.87.5
Eluo- ride (F)
0.0.0.1.9.1.1.0.1.0.0.0.7.19 6.0.1.0.0.0.1.1.1.1.1.2
1.0.0.0.2.2.0.0.0.0.6.1.3.2.0.0.2.1.0.1.2.3.1.0.1.3.0.1.1
1.0.4.1.0
1.1.0.0.1.1
Ni trate (N03)
5.0.4.3.4
.2
.81.3.3.0
1.1.0.0.0.0.0
7.9.0.0.0.0.0.1.0.8
1.2.3.0
1.3.0.0.0
1012
.0
.3
.0
.06.7
.0
.01.5
.08.5
.7
.0
.8
.5
.0
.0
.7
.2
.7
.0
.1101.3
.09.32.8
.3
.5
Dis solved solids
(residue on evap orationatiso'q
252173884784. oft
4975
143200113405119
93207
8628
2111703102142731 4.9Lt£t
2825179395650
12625397860
177150122115
60113888
14910545754780366716845388
11690168465285564
Hardness as CaCOj
Calcium, magne sium
45
1716OQ 6d
40152694
11360
2625844
13035
5145118196137170
18180
222515151481
9191117
6504
1220
33
429463141519451319
52618474536
74612
52424
Non- car bon - ate
000000010
470
1820
00430
1024075
9632002
50078600004104
268000
1500241
14
23
361045
23
Specific conduct
ance (micro - mhos at
25eC)
33.524.565.3
135SQ ^oy .0
14459.5
111218281160539164
326105
33.732326043832038717839968.4
12247.280.543.1
19431.060.0
12378.7
196181165144
87.919.040.7
11622915554.3
10857.5
11848.8
11128.5
12455.7
125
12131.2
12810540.8
13997.8
pH
5.76.77.27.1fi 9U J
n c / .O7.57.37.26.67.07.36.97 91 £
7.77.05.17.57.47.77.67.68.37.77.46.96.86.56.68.86.56.65.76.07.16.77.06.86.26.26.36.77.76.97.17.46.89.16.77.35.97.46.97.77.67.05.97.04.84.76.84.8
Color (units)
37
17286
1652011245133542432734523
1231074654
3024
722446344
1102
35432
13015
32
263
See footnotes at end of table.
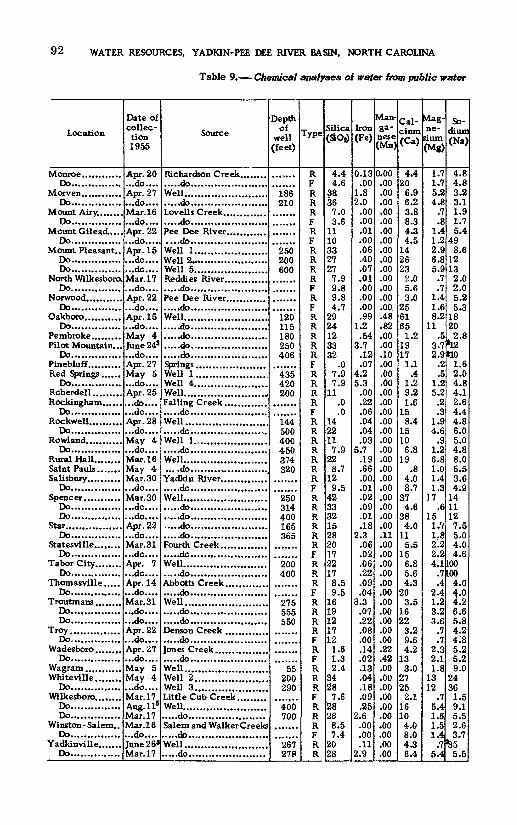
92 WATER RESOURCES, YADKIN-PEE DEE RIVER BASIN, NORTH CAROLINA
Table 9. Chemical analyses of water from public water
Location
Do...............
Do...............Mount Airy........
Do...............Mount Gilead.....
Do...............Mount Pleasant..
Do............... Do...............
North Wilkesboro. Do...............
Norwood...........Do...............
Oakboro...........Do...............
Pilot Mountain... Do...............
Pinebluff..........Red Springs ......
Do............... Roberdell .........Rockingham......
Do...............Rockwell..........
Do...............Rowland...........
Do...............Rural Hall........
Do...............
Do...............Do...............
Star................. Do...............
Statesville........Do...............
Tabor City........Do...............
Thomasville..... Do...............
Troutmans........Do...............Do...............
Troy......... .....Do...............
Wadesboro ........Do...............
Wagram.... .......Whiteville. .......
Do...............Wilkesboro........
Do...............Do...............
Winston- Salem.. Do...............
Yadkinville....... Do...............
Date of collec - tion 1955
Apr. 20 ...do....Apr. 27 ...do....Mar. 16 ...do....Apr. 22 ...do....Apr. 15 ...do.... ...do.... Mar. 17 ...do....Apr. 22 ...do....Apr. 15 ...do....May 4 June 24s ...do....Apr. 27 May 5 ...do.... Apr. 25 ...do.... ...do....Apr. 28 ...do....May 4 ...do....Mar. 16 May 4 Mar. 30
Mar.30 ...do.......do....Apr. 22 ...do....Mar. 31 ...do....Apr. 7 ...do....Apr. 14 ...do....Mar.31 ...do.......do....Apr. 22 ...do....Apr. -Zl ...do....May 5 May 4 ...do.... Mar. 17 Aug. 11s Mar.17 Mar.16 ...do.... June 26s Mar.17
Source
.....do.......................Well..............................do.......................Lovells Creek..................do.......................
....do.......................Well 1............ ..........Well 2«...... ........ . ......Well 5......................Reddies River..................do.......................Pee Dee River.................do.......................Well..............................do..... ..................
.....do.......................
.....do.......................Springs .....................Well 1 .....................Well 4......................Well.........................Falling Creek..................do.......................Well..............................do.......................Well 1......... .............. ....do.... ....... . ......... ..Well.............................do.......................
YadWn River...................do... ........... . ...Well..............................do............................do............................do....................... .....do.......................Fourth Creek..............
Well..............................do.......................Abbotts Creek..................do.......................Well..............................do............................do.......................
.....do.......................
.....do.......................Well.........................Well 2................... ..WeD 3......................Little Cub Creek.........Well..............................do....................... Salem and Walker Creeks .....do........................ Well.........................
Depth of
well (feet)
186 210
250 200 600
120 115 180 250 406
435 420 200
144 500 400 450 374 320
250 314 400 165 365
200 400
275 555 550
55 200 290
400 700
"267 278
Type
R F R R R F R F R R R R F R F R R R R R F R R R R F R R R R R R R F R R R R R R F R R R F R R R R F R F R R R F R R R F R R
Silica(Sod
4.4 4.6
38 36 7.0 3.6
11 10 33 27 27 7.9 9.8 9.8 4.7
29 24 12 33 32
.0 7.9 7.9
11 .0 .0
14 22 11 7.9
22 8.7
12 9.5
42 33 32 15 28 20 17 22 17 8.5 9.5
16 19 12 17 12
1.6 1.3 2.4
34 28
7.6 28 26 8.5 7.4
20 28
Iron (Fe)
0.13 .00
1.8 2.0
.00
.00
.01
.00
.06
.40
.07
.01
.00
.00
.00
.99 1.2 .54
3.7 .12 .07
4.2 5.3
.00
.22
.06
.04
.04
.03 5.7
.19
.66
.00
.01
.02
.09
.01
.18 2.3
.06
.02
.06
.22
.09
.04 8.3 .07 .22 .08 .00 .14 .02 .13 .04 .18 .09 .25
2.6 .00 .00 .11
2.9
Man ga nese (Mn)
0.00 .00 .00 .00 .00 .00 .00 .00 .00 .00 .00 .00 .00 .00 .00. .48 .82 .00 .00 .10 .00 .00 .00 .00 .00 .00 .00 .00 .00 .00 .00 .00 .00 .00 .00 .00 .00 .00.11.00 .00 .00 .00 .00 .00 .00 .00 .00 .00 .00 .22 .42 .00 .00 .00 .00 .00 .00 .00 .00 .00 .00
Cal cium (Ca)
4.4 20
6.9 6.2 3.8 8.3 4.3 4.5
14 26 23
2.0 5.6 3.0
25 61 65
1.2 19 17
1.1 .4
1.2 9.2 1.6
15 8.4
15 10
6.8 19
.8 4.0 8.7
37 4.6
38 4.0
11 5.5
15 6.8 5.6 4.3
20 3.5
16 22
3.2 9.6 4.2
13 3.0
27 25
2.1 16 10 4.0 8.0 4.3 6.4
Mag ne sium (Mg)
1.7 1.7 5.2 4.8
.7
.8 1.4 1.2 2.9 6.8 5.9
.7
.7 1.4 1.6 8.2
11 .5
3.7 2.9
.2
.5 1.2 5.2
.2
.3 1.9 4.6
.9 1.2 6.8 1.0 1.4 1.3
17 .6
15 1.7 1.8 2'.2 2.2 4.1
.7
.4 2.4 1.2 3.2 3.6
.7
.7 2.3 2.1 1.8
13 12
.7 5.4 1.6 1.5 1.4
.7 5.4
So dium (Na)
4.8 4.8 3.2 3.1 1.9 1.7 5.4
49 8.6
12 13 2.0 2.0 5.2 5.3
18 20 2.8
*12no
1.6 2.0 4.8 4.1 2.6 4.4 4.8 6.0 5.0 4.8 8.0 6.5 3.6 4.9
14 11 12 7.5 5.0 4.0 4.6
LOO LOO
4.0 4.0 4.2 6.6 5.8 4.2 4.8 5.2 5.2 9.0
24 36 1.5 9.1 5.5 2.6 3.7
%5 5.5

PUBLIC WATER-SUPPLY SYSTEMS
supplies in the Yadkin-Pee Dee River basin Continued
93
Po tas sium (K)
1.51.57.77.4
.7
.81.31.4
.4
.3
.5
.8
.91.11.3
.4
.41.9
......."*!o.3.7.6.4.3.3.4.7
1.63.71.61.21.42.32.01.8
.0
.01.31.2
146.01.81.51.61.82.21.0
.82.21.92.47.3
11.6
2.61.01.71.7
3.4
Bicar bonate CHCOj)
213054521520229265778612101829
145157
900 t/O
80924
293
1343732831
1090
2125
12626
15820363330
301271
1838255883182323202
203234
10514518189344
Sulfate (SO,)
6.8317.38.13.79.76.7
403.4
129.12.3
116.7
546441
3.66.37.0
.73.57.12.23.0
301.92,17.24.56.59.63.9
1028
1.120
1.213
3.926
1.82.25.5
332.34.0
112.9
105.5
26.5
1.9.6
2.93.83.05.2
128.4
17
Chlo ride (Cl)
5.8102.01.81.52.53.25.04.5
229.51.03.03.54.5
25542.82.51.8
.13.57.28.53.85.03.53.26.02.82.58.53.04.5
264.5
147.82.82.04.24.56.52.06.21.58.52.03.07.26.8
10106.57.21.5
122.52.85.02.01.0
Fluo- ride (F)
0.0.1.2.2.0.0.1.0.1.0.1.0.0.1.1.1.1.0.5A. Tt
.0
.0
.0
.0
.01.1
.0
.0
.0
.1
.2
.0
.11.0
.1
.1
.2
.0
.0
.0
.0
.6
.8
.1
.2
.1
.1
.1
.0
.0
.1
.2
.0
.0
.0
.0
.0
.1
.11.2
.5
.0
Ni trate (NO,)
0.4.2.0.6.2.2.4.4
4.11115
.8
.0
.7
.7
.0
.0
.0
.0
.0
.0
.0
.320
.8
.0
.52.01.2
.0
.02.5
.8
.517
9.56.44.0
.0
.0
.0
.8
.31.1
.0
.03.1
.01.3
.2
.3
.024
.6
.8
.023
1.4.5.8.1.0
Dis solvedsolids
(residue on evaporation
atlfiO'C)59
102104102
314250
158110180159
304047
120290328
30
13263995146970
1016249
124434258
26790
22756865688
302276
6010354
1051154869578070
213239
29142
784154
11793
Hardness as CaCOj
Calcium, magne sium
1856383512241616489282
8171369
186208
563S4O^t
438
445
382956292276
61627
16114
15617352346341713601454691127204215
118115
8623216261438
Non- car bon -ate
131
0008000
2912
090
456779
0
015
212
2700600606
570
27150
21000
29061081
2513
000
2001
11
2
Specificconduct
ance (micro- mhos at
25'C)
67.215111410736.563.360.0
246136247225
28.953.354.3
179431496
30.7
21.825.953.4
12024.9
10884.2
13890.771.3
19276.752.686.1
38884.3
35373.196.168.6
128470439
57.315551.1
14916543.182.174.7
131102334384
26.6142
91.952.183.7
109
PH
6.97.57.17.16.77.97.39.16.86.56.76.96.57.08.67.27.35.67.17.16'.45.65.76.96.46.66.66.96.66.47.34.56.97.46.76.17.06.06.76.96.87.98.47.38.26.26.67.67.17.46.96.64.77.87.86.66.46.96.86.67.76.6
Color (units)
5067
1617
30505572
168222846270
90532532544221007425
373275
226
406121722
10733
1 1953 *19492 Na + K, calculated. 5 1954S1947
94 WATER RESOURCES. YADKIN-PEE DEE RIVER BASIN, NORTH CAROLINA
BLADENBORO, BLADEN COUNTY
Ownership: Municipal. Population served: 908. Source: 2 wells, 190 and 327 feet deep. The yield is reported to be 200 and 30( gpm. Treatment: None. Elevated storage: 100,000-gallon ele vated tank.
BOONVILLE, YADKIN COUNTY
Ownership: Municipal. Population served: 572. Source: 1 well, 251 feet deep. The yield is reported to be 75 gpm. Treatment: None. Elevated storage: 75,000-gallon elevated tank.
BRUNSWICK, COLUMBUS COUNTY
Ownership: Redden Gaskin. Population served: 350. Source: 1 well, 360 feet deep. Treatment: None. Storage: 1,000-gallon pressure tank.
CANDOR, MONTGOMERY COUNTY
Ownership: Municipal. Population served: 617. Source: 3 wells (Nos. 1-3), 175, 70, and 65 feet deep. The yields are reported to be 23, 15, and 10 gpm respectively. Treatment: Caustic soda is used for well 1 to remove iron. Candor will change to a surface source (impoundment of an unnamed stream). A filter plant is un der construction.
CHADBOURN, COLUMBUS COUNTY
Ownership: Municipal. Population served: 2, 100. Source: 2 wells each 107 feet deep. The yield is reported to be 250 gpm from each well. Treatment: None. Elevated storage: 60,000-gallon elevated tank.
CHINA GROVE, ROWAN COUNTY
Ownership: Municipal. Population served: 1, 812. Source: 3 wells (Nos. 1, 3, 4) 683, 714, and 750 feet deep. The yields are reported to be 105, 90, and 42 gpm respectively. Treatment: None. Elevated storage: 75,000-gallon elevated tank.
PUBLIC WATER- SUPPLY SYSTEMS 95
CLARKTON. BLADEN COUNTY
Ownership: Municipal. Population served: 165. Source: 1 well, 252 feet deep. Treatment: None. Elevated storage: 90, 000-gallon elevated tank.
CLEVELAND. ROWAN COUNTY
Ownership: Municipal. Population served: 580. Source: 3 wells (Nos. 1-3), 186, 275, and 446 feet deep. The yields are reported to be 24, 12, and 75 gpm respectively. Treatment: None. Elevated storage: 75, 000-gallon elevated tank.
CONCORD, CABARRUS COUNTY
Ownership: Municipal. Population served: 20,000. Source: Coldwater Creek impounded in reservoir (Lake Fisher). Auxiliary supply: Lake Concord supplied by several springs. Treatment: Coagulation with alum, ammoniation, chlorination, addition of activated carbon for control of taste and odor, sedimentation, rapid sand filtration, addition of Calgon and lime for corrosion control, postchlorination, and final adjustment of pH with lime. Rated capacity of treatment plant: 6 mgd. Raw-water storage: Lake Fisher and Lake Concord 1, 100 million gallons and 450 million gallons respectively. Finished-water storage: Clear well, 2 million gallons; 2 elevated tanks, 500,000 and 1 million gallons; at old plant, 1. 5 million gallons. The raw-water intake is about 5 miles north of the treatment plant, which is north of the city in Wil-Mar Park section.
COOLEEMEE, DAVIE COUNTY
Ownership: Erwin Cotton Mills Co. Population served: 1, 925. Source: South Yadkin River. Treatment: Prechlorination, coag ulation with alum and soda ash, rapid sand filtration, addition of Calgon for corrosion control, postchlorination, and final adjust ment of pH with soda ash. Rated capacity of treatment plant, 2 mgd. Ground storage: 100,000-gallon clear well. Elevated stor age: 2 standpipes, 200,000 and 210,000 gallons respectively.
DENTON, DAVIDSON COUNTY
Ownership: Municipal. Population served: 1, 050. Source: Lick Creek impounded. Treatment: Coagulation with alum and lime, and chlorination. Rated capacity of treatment plant: 250, 000 gpd.
96 WATER RESOURCES, YADKIN-PEE ME RIVER BASIN, NORTH CAROLINA
Ground storage: 1 clear well, 15, 000 gallons. Elevated storage: 100, 000-gallon elevated tank.
ELKEV, SURRY COUNTY
Ownership; Municipal. Population served: 6,000. Source: Elkin River. Treatment: Coagulation with alum and lime, sedimentation, rapid sand filtration, addition of Calgon for corrosion control, final adjustment of pH with lime, and chlorination. Rated capacity of treatment plant: 1.5 mgd. Ground storage: 500,000-gallon clear well. Elevated storage: 4 elevated tanks, 1 million, 100,000, 25,000 and 75,000 gallons respectively. Filtration plant located in southwest section of Elkin. Jonesville is supplied by the Elkin municipal supply.
ELLERBE, RICHMOND COUNTY
Ownership: Municipal. Population served: 1,000. Source: 3 wells (Nos. 1 2, 4), 115, 120, and 200 feet deep. Treatment: None: Elevated storage: 100,000-gallon elevated tank.
FAIR BLUFF, COLUMBUS COUNTY
Ownership: Municipal. Population served: 200. Source: 2 wells, 165 and 145 feet deep. Treatment: Chlorination of well 2. Elevated storage: 75, 000-gallon elevated tank.
FAKMONT, ROBESON COUNTY
Ownership: Municipal. Population served: 2,800. Source: 3 wells (Nos. 2, 4, 5), 300, 333, and 490 feet deep. Well 5 used for emergency only. The yields are reported to be 100, 500, and 250 gpm, respectively. Treatment: Addition of Calgon for corrosion control. Ground storage: 100,000-gallon reservoir. Elevated storage: 2 elevated tanks, 60,000 and 100,000 gallons.
GIBSON, SCOTLAND COUNTY
Ownership: Municipal. Population served: 609. Source: 1 well, 175 feet deep. The yield is reported to be 150 gpm. Treatment: Chlorination, addition of Calgon and soda ash for softening and corrosion control. Ground storage: None. Elevated storage: 100, 000-gallon elevated tank.

PUBLIC WATER- SUPPLY SYSTEMS 97
HAMLET. RICHMOND COUNTY
Ownership: Hamlet Water Co. Population served: 5,100. Source: Marks Creek impounded. Treatment. Prechlorination, coagu lation with alum, sedimentation, rapid sand filtration, addition of Calgon for corrosion control, final adjustment of pH with lime, postchlorination. Rated capacity of treatment plant: 1. 5 mgd. Ground storage: 1 clear well, 200,000 gallons. Elevated storage: 2 elevated tanks, 100,000 and 150, 000 gallons respec tively. Filtration plant located in southeastern part of Hamlet.
HUNTERSVILLE, MECKLENBURG COUNTY
Ownership: Municipal. Population served: 900. Source: 6 wells (Nos. 1-6), 60, 180, 96, 197, 300, and 148 feet deep. The total yield is estimated to be 70 gpm. Treatment: None. Elevated storage: 80,000-gallon elevated tank.
KANNAPOLIS, CABARRUS COUNTY
Ownership: Cannon Mill Co. Population served: 24,200. Source: Buffalo Creek impounded for the regular supply. Coddle Creek serves as an auxiliary supply. The intake at the dam is about 1^ miles west of Kannapolis. Treatment: Domestic: Prechlorination, coagulation with alum, sedimentation, addition of carbon for con- control of taste and odor, rapid sand filtration, ammoniation, postchlorination, and softening with soda ash. Industrial: Pre chlorination, coagulation with alum, sedimentation, addition of carbon for control of taste and odor, rapid sand filtration, and softening with soda ash. Rated capacity of treatment plant: 7. 5 mgd. Raw-water storage: Impounding reservoir, 1,250 million gallons. Finished-water storage: Drinking water system: 2 ele vated tanks, 250,000 gallons each; 2 clear wells, 100,000 and 75, 000 gallons. Industrial and sprinkler system: 1 open reser voir, 98 million gallons; 2 standpipes, 250, 000 gallons each; 4 elevated tanks, 250,000,100,000, 100,000, and 75,000 gallons.
KERNERSVILLE, FORSYTH COUNTY
Ownership: Municipal. Population served: 2,550. Source: Belew Creek impounded. Reservoir on Harmonds Creek will be used as auxiliary supply. Treatment: Coagulation with alum and lime, addition of carbon for control of taste and odor, rapid sand filtration, final adjustment of pH with lime, and chlorination. Rated capacity of treatment plants, 1 mgd. Ground storage: 1

98 WATER' RESOURCES, YADKIN-PEE DEE RIVER BASIN, NORTH CAROLINA
clear well, 300,000 gallons. Elevated storage: 100,000-gallon elevated tank. Filtration plant is located on Highway 421 toward Wins ton-Salem.
LANDIS, ROWAN COUNTY
Ownership: Municipal. Population served: 3,000. Source: 2 lakes on Grants Creek (12 and 65 million gallons). Auxiliary supply: 6 wells ranging in depth from 406 to 1, 009 feet. Treat ment of surface water supply: Coagulation with alum and lime, prechlorination, sedimentation, addition of carbon for control of taste and odor, rapid sand filtration, softening with soda ash, and addition of Calgon for control of corrosion. Rated capacity of treatment plant: 1 million gallons. Ground storage: 1 clear well, 250, 000 gallons. Elevated storage: 100, 000-gallon elevated tank. Filtration plant is located about 1 mile north of Landis.
LAURINBURG, SCOTLAND COUNTY
Ownership: Municipal. Population served: 8,000. Source: Jordan Creek. Auxiliary supply: 1 well, 390 feet deep, with a reported yield of 525 gpm. Treatment: Coagulation with alum and lime, rapid sand filtration, chlorination, addition of Calgon for corrosion control, final adjustment of pH with lime. Rated capacity of treat ment plant: 1 mgd. Raw-water storage: 500,000 gallons. Elevated storage: 2 elevated tanks, 100,000 and 200,000 gallons.
LEXINGTON, DAVIDSON COUNTY
Ownership: Municipal. Population served: About 16,000. Source: Abbotts Creek. The intake is about 4 miles northeast of Lexington. Leonard Creek impounded in Leonard Lake is used as an auxiliary or emergency supply. Treatment: Prechlorination, coagulation with alum, air-mix flocculation, sedimentation, rapid sand filtra tion, postchlorination (if required), final adjustment of pH with lime, fluoridation. Rated capacity of treatment plant: 3. 5 mgd. Raw-water storage: Leonard Lake, 365 million gallons. Finished- water storage: At plant, 1 million gallons; 1 elevated tank, 1 mil lion gallons; 1 standpipe, 350,000 gallons. The treatment plant is located 4. 1 miles northeast of Lexington on the Greensboro Road.
LILESVILLE, ANSON COUNTY
Ownership: Municipal. Population served: 1,000. Source: 2 wells, 300 and 472 feet deep. The yield is reported to be 40 gpm

PUBLIC WATER-SUPPLY SYSTEMS 99
each. Treatment: None. Elevated storage: 75,000-gallon ele vated tank.
LUMBEBTON, BOBESON COUNTY
Ownership: Municipal. Population served: 6,000. Source: Lum ber River; the intake is 2 miles west of the city. Auxiliary or emergency supply, 1 well, 545 feet deep, reported to yield 600 gpm. Treatment: Prechlorination, coagulation with alum and lime, sedimentation, rapid sand filtration, chlorination, final adjust ment of pH with lime, addition of Calgon for control of corrosion, and fluoridation. Rated capacity of treatment plant: 2. 25 mgd. Raw-water storage: None. Finished-water storage: 1 clear well, 750,000 gallons; 1 elevated tank, 300,000 gallons. Filtration plant is located on corner of 6th and Water Street in Lumberton.
MAXTON, ROBESON COUNTY
Ownership: Municipal. Population served: 2,075. Source: 2 wells, 400 and 70 feet deep. The reported yields are 500 and 125 gpm, respectively. Treatment: Water is pumped from wells to 200, 000-gallon ground reservoir. Water is pumped from reser voir to elevated tank and sodium hydroxide is added on the pres sure side of the pump. Ground storage: 200,000-gallon reservoir. Elevated storage: 100, 000-gallon elevated tank.
MOCKS VILLE. DAY IE COUNTY
Ownership: Municipal. Population served: 2,200. Source: Bear Creek. The intake is located on Bear Creek, f mile west of filter plant. Treatment: Coagulation with alum, prechlorination, sedi mentation, rapid sand filtration, softening with lime, addition of Calgon for control of corrosion. Rated capacity of treatment plant: 250,000 gpd. Ground storage: 100,000-gallon clear well. Elevated storage: 100,000-gallon elevated tank. Filtration plant is located on Sanford Avenue at city limits.
MONROE. UNION COUNTY
Ownership: Municipal; also supplies Wingate and Marshville. Population served: 12,700. Source: Richardson Creek impounded in Lake Lee. The intake at Lake Lee is 2 miles east of treatment plant. Treatment: Prechlorination, coagulation with alum and lime, addition of carbon for control of taste and odor, sedimenta tion, rapid sand filtration, postchlorination, and addition of Calgon
100 WATER RESOURCES, YADKIN-PEE DEE RIVER BASIN, NORTH CAROLINA
for corrosion control. Rated capacity of treatment plant: 2 mgd. Raw-water storage: 450 million gallons. Finished-water storage: 2 clear wells, 420,000 and 540, 000 gallons; 4 elevated tanks, 165,000, 500,000, 135,000 and 50,000 gallons. Filtration plant is located ^ mile east of main part of Monroe.
MORVEN, ANSON COUNTY
Ownership: Municipal. Population served: 601. Source: 2 wells, 210 and 186 feet deep. The yields are reported to be 35 and 55 gpm, respectively. Treatment: Chlorination. Elevated storage: 100, 000-gallon elevated tank.
MOUNT AIRY, SURRY COUNTY
Ownership: Municipal. Population served: 7, 500. Source: Lovells Creek. The intake on Lovells Creek is about 5 miles northeast of the treatment plant, which is on Orchard Street in the city. Treatment: Coagulation with lime and alum, sedimentation, rapid sand filtration, and chlorination. Rated capacity of treat ment plant: 3 mgd. Raw-water storage: None. Finished-water storage: 2 clear wells, 500,000 and 160,000 gallons; 2 elevated tanks, 150,000 and 500,000 gallons; 1 standpipe, 200,000 gallons.
MOUNT GILEAD, MONTGOMERY COUNTY
Ownership: Municipal. Population served: 1,500. Source: Pee Dee River impounded in Lake Tillery. Treatment: Coagulation with alum and soda ash, sedimentation, rapid sand filtration, and final adjustment of pH with soda ash. Rated capacity of treatment plant: 250,000 gpd. Raw-water storage: None. Ground storage: 250,000- gallon clear well. Elevated storage: 100,000-gallon elevated tank. Filtration plant is located 0. 9 mile west of Mount Gilead on Lake Tillery.
MOUNT PLEASANT, CABARRUS COUNTY
Ownership: Municipal. Population served: 2,400. Source: 5 wells (Nos. 1-5), 250, 360, 200, 263, and 600 feet deep. Treat ment: Chlorination. Ground storage: 10,000-gallon reservoir. Elevated storage: 100, 000-gallon elevated tank.
PUBLIC WATER- SUPPLY SYSTEMS 101
NORTH WILKESBORO, WILKES COUNTY
Ownership: Municipal. Population served: 5, 000. Source: Red- dies River impounded. Treatment: Coagulation with alum, rapid sand filtration, chlorination, final adjustment of pH with lime. Rated capacity of treatment plant: 3 mgd. Ground storage: 2 clear wells, 150,000 and 1 million gallons. Elevated storage: 2 elevated tanks, 100,000 and 200,000 gallons, and 1 standpipe, 140, 000 gal lons. Filtration plant is located on I Street in North Wilkesboro.
NORWOOD, STANLY COUNTY
Ownership: Municipal. Population served: 2,150. Source: Pee Dee River. Treatment: Coagulation with alum and lime, sedimen tation, rapid sand filtration, final adjustment of pH with lime, and chlorination. Rated capacity of treatment plant: 500,000 gpd. Ground storage: 1 clear well, 28,000 gallons, and 1 storage reser voir, 200,000 gallons. Elevated storage: 6,000-gallon elevated tank. Filtration plant is located about one block northeast of main part of Norwood.
OAKBORO, STANLY COUNTY
Ownership: Municipal. Population served: 700. Source: 2 wells, 115 and 120 feet deep. Treatment: Addition of Calgon for corro sion control, and chlorination. Ground storage: None. Elevated storage: 75, 000-gallon elevated tank.
PEMBROKE, ROBESON COUNTY
Ownership: Municipal. Population served: 1,200. Source: 1 well, 180 feet deep. The reported yield is 150 gpm. Treatment: Aeration, chlorination, and addition of lime. Ground storage: 30, 000-gallon reservoir. Elevated storage: 2 standpipes, 10,000 gallons each and 2 elevated tanks, 50,000 and 75,000 gallons.
PILOT MOUNTAIN, SURRY COUNTY
Ownership: Municipal. Population served: 1,600. Source: 2 wells,384 and 406 feet deep. Treatment: None. Elevated storage: 100, 000-gallon elevated tank.
102 WATER RESOURCES, YADKIN-PEE DEE RIVER BASIN. NORTH CAROLINA
PINEBLUFF, MOORE COUNTY
Ownership: Municipal. Population served: 700. Source: 5 cased springs supplying approximately 50, 000 gpd. Auxiliary supply: 500, 000-gallon lake. Treatment: Chlorination. Elevated storage: 50, 000-gallon elevated tank.
RED SPRINGS, ROBESON COUNTY
Ownership: Municipal. Population served: 2, 535. Source: 3 wells (Nos. 1, 2, 4), 435, 350, and 420 feet deep. The yield is reported to be 500, 180, and 600 gpm. Well 3 is used for an emer gency supply. Treatment: Aeration, coagulation with lime, filtra tion, and chlorination. Ground storage: 85, 000-gallon reservoir. Elevated storage: 75, 000-gallon elevated tank.
ROBERDELL, RICHMOND COUNTY
Ownership: Municipal. Population served: 400. Source: 1 well, 200 feet deep. Treatment: None. Elevated storage: 56, 000-gallon standpipe.
ROCKINGHAM, RICHMOND COUNTY
Ownership: Municipal. Population served: 3,900. Source:. Falling Creek impounded in 20 million-gallon reservoir. Auxiliary supply: Hitchcock Creek, which is about 5 miles northwest of treatment plant, impounded. Treatment: coagulation with alum and lime, addition of carbon for control of taste and odor, rapid sand filtration, postchlorination, final adjustment of pH with lime, fluoridation, addition of Calgon for corrosion control. Rated capacity of treatment plant: 1. 5 mgd. Ground storage: 300, 000- gallon clear well. Elevated storage: 2 elevated tanks, 75, 000 and 300, 000 gallons. Filter plant located on U. S. Highway 74 south, at city limits.
ROCKWELL, ROWAN COUNTY
Ownership: Municipal. Population served: 1,050. Source: 2 wells, 144 and 503 feet deep. The reported yields are 100 and 85 gpm, respectively. Treatment: None. Elevated storage: 100,000- gallon elevated tank.

PUBLIC WATER-SUPPLY SYSTEMS 103
ROWLAND, ROBESON COUNTY
Ownership: Municipal. Population served: 1,293. Source: 2 wells, 360 and 450 feet deep. The reported yields are 500 and 300 gpm, respectively. Treatment: None. Ground storage: 125,000- gallon reservoir. Elevated storage: 75, 000-gallon elevated tank.
RURAL HALL, FORSYTH COUNTY
Ownership: Rural Hall Sanitary District. Population served: 1,000. Source: 2 wells, 350 and 376 feet deep. Treatment: None. Elevated storage: 75,000-gallon elevated tank.
SAINT PAULS, ROBESON COUNTY
Ownership: Municipal. Population served: 2, 500. Source: 2 wells, 300 and 135 feet deep. The reported yields are 400 and 120 gpm respectively. Well 2 is used for emergency. Treatment: Addition of Nalco-18 for corrosion control. Ground storage: 100, 000-gallon reservoir. Elevated storage: 100, 000-gallon ele vated tank.
SALISBURY, ROWAN COUNTY
Ownership: Municipal; also supplies Spencer and East Spencer in case of emergency. Population served: 26,600. Source: Yadkin River. Grants Creek is used in extreme emergency. The intake is at the junction of Yadkin and South Yadkin Rivers about 8 miles from the treatment plant, which is on Kerr Street in the city. Treatment: Prechlorination at raw-water reservoir and at plant (breakpoint), coagulation with alum, sedimentation, rapid sand filtration, fluoridation, and adjustment of pH with lime. Rated capacity of treatment plant: 4 mgd. Raw-water storage. Reser voir (near river), 8 million gallons. Finished-water storage: 2 clear wells, 750, 000 and 1 million gallons; 2 elevated tanks, 1 million and 250, 000 gallons.
SPENCER, ROWAN COUNTY
Ownership: Municipal. Population served: 4,000. Source: 3 wells (Nos. 1-3), 250, 314, and 400 feet deep. Treatment: None. Elevated storage: 2 elevated tanks 75,000 and 100, 000 gallons.

104 WATER RESOURCES, YADKIN-PEE DEE RIVER BASIN. NORTH CAROLINA
STAR, MONTGOMERY COUNTY
Ownership: Municipal. Population served: 850. Source: 3 wells (Nos. 1-3), 180, 200, and 300 feet deep. The yields are reported to be 55, 35, and 168 gpm respectively. Treatment: No treatment for wells 1 and 2. Soda ash is used for well 3. Elevated storage: 75, 000-gallon elevated tank.
STATESVILLE, IREDELL COUNTY
Ownership: Municipal. Population served: 18,600. Source: Fourth Creek. Morrison Creek emergency supply. The intake is about 1, 600 feet north of the treatment plant, which is approxi mately 2 miles north of Statesville. Treatment: Prechlorination, coagulation with alum and lime, addition of activated carbon (if needed), sedimentation, rapid sand filtration, postchlorination (if needed), addition of Calgon for control of corrosion, and adjust ment of pH with lime. Rated capacity of treatment plants, 3 mgd. Raw-water storage: None. Finished-water storage: 2 elevated tanks, 1 million gallons each; 1. 1-million-gallon clear well.
TABOR CITY, COLUMBUS COUNTY
Ownership: Municipal. Population served: 2,200. Source: 3 wells (Nos. 1-3), 600, 200, and 350 feet deep. Treatment: None. Elevated storage: 75,000-gallon elevated tank.
THOMASVILLE, DAVIDSON COUNTY
Ownership: Municipal. Population served: 16,000. Source: Abbotts Creek. The intake is about 4 miles northwest of the treat ment plant, which is l£ miles west of the center of Thomasville on U. S. Highway 70. Treatment: Prechlorination, coagulation with alum and lime, sedimentation, rapid sand filtration, postchlorina tion at times, and adjustment of pH with lime. Rated capacity of treatment plants: 1. 5 mgd; plant capacity is being increased to 3 mgd. Raw-water storage: None. Finished-water storage: 1 clear well, 480,000 gallons; 1 elevated tank, 1 million gallons.
TROUTMANS, IREDELL COUNTY
Ownership: Municipal. Population served: 1,050. Source: 4 wells (Nos. 1-4), 275, 555, 550, and 475 feet deep. The yields are reported to be 20, 30, 35, and 150 gpm respectively. Treatment: None. Elevated storage: 50,000-gallon elevated tank.
PUBLIC WATER-SUPPLY SYSTEM? 105
TROY, MONTGOMERY COUNTY
Ownership: Municipal. Population served: 3,000. Source: Denson Creek impounded. Auxiliary supply: 50-million gallon reservoir. Treatment: Coagulation with alum, prechlorination, sedimentation, rapid sand filtration, postchlorination, and final adjustment of pH with lime. Ground storage: 350,000-gallon clear well. Elevated storage: 75, 000-gallon elevated tank. Filtration plant is located half a mile north of the center of Troy.
WADESBORO, ANSON COUNTY
Ownership: Municipal. Population served: 5,000. Source: Jones Creek impounded. Treatment: Coagulation with alum and lime, sedimentation, rapid sand filtration, adjustment of pH with lime, addition of Calgonfor corrosion control, and chlorination. Ground storage: 500, 000-gallon clear well. Elevated storage: 2 elevated tanks, 75,000 and 300,000 gallons.
WAGRAM, SCOTLAND COUNTY
Ownership: Municipal. Population served: 400. Source: 1 well, 55 feet deep. Treatment: None. Ground storage: None. Elevated storage: 100, 000-gallon elevated tank.
WIHTEVILLE, COLUMBUS COUNTY
Ownership: Municipal. Population served: 5,200. Source: 2 wells (Nos. 2, 3), 200 and 290 feet deep. The reported yields are 500 and 350 gpm respectively. Treatment: None. Elevated stor age: 60, 000-gallon elevated tank.
WILKESBORO, WILKES COUNTY
Ownership: Municipal. Population served: 1,875. Source: Cub Creek impounded and 2 wells, 400 and 700 feet deep. Treatment: Surface-water supply,chlorinated. Ground-water supply, no treat ment. Wells are pumped directly into distribution system to supplement surface-water supply. Elevated storage: 200,000- gallon standpipe.

106 WATER RESOURCES, YADKIN-PEE DEE RIVER BASIN, NORTH CAROLINA
WINSTON-SALEM, FORSYTH COUNTY
Ownership: Municipal. Population served: 100,000. Source: Salem and Walker Creeks impounded in Salem Lake. The Yadkin River serves as an auxiliary or emergency supply, furnishing an additional 25 mgd. The intake on Salem Lake is 2 miles east of the treatment plant, which is about 2^ miles northeast of the center of the city. Treatment: Prechlorination, coagulation with alum, sedi mentation, rapid sand filtration, postchlorination, fluoridation, addition of Calgon for corrosion control, and adjustment of pH with lime. Rated capacity of treatment plant: 20 mgd. Raw-water storage: Salem Lake, 1, 250 million gallons, and 750, 000-gallon standpipe on Yadkin River. Finished-water storage: 3 clear wells, 2 million gallons each; 3 elevated tanks, 1 million, 200, 000, and 50, 000 gallons.
YADKEMVUXE, YADKIN COUNTY
Ownership: Municipal. Population served: 820. Source: 3 wells (School, South, No. 3), 286, 267, and 278 feet deep. Treatment: None. Elevated storage: 100,000-gallon elevated tank.
PRESENT WATER USE
Water uses are classified in many ways; in this report they are considered to be of either the withdrawal or the nonwithdrawal type. Withdrawal uses are those which remove, or divert, water from its natural medium and transport it elsewhere. Surface water that is withdrawn for many uses is returned in essentially undiminished quantity, commonly to the stream from which it was withdrawn. Thus the same water may be used many times if the quality has not been too greatly impaired. On the other hand, water withdrawn for irrigation, and distributed by sprinkler irri gation systems, as in North Carolina, is almost if not completely consumed. Irrigation, water-power, domestic, municipal, and industrial uses are of the withdrawal type. The uses of ground water are all of the withdrawal type.
Nonwithdrawal uses do not require diversion. Navigation, waste disposal, and most uses for recreation and for conservation of wildlife are examples of nonwithdrawal uses.
The total withdrawal of surface water for all uses, except water power, probably is in the order of 500 mgd. Total withdrawals of ground water aggregate about 100 mgd.
PUBLIC WATER-SUPPLY SYSTEMS 107
PRIVATE INDUSTRIAL SUPPLIES
Most industries in the basin of the Yadkin and Pee Dee Rivers use some water from public water-supply systems, but estimates of the quantities of water used are not available. Streamflow is used at various points in the basin for water power to operate grist mills, textile mills, and electric-power plants, for cooling water in steam-electric plants and other plants using steam power, and for processing textile products. Of the water withdrawn from streams for these uses, the greater part is returned to the stream from which it is withdrawn. The total volume of streamflow with drawn for industrial use including water power, is estimated to be about 20, 000 mgd.
Textile plants use the most ground water in the Yadkin-Pee Dee River basin. Most of these plants use ground water for drinking and some other purposes, but many use ground water for all or most of their operations. Many food-processing plants and several smaller industries use wells as a source of water supply. In dustrial use of ground water in the basin is estimated to be about 35 mgd.
PUBLIC SUPPLIES
The 36 public water-supply systems using ground water in the basin of the Yadkin and Pee Dee River use an estimated 12 mgd. The 28 public water-supply systems taking water from streams use approximately 75 mgd.
RURAL DOMESTIC SUPPLIES
All farm homes, and all urban homes not using water from public water systems, are assumed to use ground water exclu sively. Domestic water use in rural areas probably is about 40 mgd.
AGRICULTURAL USE
Many farm ponds in the Yadkin-Pee Dee River basin have been created by damming small streams or by devising hillside catch ment basins to trap rainfall and runoff. Sonre ponds in the flat areas of the Coastal Plain have been excavated to a depth of several feet below the water table, and, consequently, may be considered large dug wells as surface inflow is negligible. The ponds are used for fishing, stock watering, and irrigating farm crops. Prior to 1954
108 WATER RESOURCES, YADMN-PEE DEE RIVER BASIN, NORTH CAROLINA
little surface water was used for irrigation. During the drought period in the summer and fall of 1954. however, the practice of irrigation greatly increased. No estimate of the total volume of water used for agriculture is available but the amount is probably insignificant so far, in relation to the total supply in the basin. Irrigation during dry seasons may be expected to increase greatly in coming years.
There has been a significant increase in the use of water from wells for irrigation in recent years, although no reasonable esti mate can yet be made of the volume used. The expected increase in use of ground water for irrigation should not cause a large-scale lowering of ground-water levels if the wells are spaced widely enough.
OTHER USES
One of the most important nonwithdrawal uses of streamflow in this area is for waste disposal by industries and municipalities. Recreational activities in certain areas constitute a significant use of the surface waters of the basin.
In addition to the uses of ground water discussed in the preceding sections, wells furnish water for a variety of uses, including motels, laundries, and air conditioning. These miscellaneous uses of ground water account for an estimated 5 mgd.
POTENTIAL SUPPLY
SURFACE WATER
At the present time the demand for surface waters of suitable quantity and quality is increasing rapidly. The industrial expansion in the State, gains in population, greater use of automatic home appliances, and widespread installation of irrigation equipment have caused an upsurge in the use of water. The withdrawal of surface waters for these uses may be expected to increase in the future.
The present sources of surface water generally appear to be adequate to provide the quantities required in the near future for the continued development of the area. Although it is probable that in most places the present withdrawal can be increased several times without danger of a shortage of supply, the demand for water in many localities will grossly exceed minimum streamflow, and additional storage facilities will be necessary. The adequacy of

POTENTIAL SUPPLY 109
the surface-water supplies in several localities will depend in large measure upon pollution abatement.
Rainfall deficiencies during recent growing seasons have led to an increase in the volume of water used for irrigation, and similar rainfall deficiencies in the future will necessitate additional irri gation. Because of the humid climate in North Carolina irrigation will not be practiced on as large a scale as in the Western States; however, supplementary irrigation undoubtedly will be continued on an increasing scale.
GROUND WATER
In spite of the large percentage of the population using ground water in the Yadkin-Pee Dee River basin, the quantity now with drawn from wells is only a small fraction of the total supply available. A great expansion in use of ground water is possible throughout the basin so long as the withdrawal is not excessively concentrated.
An accurate determination of the potential ground-water supply could be determined only by interpreting hydrplogic data collected over a period of years. No ground-water studies have been made in about half the basin, and in the remainder only reconnaissance studies have been undertaken. Although detailed knowledge of the properties of the underground reservoirs have not been obtained, sufficient information is available to suggest areas of possible expansion and to point out some of the limitations on future development.
Domestic ground-water supplies (yields of a few gallons per minute) can be obtained throughout the basin and their development rarely presents a serious problem. Supplies for small munici palities and for small industrial use, but not for large-scale uses, are available in most parts of the Piedmont and in the western part of the Coastal Plain. In the Cretaceous sand in the eastern part of the Coastal Plain, large supplies for future mu nicipal and industrial use are available.
If future increases in ground-water withdrawals could be dis tributed throughout the basin in accordance with the productivity of the several aquifers, there would be no reason for concern about a depletion of ground-water storage. However, the with drawal of water is likely to be concentrated around industrial centers. The lowering of the water level around pumped wells is measurable for some distance outward from the wells, the shape and extent of the cone being dependent on the rate of pumping, the permeability of the water-bearing materials, and the recharge
110 WATER RESOURCES, YADKIN-PEE DEE RIVER EASIN, NORTH CAROLINA
conditions. If the areas of influence of two or more wells overlap, there will be some mutual interference, and the aggregate yield will be less than the combined yield of each well pumped sepa rately. A wide spacing of wells is important if large supplies of ground water are required. Consequently, it may not be possible for an industry to have several heavily pumped wells on its prop erty, whereas a municipality, being able to space its wells over several square miles, may be in a position to furnish a large ad ditional quantity of water for public use, including industrial use.
A limiting factor in future expansion of ground-water supplies in the easternmost part of the basin is the occurrence of salty water in some of the deeper beds. In Brunswick County and the adjoining part of Columbus County water having a chloride content greater than 250 ppm occurs at depths shallower than 300 feet. The withdrawal of water in this area at present is not great, and consequently there is no evidence of movement of salty water into the overlying fresh-water beds.
WATER LAWS
In North Carolina water rights, with only a few important ex ceptions, are based on the principal of riparian rights established under the English common law, as interpreted from time to time by various courts; however, by action of the 1955 General Assem bly a State Board of Water Commissioners was created which, upon the declaration of an emergency by the Govenor, is vested with the authority to make allocations of water for human con sumption, sanitation, and public safety.
In matters affecting public health, the statutes of North Carolina provide that the State Board of Health shall have control over do mestic waste discharges where such discharges are into waters used as sources of public water supplies.
The North Carolina State Stream Sanitation Committee, by ac tion of the General Assembly of 1951, was vested with the authority to establish standards applicable to the streams and watercourses of the State and with the responsibility of classifying such waters. Within the limits of the enabling act, control as to the manner and extent of disposal of sewage and waste and the maintenance of established stream standards rest with this Committee. Industries contemplating locating in North Carolina should clear with the State Stream Sanitation Committee plans and proposals for the disposal of waste into the streams of the State.
The General Statutes of 1943, as amended, provide that any person, firm, or corporation utilizing waters for irrigation that

SELECTED BIBLIOGRAPHY 111
are taken from any stream, river, creek, or lake in North Carolina, in an amount sufficient to reduce substantially the vol ume of flow, shall obtain a permit for such use from the Director of the Department of Conservation and Development.
Navigable streams are under the jurisdiction of Congress through its constitutional powers to "---regulatecommerce--- among the several States. " This power extends to the nonnavigable tributaries of navigable streams if the navigable capacity of the waterway or interstate commerce is affected. Flood control is also recognized as a Federal responsibility.
Control of navigable waters has been generally exercised by the Corps of Engineers, U. S. Army. Concurrent jurisdiction, however, is vested in the Federal Power Commission in the matter of permits and licenses where the construction and operation of hydroelectric installations are involved on navigable streams or tributaries thereto. The district office of the Corps of Engineers having jurisdiction over the navigable stream affected should be consulted where encroachment on a navigable stream is con templated, or regarding any proposed impoundment of or di version from such navigable stream or tributary thereto related to hydroelectric installations. The entire Yadkin-Pee Dee River basin lies within the jurisdiction of the Charleston, S. C., district of the Corps of Engineers.
SELECTED BIBLIOGRAPHY
American Water Works Association, 1950, Water quality and treatment, 2d ed. Billingsley, G. A., and Joyner, B. F., 1953, Chemical and physical character of surface
waters of North Carolina, 1951-52: N. C. Dept. of Conserv. and Devel., Bull. 52, v. 8. Collins, W. D., 1925, Temperature of water available for industrial use in the United
States, 1925: U. S. Geol. Survey Water-Supply Paper 529-F, p. 97-104. Dole, R. B., 1909, The quality of surface waters in the United States, pt. 1, Analysis of
waters east of the one hundredth meridian: U. S. Geol. Survey Water-Supply Paper 236. Harris, K, F., and Pauszek, F. H., 1951, Chemical character of surface waters of North
Carolina, 1949-50: N. C. Dept. of Conserv. and Devel., Bull. 52, v. 6. Johnson, T. S., and Mann, C. L., Jr., 1938, Discharge records of North Carolina streams,
1889-1936: N. C. Dept. Conserv. and Devel., Bull. 39. 220 p. Joyner, B. F., and Lamar, W. L., 1949, Chemical character of surface waters of North
Carolina, 1946-47: N. C. Dept. of Conserv. and Devel., Bull. 52, v. 3. Joyner, B. F., and Pauszek, F. H., 1949, Chemical character of surface waters of North
Carolina, 1947-48: N. C. Dept. of Conserv. and Devel., Bull. 52, v. 4. Lamar, W. L., 1947, Chemical character of surface waters of North Carolina, 1944-45:
N. C. Dept of Conserv. and Devel., Bull. 52, v. 1. 1948, Chemical character or surface waters of North Carolina, 1945 46: N. C. Dept.
of Conserv. and Devel., Bull. 52. v- 2. LeGrand, H. E., 1954, Geology and ground water resources of the Statesville area, North
Carolina: N. C. Dept. Conserv. and Devel., Bull. 68, 68 p. LeGrand, H. E., and Mundorff, M. J., 1952, Geology and ground-water resources of the
Charlotte area, North Carolina: N. C. Dept. Conserv. and Devel., Bull. 63, 88 p. Lohr, E. W., and Love, S. K., 1955, The industrial utility of public water supplies in the
United States, 1952, pt. 1: U. S. Geol. Survey Water-Supply Paper 1299. Mundorff, M. J., 1945, Progress report on ground water in North Carolina: N. C. Dept.
Conserv. and Devel., Bull. 47, 78 p.
112 WATER RESOURCES, YADKIN-PEE DEE RIVER BASIN, NORTH CAROLINA
Mundorff, M. J., 1948, Geology and ground water in the Greensboro area, North Carolina: N. C. Dept. Conserv. and Devel., Bull. 55, 108 p.
North Carolina Division of Commerce and Industry, 1936, North Carolina: Today and to morrow: N. C. Dept. Conserv. and Devel.
North Carolina Division of Water Resources and Engineering, 1948, Hydrologic data on the Yadkin-Pee Dee River basin 1866-1945: N. C. Dept. Conserv. and Devel.
North Carolina Division of Water Resources, Inlets and Coastal Waterways, 1955, Water resources of North Carolina: N. C. Dept. Conserv. and Devel.
North Carolina State Planning Board, 1937, A planning report on water resources of North Carolina,
North Carolina State Stream Sanitation Committee, 1953, Yadkin River basin pollution survey report: N. C. State Board of Health.
North Carolina State Stream Sanitation and Conservation Committee, 1949, Study of the pollution in the Yadkin-Pee Dee River basin.
Parsons, Brinkerhoff, Hall, and MacDonald, June 1954, Report on survey of North Caro lina inland ports and waterways,prepared for N. C. Dept. of Conserv. and Devel.
Pauszek, F. H., 1950, Chemical character of surface waters of North Carolina, 1948-49: N. C. Dept. of Conserv. and Devel., Bull. 52, v. 5.
1952, Chemical character of surface waters of North Carolina, 1950-51: N. C. Dept.of Conserv. and Devel., Bull. 52, v. 7.
Ray, C. E., Jr., and Randolph, E. E., 1928, Preliminary report on the chemical quality ofsurface waters of North Carolina with relation to industrial use: N. C. Dept. of Conserv.and DeveL Econ. Paper 61.
Seville, T., and Smith, G. W., 1925, Discharge records of North Carolina streams, 1889 1923: N. C. Dept Conserv: and Devel., Bull. 34, 405 p.
Stiemke, R. E., February 1947, The extent of stream pollution in North Carolina: N. C.State Coll., Dept of Eng. Research, Bull. 34.
United States Corps of Engineers, 1933, Report for the improvement and development ofYadkin-Pee Dee River, N. C. and S. C.: U. S. Cong. Doc., 73d Cong., 1st Sess., H.Doc. No. 68.
United States Geological Survey, issued annually, Quality of surface waters of the UnitedStates, pts, 1-4, North Atlantic slope basins to St. Lawrence River basin: U. S. Geol.Survey Water-Supply Papers.
issued annually, Surface-water supply of the United States, pt. 2, South Atlantic slope and eastern Gulf of Mexico basin:U.S.Geol.Survey Water-Supply Papers.
___issued annually, Surface-water supply of the United States, pt. 2A, South Atlantic slope basins, James River to Savannah River: U. S. Geol. Survey Water-Supply Papers,
-issued annually, Water levels and artesian pressures in observation wells in theUnited States, pt. 2, Southeastern States: U. S. Geol. Survey Water-Supply Papers.
United States Public Health Service, 1946, Drinking water standards: reprint 2697, 14 p.,from Public Health Service Repts., v. 61, no. 11, p. 371-384.
United States Weather Bureau, issued annually, Daily river stages at river-gage stationson the principal rivers of the United States.
issued monthly and annually, Climatological data, North Carolina.

INDEX
A Page
Abbotts Creek, at Lexington........l6, 25, 37,42-43, 49, 55, 65
near Thomasville.........16, 25, 37, 49, 55Aberdeen, public water supply.......88, 90-91Abstract.............................................1-2Agriculture............................................4Albemarle, public water supply......88, 90-91Ararat River, at Mount Airy........14, 23, 35,
48, 53near Pilot Mountain.......14, 24, 35, 48, 54
Artesian water...................................... 74Asheboro, public water supply........89, 90-91
B
BadUn, public water supply.............89, 90-91Base period of record..............................13Bibliography................................. 111-112Big Bear Creek, near Albemarle.........17, 26.
39, 49, 56, 66 Big Swamp, near Tarheel.................18, 28,
41, 49. 57 Biscoe, public water supply...........89, 90-91Black Creek formation............................76Bladenboro, public water supply.....90-91, 94Boonville, public water supply................. 94Brown Creek, near Polkton...........17, 27,39,
42-43, 49, 56 Brunswick, public water supply.......90-91, 94
Candor, public water supply...........90-91, 94Cart ledge Creek, near Rockingham.....l7, 27,
39. 49. 56 Chadbourn, public water supply......90-91, 94Chemical analyses of water, need for........ 10Chemical quality of water, relation to
streamflow........................62, 68-71Chemical requirements of water............... 10Chemical specifications for water, for
public supply.......................... 10-11China Grove, public water supply...90-91, 94 Clarkton. public water supply.........90-91, 95Cleveland, public water supply.......90-91, 95Climate................................................4Coastal Plain, rocks..........................75-76
surface features................................3-4Coddle Creek, near Concord.......16, 26, 38,
49, 56 Color in water, objections to................... 12Concord, public water supply.........90-91, 95Cooleemee, public water supply.....90-91, 95Cretaceous clay province, chemical
analyses of water..........................78occurrence and quality of water.............84
Cretaceous sand province, chemicalanalyses of water..........................78
Page
Cretaceous sand province Continueddepth of wells....................................85occurrence of water........................84-85quality of water in..............................85yield of wells....................................85
Crystalline rock province, chemicalanalyses of water..........................78
depth of wells....................................80quality of water............................81, 83yield of wells.......................... 80-81, 82
Deep Creek, at Shacktown............... 15, 24,35. 48, 54
near Roseland...............l8, 28, 40, 49, 57Denton, public water supply.......... 90-91, 95Discharge, deficient, maximum period
of...........................42-4S, 47,48-49Dissolved solids in water...............11, 68, 69Drowning Creek, near Hbffman..........18, 28,
42-43, 49, 57. 67 near Jackson Springs......17, 28, 40, 49, 57
Duration of flow............................... 19-30Duration table of daily flow................23-28Dutch Buffalo Creek, at Mount Pleasant....17,
26, 39, 48, 56 Dutchmans Creek, near Cornatzer.......l5, 24,
36. 48, 54
Elk Creek, at Elkville......l4. 23, 34. 48, 53Elkin, public water supply.............90-91, 96Ellerbe, public water supply...........90-91, 96
Fair Bluff, public water supply........90-91, 96Fairmont, public water supply........90-91, 96Falling Creek, near Rockingham....... 17, 27,
40, 49, 57 Fisher River, near Copeland........l4, 20, 23,
31, 35, 42-43. 48. 51, 53, 63 Flood frequencies, study of......................51Flood frequency, seasonal data for............58Flood-frequency curves, seasonal..............58
use of.............................................. 49value of........................................... 51
Flood-stage frequencies..........59, 60, 61, 62Flow-duration curve...............................19Forbush Creek, near Yadkinville........15, 24,
35. 42-43, 48, 54 Four mile Branch, near Southmont.......l6, 26,
38, 49, 55 Fourth Creek, at Statesville.........l6, 25, 37,
49, 55
113

114 INDEX
G Page
Geography......................................... 2-3Geology..........................................74-76Gibson, public water supply...........90-91, 96Granite...........................................74-75Grants Creek, at Salisbury... 15, 25, 37, 49, 55 Ground water, movement of.................... 73
potential supply..........................109-110use for public supply in small towns.....9-10
Ground-water provinces......................76-85Growing season.......................................4Gum Swamp Creek, near Laurinburg....l8, 29,
41, .49, 58
H
Hamlet, public water supply..........90-91, 97Hardness of water, chemicals causing........ 11
importance of....................................llrelations of dissolved solids...................69
Hunting Creek, near Harmony...........15, 25,36, 48, 55, 64
Huntersville, public water supply....90-91, 97Hydrogen-ion concentration...................... 8Hydrologic cycle................................. 8-9
I
Industry.............................................4-5Introduction........................................2-8Iron in water, objections to..................... 11
Kannapolis, public water supply.....90-91, 97 Kernersville, public water supply....90-91, 97
Landis, public water supply...........90-91, 98Laurinburg, public water-supply at...90-91, 98 Le Grand, H. E. , quoted........................ 80Lexington, public water supply........90-91 98Lilesville, public water supply... 90-91, 98-99 Little Brown Creek, near Polkton....... 17, 27,
39, 49, 56 Little Raft Swamp, at Red Springs.....18, 28,
41, 49, 57 near Lumberton.......................18, 28, 41
Little River, near Star......17, 27, 39, 49, 56Little Yadkin River, near Donnaha......l5, 24,
35, 48, 54 Low flow frequency......................30-31, 44Lumber River, at Boardman........ 18, 22, 28,
33, 41, 42-43, 47,49, 52, 58, 62, 67, 71
near Pembroke.............18, 28, 40, 49, 57Lumberton, precipitation at...................... 5
public water supply...................90-91, 99temperature at.................................... 6
M
Manganese in water, objections to............ 11Marks Creek, near Osborne...............l7, 28,
40, 49, 57 Maxton, public water supply..........90-91, 99
Page
Middle Fork Reddies River, nearWilbar..................l4, 23, 34, 48, 53
Minerals................................................6Mitchell River, near Mountain Park......... 14,
23, 35, 48, 53 near State Road.............14, 23, 35, 48, 53
Mocksville, public water supply......90-91, 99Monroe, public water supply.... 92-93, 99-100Morven, public water supply.........92-93, 100Mountain Creek, near Ellerbe............l7, 27
39, 49, 56 Mount Airy, precipitation......................... 5
public water supply..................92-93, 100temperature........................................ 6
Mount Gilead, public water supply..92-93, 100 Mount Pleasant, public water supply.... 92-93,
100 Muddy Creek, near Clemmons...........15, 24,
36, 48, 54 Mulberry Creek,near North Wilkesboro...... 14,
23, 34, 48. 53
N
Newark group........................................75North Fork Jones Creek, near Wadesboro....l7,
28, 40, 49, 57North Wilkesboro, public water supply..92-93,
101 Norwood, public water supply........92-93, 101
Oakboro, public water supply........92-93, 101
P
Peedee format!on...................................76Pee Dee River, near Ansonville...........l7, 27
near Rockingham............... 17, 27, 66. 71Pembroke, public water supply..... 92-93, 101Piedmont region, rocks.......................74-75
surface features....................................3Pilot Mountain, public water supply.....92-93,
101 Pinebluff, public water supply.......92-93, 102Population of the area.............................. 3Porosity, factors affecting..............71, 73-74Precipitation......................................4, 5Public water supplies, source of................ 10Public water-supply systems........88-106, 107Pumping, effect on water table...........£6, 88Purpose of the report................................2
Quality of water, Cretaceous clay province..84 Cretaceous sand province......................84crystalline-rock province................ 81, 83sampling sites for........................... 14-18Triassic province............................83-84
R
Raft Swamp, near Lumberton. .....18, 28, 41, 49, 57

115 INDEX
Page Reddies River,at North Wilkesboro......l4, 23,
34, 42-43, 48, 53 Red Springs, public water supply....92-93, 102Reedy Creek, near Yadkin College.....l5, 24,
36, 48, 54 Richardson Creek, near Marshville......l7, 27,
39, 49, 56 Rich Fork, near Holly Grove......... 16, 25, 37Rivers of the area.................................2-3Roaring River, near Roaring River......14, 23,
34, 48, 53 Roberdell, public water supply......92-93, 102Rockingham, precipitation........................5
public water supply..................92-93, 102temperature........................................ 6
Rockwell, public water supply.......92-93, 102Rocky River, at Turnersburg........l5, 24, 36,
42-43, 48, 54 near Concord...........................16, 26, 38near Norwood............. 17, 22, 27, 31, 39,
42-43, 51, 61, 66, 70, 71 near Roberta Mill....................16, 26, 38
Rowland, public water supply........92-93, 103Rural Hall, public water supply.....92-93, 103
Saint Pauls, public water supply....92-93, 103Salisbury, precipitation............................ 5
public water supply..................92-93, 103temperature........................................ 6
Sampling sites for quality of water........14-18Sand Hills...........................................3-4Schipf, R. G., quoted.......................83-84Schist.............................................74-75Second Creek, near Barber................15, 24,
37, 49, 55 Shoeheel Creek, near Laurinburg.........l8, 29,
41, 49, 58 Size of the area.......................................3Slate...................................................75Slate province, occurrence and quality of
ground water................................83Soil, moisture requirements of................... 9Sources of water, in Coastal Plain.......... 9-10
in Piedmont region............................... 9South Yadkin River, at Cooleemee..... 15, 25,
37, 42-43, 48, 68 near Mocksville............l5, 24, 36, 42-43.
48, 54, 68 Specific conductance............................... 8Spencer, public water supply........92-93, 103Star, public water supply............. 92-93, 104Statesville, public water supply.....92-93, 104Stewart Creek, near Mount Airy.........14, 23,
35, 48, 53 Storage requirements......45-46, 50, 51, 52-58Storage curves, use of.............................46Streamflow, characteristics...................... 19
regulation of......................................19relation to chemical quality of water.....62,
68-71 storage requirements for....45-46, 50, 57-58
Stream-gaging sites........................... 14-18Surface water, potential supply....... 108-109
use for public supplies by cities............... 9use by industry.....................................9
Surficial deposits, undifferentiated........76-77Swearing Creek, at Linwood......l6, 25, 37, 49
T Page Tabor City, public water supply....92-93, 104Temperature......................................4, 6Terms, definitions of............................7-8Third Creek, at Cleveland..........15, 25, 37,
42-43, 49, 55, 65Thomasville, public water supply..92-93, 104 Topography........................................ 3-4Transportation........................................?Triassic province, occurrence and quality
of water.................................83-84Troutmans, public water supply.... 92-93, 104Troy, public water supply............92-93, 105Tuscaloosa formation.........................75-76
U
Uwharrie River, near Asheboro..........16, 26,38, 49, 55
near Eldorado..........................16, 26, 38,42-43, 49, 56, 65
near Trinity..........16, 26, 38, 42-43, 49, 55
Volcanic rocks......................................75
W
Waccamaw River, at Freeland......l8, 22, 29,33, 41, 42-43,47, 49, 52, 58, 62, 67, 71
Wadesboro, public water supply.... 92-93, 105Wagram, public water supply....... 92-93, 105Water, agricultural use................... 107-108
miscellaneous uses............................ 108origin of..........................................8-9potential supply..........................108-110private industrial supplies...................107public supply systems............. 88-106, 107rural domestic supplies.......................107use of.......................................106-108
Water laws................................... 110-111Water levels, fluctuations of....................86
relations of, to precipitation........... 86, 87Water year, defined................................ 8Wells, depth of............................... 80, 85
yield of................ 80-81. 82, 83, 84, 85Whiteville, public water supply..........92-93,
105Wilkesboro, public water supply....92-93, 105 Winston-Salem, public water supply....92-93,
106
Yadkin River, at High Rock.........16, 26, 65at Patterson..........................14, 23, 34,
42-43, 48, 53, 63, 68 at Wilkesboro.............14, 20. 23, 30, 34,
43-44, 45, 48, 50, 53, 59, 63, 68
at Yadkin College............15, 21, 24, 32,43-44, 48, 54, 60. 64, 68, 71, 72
near Salisbury.........................,15, 43-44Yadkinville, public water supply...92-93, 106
4U. S. GOVERNMENT PRINTING OFFICE : 1957 O -428582