water resources needed to hydraulically fracture...
TRANSCRIPT

This Master's Project
Water Resources Needed to Hydraulically Fracture California’s Monterey Shale for Oil
[Using the Bakken Shale Oil Exploration in North Dakota as a Case Study]
By
Christina J. Pepino
is submitted in partial fulfillment of the requirements
for the degree of:
Master of Science in
Environmental Management
at the
University of San Francisco
Submitted: Received:
...................................……….. ................................………….
Christina J. Pepino Date Thomas MacDonald, Ph.D. Date
Pepino2
The dissertation/thesis/Master's Project is a scholarly work presenting the results of the candidate’s research to the scholarly community. The University of San Francisco believes a candidate should make this research available to other scholars for the benefit of the author, the University, and the scholarly community. However, under the Copyright Act of 1976 (Copyright Act), an author may reserve all rights over his/her work, and thereby limit the availability of the work to others. Furthermore, under the Family Educational Rights and Privacy Act of 1974 (Privacy Act), a thesis/dissertation/Master's Project may be considered a protected, private academic record.
Author contact information:
Christina J Pepino
Phone: 928-399-9261 Email: [email protected]
Table of Contents
INTRODUCTION .........................................................................................................................4 Energy Consumption.................................................................................................................4 Process of Hydraulic Fracking ..................................................................................................4 Bakken Shale in North Dakota..................................................................................................7 Monterey Shale in California ...................................................................................................9
METHODOLOGY ......................................................................................................................10 Comparing Water Requirements to extract oil from Bakken Shale and Monterey Shale..........10
Surface Water Sources used for Bakken Shale Oil Extraction ...............................................12 Groundwater Sources used for Bakken Shale Oil Extraction .................................................15 Potential Water Sources for Monterey Shale Oil Extraction ..................................................17 California State Water Project ................................................................................................17 Central Valley Project ............................................................................................................19 Comparing Geology between Bakken Shale and Monterey Shale .........................................22
Wastewater Production for Bakken Shale ..............................................................................23 Surface Storage of Wastewater ..............................................................................................25 Underground Storage of Wastewater .....................................................................................25 Treatment Facilities.................................................................................................................26 Recycled Wastewater ..............................................................................................................26 Contamination Risks ...............................................................................................................28 Surface Water .........................................................................................................................28 Groundwater ..........................................................................................................................28
RECOMMENDATIONS.............................................................................................................29
Water Demands ......................................................................................................................30 Reducing Water Contamination Risks ...................................................................................31 Fault Zones and Induced Seismic Activity ............................................................................32 California’s Policies on Fracking............................................................................................33 Public Notice and Transparency .............................................................................................34 Future Research.......................................................................................................................35
CONCLUSIONS ..........................................................................................................................36
REFERENCES.............................................................................................................................38
Pepino4
INTRODUCTION:
Energy Consumption
United States crude oil production increased from 5 million barrels per day in 2008 to 6.5
million barrels per day in 2012, representing a 30% increase in four years (U.S. Energy
Information Administration, 2013). Increased crude oil production is a result of increased
onshore crude oil extraction, specifically from shale and other tight formations (U.S. Energy
Information Administration, 2013). The Annual Energy Outlook of 2013 projects the demand for
oil will steadily increase over the next twenty years; primarily driven by developing nations
(U.S. Energy Information Administration, 2013). The United States has the potential to be one of
the world’s top oil producers as the worldwide demand will reach close to 100 million barrels per
day by 2035 (U.S. Energy Information Administration, 2013). Projections also estimate the
United States will become 97% self-sufficient, in net energy terms, by 2035 (U.S. Energy
Information Administration, 2013).
Oil companies are using advanced technology to extract oil from areas previously
untouched due to depth difficulties and/or geological constraints. One of the processes used to
access oil is a technique called hydraulic fracturing. Hydraulic fracturing, also known as
fracking, is an advanced means of extracting both oil and gas from subterranean shale rock
formations. Hydraulic fracturing is considered a type of advanced unconventional extraction,
requiring external pressure to extract resources. Unconventional resources include: extra heavy
oil (oil with high viscosity), oil sand, oil shale, tight gas, coal bed methane, shale gas, and natural
gas hydrates (Energy Technology Network, 2013).
Process of Hydraulic Fracturing
After a geologic formation is selected based on potentially recoverable resource
extraction, well construction begins. Existing wells may be fracked and re-fracked; therefore, all
fracking operations do not necessarily require a new well. Wells used for hydraulic fracturing
can be horizontal, vertical, or both. Vertical wells may extend to depths greater than 8,000 feet,

and horizontal sections of a well may extend several thousand feet away from the production pad
on the surface (Hydraulic Fracturing Research Study, EPA 2010).
The next steps of hydraulic fracturing are the identification, selection, and acquisition of
a water source. After water has been acquired and transported to the well site, the water is used
to create fracking fluid. Fracking fluid is a mixture of water, chemical additives, and propping
agents. Propping agents may be sand, silica, and/or ceramic beads. The fracking fluid is then
pumped into the wellbore, under high pressure. The wellbore is lined with a hollow metal casing
to isolate the injected fluid from the non-productive segments of the surrounding geologic
formations. When the external pressure exceeds the rock strength, fractures within the rock are
created. High pressures are used to increase the permeability of the formation and enhance the
flow of oil (Bakken water assessment, Phase 2, 2011). As the geologic formation is fractured and
the pumping pressure decreases, the propping agents in the injected fluid keep the fractures from
closing (Department of Energy, 2004). The fractures remain open; allowing previously trapped
crude oil to flow into the wellbore. Some fracture fluid, mixed with oil, returns to the surface
through the wellbore. The mixture of fracking fluid combined with the extracted resources is
commonly referred to as flowback water or wastewater (The Hydraulic Fracturing Water Cycle,
EPA 2013). Wastewater can be treated in a proper facility, left in surface storage ponds or tanks,
injected back into a retired well, or recycled for another fracture job. The process of hydraulic
fracturing includes water acquisition, chemical mixing, well injection, the production of
wastewater, and the treatment/disposal of wastewater (Figure 1).

Pepino6
Figure 1: The Process of Hydraulic Fracturing (The Hydraulic Fracturing Water Cycle,
EPA 2013).
Hydraulic fracturing is used in over 30 states, and is identified as a technique to promote
energy independence and energy security (Groundwater Protection Council & Interstate Oil and
Gas Compact Commission, 2009). The International Energy Administration reported that the
United States would benefit from technologies such as hydraulic fracturing for the extraction of
unconventional sources of energy (U.S. Energy Information Administration, 2013). Recently
identified potentially recoverable oil sources could make the United States the world's biggest oil
producer by 2017 (U.S. Energy Information Administration, 2013). Two of the largest
potentially recoverable oil basins are in the Monterey Shale deposits in California, and Bakken
Shale deposits in North Dakota. Table 1 depicts the major shale deposits in the US,
corresponding with estimates of technically recoverable oil (in billions of barrels). Oil
production is at an all-time high in North Dakota because of hydraulic fracturing, and now
California is assessing the economic benefits of fracking Monterey Shale for oil.
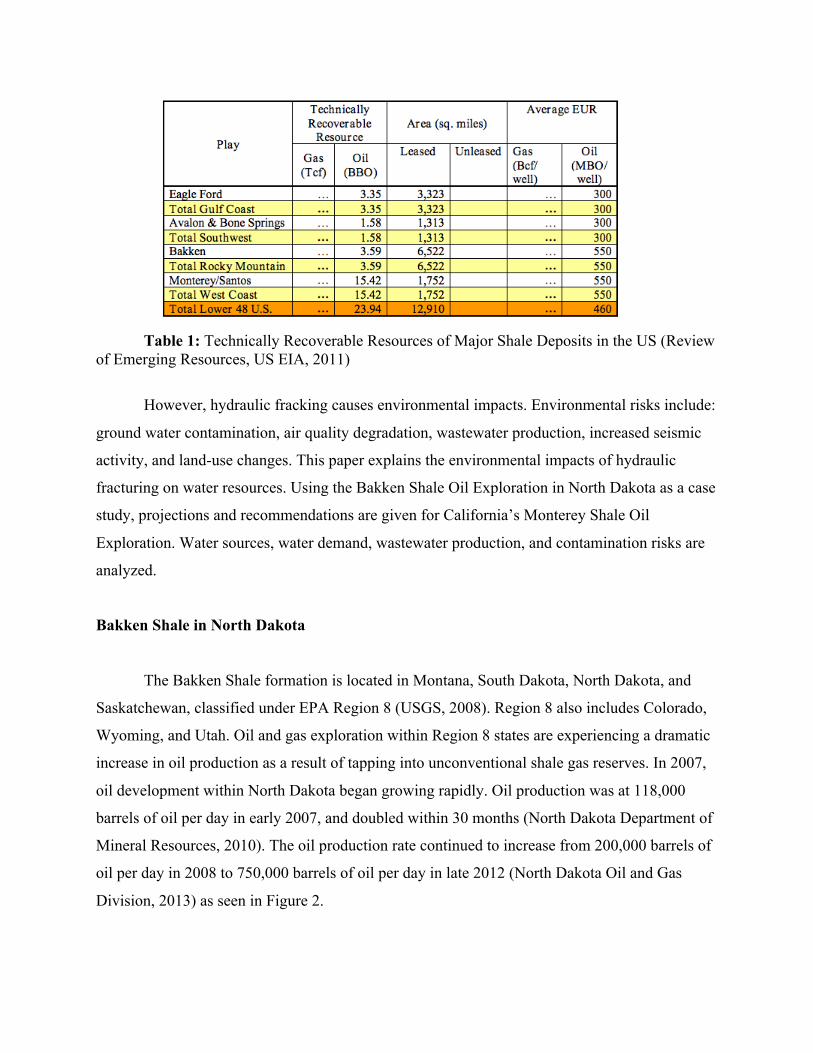
Table 1: Technically Recoverable Resources of Major Shale Deposits in the US (Review
of Emerging Resources, US EIA, 2011)
However, hydraulic fracking causes environmental impacts. Environmental risks include:
ground water contamination, air quality degradation, wastewater production, increased seismic
activity, and land-use changes. This paper explains the environmental impacts of hydraulic
fracturing on water resources. Using the Bakken Shale Oil Exploration in North Dakota as a case
study, projections and recommendations are given for California’s Monterey Shale Oil
Exploration. Water sources, water demand, wastewater production, and contamination risks are
analyzed.
Bakken Shale in North Dakota
The Bakken Shale formation is located in Montana, South Dakota, North Dakota, and
Saskatchewan, classified under EPA Region 8 (USGS, 2008). Region 8 also includes Colorado,
Wyoming, and Utah. Oil and gas exploration within Region 8 states are experiencing a dramatic
increase in oil production as a result of tapping into unconventional shale gas reserves. In 2007,
oil development within North Dakota began growing rapidly. Oil production was at 118,000
barrels of oil per day in early 2007, and doubled within 30 months (North Dakota Department of
Mineral Resources, 2010). The oil production rate continued to increase from 200,000 barrels of
oil per day in 2008 to 750,000 barrels of oil per day in late 2012 (North Dakota Oil and Gas
Division, 2013) as seen in Figure 2.

Pepino8
According to the US Crude Oil and Natural Gas Proved Reserves of 2011, the Bakken
shale oil formation is the second largest shale oil play, estimated to hold approximately 3.6
billion barrels of potentially recoverable oil (U.S. Department of Energy, 2013).
For Bakken Shale extraction, it is estimated that 2,500 new oil wells will be drilled per
year, for the next 15-25 years (Water Appropriations Division: North Dakota State Water
Commission, 2011). North Dakota is seen as an economic icon as a result of increased oil and
gas exploration activities, leading to low unemployment rates and high Gross Domestic
Product/capita.
Figure 2: Monthly oil production in North Dakota in thousands of barrels/day (EIA, 2013).
As a result of hydraulic fracturing, North Dakota’s gross domestic product grew by 6.7%
per year from 2008 to 2012, setting a record during that period as the nation’s fastest growth rate
(USC Price School of Public Policy, 2013). In addition, North Dakota is maintaining the nation’s
lowest unemployment rate at 3.2% as a result of oil and gas exploration activities (USC Price
School of Public Policy, 2013). Figure 3 compares the GDP per capita of North Dakota versus
the US, emphasizing the potential economic benefit of oil and gas exploration. Economic growth
is a primary incentive for exploring the possibility of oil extraction in California, using hydraulic
fracturing.

Figure 3: GDP growth per capita for North Dakota, compared to the U.S. average (EIA, 2013).
Monterey Shale in California
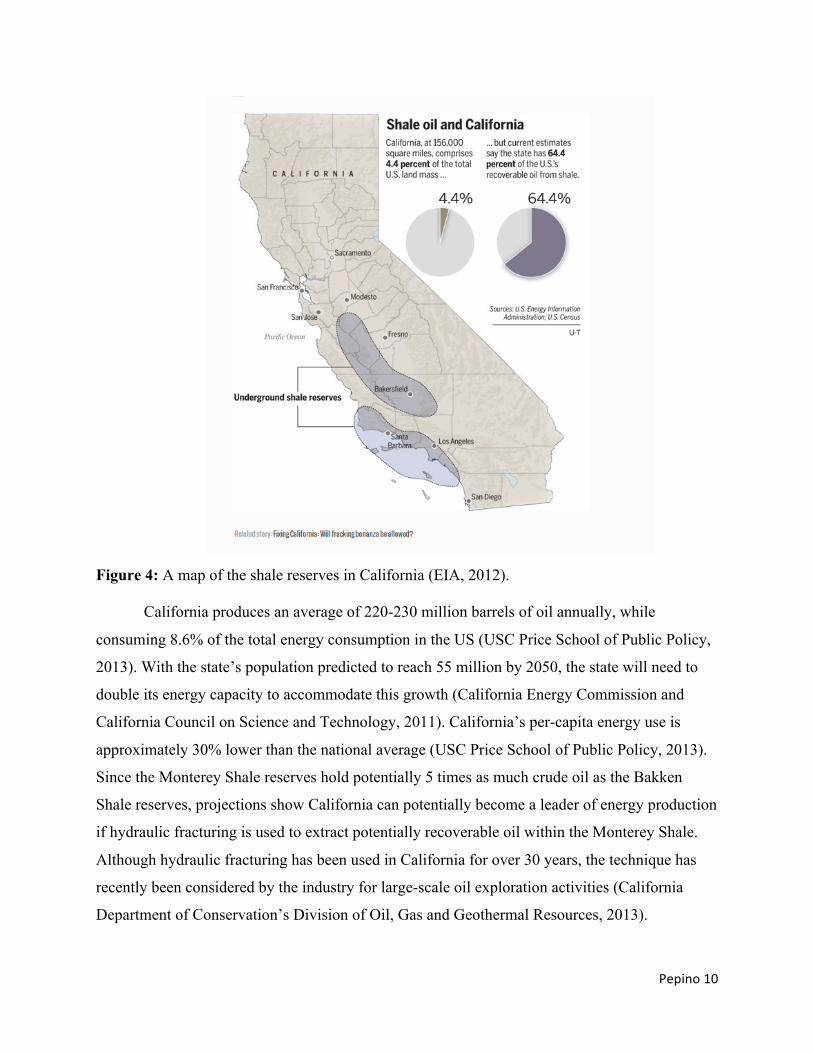
The Monterey shale in California covers an area of approximately 1,750 square miles
(U.S. Energy Information Administration, 2011). Figure 4 depicts the underground shale
reserves that stretch along Central California, including both the San Joaquin and Los Angeles
Basins (U.S. Energy Information Administration, 2011). Shale is fine-grained sedimentary rock
formed by the accumulation of sediments including sandstone and limestone. Shale deposits
have recently been identified as rich sources of oil and gas. The Monterey shale – encompassing
both the San Joaquin and Los Angeles Basins –is estimated to hold up to two-thirds of all the
United States recoverable oil from shale, with approximately 15 billion barrels of recoverable
crude oil (U.S. Energy Information Administration, 2011). Decades ago, Monterey Shale oil was
thought to be non-extractable due to depth constraints. Hydraulic fracturing now makes the
potentially recoverable oil within Monterey Shale more accessible, showing great economic
potential.
Pepino10
Figure 4: A map of the shale reserves in California (EIA, 2012).
California produces an average of 220-230 million barrels of oil annually, while
consuming 8.6% of the total energy consumption in the US (USC Price School of Public Policy,
2013). With the state’s population predicted to reach 55 million by 2050, the state will need to
double its energy capacity to accommodate this growth (California Energy Commission and
California Council on Science and Technology, 2011). California’s per-capita energy use is
approximately 30% lower than the national average (USC Price School of Public Policy, 2013).
Since the Monterey Shale reserves hold potentially 5 times as much crude oil as the Bakken
Shale reserves, projections show California can potentially become a leader of energy production
if hydraulic fracturing is used to extract potentially recoverable oil within the Monterey Shale.
Although hydraulic fracturing has been used in California for over 30 years, the technique has
recently been considered by the industry for large-scale oil exploration activities (California
Department of Conservation’s Division of Oil, Gas and Geothermal Resources, 2013).
METHODOLOGY:
Comparing Water Requirements to extract oil from Bakken Shale and Monterey Shale
Water is necessary for unconventional oil extraction. Unconventional oil extraction has
greater potential for adverse environmental impacts than conventional extraction (U.S.
Environmental Protection Agency, 2008). Water availability is critical for the feasibility,
production, and economic potential of unconventional oil extraction. The EPA’s 2011 Draft Plan
to Study the Potential Impacts of Hydraulic Fracturing on Drinking Water estimates that
hydraulic fracturing processes use 70 billion to 140 billion gallons of water each year for all
operations in the United States, representing large quantities of water that may be diverted from
other uses, such as agriculture and municipalities.
The Bakken Shale is used as a case study to assess water demands and water quality
impacts due to hydraulic fracking. The research provides projections and recommendations for
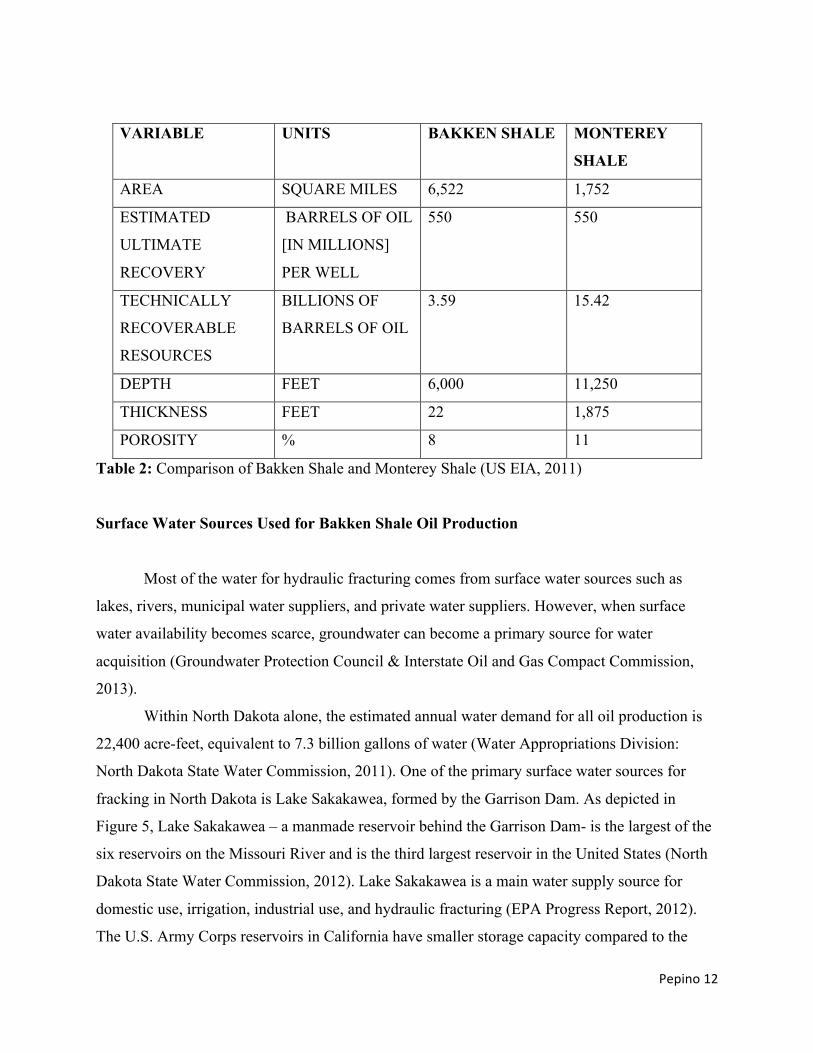
Monterey Shale, if the formation is eventually hydraulically fractured. Table 2 compares
important variables used to conduct this analysis, including total area, estimated ultimate
recovery, depth of deposits, thickness and porosity; characteristics used to help estimate the
amount of water needed to hydraulically frack shale for oil. Table 2 will be used as a tool for
comparing Bakken Shale to Monterey Shale throughout this paper.
Pepino12
VARIABLE UNITS BAKKEN SHALE MONTEREY
SHALE
AREA SQUARE MILES 6,522 1,752
ESTIMATED
ULTIMATE
RECOVERY
BARRELS OF OIL
[IN MILLIONS]
PER WELL
550 550
TECHNICALLY
RECOVERABLE
RESOURCES
BILLIONS OF
BARRELS OF OIL
3.59 15.42
DEPTH FEET 6,000 11,250
THICKNESS FEET 22 1,875
POROSITY % 8 11
Table 2: Comparison of Bakken Shale and Monterey Shale (US EIA, 2011)
Surface Water Sources Used for Bakken Shale Oil Production
Most of the water for hydraulic fracturing comes from surface water sources such as
lakes, rivers, municipal water suppliers, and private water suppliers. However, when surface
water availability becomes scarce, groundwater can become a primary source for water
acquisition (Groundwater Protection Council & Interstate Oil and Gas Compact Commission,
2013).
Within North Dakota alone, the estimated annual water demand for all oil production is
22,400 acre-feet, equivalent to 7.3 billion gallons of water (Water Appropriations Division:
North Dakota State Water Commission, 2011). One of the primary surface water sources for
fracking in North Dakota is Lake Sakakawea, formed by the Garrison Dam. As depicted in
Figure 5, Lake Sakakawea – a manmade reservoir behind the Garrison Dam- is the largest of the
six reservoirs on the Missouri River and is the third largest reservoir in the United States (North
Dakota State Water Commission, 2012). Lake Sakakawea is a main water supply source for
domestic use, irrigation, industrial use, and hydraulic fracturing (EPA Progress Report, 2012).
The U.S. Army Corps reservoirs in California have smaller storage capacity compared to the

reservoirs in North Dakota. As seen in Figure 5, the Garrison Dam has the highest relative
volume (in acre feet) out of any corps reservoir in the United States (2008).
Even with large water volumes in North Dakota stored behind the Garrison Dam (>10M
acre-feet), getting access to fresh water sources within the state can still be a challenge for the oil
and gas industry. Despite water resources being relatively abundant in North Dakota, water
quality and water availability is still a problem – with difficulty stemming from state and federal
agencies, as well as allocation rights and distribution to other water needs.
Figure 5: Storage Capacity of Reservoirs built by the U.S. Army Corps of Engineers, showing the acre-feet of water stored by the Garrison Dam along the Missouri River (U.S. Army Corps of Engineers, 2008).
As a state, North Dakota is attempting to manage their own water resources; however,
The Army Corps of Engineers is trying to gain rights to sell the water. Because the Missouri
River flows through the boundaries of federally managed reservoirs, such as Lake Sakakawea,
the Army Corps of Engineers is trying to mandate that the oil industry must pay storage fees to
obtain water from the reservoirs. Water rights are spurring a large debate between the federal
government and the state government, deciding which governing agency has authority over

Pepino14
surface waters within North Dakota. Since the oil companies must get permits from both the
State Water Commission and the Army Corps of Engineers, concerns voiced by the industry
include: unnecessary delays, time consuming procedures, and additional costs related to
obtaining permissions of water rights. As a result of time-consuming surface water procedures,
groundwater sources are now being tapped to meet the water demands from the oil industry.
In 2012, the US Army Corps of Engineers approved free temporary permits for the oil
and gas industry. The permits allowed the oil industry to take water from Lake Sakakawea and
pipe the water to Bakken oil drilling sites (North Dakota State Water Commission, 2012). The
permits were granted to reduce the drain on underground aquifers in the Williston Basin (North
Dakota State Water Commission, 2012). Currently the Army Corps of Engineers are working on
a multiyear study to assess the potential impacts of increased water demands on Lake
Sakakawea. The study will assess impacts on existing cultural sites and endangered species
dependent on the surrounding ecosystem (North Dakota Industrial Commission, 2011).
Until the study is complete, access is granted to the oil industry to take up to 100,000
acre-feet of water, equivalent to approximately 32 billion gallons, from Lake Sakakawea for five
years, ending in 2015 (North Dakota Industrial Commission, 2011). While the battle continues
between state and federal agencies, the potential fees and access issues associated with surface
water lead to significant water resource challenges. As water demands increase from energy
production, agriculture, manufacturing, and growing populations [a growth correlated to energy
extraction within the area], the dependence on groundwater resources continues to increase.
In addition to slow permit processes and fees associated with surface water, the
geographic location of Lake Sakakawea can be far away from drilling operations, depending on
well-site location. High water transportation costs and expensive water acquisition fees from the
government are spurring a discussion of both groundwater use and wastewater recycling as
potential water sources. The North Dakota State Water Commission reported a large variability
for the cost of fresh water per barrel. The cost to purchase water ranged from $5.95/1000 gallons
to $25/1000 gallons (North Dakota Industrial Commission, 2011). Geographic proximity of the
water source to the drilling site is the largest variable; therefore, transportation costs are the main
factor of acquisition charges. Although North Dakota is not usually considered a state to have
water scarcity problems, hydraulic fracturing has shown that water rights and water accessibility

both play a role in meeting the increasing water demand associated with unconventional oil
extraction.
Ground Water Resources used for Bakken Shale Oil Production
Water demands continue to increase within North Dakota (Water Appropriations
Division: North Dakota State Water Commission, 2011). The demand for water is met by both
surface water and ground water. Although common freshwater acquisitions for fracking are from
water depots, municipalities, and surface water sources, permit applications for new water wells
are feasible, as a result of the increased water demand. Although the North Dakota State Water
Commission was reluctant to distribute new permits for groundwater wells, permits are still
available for the oil industry (North Dakota Industrial Commission, 2011). The North Dakota
State Water Commission’s concerns originated from potential depletion of water resources – as
seen through declining rates from bedrock aquifers within the region (North Dakota Industrial
Commission, 2011).
Two aquifers in North Dakota used by the oil and gas industry are the Fox Hills Aquifer
and the Kildeer Aquifer. Fox Hills Aquifer is a bedrock aquifer, and Kildeer Aquifer is part of
the Glacial Aquifer System (Water Appropriations Division: North Dakota State Water
Commission, 2011). The Glacial Aquifer System includes all unconsolidated aquifers north of
the line of continental glaciations throughout the country – the largest aquifer system used for
drinking water in the United States; encompassing 25 states. Region 8 is classified by sand and
gravel aquifers of alluvial and glacial origin, as compared to California’s aquifers that are
classified as unconsolidated sand and gravel aquifers at or near the land surface (USGS, 2013).
North Dakota’s glacial-deposit aquifers are considered highly productive aquifers. The
groundwater flow is recharged from primarily local streams. Although hydraulic conductivity of
all aquifers varies, unconsolidated sand and gravel aquifers have high hydraulic conductivity and
are more susceptible to contamination (USGS, 2013). Groundwater recharge within North
Dakota has been declining, further emphasizing the correlation between surface water depletion
and groundwater recharge rates.

Pepino16
Figure 6: Extent of the Fox Hills Formation in North Dakota (North Dakota State Water Commission, Honeyman 2007).
The Fox Hills Aquifer lies under more than half of the state of North Dakota, only
exposed at the surface in the southern part of the state (Figure 6). The Fox Hills Aquifer runs as
deep as 2,000 feet beneath the surface, but average depth is between 500 and 700 feet beneath
the surface based upon screened intervals of 356 monitored wells (North Dakota State Water
Commission, Honeyman 2007). Since monitoring reports began in the 1980’s, the groundwater
head has been declining at rates between -0.1 ft/year to -2.6 ft/year depending on well location
(Water Appropriations Division: North Dakota State Water Commission, 2011). Head declines
were shown in every monitored well in 2007, and as water demands increase, the trend in head
decline of the Fox Hills Aquifer will continue (North Dakota State Water Commission,
Honeyman 2007). The Fox Hills Aquifer, identified as a valuable resource for not only the oil
and gas industry, but also the agricultural industry, has been impacted by oil activity (North
Dakota State Water Commission, Honeyman 2007).
It is important to note that a decline in groundwater head levels can be attributed to
declines in surface water levels within Lake Sakakawea. When lake levels rise, nearby head
measurements also rise. The groundwater fluctuations observed in wells tapping the Fox Hills
Aquifer have a direct correlation to water levels in Lake Sakakawea (Figure 7). The graph shows
the connection between groundwater and surface water sources. If surface water levels decline in

Lake Sakakawea as a result of increasing water use by the oil industry, the Fox Hills Aquifer will
also be depleted.
Figure 7: Historical water-level elevation of Lake Sakakawea (blue) correlated to
historic water-level fluctuations in observed well (red) (North Dakota State Water Commission, Honeyman 2007).
Potential Water Sources for Monterey Shale Oil Extraction
California State Water Project
The California State Water Project provides water to 25 million residents, in addition to
almost one million acres of farmland (CA Department of Water Resources, 2013). This project
integrates water storage with water delivery, allocating fresh water to Northern California, the
San Francisco Bay Area, the San Joaquin Valley, the Central Coast, and Southern California (CA
Department of Water Resources, 2013). This water project is the largest in California, making
Pepino18
deliveries to approximately two-thirds of California’s population. Water resources required to
hydraulically fracture Monterey Shale may potentially be requested from the California State
Water Project, adding an additional demand on the already-coveted supply allocated to
municipal suppliers and the agricultural industry. California’s Department of Water Resources
admits that even during years of normal precipitation, water supply shortages occur because of
many competing demands from farmers, cities, and the environment, such as wildlife refuges and
species sustained from seasonal water flows.
California’s economy relies on agriculture as a primary source of revenue, and California
is known as the state leading production for 75 commodities (California Department of Water
Resources, 2010). California’s climate and geography is able to host a multi-billion dollar
industry and produces over 250 crops. The agriculture industry relies on the ability to access
billions of gallons of fresh water each year for irrigation needs. Depending on the crop produced,
as well as efficiency procedures, it is estimated that agriculture consumes 33.22 million-acre feet
per year, or approximately 10,824,784,500,000 gallons (California Department of Water
Resources, 2010). Of the estimated 33.22 million acre-feet of water used for irrigation, this
portion of water represents 80% of all water diverted from surface water or pumped from ground
water within California (California Department of Water Resources, 2013). The total amount of
water diverted within the state is 43 million acre-feet of water per year (California Department of
Water Resources, 2013).
Since California’s climate dramatically varies based on geographic location, ranging
from snow-packed Sierra’s to the desert of Palm Springs, water distribution and water allocation
rights are complex. Water allocation rights have been uncertain and inconsistent, putting a large
strain on water supplies. The demand for water allocated through the California State Water
Project is currently unattainable. By tapping into groundwater sources, the demand can be met.
Approximately 2 million acre-feet, or 651,702,857,000 gallons of groundwater overdraft is
occurring to meet state water needs (Agricultural Water Use in California, 2011). With the state
Water Conservation Act of 2009, followed by conservation water plans for 2020, California has
been identified as a state with water scarcity and water resource issues.
Central Valley Project
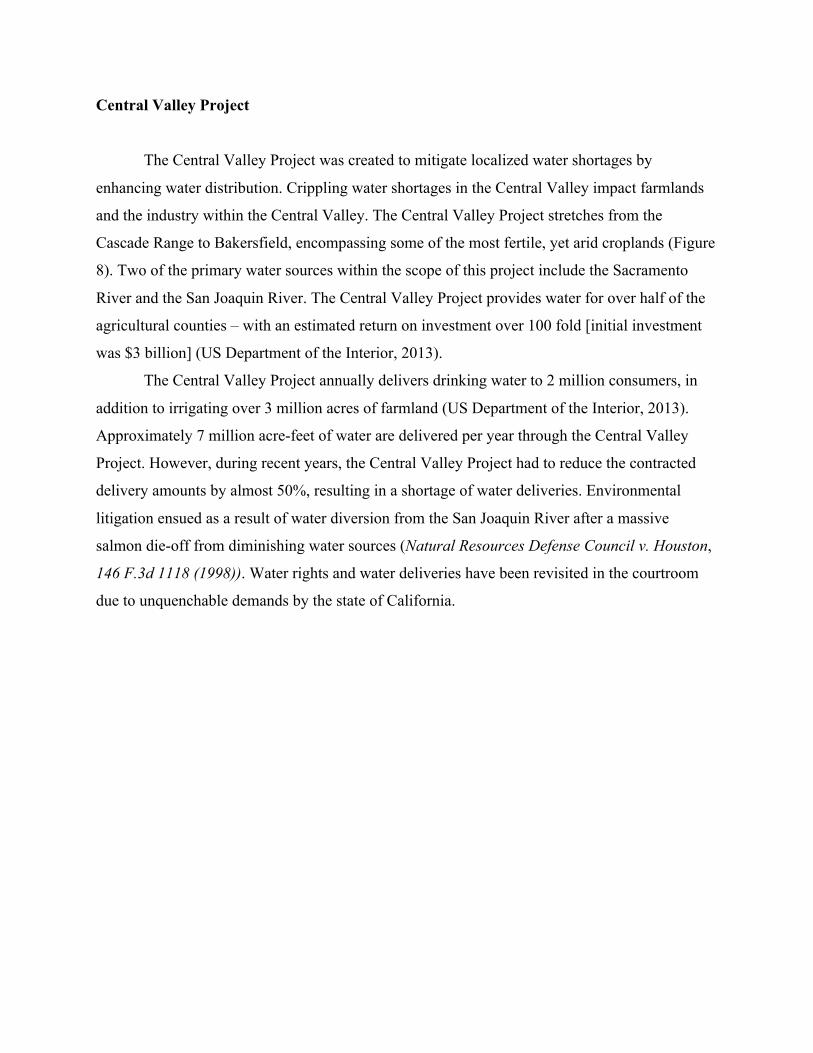
The Central Valley Project was created to mitigate localized water shortages by
enhancing water distribution. Crippling water shortages in the Central Valley impact farmlands
and the industry within the Central Valley. The Central Valley Project stretches from the
Cascade Range to Bakersfield, encompassing some of the most fertile, yet arid croplands (Figure
8). Two of the primary water sources within the scope of this project include the Sacramento
River and the San Joaquin River. The Central Valley Project provides water for over half of the
agricultural counties – with an estimated return on investment over 100 fold [initial investment
was $3 billion] (US Department of the Interior, 2013).
The Central Valley Project annually delivers drinking water to 2 million consumers, in
addition to irrigating over 3 million acres of farmland (US Department of the Interior, 2013).
Approximately 7 million acre-feet of water are delivered per year through the Central Valley
Project. However, during recent years, the Central Valley Project had to reduce the contracted
delivery amounts by almost 50%, resulting in a shortage of water deliveries. Environmental
litigation ensued as a result of water diversion from the San Joaquin River after a massive
salmon die-off from diminishing water sources (Natural Resources Defense Council v. Houston,
146 F.3d 1118 (1998)). Water rights and water deliveries have been revisited in the courtroom
due to unquenchable demands by the state of California.

Pepino20
Figure 8: Map of the Central Valley Project in California. Beige regions show the
Central Valley Project service areas. The Central Valley Project has already contracted its water services to agencies for
projected water needs 50 years into the future. California must divert, transport, and deliver
water to central valley farmlands for irrigation purposes, since the arid climate does not have
sustainable watersheds for water demands within that region. Billions of dollars are allocated for
water relocation and water distribution in California. If hydraulic fracturing becomes a large-
scale technique used to extract oil from Monterey Shale, water availability within peripheral
states will become even more competitive. Since the Monterey Shale lies under current and
prospective farmlands, hydraulic fracturing will add competition to the water market.
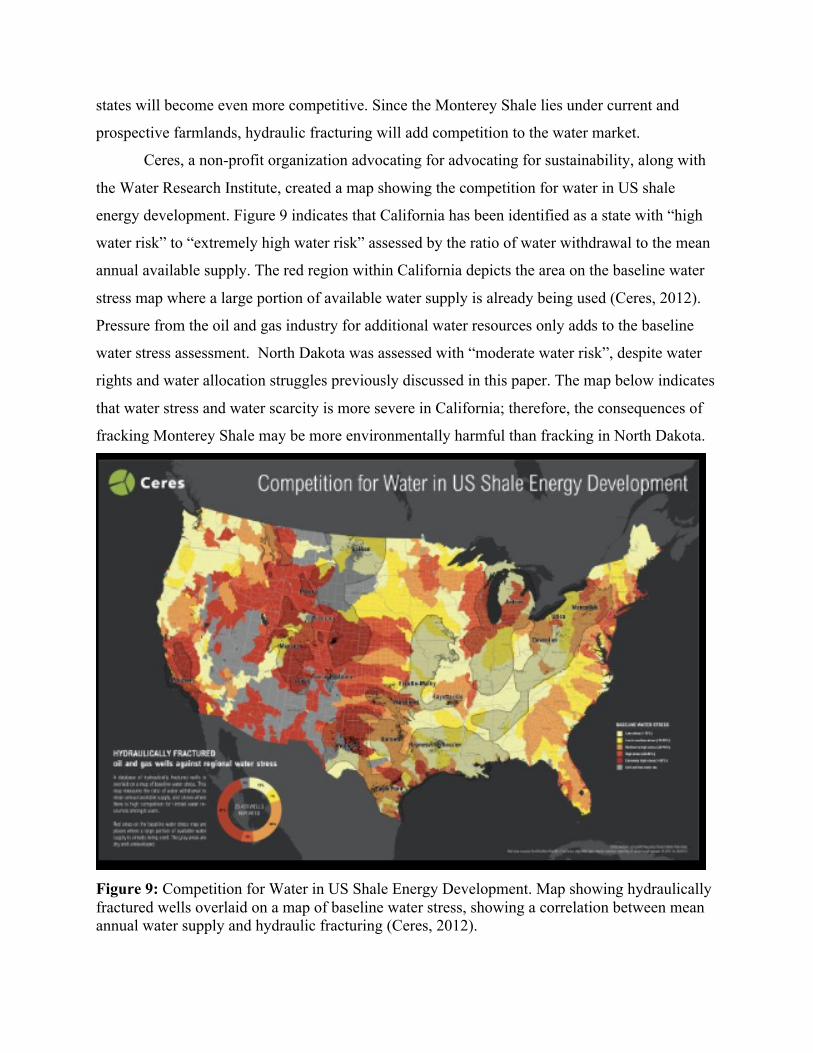
Ceres, a non-profit organization advocating for advocating for sustainability, along with
the Water Research Institute, created a map showing the competition for water in US shale
energy development. Figure 9 indicates that California has been identified as a state with “high
water risk” to “extremely high water risk” assessed by the ratio of water withdrawal to the mean
annual available supply. The red region within California depicts the area on the baseline water
stress map where a large portion of available water supply is already being used (Ceres, 2012).
Pressure from the oil and gas industry for additional water resources only adds to the baseline
water stress assessment. North Dakota was assessed with “moderate water risk”, despite water
rights and water allocation struggles previously discussed in this paper. The map below indicates
that water stress and water scarcity is more severe in California; therefore, the consequences of
fracking Monterey Shale may be more environmentally harmful than fracking in North Dakota.
Figure 9: Competition for Water in US Shale Energy Development. Map showing hydraulically fractured wells overlaid on a map of baseline water stress, showing a correlation between mean annual water supply and hydraulic fracturing (Ceres, 2012).
Pepino22
Comparing Bakken Shale Geology and Monterey Shale Geology
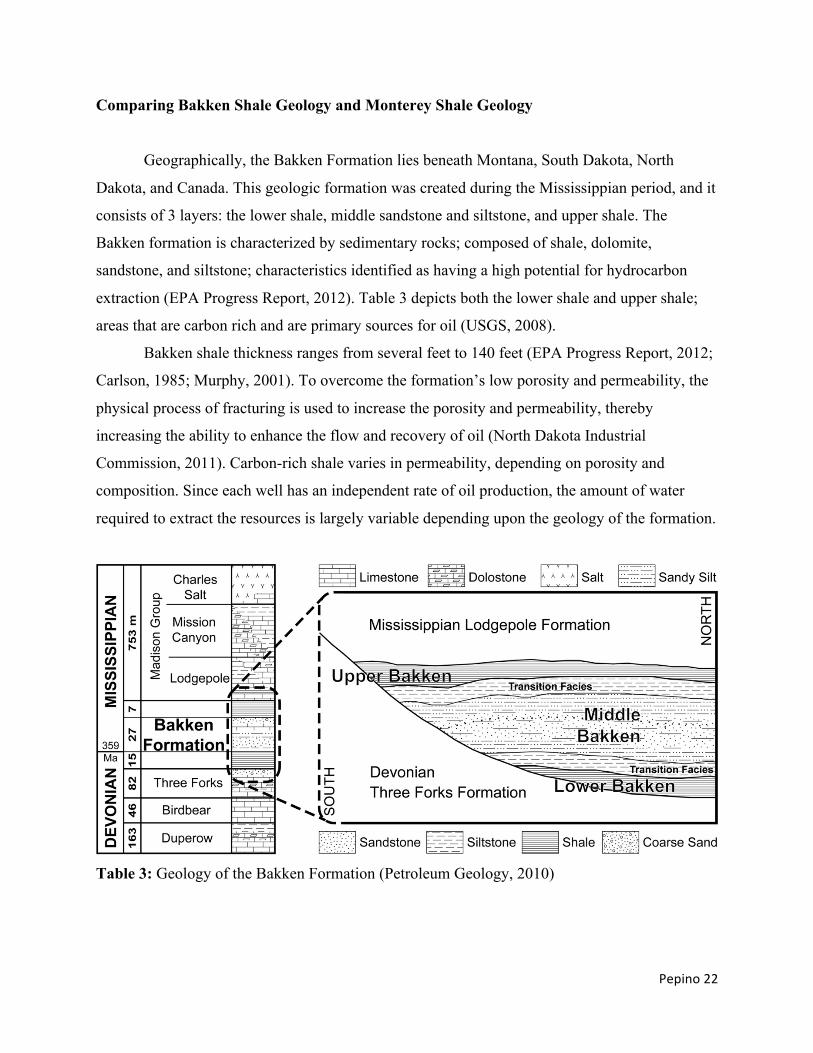
Geographically, the Bakken Formation lies beneath Montana, South Dakota, North
Dakota, and Canada. This geologic formation was created during the Mississippian period, and it
consists of 3 layers: the lower shale, middle sandstone and siltstone, and upper shale. The
Bakken formation is characterized by sedimentary rocks; composed of shale, dolomite,
sandstone, and siltstone; characteristics identified as having a high potential for hydrocarbon
extraction (EPA Progress Report, 2012). Table 3 depicts both the lower shale and upper shale;
areas that are carbon rich and are primary sources for oil (USGS, 2008).
Bakken shale thickness ranges from several feet to 140 feet (EPA Progress Report, 2012;
Carlson, 1985; Murphy, 2001). To overcome the formation’s low porosity and permeability, the
physical process of fracturing is used to increase the porosity and permeability, thereby
increasing the ability to enhance the flow and recovery of oil (North Dakota Industrial
Commission, 2011). Carbon-rich shale varies in permeability, depending on porosity and
composition. Since each well has an independent rate of oil production, the amount of water
required to extract the resources is largely variable depending upon the geology of the formation.
Table 3: Geology of the Bakken Formation (Petroleum Geology, 2010)
The Monterey Shale Formation in California also has a high potential for hydrocarbon
extraction as a result of geologic formations. Though the formations are more complex than the
Bakken formation, with depths up to 11,250 feet deep, and thickness up to 1,875 feet, the
Monterey Shale can still produce technically recoverable oil as a result of hydraulic fracturing
(US EIA, 2011). Due to seismic activity in California, oil can migrate more easily than compared
to other shale formations around the country. Since the geologic formation varies so
significantly, water use would vary from well to well, depending on production. Table 2
compares Monterey shale with an average porosity of 11%, and Bakken Shale has an average
porosity of 8% (US EIA, 2011). The amount of recovered water would be less for Monterey
Shale oil extraction as a result of higher porosity, causing the formation to absorb and retain
fracking fluid.
Wastewater Production for Bakken Shale
Wastewater, or produced water from oil extraction, is the largest waste stream associated
with hydraulic fracturing. Depending on the well, 30-70% of the injected fluids return to the
surface through the drilled well (Groundwater Protection Council & Interstate Oil and Gas
Compact Commission, 2009). The large variance of wastewater production returning to the
surface is dependent on the amount of fluids trapped within the fractured formation.
The ingredients in wastewater include: water, propping agents, biocides, friction-reducing
agents, polymers, scale inhibitors, and weak acids, as well as heavy metals and minerals from the
fracture job (North Dakota Industrial Commission, 2011). Examples of the additive, with their
corresponding purpose, are explained in Table 2. In addition to the chemical additives mixed
with water at the surface, naturally occurring substances also mix with the fluid during injection.
Produced water includes naturally occurring substances such as: formation fluid [brine], gases
[methane, ethane, hydrogen sulfide, and helium], trace elements [mercury, lead, arsenic],
naturally occurring radioactive material [radium, thorium, uranium], and organic material
[organic acids] (EPA Draft Plan, 2011).
Pepino24
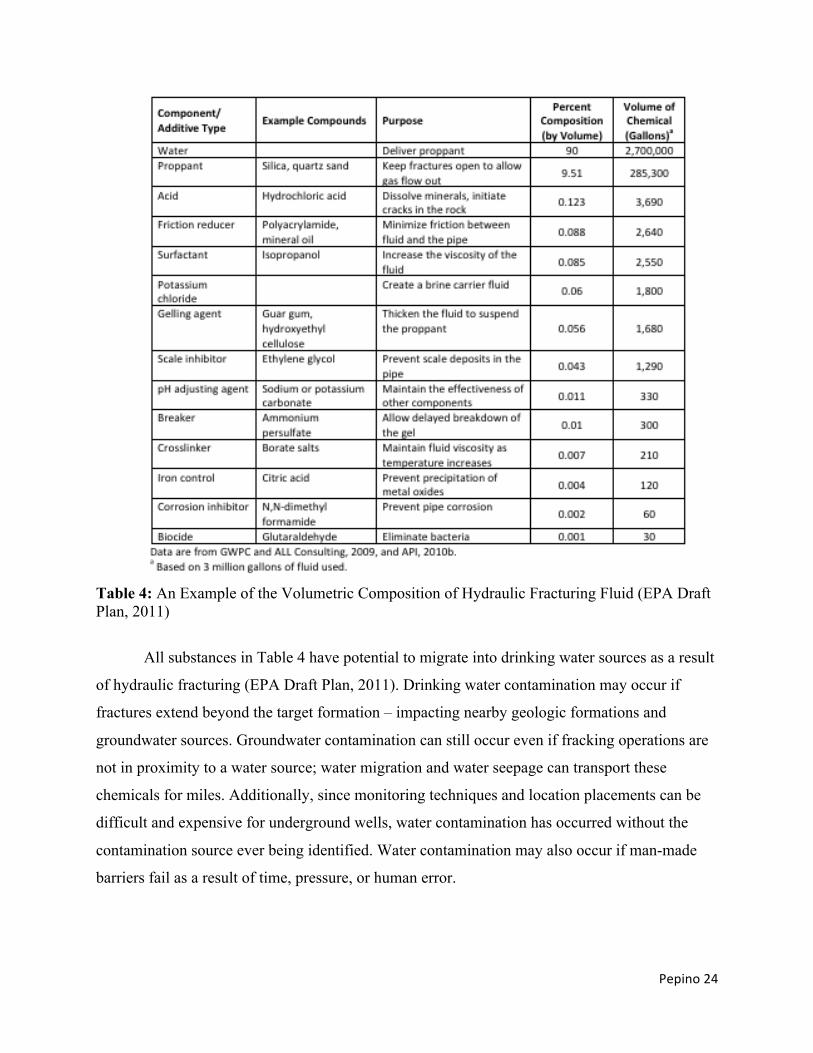
Table 4: An Example of the Volumetric Composition of Hydraulic Fracturing Fluid (EPA Draft Plan, 2011)
All substances in Table 4 have potential to migrate into drinking water sources as a result
of hydraulic fracturing (EPA Draft Plan, 2011). Drinking water contamination may occur if
fractures extend beyond the target formation – impacting nearby geologic formations and
groundwater sources. Groundwater contamination can still occur even if fracking operations are
not in proximity to a water source; water migration and water seepage can transport these
chemicals for miles. Additionally, since monitoring techniques and location placements can be
difficult and expensive for underground wells, water contamination has occurred without the
contamination source ever being identified. Water contamination may also occur if man-made
barriers fail as a result of time, pressure, or human error.

Surface Storage of Wastewater
Depending on local and state regulations, wastewater disposal procedures vary. In North Dakota,
surface ponds are used to store wastewater produced from fracking.
Surface ponds are primarily used to assist in evaporation, but can be
used as an initial storage area until treatment or disposal. The federal
government will soon be drafting regulations and monitoring
requirements for surface ponds. The EPA is currently evaluating oil
and gas wastewater practices and will likely enforce laws pertaining to
the operation, maintenance, monitoring, and closure of surface ponds,
in accordance to the Resource Conservation and Recovery Act
(RCRA). Regulations for the oil and gas industry have not been able to
keep pace with the number of wells being drilled and leases being sold;
therefore, the legal framework to mandate best practices is still being
created.
Underground Storage of Wastewater
An economically favorable way to store and/or dispose of
wastewater is the use of injection wells. An injection well is a
wastewater disposal technique able to confine produced wastewater.
The injected wastewater is placed underground into porous rock
formations. The EPA defines an injection well under the Underground
Injection Control (UIC) Program as: a bored, drilled, or driven shaft, an
improved sinkhole, or a subsurface fluid distribution system (EPA,
2012). Injected fluids used or produced during oil and gas activities are
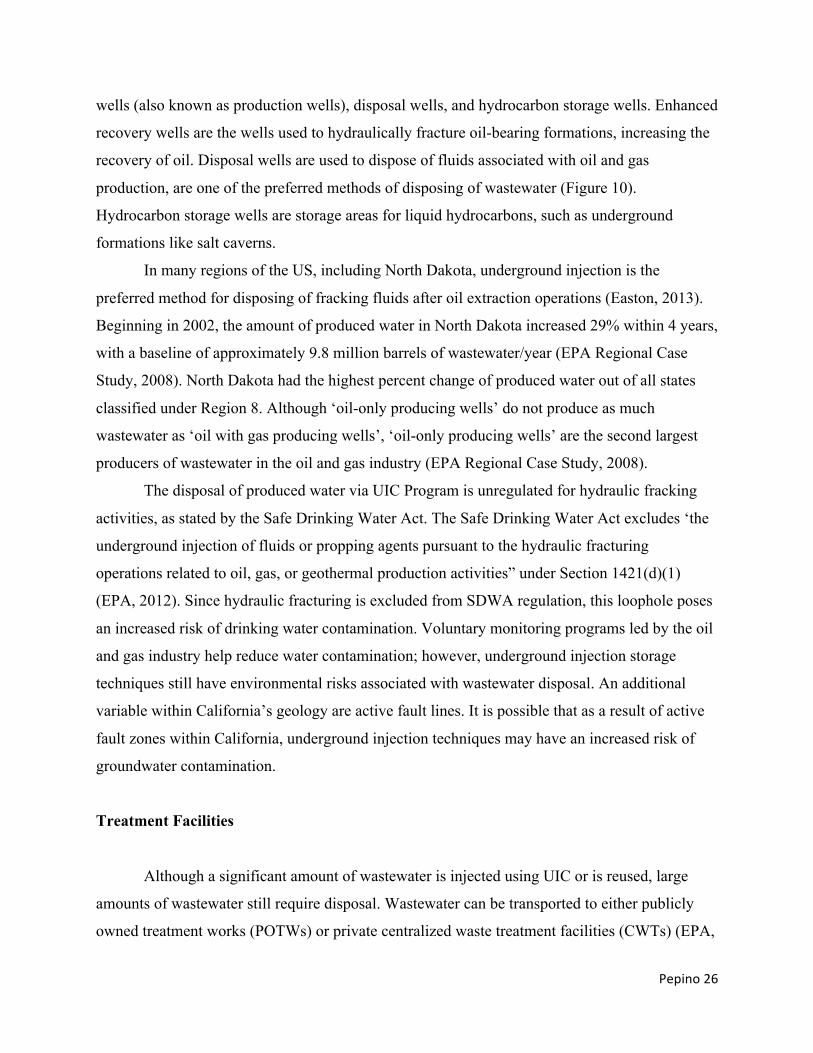
categorized under Class II of injection wells (Figure 10). The EPA
estimates 144,000 Class II wells are in operation in the United States,
with over 2 billion gallons of water injected each day (EPA, 2012).
Class II wells are divided into three categories: enhanced recovery
Figure 10 (EPA, 2012)
Pepino26
wells (also known as production wells), disposal wells, and hydrocarbon storage wells. Enhanced
recovery wells are the wells used to hydraulically fracture oil-bearing formations, increasing the
recovery of oil. Disposal wells are used to dispose of fluids associated with oil and gas
production, are one of the preferred methods of disposing of wastewater (Figure 10).
Hydrocarbon storage wells are storage areas for liquid hydrocarbons, such as underground
formations like salt caverns.
In many regions of the US, including North Dakota, underground injection is the
preferred method for disposing of fracking fluids after oil extraction operations (Easton, 2013).
Beginning in 2002, the amount of produced water in North Dakota increased 29% within 4 years,
with a baseline of approximately 9.8 million barrels of wastewater/year (EPA Regional Case
Study, 2008). North Dakota had the highest percent change of produced water out of all states
classified under Region 8. Although ‘oil-only producing wells’ do not produce as much
wastewater as ‘oil with gas producing wells’, ‘oil-only producing wells’ are the second largest
producers of wastewater in the oil and gas industry (EPA Regional Case Study, 2008).
The disposal of produced water via UIC Program is unregulated for hydraulic fracking
activities, as stated by the Safe Drinking Water Act. The Safe Drinking Water Act excludes ‘the
underground injection of fluids or propping agents pursuant to the hydraulic fracturing
operations related to oil, gas, or geothermal production activities” under Section 1421(d)(1)
(EPA, 2012). Since hydraulic fracturing is excluded from SDWA regulation, this loophole poses
an increased risk of drinking water contamination. Voluntary monitoring programs led by the oil
and gas industry help reduce water contamination; however, underground injection storage
techniques still have environmental risks associated with wastewater disposal. An additional
variable within California’s geology are active fault lines. It is possible that as a result of active
fault zones within California, underground injection techniques may have an increased risk of
groundwater contamination.
Treatment Facilities
Although a significant amount of wastewater is injected using UIC or is reused, large
amounts of wastewater still require disposal. Wastewater can be transported to either publicly
owned treatment works (POTWs) or private centralized waste treatment facilities (CWTs) (EPA,

2012). Both of these ‘indirect discharge’ facilities must ensure that the waste can receive proper
treatment, to avoid violating rules of the National Pollution Discharge Elimination System
(NPDES). However, many POTWs are designed to treat suspended solids and organic content
found in household/municipal sewage, not the treatment of water with high salt concentrations or
water with radionucleotides.
If a treatment plant cannot treat the waste properly, the owner could face NPDES permit
violations. Recently, as a result of increasing amounts of water needing to be treated from
hydraulic fracturing operations, it is possible for POTWs or CWTs to “refuse” the waste to avoid
violations. Currently, there is no comprehensive set of national standards for the disposal of
wastewater discharged from hydraulic fracturing activities; therefore, much of the responsibility
remains with the oil industry.
Recycled Wastewater
Given current water demands and water rights in North Dakota, a nontraditional water
source, such as wastewater recycling, can be economical as a result of the high cost of permits,
access fees, transportation, and storage for freshwater (North Dakota Industrial Commission,
2011). Reusing the produced water from previous fracking operations reduces the amount of
freshwater needed for future fracking jobs. New treatment technologies are being developed to
recycle water that is recovered from fracture jobs. Recycling systems that reduce the dependency
on fresh water have environmental benefits as well as economic benefits. Reduced truck traffic,
together with reduced road usage and road repairs, can save operators $100,000 - $400,000 per
well (Dale, 2013). In 2013, several commercialized products have been put on the market to
help reduce the demand on fresh water. UniStim and H20 Forward both enable operators to use
100% of the produced water from hydraulic fracturing for other oil and gas operations (PSA
from Halliburton, 2013).
In California, recycled wastewater would assist in the demand placed on fresh water for
hydraulic fracturing operations; however, since 30-70% of water remains within the formation,
additional water would still be required to accommodate the expanding energy industry.
Recycling wastewater is also not yet cost-competitive; therefore, these systems would need to
Pepino28
become part of the national regulatory framework to ensure the industry utilizes recycled water
before acquiring fresh water.
Contamination Risks
Surface Water
Environmental risks are associated with large withdrawals of surface water. Significant
impacts from large withdrawals include alterations of flow (for streams), depth, and temperature,
as well as mineral chemistry, leading to larger implications for species dependent on the water
source (EPA Draft Plan, 2011). North Dakota is currently studying the impacts of surface water
withdrawals from Lake Sakakawea.
After the produced water reaches the surface, there are several treatment options, each
associated with a risk of contaminating surface water and/or groundwater. Wastewater generated
during the exploration, development, and production of crude oil is labeled as “special wastes”
under the EPA, and is therefore exempt from the federal hazardous waste regulations under the
amendments to the Resource Conservation and Recovery Act (Subtitle C of RCRA, 1980).
Produced water can be stored on-site in an impoundment pit. Impoundment pits are constructed
depending on local, state, or tribal regulations. Depending on the construction, design and
monitoring techniques for the pit, contamination risks vary. If produced water is not stored on-
site in an impoundment pit, the water may be stored in tanks, waiting for treatment or disposal.
Once the produced water is ready for treatment or disposal, surface contamination may occur
during the transportation process. Potential leaks or spills are associated with both the storage
and transportation of produced water, influencing the contamination of surface water sources
(EPA Draft Plan, 2011).
Groundwater
Nearly half of the United States population relies on groundwater as their primary source
of drinking water; rural populations rely on groundwater for as much as 95% of their drinking
water. Groundwater aquifers that provide drinking water to urban areas and for agricultural use
can range from depths of tens to thousands of feet beneath the surface; however, the majority of
aquifers used are located at depths less than 300 feet below the surface (Groundwater Protection
Council & Interstate Oil and Gas Compact Commission, 2013).
Many surface water bodies, such as wetlands, rivers, and lakes, also depend on
groundwater discharge. Besides precipitation, groundwater recharge is a source for surface
waters (Groundwater Protection Council & Interstate Oil and Gas Compact Commission, 2013).
Environmental risks are also associated with decreasing water levels in an aquifer. Water quality
may be impacted as a result of low water tables by changing the mineral content and salinity of
the water (EPA Draft Plan, 2011). Chemical changes may occur if water levels greatly vary,
affecting the solubility, mobility, salinity, and bacterial growth of an aquifer system.
Groundwater is relied upon to meet the water needs of California. If the contracted
amounts of water to be delivered by the California State Water Project and the Central Valley
Project are unattainable, groundwater sources are used. If hydraulic fracking operations within
California further deplete groundwater sources, and/or lead to contamination of groundwater
sources, drinking water for California residents would be at risk.
One technique to avoid contamination risk is proper construction of new wells.
Cementation of the casing, in addition to casing materials, is the first, and potentially most
critical, line of defense for protecting groundwater. A physical barrier between groundwater and
the fracking fluids is an important element of minimizing groundwater contamination
(Groundwater Protection Council & Interstate Oil and Gas Compact Commission, 2009).
RECOMMENDATIONS:
California’s population is predicted to reach 55 million by 2050. The state will need to
double its energy capacity to accommodate this growth (California Energy Commission and
California Council on Science and Technology, 2011). However, with climate change and water
scarcity, unconventional energy sources should not be the first option to meet the increasing
demand. The first option should be conservation efforts and renewable energy generation. In
recent years, the California State Water Project and the Central Valley Project have not been able
to meet their contracted delivery amounts, putting stress on water sources, increasing the

Pepino30
probability of environmental risks. Hydraulically fracturing Monterey Shale would add to the
state’s water shortages.
In 2012, California had less than 600 (of the U.S. total 50,000) operating wells using
hydraulic fracturing techniques. However, if the 15 billion barrels of potentially recoverable oil
within the Monterey Shale formation is extracted using unconventional techniques, the process
will require billions of gallons of water. If fracking does begin to occur on a larger scale in
California, recommendations to minimize water use and environmental impacts are listed below.
Water Demands
To increase water availability for hydraulic fracturing, while attempting to reduce
potential impacts of water scarcity, the oil industry is beginning to take water based on seasonal
flow rates. Although consequences can occur from this technique, as seen in Natural Resources
Defense Council v. Houston, 146 F.3d 1118 (1998), collecting and storing water during wet
years can be advantageous if it is a season of high precipitation. If stream and river water flows
are greatest during spring and summer months, the industry will capture water when flow rates
are high and store for future use. This technique can potentially reduce stress on municipal
drinking water supplies, as well as significant impacts that would affect riparian or aquatic
communities downstream (Groundwater Protection Council & Interstate Oil and Gas Compact
Commission, 2013). In California, high seasonal flows should not be considered a reliable source
as compared to North Dakota, a state that received higher than normal precipitation in 2011 to
help meet the water needs of the oil and gas industry.
In addition to minimizing fresh water demands for hydraulic fracturing, treatment
facilities to recycle wastewater would be recommended instead of underground injection
disposal wells. Underground injection disposal wells remove the wastewater from the hydrologic
cycle, adding to water scarcity in the future. By injecting wastewater into impermeable wells the
wastewater cannot recharge groundwater sources – therefore removing the water permanently
from the hydrologic cycle. It’s from the hydrologic cycle that the earth receives precipitation.
If Monterey Shale extraction results in federal regulation for wastewater disposal
techniques, each Publically Owned Treatment Works or Centralized Waste Treatment facility
would need to be evaluated for their capacity to treat and properly dispose of wastewater, in
addition to extra costs associated with treating fracking fluid. A recommendation would be to
have pretreatment requirements for the oil and gas industry to ensure that the water is treated for
salt, raidonucleotides, and other chemicals in the fracking fluid. However, wastewater recycling
is often energy intensive, and may need chemicals for treatment, or additional water for dilution.
There is no perfect solution for wastewater treatment. The best way to reduce wastewater is to
use less water for the hydraulic fracking process.
Reducing Water Contamination Risks
The Bakken Shale Oil Exploration has shown a relationship between groundwater
contamination and well construction. Baseline water testing is essential, and should be a
requirement of the industry before exploration activities begin. Instead of taxpayers absorbing
the cost of additional water quality monitoring, the oil industry should be required to test the
water in areas identified as potential locations for hydraulic fracking before, during, and after
development.
Updated logs and monitoring reports are essential during well construction and the
cementing process within the wellbore. To reduce fluid movement from deeper fracking zones to
groundwater aquifers, initial cement jobs and well casings need to be constructed using best
practices, as well as constant monitoring techniques to monitor ground water sources nearby.
Alaska and Ohio are two states currently using verification methods to demonstrate that the
quality of bonding between the cement within the well and the well casing meets quality
requirements for ground water protection (Groundwater Protection Council & Interstate Oil and
Gas Compact Commission, 2009).
Examples of these geophysical logs include Cement Bond Logs (CBL) and Variable
Density Logs (VDL) (Groundwater Protection Council & Interstate Oil and Gas Compact
Commission, 2009). Both the CBL and VDL measure the travel time of sound waves between
the cement and the casing, measuring the bond between the two physical barriers. If California
begins large-scale oil extraction using hydraulic fracturing techniques, geophysical logs would
be recommended for both new and existing wells to decrease risks of water contamination.
In 2010, California onshore oil and gas wells produced 2.39 billion barrels of produced
water as a biproduct – approximately 9 barrels of water for every 1 barrel of oil from wells

Pepino32
(Kiparsky, Hein, 2013). In 2013, it was reported that the oil and gas industry in California prefers
underground injection of wastewater to any other wastewater disposal technique. An estimated
90-95% of wastewater is re-injected for reuse or disposal under the UIC Program. With over
24,000 active underground injection wells in California, underground disposal of wastewater
poses a risk to drinking water resources (EPA, 2011). One of the main dangers is the cement and
casing bond failure. Another recommendation to decrease risks of water contamination is to
mandate a CBL log for each well before construction, in addition to retrofitting existing wells.
To decrease risks of both ground water and surface water contamination, best practices
and regulatory requirements also need to be in place for the flowback water that returns to the
surface. The oil and gas industry should be held responsible for meticulous recordkeeping of
wastewater from fracking sites; including the percentage of flowback, surface storage locations,
transportation methods, and pre-treatment and treatment processes used. State regulations can
implement this by assessing fines on the industry if recordkeeping is not provided – with the fees
going toward scientific reporting.
Well plugging is a practice used to seal the inside of the well after the oil extraction
operation is complete. Well plugging attempts to stop/reduce fluid migration, both horizontally
and vertically. The current best practices are to use cast iron bridge plugs, capped with cement.
The cast iron creates a strong seal for the well, and the cement layer reduces the rate of
corrosion. An industry-wide regulation needs to be implemented for the process to close and cap
a well, in addition to monitoring guidelines after a well has been sealed.
Fault Zones and Induced Seismic Activity
Maximizing the distance – in addition to natural physical barriers – between the fracture
job and groundwater sources is a helpful technique for minimizing risk of contamination. If well
construction, proper casing, and initial cement lining is done correctly, the risk for ground water
contamination resulting from the flowback of fracture fluids is low. The greatest risk for
groundwater contamination is a result of the unaccounted flowback of fracture fluids that does
not make it to the surface. The vertical distance, in addition to the geological features between
the fractured zone and ground water source are factors that decrease risks of ground water

contamination (Groundwater Protection Council & Interstate Oil and Gas Compact Commission,
2009).
Natural faults within California increase the risk of chemical migration to drinking water
sources, such as groundwater aquifers. Naturally occurring faults in addition to wells serve as
migration pathways for contaminants to groundwater aquifers. Extensive geologic surveys of
currently existing wells (including abandoned wells) would need to be completed before large-
scale fracking operations occurred in Monterey Shale. Extreme caution should be given for wells
being drilled near an active fault line.
In addition to avoiding active fault zones to reduce groundwater contamination, recent
reports by USGS have shown an increase in seismic activity as a result of processes related to
hydraulic fracking. These ‘microearthquakes’, or earthquakes with magnitudes below 2, have
been reported in Oklahoma and have been correlated to fracking (USGS, Ellsworth, 2013).
Specifically, an increase in seismic activity is correlated to hydraulic fracturing wastewater
injection. Reports have showed the correlation between the injection of fluids to Class II disposal
wells and seismic events (USGS, Ellsworth, 2013). Because of California’s complex geological
formations, this enhances water migration. California’s Monterey Shale is deeper and thicker
than Bakken Shale, so risks are uncertain. In both Texas and Ohio, reports have indicated
epicenters in proximity to active underground injection wells.
When wastewater injection and sequestration occurs near faults with geologic formations
unable to resist external pressure, an earthquake in that region will be more likely to occur
(USGS, Ellsworth, 2013). Another requirement should be to perform geological surveys before
any exploratory wells are drilled. A ‘seismic risk map’ would need to be created by the United
States Geological Survey to indicate where hydraulic fracking should not occur based on fault
zones that could increase the risk of potential seismic activity and contaminated water migration.
California’s Policies on Fracking
As the debate continues between the benefits of high-paying jobs and billions of dollars
in state revenue versus potential costs associated with public health hazards and environmental
degradation, the state is beginning to draft and create proposed rules for regulating practices by
the oil and gas industry. In late 2013, Governor Jerry Brown signed into law CA Senate Bill 4, a
Pepino34
bill sponsored by Democrat Fran Pavley – establishing regulatory standards for hydraulic
fracking in the state. Before SB 4, California had no regulatory oversight for this process.
Governor Brown now takes the stance that fracking is an acceptable means of oil extraction as
long as it is “done in a safe and responsible manner”.
State oversight in SB 4 includes the testing of groundwater near oil wells, in addition to
increased transparency from the oil and gas industry, such as a list of the chemicals used in
fracking fluid available to the public. The Division of Oil, Gas, and Geothermal Resources
(DOGGR) oversees the entire process of oil and gas wells, beginning with the permitting and
drilling of the operation, to the plugging and abandonment of wells. In partnership with the
California Department of Conservation, DOGGR will institute the regulatory program for
fracking activities. DOGGR, the State Water Control Board and the Regional Water Quality
Control Board are responsible for California’s groundwater and surface water resources, but
coordination efforts among these three agencies have been minimal in addressing the
contamination risks and availability of resources for hydraulic fracking.
The proposed rules also include air quality monitoring and an independent study to
determine the pros and cons of fracking, including environmental impacts associated with water
contamination and effects on wildlife. Implementation may begin as early as January 1, 2015,
and these regulations would be considered some of the strictest in the US. Since well stimulation
treatments require an Environmental Impact Report (EIR), as indicated by the California
Environmental Quality Act (CEQA), California will be the leader of the regulatory framework
that is likely to be adopted on a national level after complete assessments. During the interim,
before the draft is signed into law, DOGGR claims oil and gas companies must abide by pending
regulations as early as January 2014. However, environmental groups are still critical of the
adopted fracking law, claiming that the law contains too many trade-secret loopholes and fails to
control these environmentally destructive activities.
Public Notice and Transparency
Many of the chemicals used in fracking fluid are not disclosed to the public, protected by the
right to keep trade secrets unavailable. To develop transparency in California for the protection
of public health related to water contamination, the oil industry would need to disclose how,
when and where oil extraction operations will occur. This will help the public be more prepared
for potential spills.
In addition to public notice before fracking operations commence, the oil company should
take water samples and publish water reports. By creating a baseline for water availability and
water contamination before drilling operations begin, a spill or leak can be more easily
determined if a baseline has been established. Because California has complex water laws, these
recommendations should also be used for states dependent on water that either originates or
passes through California.
Future Research
Not many peer-reviewed scientific articles are available on risks related to hydraulic
fracking, because large-scale hydraulic fracking is relatively new. Studies take time and funding,
and the EPA is attempting to keep pace with fracking, but is falling short. Plans have been put
into motion, however until evidence is found that hydraulic fracking does not pose a risk to
human health, a moratorium should be placed on hydraulic fracking in California.
In-depth, scientific, and unbiased studies can be very costly, but could be paid for if
DOGGR increased fees for permits, leases, and assessment reports for the oil and gas industry.
Increasing fees would provide extra revenue to increase the number of studies completed to fully
understand the risks that hydraulic fracking poses to water supplies.
Numerous towns have recently placed bans or moratoriums on fracking, temporarily
delaying the process while waiting for more research to determine the environmental impacts of
this practice. After lawmakers in California proceeded with legislation to regulate fracking, a ban
is unlikely. The best ‘next steps’ are to wait for the 2014 peer-reviewed results of the EPA’s Plan
to Study the Potential Impacts of Hydraulic Fracturing on Drinking Water Sources to minimize
water risks to both underground sources of drinking water (USDW) and surface waters. The EPA
is also currently developing and drafting proposed rules to amend the current guidelines for
effluent limitations. The Oil and Gas Extraction Category (40 CFR Part 435) under the Effluent
Limitations Guidelines (ELGs) is scheduled for publication in 2014.
The oil and gas industry is currently exempt from seven of the United States federal laws
including: the Clean Air Act, Clean Water Act, Safe Drinking Water Act, National
Pepino36
Environmental Policy Act, Resource Conservation and Recovery Act, Emergency Planning and
Community Right-to-Know Act, and the Comprehensive Environmental Response,
Compensation, and Liability Act, also known as Superfund. More research is needed on how
these exemptions jeopardize public health and the environment, leading to stricter regulations for
the oil and gas industry.
As a result of the 2005 Energy Policy Act, water processes associated with hydraulic
fracturing are exempt from federal water laws. In an attempt to protect drinking water, a
congressional proposal called the Fracturing Responsibility and Awareness of Chemicals Act –
also known as the FRAC act – has been repeatedly dismissed after attempting to define hydraulic
fracturing as a federally regulated activity that would be accountable under the Safe Drinking
Water Act. On a national level, protections still remain in favor of the drilling industry.
Informing and educating communities about hydraulic fracturing is an important step in
increasing transparency. Education about hydraulic fracking can empower stakeholders, such as
farmers and homeowners, to voice their opinions about the process. Without transparency,
citizens can’t fully understand the potential risks.
CONCLUSIONS:
In the United States, the annual energy demand is predicted to increase. To meet this
energy demand, the oil industry is using hydraulic fracturing to extract unconventional resources.
Hydraulic fracturing is a technique used to extract oil from shale deposits, requiring millions of
gallons of water per well. As seen in the Bakken Shale oil exploration in North Dakota, the
acquisition of fresh surface water can be challenging as a result of lengthy permitting processes,
transportation distances, availability, and costs. Although North Dakota is considered a state of
‘moderate water stress’ – assessed by the ratio of water withdrawal to the mean annual available
supply – the state is still facing water supply shortages for fracking. In contrast, California has
been identified as a state with ‘high/extremely high water risk’, emphasizing the concerns about
water availability within the state.
This paper focuses on the impacts of hydraulic fracturing California’s Monterey Shale,
the largest shale basin in the US holding approximately 15 billion barrels of potentially
recoverable oil, or five times the estimated recoverable oil from Bakken Shale. Hydraulic

fracturing can help meet national energy needs while providing economic revenue. However,
fracking also has environmental risks.
Though estimates are uncertain for water requirements to frack Monterey Shale, it is
certain that California’s water needs are continually increasing with agriculture, municipalities, a
projected population increase, and water shortages already occurring in years of drought. By
adding an additional water demand for hydraulic fracturing, water-stress risks increase. To
improve estimated water demands for California’s oil industry, complete surveys would need to
be conducted based upon potentially recoverable oil within mature shale deposits, in addition to
identifying water sources that could be used for hydraulic fracking. The Central Valley Project in
California cannot currently meet the contracted delivery amounts promised to farmlands,
therefore additional water sources would need to be acquired to serve the needs of the oil
industry. Monterey Shale has a very complex geologic formation, yielding higher water
contamination risks, than compared to Bakken Shale. With active fault lines, greater porosity,
and deeper depths, fracking Monterey Shale does pose a risk for the contamination of drinking
water through groundwater and surface water contamination. Additional wastewater treatment
and recycling facilities, including POTWs and/or CWTs, would need to be built or retrofitted to
treat the high volumes of wastewater associated with hydraulic fracturing.
The Brown Administration has proposed regulations for the oil industry within
California, including increasing the transparency of the hydraulic fracturing process, in addition
to requiring independent studies to determine the risks of fracking. However, the SB 4 bill has
received criticism from environmental groups, claiming the law is still industry-friendly by
providing trade-secret exemptions. As more research is done over time, prudent advise would be
to proceed with caution, after identifying many environmental risks associated with hydraulic
fracturing.
Pepino38
REFERENCES:
Agricultural Water Use. California Department of Water Resources, 16 Mar. 2010. Web.
<http://www.water.ca.gov/wateruseefficiency/agricultural/>.
Agricultural Water Use in California: A 2011 Update. The Center for Irrigation Technology / California
State University, Fresno, Nov. 2011. Web.
<http://www.californiawater.org/cwi/docs/CIT_AWU_REPORT_v2.pdf>.
"Annual Energy Outlook." U.S.. Energy Information Administration (EIA). U.S.. Energy Information
Administration, 2 May 2013. Web. 1 Oct. 2013.
<http://www.eia.gov/forecasts/aeo/chapter_executive_summary.cfm>.
An Assessment of the Environmental Implications of Oil and Gas Production: A Regional Case Study.
U.S.. Environmental Protection Agency, Sept. 2008. Web. <http://www.epa.gov/sectors/pdf/oil-
gas-report.pdf>.
Assessment of Undiscovered Oil Resources in the Devonian-Mississippian Bakken Shale Formation,
Williston Basin Province, Montana and North Dakota. United States Geological Survey, Apr.
2008. Web. <http://geology.com/usgs/bakken-formation-oil.shtml>.
Bakken Three Forks and Evolving Oil Play Information. North Dakota Oil and Gas Division, Sept.
2013. Web. <https://www.dmr.nd.gov/oilgas/>.
California State Water Project Overview. Department of Water Resources, 2013. Web.
<http://www.water.ca.gov/swp/>.
California's Energy Future - The View to 2050. California Energy Commission and California Council
on Science and Technology, May 2011. Web.
<http://www.ccst.us/publications/2011/2011energy.pdf>.
Central Valley Project. US Department of the Interior, Bureau of Reclamation, 15 Mar. 2013. Web.
<http://www.usbr.gov/projects/Project.jsp?proj_Name=Central+Valley+Project>.
"Conflict Over Water: Lake Sakakawea And Challenges To State Use." State Water Commission. North
Dakota State Water Commission, June 2012. Web. 5 Sept. 2013.
<http://www.swc.nd.gov/4dlink9/4dcgi/GetContentPDF/PB-2173/June.pdf>.
Dalrymple, Amy. Recycling Fracking Water Could Be a ‘game-changer’ in N.D. - See More At:
Http://oilpatchdispatch.areavoices.com/2013/08/14/recycling-fracking-water-could-be-a-game-
changer-in-n-d/#sthash.1pKC2O7M.dpuf. Oil Patch Dispatch, 14 Aug. 2013. Web.

<http://oilpatchdispatch.areavoices.com/2013/08/14/recycling-fracking-water-could-be-a-game-
changer-in-n-d/>.
"Draft Plan to Study the Potential Impacts of Hydraulic Fracturing on Drinking Water
Resources." EPA/600/D-11/001/February 2011/www.epa.gov/research. Us Environmental
Protection Agency, Feb. 2011. Web.
Draft Plan to Study the Potential Impacts of Hydraulic Fracturing on Drinking Water Sources. United
States Environmental Protection Agency: Office of Research and Development, Feb. 2011. Web.
<http://yosemite.epa.gov/sab/sabproduct.nsf/0/D3483AB445AE61418525775900603E79/$File/
Draft+Plan+to+Study+the+Potential+Impacts+of+Hydraulic+Fracturing+on+Drinking+Water+R
esources-February+2011.pdf>.
Easton, Jeff. Centered on Wastewater Treatment. Water and Wastes Digest, 9 July 2013. Web.
<http://www.wwdmag.com/industrial/centered-wastewater-treatment>.
Ellsworth, William L. "Injection-Induced Earthquakes." Injection-Induced Earthquakes. Earthquake
Science Center, US Geological Survey, July 2013. Web. 24 Nov. 2013.
<http://www.sciencemag.org/content/341/6142/1225942>.
Halliburton Releases High Performance Hydraulic Fracturing Fluid System. Halliburton, 22 Aug. 2013.
Web.
<http://www.halliburton.com/public/pe/contents/Product_Announcements/hydraulic_fracturing_
fluid_system.pdf>.
Honeyman, Rex P. "Pressure Head Fluctuations of the Fox Hills-Hell Creek Aquifer." North Dakota
State Water Commission. N.p., 2007. Web.
<http://www.swc.nd.gov/4dlink9/4dcgi/GetSubContentPDF/PB-1563/McKenzieReport.pdf>.
Hydraulic Fracturing and Water Stress. Ceres and Water Research Institute, Sept. 2012. Web.
<http://www.ceres.org/issues/water/hydraulic-fracturing-water-stress/hydraulic-fracturing-water-
stress>.
Hydraulic Fracturing in California. California Department Conservation's Division of Oil, Gas, and
Geothermal Resources, Aug. 2013. Web.
<http://www.conservation.ca.gov/dog/general_information/Pages/HydraulicFracturing.aspx>.
The Hydraulic Fracturing Water Cycle. Environmental Protection Agency, 19 Sept. 2013. Web. 12 Oct.
2013. <http://www2.epa.gov/hfstudy/hydraulic-fracturing-water-cycle>.
Pepino40
"Hydraulic Fracturing Water Usage." FracFocus Chemical Disclosure Registry. Groundwater Protection
Council & Interstate Oil and Gas Compact Commission, 2013. Web. 12 Oct. 2013.
<http://fracfocus.org/water-protection/hydraulic-fracturing-usage>.
"Hydraulic Fracturing White Paper." Department of Energy, June 2004. Web.
<http://www.epa.gov/ogwdw/uic/pdfs/cbmstudy_attach_uic_append_a_doe_whitepaper.pdf>.
Kurz, Bethany A., Daniel J. Stepan, Jon A. Harju, Brad G. Stevens, and Robert M. Cowan. "BAKKEN
WATER OPPORTUNITIES ASSESSMENT – PHASE 2 EVALUATION OF BRACKISH
GROUNDWATER TREATMENT FOR USE IN HYDRAULIC FRACTURING OF THE
BAKKEN PLAY, NORTH DAKOTA." North Dakota Industrial Commission, Dec. 2011. Web.
Missouri River Municipal & Industrial Water Storage Reallocation Study. U.S.. Army Corps of
Engineers: Ohama District, n.d. Web. 12 Oct. 2013.
<http://www.nwo.usace.army.mil/Missions/CivilWorks/Planning/PlanningProjects/MissouriRive
rMIWaterReallocationStudy.aspx>.
"The Monterey Shale & California's Economic Future." USC Price School of Public Policy. University
of Southern California, The Communication Institute, and Western States Petroleum
Association, Mar. 2013. Web. 10 Aug. 2013. <http://gen.usc.edu/assets/001/84955.pdf>.
Nordeng, Stephan N. The Bakken Source System. North Dakota Geological Survey, n.d. Web.
<http://www.ndoil.org/image/cache/Stephan_Nordeng_-_NDGS.pdf>.
The Oil Potential of the Bakken Source System. North Dakota Department of Mineral Resources, July
2010. Web. 13 Oct. 2013.
<https://www.dmr.nd.gov/ndgs/newsletter/nlsummer2010/The%20Oil%20Potential%20of%20th
e%20Bakken%20Source%20System.pdf>.
"Progress Report: Study of the Potential Impacts of Hydraulic Fracturing on Drinking Water
Resources." Us Environmental Protection Agency, Dec. 2012. Web. <EPA 601/R-12/011 |
December 2012 | www.epa.gov/hfstudy>.
"Regional Groundwater Availability Study." Groundwater Resources Program. United States
Geological Survey, 2013. Web. <http://water.usgs.gov/ogw/gwrp/activities/gw-avail.html>.
Regulation of Hydraulic Fracking in California, A Wastewater And Water Quality Perspective. April
2013. Kiparsky, Hein. Web.
<http://www.law.berkeley.edu/files/ccelp/Wheeler_HydraulicFracturing_April2013(1).pdf>
Regulation of Hydraulic Fracturing Under the Safe Drinking Water Act. Environmental Protection
Agency, 4 May 2012. Web.
<http://water.epa.gov/type/groundwater/uic/class2/hydraulicfracturing/wells_hydroreg.cfm>.
Review of Emerging Resources: U.S.. Shale Gas and Shale Oil Plays. U.S.. Energy Information
Administration, July 2011. Web. 1 Sept. 2013.
<http://www.eia.gov/analysis/studies/usshalegas/pdf/usshaleplays.pdf>.
"Science in Action." Hydraulic Fracturing Research Study. Environmental Protection Agency; Office of
Research and Development, June 2010. Web.
<http://www.epa.gov/safewater/uic/pdfs/hfresearchstudyfs.pdf>.
Shaver, Robert. Water Management Issues Associated with Bakken Shale Oil Development in Western
North Dakota. Water Appropriations Division: North Dakota State Water Commission, 2011.
Web. <http://www.mgwa.org/meetings/2012_fall/plenary/shaver.pdf>.
State Oil and Natural Gas Regulations Designed to Protect Water Resources. Groundwater Protection
Council & Interstate Oil and Gas Compact Commission, May 2009. Web. 13 Oct. 2013.
<http://fracfocus.org/sites/default/files/publications/state_oil_and_gas_regulations_designed_to_
protect_water_resources_0.pdf>.
"Status of Sedimentary Basins in California." N.p., n.d. Web. 15 Nov. 2013.
"Unconventional Oil & Gas Production." Energy Technology Network. Energy Technology Systems
Analysis Programme, May 2010. Web. 10 Sept. 2013. <http://www.iea-etsap.org/web/E-
TechDS/PDF/P02-Uncon%20oil&gas-GS-gct.pdf>.
U.S.. Crude Oil and Natural Gas Proved Reserves, 2011. U.S.. Department of Energy, Aug. 2013. Web.
12 Oct. 2013. <http://www.eia.gov/naturalgas/crudeoilreserves/pdf/uscrudeoil.pdf>.