water quality - thedotenvironment.com · ecosystems will develop around areas with unusual water...
TRANSCRIPT

water quality


Lecture series outline• Lecture 1a
– Water uses, water quality guidelines; physical, chemical and biological parameters
• Lecture 1b– The origins of the constituents of water quality through the hydrological
cycle• Qualities of rain• Influences of hydrological routing• Acid rain and critical loads
• Lecture 2a– Aquatic ecology
• habitats and niches• Stratifcation• Eutrophication• Influences of reservoirs
• Lecture 2b– Different land uses:
• Forestry• Agriculture• Urbanisation
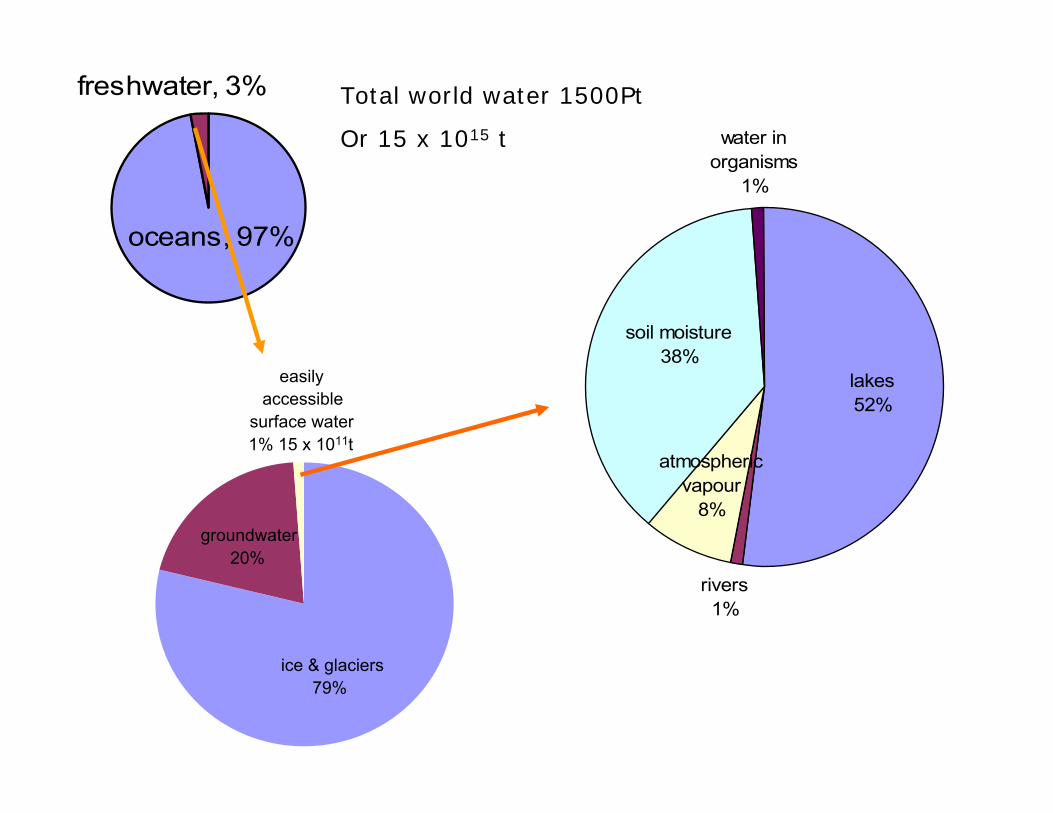
easily accessible
surface water1% 15 x 1011t
ice & glaciers79%
groundwater20%
oceans, 97%
freshwater, 3%
rivers1%
water in organisms
1%
lakes52%
soil moisture38%
atmospheric vapour
8%
Total world water 1500Pt
Or 15 x 1015 t

SI Units
•Factor Name Symbol 10-1 deci d 10-2 centi c10-3 milli m10-6 micro µ10-9 nano n10-12 pico p10-15 femto f10-18 atto a10-21 zepto z10-24 yocto y
Factor Name Symbol 1024 Yotta Y 1021 Zetta Z 1018 Exa E 1015 Peta P 1012 Tera T 109 Giga G 106 Mega M 103 Kilo K 102 hecto h 101 dekad a
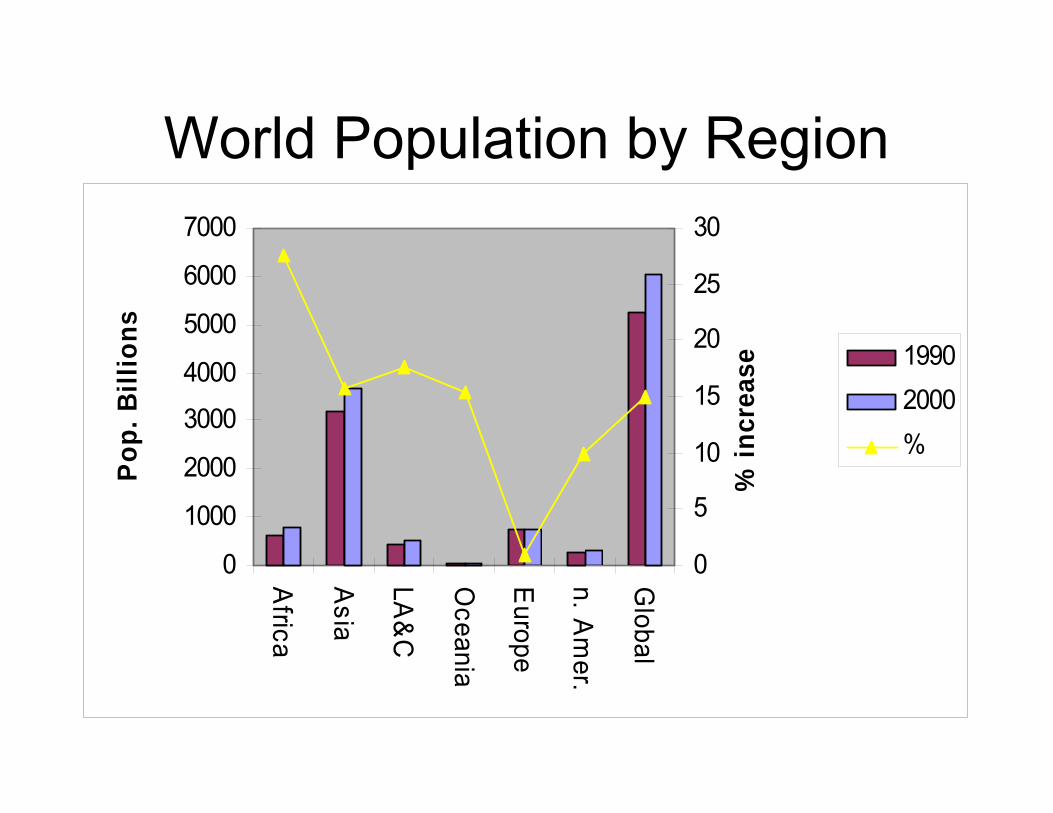
World Population by Region
0
1000
2000
3000
4000
5000
6000
7000
Africa
Asia
LA&
C
Oceania
Europe
n. Am
er.
Global
Pop.
Bill
ions
0
5
10
15
20
25
30
% in
crea
se
19902000%


Uses of Water• Drinking humans and livestock-
– Neutral pH, TDS<1660mg/l, low SO4, NO3, no pathogens, Heavy Metals, or Chemical pollution
• Washing – similar to drinking,
• Toilet flushing-– unimportant as long as water is clear and low Fe and Mn
• Bathing– Limits set for bacteria and nematode eggs.
• Irrigation-– limits for salinity, heavy metals, some elements, bacteria, nematode
eggs, some elements and organic material beneficial.• Industrial
– Cooling/ heating- high quality water to prevent furring or corrosion– Washing and food processing.
• Ecological– limits set by the ecosystem under consideration. Specialist
ecosystems will develop around areas with unusual water quality parameters.

World Water use
Agricultural 70%
Domestic 8%
Industrial 22%
Humans use 200 l /day = 0.2 t , 6 billion of us = 6 x 10⁹, daily water use = 0.12 x 10 9 t,yearly water use = 43.8 x 10 9 t Domestic water use = 8%Total use = 5.5 x 10¹¹ t
http://espejo.unesco.org.uy/
http://www.worldwater.org/

Water use per sector (selected countries) 2000
1
46
15
21
20
11
11
35
5
16
19
12
0
10
10
18
77
80
21
13
3
5
17
46
99
44
75
61
3
8
69
52
92
79
64
42
0% 20% 40% 60% 80% 100%
AfghanistanNew Zealand
Australia
BrazilBritain
CanadaChina
GhanaIndia
IsraelJapan
US
DomesticIndustryAgriculture

Crop Water Consumption, for 1Kg
1000 1400 14503450 4600
42500
1
10
100
1000
10000
100000
Potatoes Maize Wheat Rice Chicken Beef
Wat
er u
se (l
) .
lo
g sc
ale

Pollution
• Not Natural inputs • Indirect or Direct to water• Point Source and Diffuse Pollution• Results in deleterious effects
– Human health– Ecosystem health– Impairment of use for other activities
http://www.environment-agency.gov.uk/yourenv/eff/pollution/296030/298038/?version=1&lang=_e
http://www.defra.gov.uk/environment/water/quality/

Natural influences on Water Quality
• Storm events, - sediments, • Fires - sediments• Droughts – “High Total Dissolved Solids”• Stratification in lakes - Eutrophication• Geology- occasionally high salinity,
carbonates and specific ions (As, F (toxic)) or just unsightly (Fe and Mn)

Types of pollution
• Chemical – Organic– Plant nutrients– Inorganic Toxic Chemicals
• Physical – temp – sediments
• Biological– harmful organisms

Knowledge of Pollution
PesticidesToxic Trace Elements
Nutrient enrichmentErosion/ Sedimentation
Organic wastesSanitary Quality
NitrateTempSalinity
Increasing Cost and Complexity for InvestigationDecreasing Knowledge and Efficiency in Producing Information

Substantiated water pollution incidents by type (England and Wales,1999)
Not identified,
road runoff, landfill
leachate

Types and Sources of pollution
• Domestic Sewage
• Livestock• Landfills
• Croplands• Nurseries• Orchards• Building sites• Garden Lawns
• Landfills
• Mining• Vehicles• Urban Runoff, Roads,
• Landfills
• Irrigated lands
• Mining operations
• Urban Runoff, Roads,
• Landfills
• Crops• Nurseries• Orchards• Livestock• Gardens, lawns
• Logging• Fuel depots• Landfills
• Construction Sites
• Mining operations
• Croplands• Logging• Grazing
PathogensToxic chemicals
Heavy Metals
Acids & salts
Nutrients (ferts,
grease, Organic matter)
Sediment
Domestic, Industrial, Arable, Livestock, Forestry, Landfill

Problems
• Most pollution due to Agriculture in Developed countries
• Most pollution from Domestic sources in the Developing countries
• Industry although a gross polluter, produces relatively small volumes of polluted water.

Serious water pollution incidents by source in England and Wales, 2003
Other includes Unidentified sources, bars and restaurants, firefighting foam, and urban runoff


Water pollution incidents in England and Wales
Significant effectMajor effect

Water pollution incidents by source,in England and Wales, 1990 to 1999


Sewage affected river

Sewage water abstraction

Cattle Drinking sewage water

Sewage irrigation

16 miles down stream


Types of water law
• Local customs• Environment Protection Agencies• Government implemented laws• International legislation
– UN http://www.thewaterpage.com/int_water_law.htmhttp://www.fao.org/DOCREP/005/W9549E/w9549e00.htm
– WHO http://www.who.int/en/
– EEC http://europa.eu.int/scadplus/leg/en/s15005.htm

Approaches
• Usually over seen by an Environment Protection agency.– Standards for drinking waters– Standards for receiving waters– Standards for effluents and recycled water– Licences to discharge– Pollution charging

Types of water quality standards
• Criteria- Bench marks that must be meet for particular water uses
• Objectives- Desirable set levels to reach which may have cost benefit implications
• Standards (consents, licence)- Legal limits of pollution

UK regulatory bodies• Environment Agency-Government funded dept, • Responsibilities:
– Air, land and water– Creation of Catchment management plans, – Discharge consents, – Water protection zones, – groundwater and surface water abstraction licences.– Polluter pays for discharge consents based on
volume and toxicity of discharge in relation to WQO– Also promotes water recreation, conservation of
freshwaters, develop fisheries, navigation– issues flood warnings, and designs flooding defences

1989 Water Act
• Water defined as wholesome if • It meets WQ regs• Does not contain any harmful element,
organism or substance (prescribed or not) whether alone or in combination, at a concentration or value detrimental to public health

1991 Water Resources Act• required Surface water quality objectives should
be developed for river stretches.• Based on Actual use or Potential use if WQ was
improved.• 5 categories:
– River Ecosystem, – Special ecosystem, – Potable supply, – Agricultural/Industrial abstractions and – watersports

Water Act 2003• Exempts lots of farm abstractions from the
abstraction licensing process• Requires registration of:
– all forms of irrigation, including trickle irrigation,– transfers into canals, harbours,– transfers into Internal Drainage Board districts– the de-watering of quarries, mines and other works
• Allows the agency to revoke existing non time limited abstraction licences in 2012
• Abstraction licences to be based on CAMS

Private water supplies
• Covered by UK Water industry Act 1991• Monitored by Local councils

EU Emission Limit Values
Urban Waste Water Directive (91/27/EEC)
IPPC Directive (96/61/EEC)
Dangerous Substances Directive (76/464/EEC) limit values to be intergrated into IPPC
Nitrates Directive (91/676/EEC)
Pesticides Legislation Plant Protection Products Directive (91/414/EEC)
Other Legislations and measures
Habitats Directive (92/43/EEC)
Birds Directive (79/409/EEC)
Sewage Sludge Directive (96/78/EEC)
Seveso Directive (82/501/EEC)- health and safety
Environment Impact Assessment Directive (96/37/EEC)
Other relevant Community , National or Regional legislation
EU Water Quality Standards
Water quality standards from Directives on
Surface water (75/443/EEC),
Fish Water (76/659/EEC)
Shellfish Waters (79/464/EEC),
Groundwater (80/68/EEC)
Dangerous Substances (76/464/EEC)
Bathing Water Directive (76/160/EEC)
Drinking Water Directive (80/778/EEC)
Water Framework Directive (2000/60/EEC)
Integrated Water Management
http://www.ugr.es/~deintpub/ .Follow link to eunite, and then subjects and choose WFD

Aims to ensure:
• Sufficient provision of drinking water • Sufficient provision of water for other
economic requirements • Protection of the environment. Good
status for all groundwaters and surface waters by 2010 at the latest.
• Alleviation of the adverse impact of floods and droughts.

WFD will determine:
• Management plans using environmental quality standards (EQS)
• Monitoring and procedures and lists of specific parameters to be measured for each water type.
• High, good and fair levels for each parameter specified.
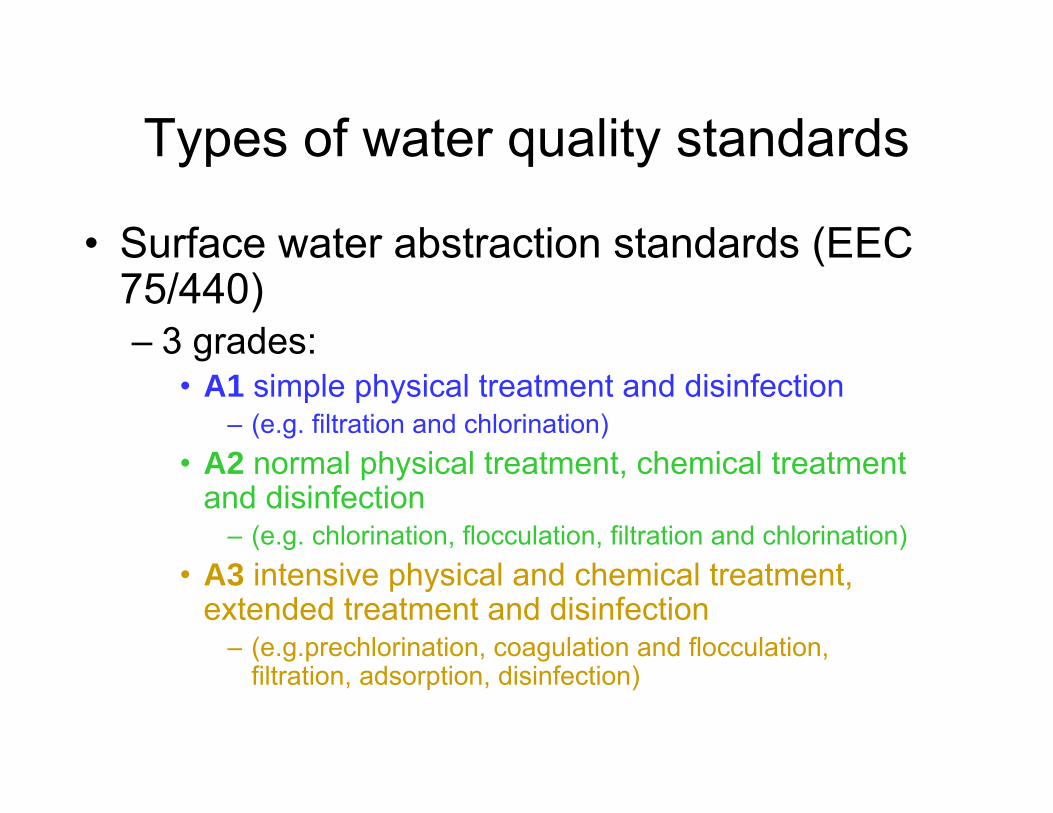
Types of water quality standards
• Surface water abstraction standards (EEC 75/440)– 3 grades:
• A1 simple physical treatment and disinfection – (e.g. filtration and chlorination)
• A2 normal physical treatment, chemical treatment and disinfection
– (e.g. chlorination, flocculation, filtration and chlorination)• A3 intensive physical and chemical treatment,
extended treatment and disinfection – (e.g.prechlorination, coagulation and flocculation,
filtration, adsorption, disinfection)
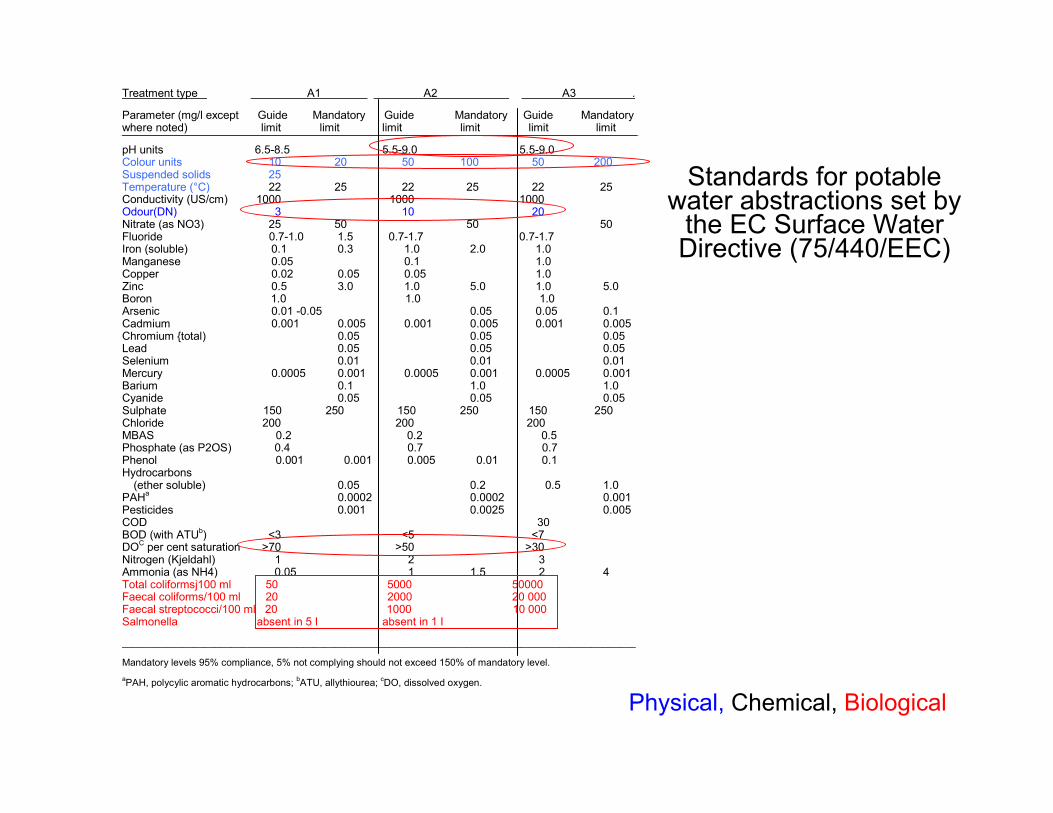
Standards for potable water abstractions set by
the EC Surface Water Directive (75/440/EEC)
Treatment type A1 A2 A3 .
Parameter (mg/l except Guide Mandatory Guide Mandatory Guide Mandatory where noted) limit limit limit limit limit limit
pH units 6.5-8.5 5.5-9.0 5.5-9.0 Colour units 10 20 50 100 50 200 Suspended solids 25 Temperature (°C) 22 25 22 25 22 25 Conductivity (US/cm) 1000 1000 1000 Odour(DN) 3 10 20 Nitrate (as NO3) 25 50 50 50 Fluoride 0.7-1.0 1.5 0.7-1.7 0.7-1.7 Iron (soluble) 0.1 0.3 1.0 2.0 1.0 Manganese 0.05 0.1 1.0 Copper 0.02 0.05 0.05 1.0 Zinc 0.5 3.0 1.0 5.0 1.0 5.0 Boron 1.0 1.0 1.0 Arsenic 0.01 -0.05 0.05 0.05 0.1 Cadmium 0.001 0.005 0.001 0.005 0.001 0.005 Chromium {total) 0.05 0.05 0.05 Lead 0.05 0.05 0.05 Selenium 0.01 0.01 0.01 Mercury 0.0005 0.001 0.0005 0.001 0.0005 0.001 Barium 0.1 1.0 1.0 Cyanide 0.05 0.05 0.05 Sulphate 150 250 150 250 150 250 Chloride 200 200 200 MBAS 0.2 0.2 0.5 Phosphate (as P2OS) 0.4 0.7 0.7 Phenol 0.001 0.001 0.005 0.01 0.1 Hydrocarbons (ether soluble) 0.05 0.2 0.5 1.0 PAHa 0.0002 0.0002 0.001 Pesticides 0.001 0.0025 0.005 COD 30 BOD (with ATUb) <3 <5 <7 DOC per cent saturation >70 >50 >30 Nitrogen (Kjeldahl) 1 2 3 Ammonia (as NH4) 0.05 1 1.5 2 4 Total coliformsj100 ml 50 5000 50000 Faecal coliforms/100 ml 20 2000 20 000 Faecal streptococci/100 ml 20 1000 10 000 Salmonella absent in 5 I absent in 1 I
______________________________________________________________________________________________
Mandatory levels 95% compliance, 5% not complying should not exceed 150% of mandatory level. aPAH, polycylic aromatic hydrocarbons; bATU, allythiourea; cDO, dissolved oxygen.
Physical, Chemical, Biological
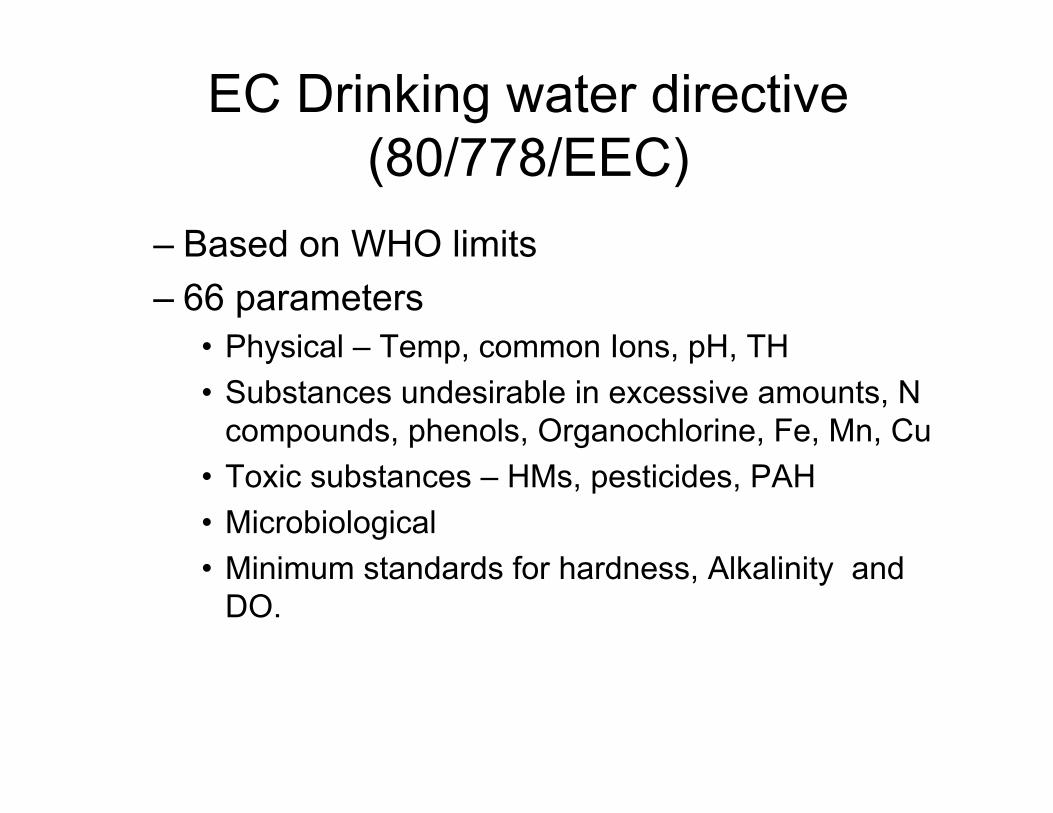
EC Drinking water directive (80/778/EEC)
– Based on WHO limits– 66 parameters
• Physical – Temp, common Ions, pH, TH• Substances undesirable in excessive amounts, N
compounds, phenols, Organochlorine, Fe, Mn, Cu• Toxic substances – HMs, pesticides, PAH• Microbiological• Minimum standards for hardness, Alkalinity and
DO.

http://www.lenntech.com/drinking-water-standards.htm

Freshwater fish directive
(78/656/EEC)
The standards specified for salmonid and cyprinid waters under the EC Freshwater Fish
Directive (78/656/EEC) (reproduced with permission of the European Commission, Luxembourg)
Parameter Salmonid cyprinid
G I G I
Temperature (C) Temperature at edge of mixing zone must not exceed (where there is a thermal discharge) the unaffected temperature by more than:
1.5 3 The temperature must not exceed:
21.5 28 10 10
The 10°C limit applies to breeding periods when needed
Dissolved oxygen (mg/l O2) 50% > 9 50% > 9 50% > 8 50% > 7 100% > 7 When < 6, must 100% > 5 When < 4, must
prove not prove not harmful to harmful to fish population fish population
pH 6-9 6-9
Suspended solids (mg/l) <25 <25 Biochemical oxygen demand (mg/l) <3 <6
Total phosphorus No G or I standards applicable
Nitrites (mg/l NO2) <0.01 <0.03
Phenolic compounds (mg/l C6H5OH) Must not adversely affect fish flavour
Petroleum hydrocarbons Must not be present visibly, detectable by taste of fish, harmful to fish
Non-ionized ammonia (mg/l NH5) <0.005 <0.025 <0.005 <0.025
Total ammonium (mg/l NH4) <0.04 <1 <0.2 <1
Total residual chlorine (mg/l HOCl) <0.005 <0.005
Total zinc (mg/l Zn) At water hardness> 100 mg CaCO3/1 <0.3 <1.0
There are also limit values for hardness between 10 and 500 mg CaCO3/l
Dissolved copper (mg/l Cu) At water hardness> 100 mg CaCO3/l
<0.04 <0.04 There are also limit values at hardness between
10 and 500 mg CaCO3/l


Salinity and plant growth
Salt tolerant crops only (cotton, rape, Kale, sugar beet)
3000 - 75002000 - 5000
Many crops affected adversely 1500 - 30001000 - 2000
Salt sensitive plants affected (peas, potatoes, cabbage,apples)
750 - 1500500 - 1000
No significant effects< 750< 500
Detrimental effectsConductivity (µS/cm-1)
Dissolved solids (ppm)

Toxic to many plants at widely varying concentrations; reduced toxicity at pH > 6.0 and in fine textured or organic soils.
2.0Zn (zinc)
Toxic to many plants at relatively low concentrations.0.10V (vanadium)
W (tungsten)
Effectively excluded by plants; specific tolerance unknown.----Ti (titanium)
Sn (tin)
Toxic to plants at concentrations as low as 0.025 mg/l and toxic to livestock if forage is grown in soils with relatively high levels of added selenium. An essential element to animals but in very low concentrations.
0.02Se (selenium)
Can inhibit plant cell growth at very high concentrations.5.0Pd (lead)
Toxic to a number of plants at 0.5 mg/l to 1.0 mg/l; reduced toxicity at neutral or alkaline pH.0.20Ni (nickel)
Not toxic to plants at normal concentrations in soil and water. Can be toxic to livestock if forage is grown in soils with high concentrations of available molybdenum.
0.01Mo (molybdenum)
Toxic to a number of crops at a few-tenths to a few mg/l, but usually only in acid soils.0.20Mn (manganese)
Tolerated by most crops up to 5 mg/l; mobile in soil. Toxic to citrus at low concentrations (<0.075 mg/l). Acts similarly to boron.
2.5Li (lithium)
Not toxic to plants in aerated soils, but can contribute to soil acidification and loss of availability of essential phosphorus and molybdenum. Overhead sprinkling may result in unsightly deposits on plants, equipment and buildings.
5.0Fe (iron)
Inactivated by neutral and alkaline soils.1.0F (fluoride)
Toxic to a number of plants at 0.1 to 1.0 mg/l in nutrient solutions.0.20Cu (copper)
Not generally recognized as an essential growth element. Con-servative limits recommended due to lack of knowledge on its toxicity to plants.
0.10Cr (chromium)
Toxic to tomato plants at 0.1 mg/l in nutrient solution. Tends to be inactivated by neutral and alkaline soils.0.05Co (cobalt)
Toxic to beans, beets and turnips at concentrations as low as 0.1 mg/l in nutrient solutions. Conservative limits recommended due to its potential for accumulation in plants and soils to concentrations that may be harmful to humans.
0.01Cd (cadmium)
Toxicity to plants varies widely, ranging from 5 mg/l for kale to 0.5 mg/l for bush beans.0.10Be (beryllium)
Toxicity to plants varies widely, ranging from 12 mg/l for Sudan grass to less than 0.05 mg/l for rice.0.10As (arsenic)
Can cause non-productivity in acid soils (pH < 5.5), but more alkaline soils at pH > 7.0 will precipitate the ion and eliminate any toxicity.
5.0Al(aluminium)
RemarksRec. Max.Conc. (mg/l)Element
http://www.fao.org/DOCREP/003/T0234E/T0234E06.htm#ch5.5.2
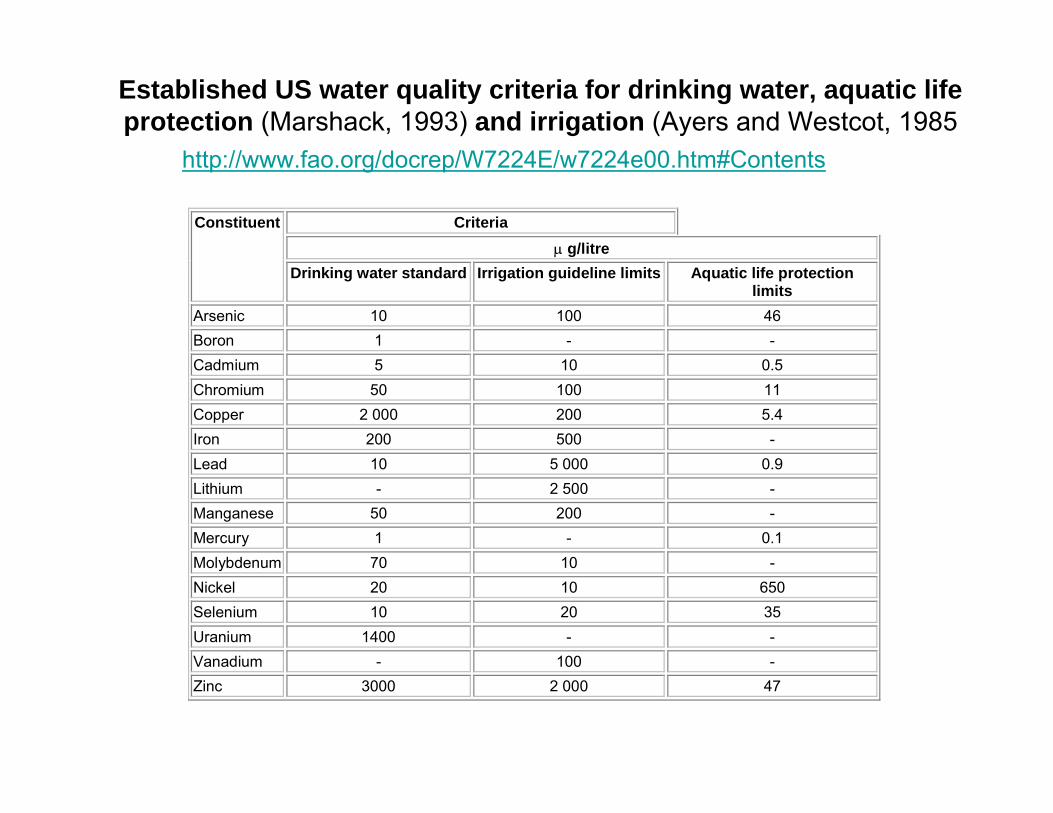
Established US water quality criteria for drinking water, aquatic life protection (Marshack, 1993) and irrigation (Ayers and Westcot, 1985
Criteria
µ g/litre
Constituent
Drinking water standard Irrigation guideline limits Aquatic life protection limits
Arsenic 10 100 46 Boron 1 - - Cadmium 5 10 0.5 Chromium 50 100 11 Copper 2 000 200 5.4 Iron 200 500 - Lead 10 5 000 0.9 Lithium - 2 500 - Manganese 50 200 - Mercury 1 - 0.1 Molybdenum 70 10 - Nickel 20 10 650 Selenium 10 20 35 Uranium 1400 - - Vanadium - 100 - Zinc 3000 2 000 47
http://www.fao.org/docrep/W7224E/w7224e00.htm#Contents

Physical properties
• Flow Rate• Sediments• Colour• Taste and Odour• Turbidity• Temperature

Flow rates• Important to
– Estimate volumes of water for particular uses– Assess absolute level of pollutants
• Measured by:– Floats– Flowmeter– Stage discharge relationships– Weirs and flumes– Dilution gauging– Formulae – Mannings equation

Dilution and Residence times• Residence time = Volume / Total outflow
– The greater the amount of rainfall the more dominant the constituents of rainwater and the catchment surface.
– Less surface runoff then greater contribution from ground waters.
• Short residence times– Rapid dispersion of dissolved contents, pollutants and recovery,
• Long residence times– Slow dispersion of dissolved contents, pollutants and slow
recovery
short long
Sediments• Dissolved load
– material that is chemically carried in the water • Suspended Load• Bed Load
• The quantity and quality of the load is defined in terms of competence and capacity. – Competence
• the size of clast that a stream can carry, • a function of velocity and slope
– Capacity• the volume of sediment carried • a function of velocity and discharge

Factors that govern the % dissolved and suspended load
• include:– climate: temperature, storm event
precipitation, – vegetation: type and amount– erodibility of materials in the drainage basin– relief and slope – activity by man: mining, construction, clear
cutting, etc.• Similar to factors in the USLE

Suspended load• Measured by weighing grab samples in mg/l. Also
assessed by Turbidity measurements. • Sediment rarely touching the river bed. • Moves at the same velocity as the flow.• Boulders, tree trunks, leaves, sediments and other trash• Small particles (e.g. clay and fine silt), held in
suspension because of the electrostatic attraction between the unsatisfied charges on grain's surface and the water molecules.
• Provide a place for pathogens and can contain toxins. • Reduce light penetration and photosynthesis• May damage fish gills at concentrations >90 mg/l• May settle out and smother bottom dwelling animals and
plants.

Hjulstrom curveThe Hjulstrom curve shows that a much higher velocity is required to entrain clay and fine silt than coarse sand. However, once the fine sediment is in suspension, a much lower velocity is required to maintain it in suspension.

Bedload
• Moves at velocities slower than the flow and spends most of its time on or near the stream bed
• Mechanisms of grain motion:– traction (rolling and sliding)- controlled by Slope and
Flow rate– saltation (hopping)--grains temporarily suspended by
fluid vortices or by ballistic impact • Grain movement may be continuous or
intermittent

Turbidity/ Transparency• Due to suspended, dissolved solids and chlorophyll• Measured in NTU or FTU• N = Nephelometer F = Formazin• Instruments
– Light meters– Turbidity Tubes– Seechi Disks
1052154320315019
10011.52007NTUDistance (mm)

Turbidity/ Transparency• Due to suspended, dissolved solids and chlorophyll• Measured in NTU or FTU• N = Nephelometer F = Formazin• Instruments
– Light meters– Turbidity Tubes– Seechi Disks
1052154320315019
10011.52007NTUDistance (mm)

Colour
• Hazen Units or True Colour Units• 1 TCU = Colour of 1mg/l of Platinium as
Chloroplatanic acid in the presence of 2mg/l of CoCl2 which gives a yellow colour
Taste and Odour• Sweet, Sour, Salt and Bitter• Samples diluted until no detectable odour or
taste– Algae and moulds produce a musty taste– Iron, manganese and sulphates bitter tastes– Hydrogen sulphide produced by some bacteria has a
rotten egg smell – Chlorine tastes in waters are due to chlorination of
waters with organic matter– Phenols and peats impart distinctive tastes and
odours. Chlorinated phenols impart a bad taste

Temperature
• Effects rates of chemical reaction
• Decay of OM• Solubility of oxygen
0
2
4
6
8
10
12
14
16
0 5 10 15 20 25 30
Temp (c)
Satu
ratio
n ox
ygen
con
c. (m
g/l

Chemical properties
• Dissolved Solids– Inorganic
• Dissolved ions –– Anions Na+, Ca2+, K+, – Cations CO2-
3, SO2-4, Cl-,
• Gases – O2, CO2
• pH• Alkalinity • Hardness• Redox
– Organic• Organic matter• Plant nutrients NO3, PO4

Measurement of dissolved solids• TDS (total dissolved solids)
– Relative proportion • No. (ppm)• Weight (mg/l)• Electrical equivalent (meq/l) meq = ion charge x weight (mg/l) .
atomic wt
– Eg. 1 mg/l CaAtomic Wt. Ca2+ = 40
Valency Ca2+ = 2 Ca meq =1/(40 x 2) = 0.0499
• Conductivity (µS/cm)– TDS (mg/l) x (1.2 to 1.8) = conductivity (µS/cm)– Conductivity (µS/cm) x (0.55 to 0.9) = TDS (mg/l)

Ion Balance (Electoneutrality)
• Based on meq/l• Good water analyses are 0-5%
• Ion Balance = 100×+−
∑ ∑∑ ∑
AnionsCationsAnionsCations

Ranges of TDS
Sea
Start of Plant intolerance
All plants intolerant

Periodic table


Most common ions in river waters of N.USA
<0.01PO4-
0.5Fe2O32+
1.2NO3-
1.8K+
4.9Mg2+
7.4Cl-7.5Na+
8.6SiO42+
15.3SO42-
19.4Ca2+
33.4CO32-
Average % of TDS
Ion or compound

Measurement of specific elements and molecules
• Electrochemical (using meters with electrodes)
• Titration• Colourimetry or spectrophotometry
(AAS, ICP)• Chromatography (HPLC, GC, IC)• Mass Spectrometry (can be combined
with HPLC, GC, ICP)
• Instrumental water analysis.ppt

-- Shows relative proportion of ions


Piper Diagram
Ca= 60%, Na = 30%, Mg=10%
HCO3 =70%, SO4= 20%, Cl =10%

pH
• Log scale of Molar per litre Hydrogen ion concentration – Ranges from 10-1 to 10-14
• Balanced by OH-
• H2O → H+ + OH-
• When H+ conc < 10-7, OH- ions predominate.

Sources of pH
• Rainfall –– Atmospheric gases– Natural and Human additions
• Soil interactions– Organic materials – Dissolved anions from rock weathering

Rainfall• Total effect of dissolved atmospheric gases is to
give rain water a range from pH 4.5-5.6– CO2
• (0.032% of atmosphere) forms weak carbonic acid pH 5.64
– Sulphur compounds• Small amounts of H2S and SO2, Volcanoes, • Large amounts of Carbon sulphides e.g. Di methyl sulphide
released by bacteria and algae in the ocean.• SO2 equilibrium pH = 4.9.
– NOx - from lightning. Forms Nitric acid


CO2 in water• 30 x more soluble than O2
• Acid formed by CO2 dissolution which is progressively neutralized by cation release from soil /rock
• Forms weak Carbonic acid
CO2 + H2O → H2+CO3
2-(< pH 6.4)
• Carbonic acid dissociates into free hydrogen and bicarbonate ions
H+2CO2-
3→ H+ + HCO-3 (pH 6.4 – 10.3)
• And Bicarbonate can dissociate into Hydrogen and carbonate ions
HCO-3→H+ + CO2-
3 (>pH 10.3)
• H2+CO3
2- and HCO-3 can be used by plants in photosynthesis

Used by plants

Effects of pH

Alkalinity
• Capacity to neutralize acids (mg/l as CaCO3)
• Buffering capacity - ANC• Due to
– CO32-, HCO3
- OH-
– but also PO4-, BO4
- and SiO4-
• Tested in 2 stages 1. Titration with acid to pH 8.3 (Free alkalinity)2. Titration with acid to pH 4 (Total alkalinity)

Hardness• Caused by divalent ions only
– Σ Ca2+ and Mg2+ ions – but also Si2+, Fe2+ and Mn2+
Carbonate Hardness / Temporary HardnessCa(HCO3)2 → CaCO3 + CO2 +H2O
Non Carbonate Hardness/ Permanent HardnessDue to Cl-, SO4
2-, NO3-
Min limits for hardness to protect against heart disease

1014.317.117.8
French degrees, °fClark degrees, °eGrains CaCO3 per US GalGerman degrees, °d
Parts CaCO3 per million
(mg CaCO3 per liter)
Equivalent Scales of Water Hardness
Very SoftSoft
Medium HardHard
Very Hard
0-7070-140140-310310-515
>515
0-44-88-1818-30>30
“Class”ppm CaCO3Grains/Gallon


Oxidation and Reduction
Cd2+ + Fe → Cd + Fe2+
Cd2+ + 2e- → Cd(reduced)
Fe → Fe2+ + 2e-
(oxidized)
e- + Fe3+(OH)-3 + 3H+
→ Fe2+ + 3H2O2FeS2 + 7O2 + 2H2O →2Fe2+ + 4SO2-
4 + 4H+
of hydrogenAddition Removal
of oxygenRemoval Addition
of electronsAddition Removal ReductionOxidation

Electropotentials (1 mmol/l)
HCO3
OH0.000Hydrogen
SO4
OH
+0.441Iron
+0.122Lead+0.136Tin
+0.758Zinc+1.30Aluminium+1.87Magnesium+2.20Calcium+2.71Sodium+2.92Potassium
Potential (volts)Metal
Increasing ability to be reduced and remain in solution as ions
+
-


Reduced Conditions
Oxidized Conditions
RedoxDiagrams

Organic Matter
• Different types CPOM, FPOM, DOM– Sources– Impact on Aquatic life
• Effect on Oxygen concentrations • Nutrients - Eutrophication

Organic constituents• Difficult to detect and analyse as there are many
different types. • Particulate Organic matter (POM)
– leaves, logs, faeces, petals, etc. – temperate climes - most POM enters in autumn with
leaf fall and bud burst in spring in. – Tropical forests - don’t follow this pattern, seasons not
pronounced. Dense forest prevents wind blowing leaves into the rivers.
– Estimated by weight loss by dry filter paper after a measured filtered volume of a water sample
– CPOM Sediments >1mm– FPOM particulates in suspension <1mm

Dissolved organic matter• < 0.45um• Often greater than the suspended organic loading, and
may be more than the inorganic loading.• Measurements based on combustion of dried water
samples and measurement of CO2 levels. This requires specialized equipment.
– Persistent - Large molecules e.g. lignin, Phenols and carboxylic acids.
• Often combine with Fe to form soluble compounds. • Result of decomposition - relatively stable, Least important to
aquatic ecosystems• Often present in concentrations greater than 1 mg/l.
– Liable - Smaller molecules amino acids alcohols sugars, peptides, carboxylic acids.
• more reactive and shorter lived and present in low conc. ug-ng/l.

Taking a closer look at leaf decay in a Taking a closer look at leaf decay in a stream ecosystemstream ecosystem


Low loadinglittle change in the natural community of the river.Increases the nutrient supply for micro-organisms present in the natural state. Can benefit the whole aquatic ecosystem.
Medium Loadingoxygen levels drop considerably river appears polluted for a stretch,some species flourish at expense of others. River recovers downstream. If continuous will form a barrier to migratory fish.
High loadingDO levels fall to near 0. Sewage fungus and worms flourish at the expense of other organisms. Anaerobic bacteria thrive and the river stinks, Methane hydrogen sulphide and ammonia evolved. Few algae photosynthetic oxygenation hindered.River polluted for a much greater distance downstream.
Effect of Organic matter discharge on Oxygen concentration in river water


Sewage fungus organisms

Biochemical Oxygen Demand (BOD)
BOD5 = DO0 – DO5
• Difference in oxygen concentration of water at the time of sampling and 5 or 7 days later after being stored in the dark at 20˚c in an air tight container. – In the dark because of algae– 5 days because this is the longest flow time of any British river to the
sea. & days is used in Europe and fits in with the weekly cycle.– 20˚c because this was the long term British Summer average
temperature.
• Indicates what the effect of this level of organic matter has on the aquatic life and how much dilution is necessary to prevent unwanted changes in the aquatic ecosystem.
• Used to predict oxygen demand in sewage plants.• Winkler or DO meter used to measure dissolved oxygen• Samples should still have 30% of original O2 concentration on day 5
(6 mg/l max as O2 concentration at 20˚c is 9mg/l)

Chemical Oxygen Demand (COD)
• Complete oxidation of Organic matter and Inorganic compounds using Potassium Dichromate (K2Cr2 O7) and concentrated sulphuric acid in the presence of a silver catalyst.
• COD usually greater than BOD because of inorganic compounds.
• Used by water authorities to calculate charges for treatment of industrial wastes.
• Rapid compared to BOD.

Permanganate Value (PV)• All substances organic and inorganic are oxidized by treatment with
Potassium Permanganate (KMnO4) at 27˚c. Either 3 mins or 4 hour test.– 3 Min test – in this test a large % of the inorganic and a small % of
organic compounds will be oxidized. – 4 hour test – the rest of the organic and inorganics are oxidized
• the 3min to 4 hour ratio gives a clue to the origin• samples with a high 4 hour:3 minute PV = large organic content (4
hour) compared with the inorganic content (3 minute) and vice versa.
• Sewage effluent and river water containing untreated or treated sewage tend to give a 4 hour:3 minute PV ratio of around 3:1;
• Vegetable processing wastes and river waters containing them have PV ratios between 4.1 and 10:1.

Dissolved and particulate N and P

Aquatic Nitrogen cycle
NO3
Atmosreservoir
N2
NO2
Plant Tissue
Animal tissue
sediment
NH3
Organic Nnitrification
Grazing
uptake
Lightning
denitrifica
tion
deco
mposit
ion
Excreationrelease
uptake
Excr
eatio
ndecomposition
Microbial fixation
Volitization

Aquatic Phosphate Cycle
Plant tissue
Animal tissue
Dissolved Inorganic P
Dissolved /ParticulateOrganic PPOP,DOP
Bacterial Tissue
Lake Sediment
(SINK)
Phosphate bearing rock
reduction
erosion
oxidation
colle
ctors
Death
Excretion/
death
Death
Shedders
/grazers
excretion
herbivory
Excr
etio
n
uptake
pred
atio
n
exudates


Biological parameters• Many diseases linked to faeces
• Total coliforms (TC).– rod shaped bacteria, include faecal and some environmental coliforms
(soil).– The test for these is incubation at 35 – 37˚c. They evolve gas and acid
from lactose media.• Thermo tolerant faecal coliforms (FC).
– These grow at 44 – 45˚c on a lactose media producing gas and acid. – Nearly always indicate presence of faecal contamination. – 95% of these will be Eschericha coli. Nutrient rich waters will give high
counts as other thermo tolerant organisms may be present other than E.coli.
• Faecal streptococci. – Direct evidence of faecal pollution. – More persistent in the environment than total coliforms or faecal
coliforms. – They are grown on sodium azide at 37-44˚c. – Difficult to test for in the field.
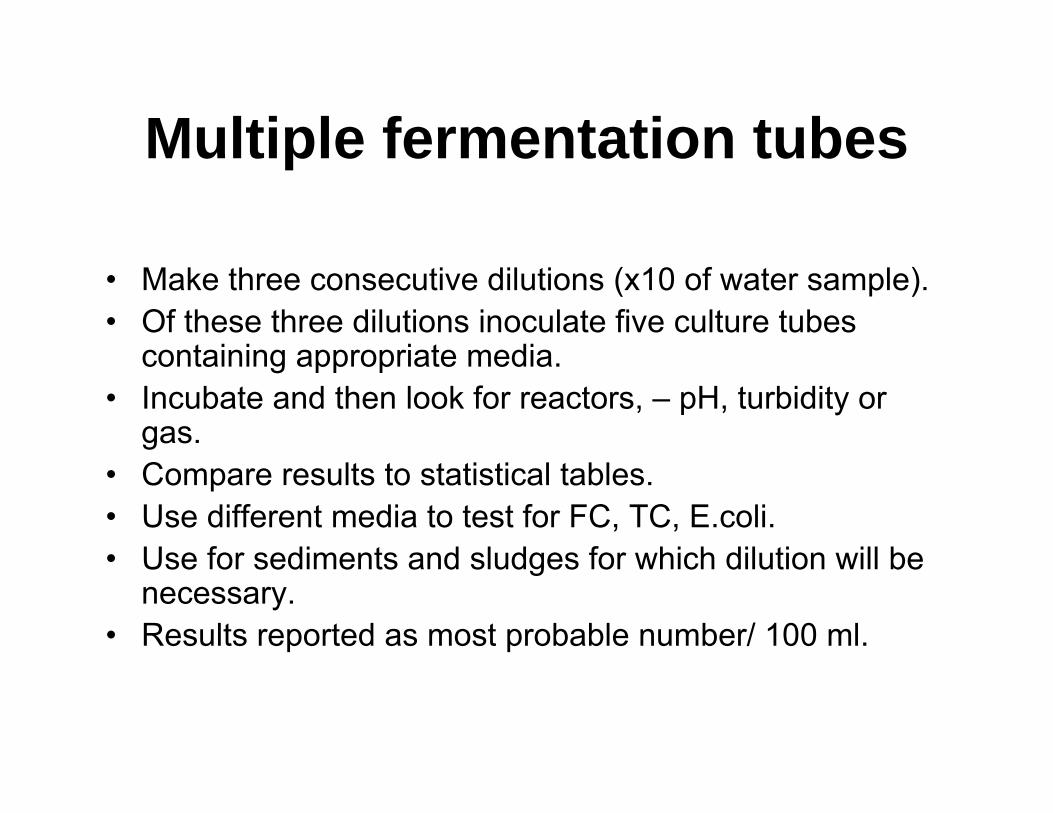
Multiple fermentation tubes
• Make three consecutive dilutions (x10 of water sample). • Of these three dilutions inoculate five culture tubes
containing appropriate media. • Incubate and then look for reactors, – pH, turbidity or
gas.• Compare results to statistical tables. • Use different media to test for FC, TC, E.coli.• Use for sediments and sludges for which dilution will be
necessary.• Results reported as most probable number/ 100 ml.
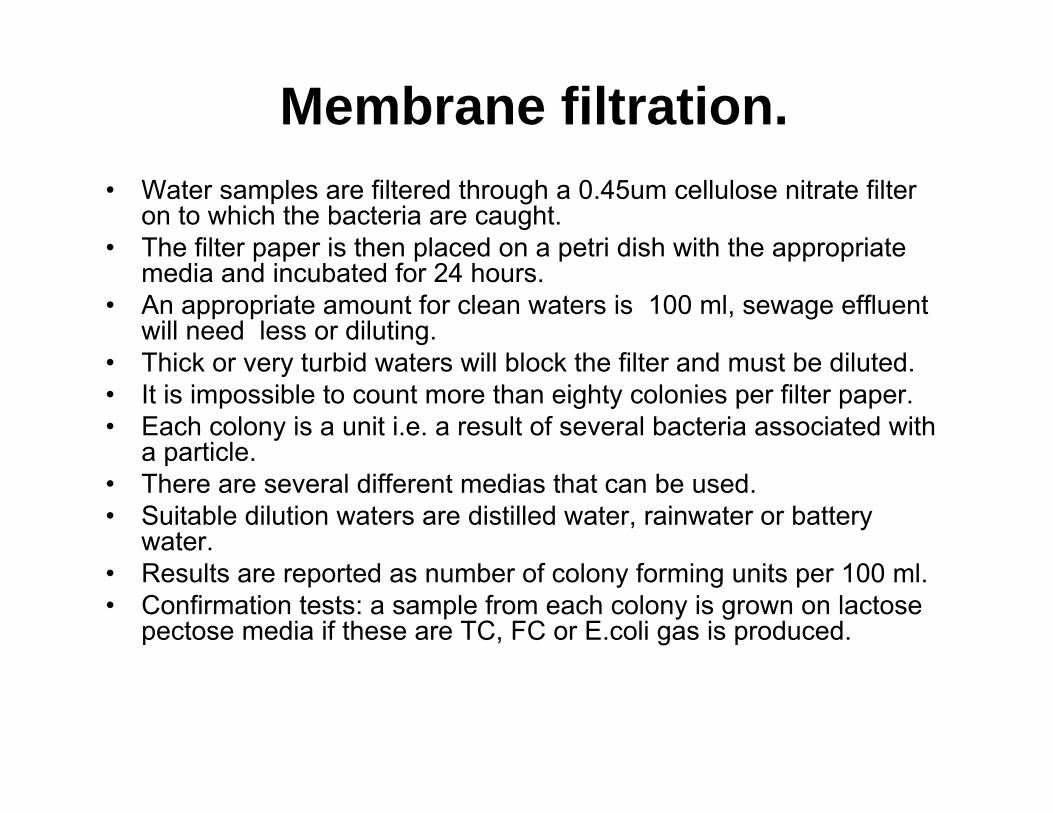
Membrane filtration.• Water samples are filtered through a 0.45um cellulose nitrate filter
on to which the bacteria are caught. • The filter paper is then placed on a petri dish with the appropriate
media and incubated for 24 hours. • An appropriate amount for clean waters is 100 ml, sewage effluent
will need less or diluting. • Thick or very turbid waters will block the filter and must be diluted. • It is impossible to count more than eighty colonies per filter paper. • Each colony is a unit i.e. a result of several bacteria associated with
a particle.• There are several different medias that can be used. • Suitable dilution waters are distilled water, rainwater or battery
water. • Results are reported as number of colony forming units per 100 ml. • Confirmation tests: a sample from each colony is grown on lactose
pectose media if these are TC, FC or E.coli gas is produced.
