water conservation and water demand management - … · water conservation and water demand...
TRANSCRIPT

Water Conservation and Water
Demand Management
Martin Labuschagne
Water Use Efficiency
SARPA
12 JULY 2013
Recognition: WRP and Re Solve
Consulting Engineers

Contents of Presentation
• Definitions
• Why must we conserve water
• Fish to Tsitsikamma study
• EC and National NRW
• Meters
• Leaks
• Shools
• What to do?

WCDM Legal Requirement
• Basically the LAW (WS Act and Water Act) states that in searching and developing new bulk sources, the WSA MUST (not MAY, they MUST) investigate all possible sources, of which WC&DM MUST be one, and then the cheapest source will be the one to develop, and after that the next cheapest etc.
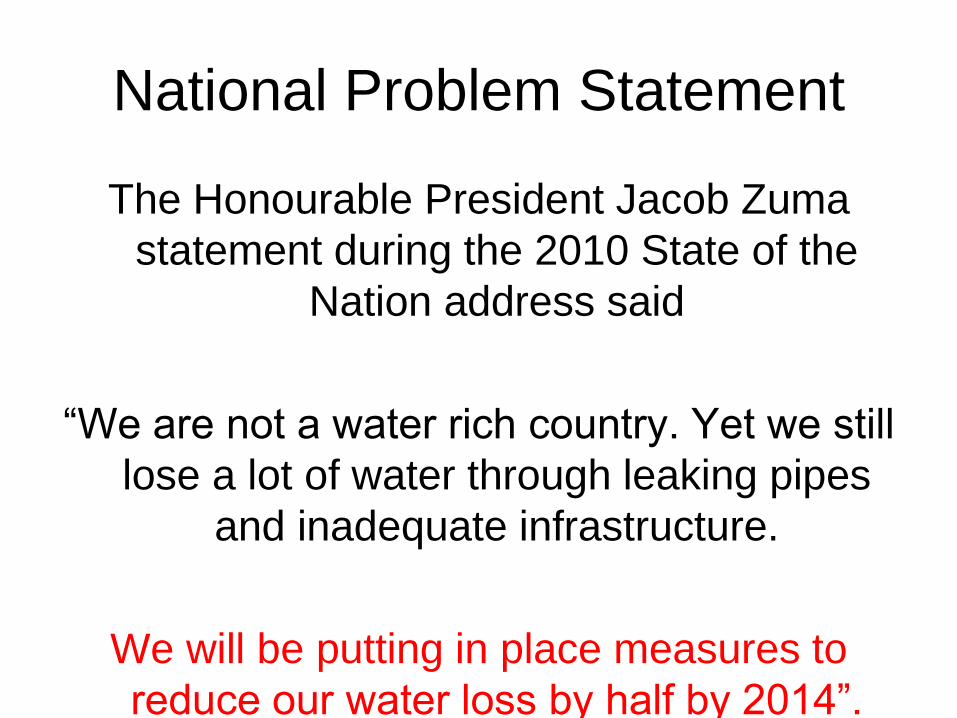
National Problem Statement
The Honourable President Jacob Zuma
statement during the 2010 State of the
Nation address said
“We are not a water rich country. Yet we still
lose a lot of water through leaking pipes
and inadequate infrastructure.
We will be putting in place measures to
reduce our water loss by half by 2014”.

Def: Water Demand
Management • The adaptation and implementation of a
strategy, (policies and initiatives) by water
institutions or consumers to influence the
water demand and usage of water in order
to meet any of the following objectives:
economic efficiency, social development,
social equity, environmental protection,
sustainability of water supply and services
and political stability.

Def: Water Conservation
The minimization of loss or waste, the care and protection
of water resources, and the efficient use of water

Four Pillars: Water Conservation
• Technical Interventions WATER MANAGEMENT SYSTEM, WATER
METER REPLACEMENT PROGRAM, LEAK DETECTION, PRESSURE MANAGEMENT, REPLACE AGEING
INFRASTRUCTURE, RETROFIT PROGRAMS, REMOVAL OF ILLEGAL CONNECTIONS ETC
• Institutional Interventions POLICIES BY-LAWS ETC
• Economical Interventions ACCURATE BILLING, METERING, WATER
AUDITS
• Social Interventions CONSUMER EDUCATION AND AWARENESS

• Water in South Africa is scarce: 65% of SA has less than 500mm/yr Average in world is 800mm/year
• Most of the water in our dams are used by the various water sectors
• Not much water left for development
Why Conserve?

Eastern Cape Strategy

Study Area
16 x Local Municipalities
1 x Metropolitan Municipality
3 x District municipalities

• To make more effective and efficient use of the existing
and available water resources by all water use sectors in
the study area;
• To develop realistic water saving targets for the respective
water use sectors and quantify the impact on current and
future water requirements in the study area;
• To enable the Catchment Management Agency (CMA) and
the Department of Water Affairs (DWA) to “free-up”
additional water, which can be put to beneficial use in the
public interest;
Objectives

• To conserve water and avoid or delay the implementation
of further expensive schemes for transfers and storage
which may not be necessary if water is used efficiently; and
• To provide necessary information to support the
implementation of compulsory licensing and related water
allocation reforms.
Objectives…
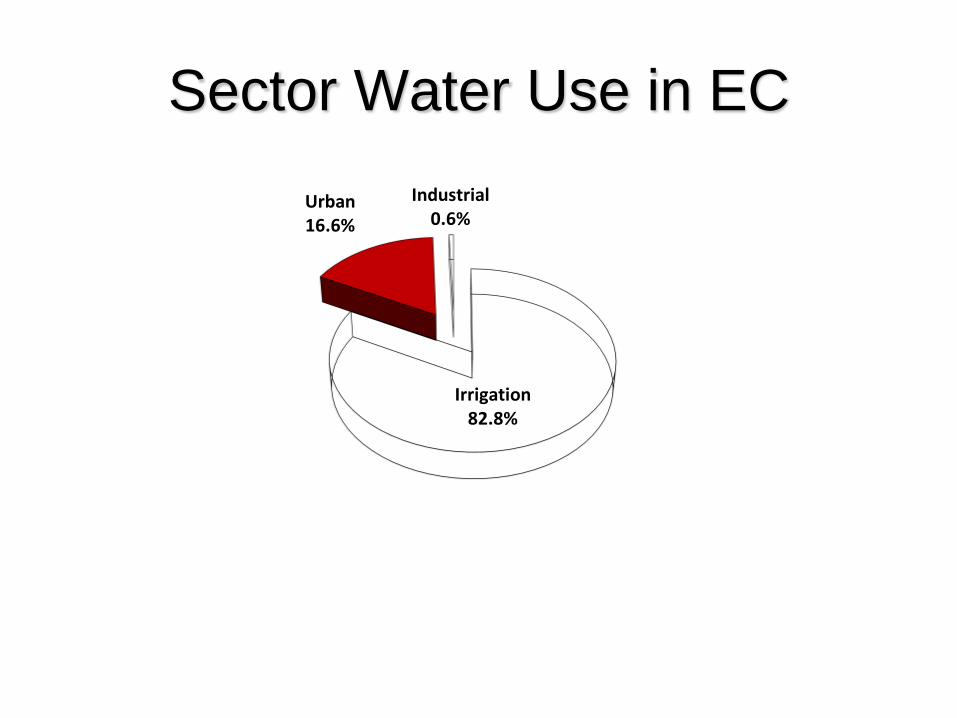
Irrigation82.8%
Urban16.6%
Industrial0.6%
Status Quo ReportSector Water Use in EC

Vision Water Services Act, 108 of 1997
Provide water services in an efficient, affordable, equitable,
economical and sustainable manner to all.
Mission His Excellency JG Zuma, State of the Nation Address 2010
“..reduce our water loss by half by 2014”
Status Quo Strengths, Weaknesses, Opportunities and Treats (SWOT)
analysis of the municipality’s Institutional, Social, Technical,
Financial/Legal framework, Water balance, etc.
Strategy How to achieve the vision and mission using SWOT Analysis.
Defines key What, How, Who, When and Measurement which
need to be achieved if the mission is to be accomplished.
Business Plan Detail of the vision, mission and strategy
Implementation
Monitoring and Review Measurement to ensure goals and legislative
requirements are achieved
Wa
ter A
ffa
irs : S
up
po
rt a
nd
Re
gu
latio
n
Mu
nic
ipa
lity : D
eve
lop
, Im
ple
me
nt, M
on
ito
r a
nd
Up
da
te
Do
Ch
eck
Pla
n
Act
WC
/WD
M S
tra
tegy A
ppro
ach

System
Input
Volume
Authorised
Consumption
Revenue
Water
Non
Revenue
Water
Billed
Authorised
Consumption
Unbilled
Authorised
Consumption
Apparent
Losses
Real
Losses
Water
Losses
Billed Metered Consumption
Unbilled Unmetered Consumption
Unauthorised Consumption
Customer Meter Inaccuracies
Leakage on Transmission and
Distribution Mains
Billed Unmetered Consumption
Unbilled Metered Consumption
Leakage on Service Connections
up to point of Customer Meter
Leakage and Overflows at
Storage Tanks
Free basic
STANDARD IWA WATER
BALANCE

Potential savings
System
Input
Volume
Revenue
Water
Non-
Revenue
Water
System
Input
Volume
Revenue
Water
Non-
Revenue
Water
Revenue
Water
Non-
Revenue
Water Reduced SIV and NRW
Non-
Revenue
Water

Efficiency versus Non-revenue water
System Input Volume
= 400 ℓ/c/d
Revenue
Water
Non-
Revenue
Water
=
40%
System Input Volume
= 40 ℓ/c/d
Revenue
Water
Non-
Revenue
Water
80%
High non-revenue water and
not efficient water use
High non-revenue water but
very efficient water use
Not Acceptable Acceptable

Water Resource Balance
Diagram

Water Loss Indicators Municipalityc
Population
2012
System input
volume
Mℓ/day
System input
volume
million m3/a
Volume NRW
million m3/a % NRW ℓ /c/ d
Camdeboo 51 601 15.1 5.5 1.93 35% 292
Blue Crane 36 798 10.9 3.98 1.43 36% 296
Baviaans 18 476 2.7 0.99 0.37 38% 146
Ikwezi 9 232 1.5 0.55 0.3 55% 162
Kou-kamma 45 124 5.3 1.93 0.6 31% 117
Kouga 88 594 20.3 7.4 3.59 48% 229
Makana 140 120 23.1 8.44 2.28 27% 165
Sunday's River Valley 61 153 10.3 3.76 2.07 55% 168
Ndlambe 59 331 11.8 4.3 1.51 35% 199
Nkonkobe 125 302 12.6 4.6 1.75 38% 101
Ngqushwa 77 709 12.9 4.7 4.32 92% 166
Nxuba 25 087 3.5 1.29 0.77 60% 141
Inxuba Yethemba 60 296 13.3 4.86 1.94 40% 221
Tsolwana 32 819 5.5 2 0.7 35% 167
Inkwanca 20 143 4.1 1.5 0.6 40% 204
Gariep 31 305 10.4 3.8 1.6 42% 333
Nelson Mandela Bay 1 320 610 245.7 89.7 26.92 30% 186
Total 2 203 601 409 149.3 66.06 44% 186

Strategic Overview Category % NRW l/c/d % Performance
Scorecard
Record
Keeping
A Metro’s 34.3 291 84.0 6 of 6 (100%)
B1 Major
Cities 41.3 241 63.6 20 of 21 (95%)
B2 Minor
Cities 30.5 229 65.7 26 of 29 (90%)
B3 Rural
Dense 37.0 164 55.7 55 of 111 (50%)
B4 Rural
Sparce 72.5 65 46.4 25 of 70 (36%)
National 36.8 235 59.2 132 of 237 (56%)

% NRW Distribution / Municipal
Category
0%
10%
20%
30%
40%
50%
60%
70%
80%
90%
100%
Cit
y o
f Cap
e T
ow
n M
etr
oN
els
on
Man
de
la B
ay M
etr
oC
ity
of J
oh
ann
esb
urg
Met
roTl
okw
eG
ova
n M
be
kiG
eo
rge
Cit
y o
f Mat
losa
na
Mu
nic
ipal
ity
Ste
ve T
shw
ete
Ru
ste
nb
urg
Bu
ffal
o C
ity
Po
lokw
ane
Ne
wca
stle
Emal
ahle
ni
Kin
g Sa
bat
a D
alin
dye
boM
oss
el B
ayM
akan
aM
ets
imah
olo
Maf
ike
ng
Ou
dts
ho
orn
No
ken
g Ts
a Ta
em
ane
Mid
vaal
Mo
qh
aka
Kn
ysn
aH
ibis
cus
Co
ast
The
Kw
aDu
kuza
Dih
lab
en
gN
dla
mb
eLe
sed
iC
ape
Agu
lhas
uM
uzi
wab
antu
Tsw
elo
pe
leK
ou
gaK
aro
o H
oo
glan
dA
baq
ulu
siH
ess
eq
ua
Mu
sin
aU
mji
nd
iD
elm
asG
reat
Ke
iB
avia
ans
Siya
the
mb
aM
afu
be
Bre
ed
e R
iver
/Win
ela
nds
Ce
de
rbe
rgG
amag
ara
Nko
nko
be
Bit
ou
Man
tso
pa
Lets
em
eng
eD
um
be
Nam
a K
ho
iK
op
ano
ng
eM
adla
nge
ni
Pix
ley
Ka
Sem
eP
ort
St
Joh
ns
Mb
izan
aM
hlo
ntl
oM
bh
ash
eM
ose
s K
ota
ne
Nd
we
dw
eM
nq
um
aO
khah
lam
ba
Man
de
ni
Map
hu
mu
loN
on
gom
aU
lun
di
% N
on
-re
ven
ue
Wa
ter
National Average = 36.8%
41.3%
30.5%
37.0%
72.5%
34.3%
B1 B2 B3 B4ACategory

International NRW benchmark
Source : The International Benchmarking Network for Water and Sanitation Utilities (IBNET)
0
10
20
30
40
50
60
70
80
90
Au
stra
lia
Ne
w Z
eal
and
Cam
bo
dia
Sin
gap
ore
Nam
ibia
Be
laru
sSe
ych
elle
sG
abo
nP
ola
nd
Nig
er
Sen
ega
lC
zech
Re
pu
blic
Ru
ssia
Tun
isia
Bu
rkin
a Fa
soC
hin
aLa
o P
DR
Be
nin
Mal
iLe
soth
oH
un
gary
Sou
th A
fric
aN
eth
erl
ands
An
tille
sM
exi
coA
rge
nti
na
Cap
e V
erd
eB
oli
via
Slo
vaki
aC
hil
eU
gan
da
Vie
tnam
Eth
iop
iaK
azak
hst
anM
adag
asca
rC
on
go, D
em
. Rep
.M
auri
tan
iaB
angl
ade
shP
akis
tan
Taji
kist
anA
vera
geR
wan
da
Uzb
eki
stan
Lib
eri
aB
razi
lB
uru
nd
iP
anam
aK
en
yaM
old
ova
Pe
ruU
krai
ne
Ge
org
iaP
arag
uay
Ro
man
iaZa
mb
iaG
uin
ea
Gh
ana
Mau
riti
us
Uru
guay
Bu
lgar
iaM
oza
mb
iqu
eTu
rke
yM
ace
do
nia
, FYR
Bo
snia
an
d H
erz
ego
vin
aK
yrgy
z R
ep
ub
licA
lban
iaEc
uad
or
Arm
en
ia
% N
on
Re
ven
ue
Wat
er
RSA Average = 36.8%
World Average 36.2%

WMA Current Water Balance

Potential Savings Municipality
Total licensed yield
million m3/a
System input volume
million m3/a
Target Reduction (15%)
million m3/a
Optimistic Reduction
(20%) million m3/a
Camdeboo 6.32 5.5 0.82 1.1
Blue Crane 3.62 3.98 0.6 0.8
Baviaans 0.71 0.99 0.15 0.2
Ikwezi 1.34 0.55 0.08 0.11
Kou-kamma 1.17 1.93 0.29 0.39
Kouga 7.53 7.4 1.11 1.48
Makana 17.83 8.44 1.27 1.69
Sunday's River Valley 3.45 3.76 0.56 0.75
Ndlambe 3.78 4.3 0.64 0.86
Nkonkobe 4.6 4.6 0.69 0.92
Ngqushwa 11.74 4.7 0.71 0.94
Nxuba 0.99 1.29 0.2 0.26
Inxuba Yethemba 7.3 4.86 0.73 0.98
Tsolwana 2 2 0.3 0.4
Inkwanca 1.5 1.5 0.22 0.3
Gariep 3.8 3.23 0.19 3.23
Nelson Mandela Bay 96.14 89.7 13.45 17.94
Total 173.82 148.73 22.01 32.35

Target water balance

Estimated National NRW
NRW Based on Available Data Sets
Category Population Input (m3/a) NRW (m3/a) % NRW l/c/d
A 17 420 512 1 849 091 117 634 192 022 34.3% 291
B1 7 756 187 683 667 320 282 585 164 41.3% 241
B2 3 882 070 325 623 095 99 407 207 30.5% 230
Urban 29 058 770 2 858 381 532 1 016 184 393 35.6% 269
B3 3 845 279 230 642 568 85 229 869 37.0% 164
B4 4 245 736 101 138 956 73 334 514 72.5% 65
Rural 8 091 015 331 781 524 158 564 384 47.8% 112
National 37 149 785 3 190 163 057 1 174 748 776 36.8% 235
Extrapolated 48 821 707 4 192 465 880 1 543 837 752 36.8% 235

System Input Volume = 4192.466
Water losses = 1334.214
Real Losses = 1067.372 Real Losses = 1067.372
Non-revenue water = 1543.838
Authorised consumption = 2858.251
Apparent losses = 266.843 Apparent losses = 266.843
Revenue water = 2648.628
Unbilled authorised = 209.623
Billed authorised = 2648.628
Unbilled metered = 167.699
Billed unmetered = 105.945
Billed metered = 2542.683
Current National IWA Water Balance Diagram (million m3/annum)

Estimated Cost of NRW
Category Input Rate
(R/kl) Sell Rate
(R/kl) Input Value
(R million) NRW Value
(R million)
A R 5.00 R 10.00 R 9 245.46 R 3 170.96
B1 R 4.50 R 9.00 R 3 076.50 R 1 271.63
B2 R 4.00 R 8.00 R 1 302.49 R 397.63
Urban R 13 624.45 R 4 840.22
B3 R 3.50 R 7.00 R 807.25 R 298.30
B4 R 3.00 R 6.00 R 303.42 R 220.00
Rural R 1 110.67 R 518.31
National R 14 735.12 R 5 358.53
Extrapolated R 19 827.42 R 7 210.38

WMA Consolidated Scorecard

Qualitative Scorecard
(Strengths)
• Positive political support, however training is required
• Formal towns and reasonably formal infrastructure
• Bulk metering in some areas
• Consumers metered and billed in most municipalities
• Policies and bylaws updated
• Positive relationship with consumers
• WSDP’s and IDP’s updated annually
• Visible leaks are reported and fixed
• Active WDM programmes (barefoot plumbers) in some areas
• Telemetry monitoring of the network
Inte
rna
l fa
cto
rs
pe
rso
nn
el, fin
an
ce
, ca
pa
bili
ties
Helpful

Qualitative Scorecard
(Weaknesses)
• High vacancy rate in most municipalities
• Limited or no management information
• Inadequate capacity building and skills transfer
• Lack of vehicles and materials to support O&M
• No monthly monitoring of NRW KPI’s
• Limited pressure management, sectorisation and old water
meters in most areas
• Limited or no electronic job card system to capture and monitor
leak reports
• Limited preventative maintenance in most municipalities
• No mains replacement programmes
• Intermittent supply, especially in informal and rural supply
schemes
• Poor water quality in some areas
Harmful
Inte
rnal fa
cto
rs
pe
rso
nn
el, fin
an
ce
, ca
pa
bili
ties

Helpful
Qualitative Scorecard
(Opportunities)
• WC/WDM Councillor training programme
• Establish NRW steering committee and monthly reporting
• Improve relationship with finance departments and access to
information
• Community education and awareness
• Water tariffs are mostly not cost reflective and must be reviewed
• Utilise positive relationship with communities to improve
metering and cost recovery
• Obtain water loss equipment and utilise to analyse system
losses
• Informative billing
• Review policies and charters to promote WC/WDM
• High level of internal household plumbing leakages
Exte
rnal fa
cto
rs
Le
gis
latio
n, P
ub
lic, P
olit
ics

Qualitative Scorecard (Threats)
• Poor relationships between the technical and finance
departments
• Very old infrastructure in most areas
• Lack of funding - municipalities are grant dependent
• Institutional arrangements / Service level agreements
• Rural water supply schemes difficult to monitor and implement
metering and billing
• High indigent consumer base in most municipalities
• Infrastructure vandalism and illegal connections
• Non payment of services
• Limited water resources in some areas
Exte
rnal fa
cto
rs
Le
gis
latio
n, P
ub
lic, P
olit
ics
Harmful

Common Challenges • High vacancies
• Lack of necessary skills and capacity
• No collaboration between departments
• Limited / no management information
• Non-compliance with legislation and
regulations
• Poor services and customer care
• Lack of community support in certain areas
• Lack understanding of water business
• Metering / billing and cost recovery

6%
16%
37%
38%
3%No records
Poor records
Erratic / worthless records
Records with gaps or questions
Good records no gaps or questions
6 Year Record Keeping
Summary
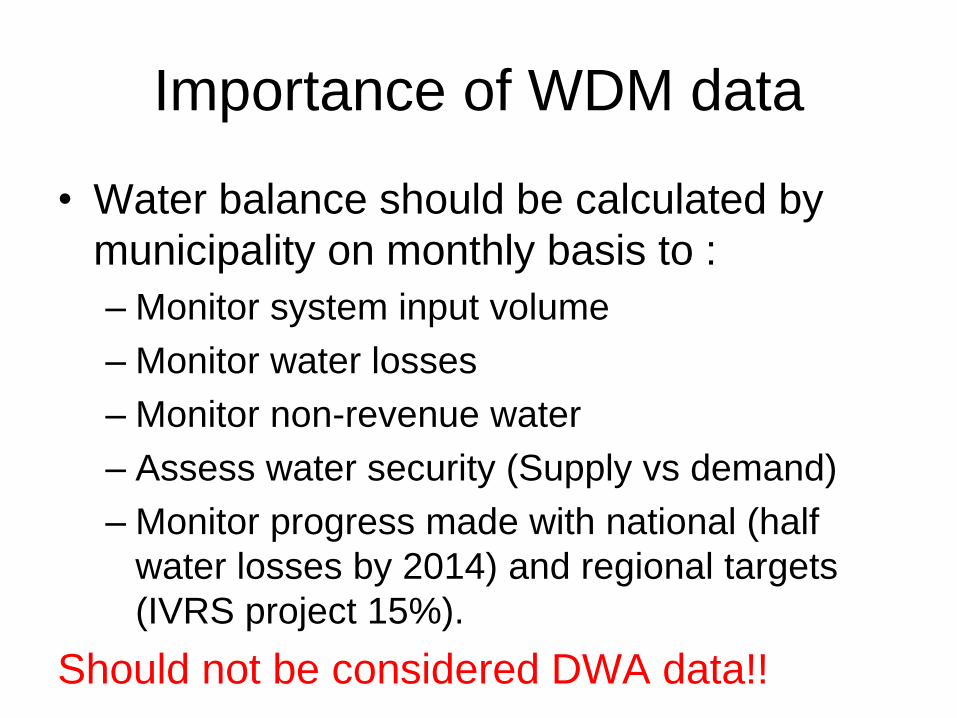
Importance of WDM data
• Water balance should be calculated by
municipality on monthly basis to :
– Monitor system input volume
– Monitor water losses
– Monitor non-revenue water
– Assess water security (Supply vs demand)
– Monitor progress made with national (half
water losses by 2014) and regional targets
(IVRS project 15%).
Should not be considered DWA data!!

Recommendations
• Municipalities must be made aware that
WDM is a strategic issue in a water scarce
country and impacts significantly on water
for growth and development
• Only continuous monitoring, analysis and
feedback will improve results
• Municipalities must take ownership of
WCWDM
• Study provides baseline for future
monitoring

Current and Future Actions (1)
• Study has provided a better understanding
of the NRW situation
• Dir: Water Use Efficiency is working with
DWA regional offices and municipalities on
Water Demand Management to increase
awareness and:
– Train staff on calculation of water balance
– Update / improve available municipal data
• Standardise understanding of NRW and
inclusion of cost recovery

Current and Future Actions (2)
• Educating Stats SA to ensure data quality
improves with future surveys
• The team will be working more closely
with:
– Municipalities
– Stats SA
– Department of Cooperative Governance
– Auditor General
– Regulation

METERING
EXAMPLES FROM
DIFFERENT
MUNICIPALITIES

TO METER IS TO KNOW
TO KNOW IS TO
MANAGE
BULK METERS
ZONE METERS
DOMESTIC METERS

No Meters: No record No Income

No Meters: No Records No income

1989 = 24yrs old


House built
over meters

Meter
Locations

Meter
Vegetation -

Vandalised/
Damaged Meters

Poor/ Damaged
Meter Installations

Poor Meter Installation

Broken Meter
Meter Not Counting

Covered Meters:


BEFORE BEING PUMPED:
FLOODED
32637 2011/07/04 32637 2011/06/01 32637 2011/05/04 32637 2011/03/30 32637 2011/03/02
MUNICIPALITY READINGS
AFTER BEING PUMPED:
ILLEGIBLE
LEAKS
EXAMPLES FROM
DIFFERENT
MUNICIPALITIES

A LEAK IS NOT ONLY A
LOSS OF WATER BUT
ALSO A LOSS OF
INCOME
VISABLE LEAKS
INVISABLE LEAKS

Valve Leak

Reservoir Overflows

REPAIR!!!! Comparison of Flow
19 Oct 2011 24 Sep 2011

Standpipe Leak:
REPAIR!!!!
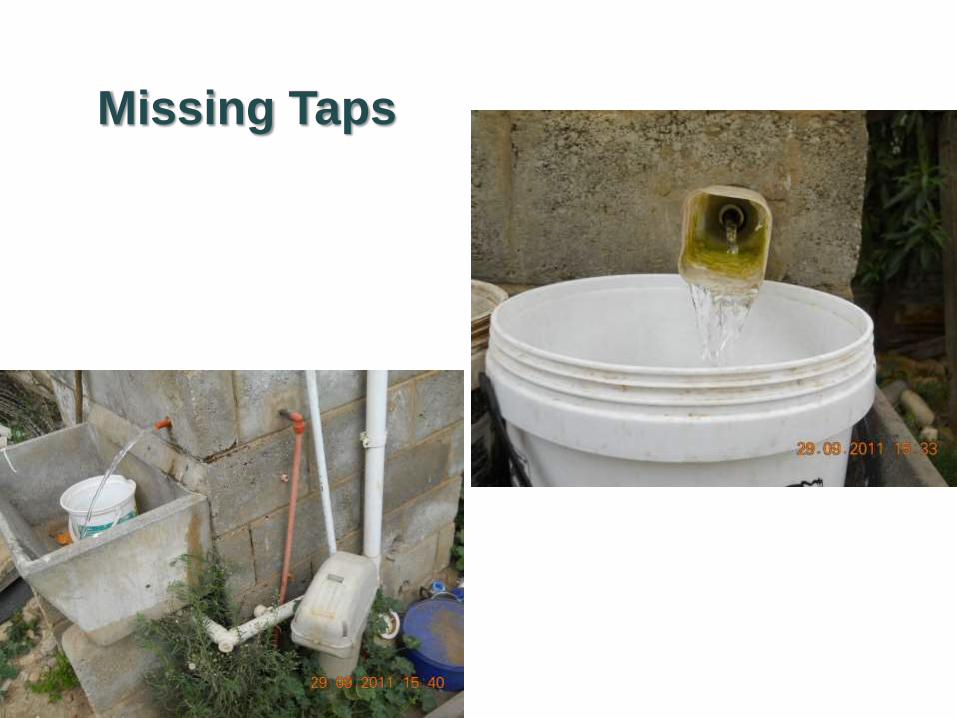
Missing Taps

Leaks on
Properties

Poor installations
Buries consumer meter Wasteful installation

Leaking Toilet
(Faulty Meter)

Infrastructure Leak

Infrastructure Leak
Water Loss
13.1 kl/hr
(3.64l/sec)

Infrastructure Leak

Sewer Overflow
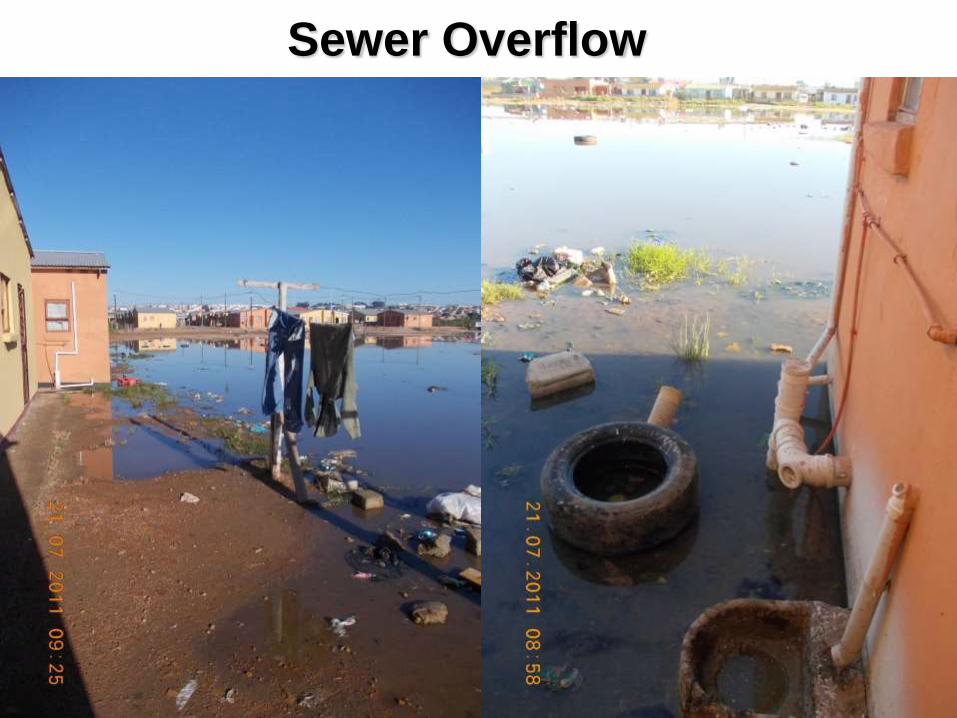
Sewer Overflow

Valves
Field Work

Leak Detection

When others work on your
service

Solar Geyser with missing tubes


SEWER LEAK!!!!!

Effluent Disposal

SCHOOLS
•Wasting almost 10% of
Country’s water


SAVINGS IN AVERAGE
METERED CONSUMPTIONS


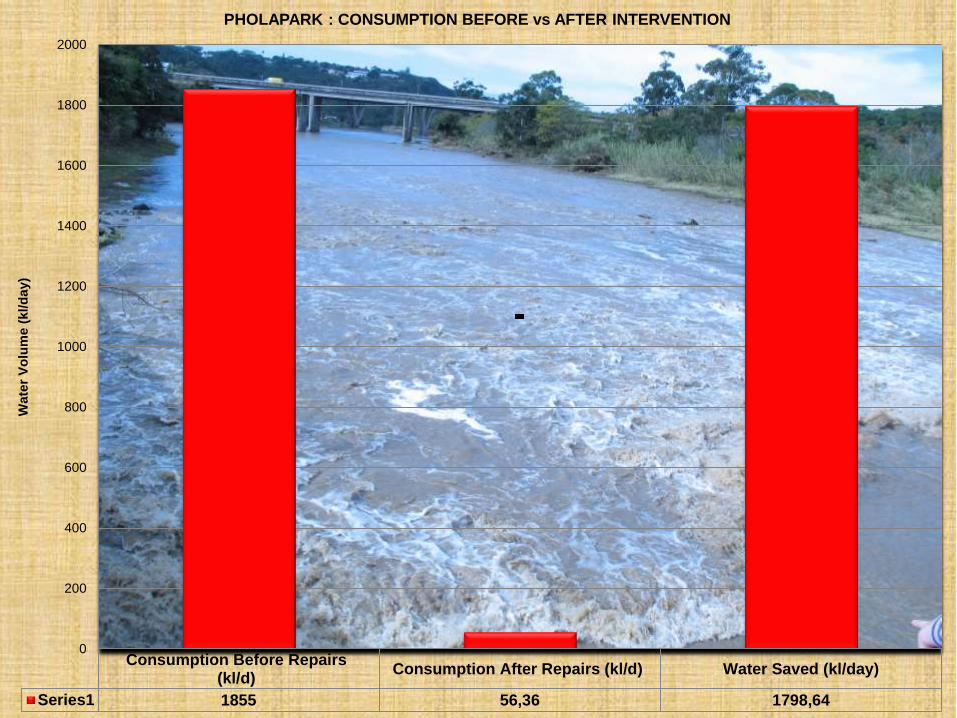
Consumption Before Repairs(kl/d)
Consumption After Repairs (kl/d) Water Saved (kl/day)
Series1 1855 56,36 1798,64
0
200
400
600
800
1000
1200
1400
1600
1800
2000
Wate
r V
olu
me (
kl/d
ay)
PHOLAPARK : CONSUMPTION BEFORE vs AFTER INTERVENTION

COST BENEFIT ANALYSIS
• Interventions beyond the meter were carried out on 170 Indigent properties in Dimbaza (Phola Park) at a cost of R253 400, which is an average of R1 490 per household.
• Actual water savings after intervention is 50 700 kl/month 10 000 JoJo Tanks, which equates to 610 000kl/year 122 000 JoJo tanks. Money savings per year is R3 365 000 based on bulk water tariff of R5.5/kl, which is used for purchasing water from the bulk water services provider.
• The Payback period = 253400/280500
= 0.9 month Less than one month!!!

Domestic Sector
• BCM: • WCDM Project in Dimbasa
• Relocation of Water Mains
• Indigent Plumbing
• Installation of water meters
• Visual leak inspections
• Installation of Bulk Meters
• Community Awareness
• Replacement of leaking standpipes


This was only for the recorded meters (93) they did retrofitting at 700
households – Possible savings 700 000m³ = R3 500 000/annum

•

SOMETHING’S WRONG!!!

And sometimes results may exceed our most optimistic expectations!
IT IS OUR COMMON RESPONSIBILITY

THERE IS NO LIFE WITHOUT WATER
GOD PUT US ON EARTH TO
MANAGE THE EARTH. ARE
WE?
MAKE WC/WDM A WAY OF
LIFE!!