water and sanitation baseline survey - irc · tile water and sanitation baseline survey tools ......
TRANSCRIPT
824 KENY96
-~Cibrarv
IRC InternatIona,<~atnd Sanitation Centre
01: +31 703088980FB~+31 7035 899 64
WATER AND SANITATION BASELiNE SURVEY
NYANZA PROVINCE
-! SUMMARVREPORTBASEDONTHEDISTRICTWATERAND SANITATIOWSURVEYCORDLTCTEDBYTHE
DISTRICT WATER AND SANITATION DEVELOP1~1ENTCO~ITTEES IN NYANZA PROVINCE
COORDINATEDAND EDITED BY
PROGRA1ILifEMONITORINGANDEVALUATiONUWTOFThIERURALDOMESTIC WATERSUPPLYAND£4X11-1T1OV
PROGRAMME 1996
1
824—KE—15085
1I1IIIIIIIIIIIII1III~1

IIIIIII1IIIIIIIIII
£ibrar’i,IAC Interr~tj~,aI’aterand Sanitation CentreTel.: +31 703068980Fax: +31 70 ~ 899 64
Tableof Contents.
PREFACE
ACKNOWLEDGMENTS
EXECUTIVE SUMMARY
CHAPTER 1: INTRODUCTION
CHAPTER2: DEMOGRAPHICPROFILE AN]) HOUSEHOLDCHARACTERISTICS
CHAPTER3: HOUSING, WATER AN]) SANITATION
CHAPTER4: SOCIO-CULTIJRALBELIEFSAND PRACTICES
UBRARYIRC 2P0 Box 93190, 2509 AD THE HAGUE
Tel.: +31 70 30 689 80Fax +31 70 35 899 64
BARCODE:LO

IIIIIIIIIIIIIIIIIII1~1

PREFACE
The District Waterand SanitationBaselineSurveyin NyanzaProvincewas commissionedh1’ tileDistrict Water and Sanitation DevelopmentCommittees(DWSDCs) in Nyanza Province. Tue
DWSDCis a sub committeeof both the District DevelopmentCommittee(DDc,) and the 1)istrictExecutiveCommittee(DEC’). It is responsiblefor coordination and implementationof water (intlsanitation developmentprogrammes.
The Water andSanitationsurveyconductedin NyanzaprovincefromApril to June1996 markstherealization of an important milestonetowardsthe improvementof datafor planning of wafer (1/7(1
sanitation activities. The baselinesurveyitselfwasnecessitatedby the absenceofreliable and tip todatedataat tile district levelwith sufficientlevelsofdissaggregationforfocusedplanning of sectoractivities.
Within theframework of Kenya’sDistrict Focus For Rural DevelopmentStrategy(DFRJ)S,~,theDWSDCbaselinesurvey was designedto makedata on water and sanitation sector available todistrict levelplannersfor the designof appropriatepolicies and strategiesto meetthe waler and
sanitation sectorgoalsandobjectives.
A Householdbasedsamplesurveyprovidedthe mostreliable methodfor generatingdata o” waterandsanitation indicators.A well structuredandplannedsurveyinitially providesthe bestsourceofdata on programme coverage and measuring d~fferentialsin various indicators. There wastherefore,io any other cost effectiveway of generatingdata exceptat householdlevel, within the
sub-location and wit/i focusedin depth interviews with key informants representingdivergentsocio-economicgroups.
The baselinesurveyusedbothquantitativeandqualitativemethodsof investigations.Ofparticularinterest wasthe checklistcomprisingof unstructuredquestionsfor key informantswhichfocusedon the socio-cultural beliefs andpracticesthat hinder or promotepopularparticipation in waterandsanitationprovision.
Tile information madeavailablein this report covershouseholdand demographiccharacteristics,morbiditypatterns,selfhelpgroup activities,waterandsanitation coverage,water collection, waterstorageanduseat thehouseholdlevel,waterpoint quality and reliability, toiletfacilities coverage,maintenanceand use,andsocio-cultural beliefs andpracticesthat relate to water andsanitation.Specificdistrict reportsare availablefor more detailedinformation at the district and divisional
levels.
Tile water and sanitation baselinesurvey tools were developedjointly by the District Water tin dSanitation DevelopmentCommitteesand the Programme Monitoring and Evaluation Unit,perfededandstandardizedby CopertsConsultancyServices.The methodsusedfor report ‘~‘ritingwas participatory in the sensethat the district teamsparticipated in the actual drafting of thevarious chaptersofthe district reports.
The costof the survey wasmetb~theRuralDomesticWaterSupplyandSanitationProgramme’s-Monitoring and Evaluation Unit and the Kisii Catholic Diocese’s Rural Water DevelopmentProgramme. The ProgrammeMonitoring and Evaluation Unit also providedtechnical, logicticalandcoordination supportto the exercise.
3

4
ACKNOWLEDGMENTS
The ProvincialWaterand Sanitationbaselinesurvey report is a summaryof vanousdistrict reportsproduced by multi-sectoralteams The processbeganin 1995 when the Nyamira district surve\ wascompletedas a pilot study Basedon the expenenceof Nyamira, the vanous Distnct Water andSanitationDevelopmentCommitteesassembledin Kisumu in February1996 and agreed on the surveydesign.the implementationmodalitiesandselectedateamfor coordmationof field work.
Sincerethanksareextendedto the followmg Organizationsandindividuals for the roles played in thesurve\
Overall coordination Mr Alfred Okinda Ogwande(Consultant),Mr Alfred Okeyo Adongo and MrMatheusToot of BKH EngmeenngConsultants.
Data collection CBS enumerators,Supervisorsand Distnct Statistical Officers, the Distnct WaterEngineers,the District DevelopmentOfficers~the District Public Health Officers and the DistrictProgrammeOfficers
Data entry’, processingand analysis. Mr. Walter Okello, MargaretNyamuok and Alfred OkindaOgwande
Secretarialservices Miss NaomiWesa,ElizabethOmollo, ZenaAmani andTumu Rajab
Qualitative dataanalysisandreport writing Mrs RoselyneOmollo
Provincial Reportwriting: Walter Owuor andAlfred Okinda
4


EXECUTIVE SIJMMARY
Introduction:
Accessto safedrinking water and a sanitarymeansof wastedisposal are importantdeterminantsofgood health and socio-economicdevelopmentIn recognitionof this fact, the Governmentof Ken\a inthe early l9~Osset a goal of providing universalaccessto safeandpotablewater at asourceless than
one kilometerfrom homein water-nchareasandless than five kilometersaway in water-deficientareasby the \ear2000 Although this targetmay proveelusiveto meet,the provision of safe dnnkiiig \\aterremainsa prionty item in the Government’sdevelopmentagenda The links betweensafe dnuikingwater and adequateenvironmentalsanitationcan hardly be exaggeratedMany policy makers nov.
recognizethe correlationbetweenthe prevalenceof certaindiseasesandpoor environmentalsanitationStudiesshow thatdiarrheoaandotherwater-bornediseasesaiecausedlargely by inadequatesanitation
It is in recognitionof the importanceof water and sanitationthat the District Water and SanitationDevelopmentCommittees(DWSDCs) were createdin all the districts of NyanzaProvince to plan,coordinate, monitor and evaluate the sector activities The DWSDC brings togethergoverruiient
departmentsandnon-governmentalorganizationswho areinvolved m the water sectorThe DWSDC isa technical sub-committeeof both the District Development Coniniittee(DDC) and the DistrictExecutiveCommittee(DEC), underthe coordinationof the District Water Engineer The committee
provides a forum for the participatmgpartners to network, share experiences,review progressofimplementationandshareresourcesin the processof implementation
As a planning and coordination committee, the DWSDC require strong databaseson v~aieraiidsanitationcoverage,socio-economjcfactors influencing the provision of water, differential accessto
safe water by region, the conditionof the existingfacilities and the level of communityinvolvement andparticipation in the provision of water and sanitationfacilities Makmg this dataavailable facilitatesfocusedplanning of the sectoractivities and rnomtonngand evaluationof progressbeing madein thethe achievementofsectorobjectives
The District Waterand Sanitationbaselinesurvey in NyanzaProvincewas thereforean effort b~theDistnct Water and SanitationCommitteesto fill essentialdatagaps by developinga viable databasethat canbe usedto assessthe supplyanddemandfor water andsanitationat the divisional and districtlevelsandform abasisfor resourceallocationandtargetedinterventions The ultimateobjectiveof the
baselinesurveyexercisewas to allow for a participatory approachtowards provision of water andsanitation activities The involvement of beneficiary communities in identifying, implementing andmaiiaging developmentprogrammeswhich addresstheir felt needs, is cntical to the developmentandsustenanceof such progranmiesThis is the essenceof the Distnct Focus for Rural DevelopmentStratei~\
The surve\ ~~asbasedon the Central Bureau of StatisticsNational SampleSurveys and E~aLuatiouProgramme. Phase III (NASSEP III) The master sample frame is based on the population ofenumerationareasm the district Enumerationareasare themselvesbasedon the latest populationcensus.and are updatedfrom time to time to take accountof changestaking place nit the popLilatlonstructureanddistribution The enumerationareasare further divided into clustersof between 100 aiid200 householdsTheywere selectedon the basisof probabilityproportionto size, using populationand
numberof householdsas measuresof size
Besidesa householdbasedquestionnaire,the baseline study useda non-standardizedcheck-list ofquestions which were administered through focus group discussions in locational barazas Thediscussionsfocusedon cultural beliefs and practicesrelevantto the water and sanitationsector An
5

— — — — — — — — — — — — — — — — — — — —

6
additional inventory questionnairewas usedto collect information on existing facilities, their status.ownersl~ipandmanagement
This Provincial report summarizesthe information presentedin various district reports The ilisti ictscoveredin the surveyincludeKuria, Suba,Homa Bay, Migori, Kisli, Siaya, Nyamira and Kisumu
The SurveyResults
DemographicCharacteristics.
The populationdistnbutionrevealsfemaledominancein all the districtsexceptNyamira Sia~a leadswith female to male ratio of 54 45 while Nyamira has a 50 50 ratio This pattern is similar to the
national trend as depictedby the 1989 population censuswith a ratio of 52 48 Householdsarepredominantlyheadedby malesexcept for Siayawith 5 1 3 percentof householdsheadedb\ \‘~omenAveragehouseholdsize vanesfrom 4 2 in Siayato 5 8 in Migori About 60 percentof the populationm all the districts aresingle About one quarterof the populationaremonogamouslymarried
EducationandLiteracy
Kisu leadswith amore literatepopulation(68 7 percent) followed by Kisumu(65 5 percent)and Suba(64 1 percent) Kuna has the lowest percentageof literate population with only 49 8 percent of thepopulationableto readandwrite About halfof the surveyedpopulationm all the districts hadattainedprinitarv education
HouseholdIncome
The surveycollectedinformation on farm and wage incomes Nyamira, Migori and Kisumu emerged
with the highestannualincomesof Kshs 3 1,826, 24,294and20,759respectively Siayaemergedas thepoorestdistrict with an averageannualincomeof Kshs 9,685 However, in all the districts, over threequartersof the populationearnedless thanKshs 2,000perannum
Health Status
Kuria district led with mobidityprevalenceof 39 percentin the two weeksprecedingthe surve\ Homa
Bay, Suba and Siaya followed with 27 percent morbidity prevalencewhile Kusii had the lowestprevalenceratesat 16 percent Fever reportedas malariaaccountedfor half of the reportedsicknesswith vomiting anddiarrheaaccountingfor 15 percent In the eventof sickness,about90 percentof thepopulationsoughtassistancefronit a healthfacility or purchaseddrugs It is notable that 11 percentof
the populationin Migori dud nothingaboutthesickness
housing
Statusof housingin NyanzaProvinceus relatively poor Over 80 percentof the houseshavemud floorsandwalls Kuruarecordedalmostall housesas havingmudfloors or walls In a similar trend. the roofof the main houses are mainly grass thatched Nyamira and Kusii led with iron roofed housesaccountingfor 60 and 41 percentof the housesrespectively Most of the housesareventilated~ ith atleast one window Siaya recordedthe most poorly ventilated houses with 32 percent having nowindows In termsof the numberof rooms in the main house,mosthadtwo roomswith Kusu leading inhouses~vtthover threerooms 76 percent Kuria hadthe largestconcentrationof one roomedhouses29percent
Water andSanitation
6

a a ~ S S S — — 5 ~5Sfl S S

7
Accessto safednnking water and a samtarvmeansof wastedisposal are importantdetemiiiiaiits ofgood healthand socio-econoimcdevelopment Datacollectedon sourcesindicate that on averageoverhalfof the householdshaveaccessto waterfrom unprotectedsourcesduring the wet anddry se~isonsinNvanza Migorv and Subalead with unsafe(unprotected)sourcesaccountingfor 90 percento~~~aterconsumedWateris mainly fetchedwith the help of humanporter in all the districts(over 90 peicent)Distanceto the watersourcevaries betweenthe wet and dry season.Distancesand time takento fetchthe water are longer during the dry seasonthan dunng the wet season. Kuna, Subaand N’~arniraregisteredthe largestpercentagesof personscollectingwaterfrom over 3 Kilometers in both seasonsKisn hadthe bestsupply in both seasonswith over 97 percenthavmgwaterwithin onekilometer KuriaandSubaalso lead iii termsof longerhourstakento fetchwater
In mostof the districts,water is storedin clay pots accountingfor over 60 percentHowever. Kit na andKisii registeredhigher concentrationof plastic bucketsaccountingfor 41 and 30 percentof stoiagefacilities respectively It is tnterestmgto notethat 61, 58 and 50 percentof the householdsin Siava.Suba and Migon respectivelydid not treatthe water in any way even though it was collected fromunsafesources In terms of waterpoint reliability protectedsourcesweremore reliable in the dr~thanin the wet seasonUnprotectedsourceshadthe oppositepicture
Suba andMigon recordedthe lowestpresenceof latrinesor toiletswith only 30 and29 percenthavingsuch facilities respectively Nyamiraand Kisu hadthe highestconcentrationof sanitaryfacilities with98 and 93 percentof the householdshavingthe facilities respectively Siaya,Kuria andHoma13a\ ledwith du-tv samtary facilities However Suba and Kisii had the smelliest facilities with the largestnumberhaving flies Utilization of toilets is more in Siayawith 94 percentof the householdshaving
distinct tracksLeading to the sanitaryfacilities
The districtsto watchor targetare Suba,SiayaandKuna
7

a a ~s a — a — a a a a a a a a S 5—— 5

S
CHAPTER 1: INTRODUCTION
1.1 The Wtiter and Sanitation BaselineSurvey
The Nvanza Province water and sanitationbaselinesurvey was earnedout in all the divisions ofKisumu. Siaya, HomaBay, Suba,Kuna, Kisii andNyarmra districts Rachuonyodistrict ~~ascurvedout of Honia Bay after the survey had been completed Data for Rachuonyo district is thereforeincludedin HomaBay
The surveyfocusedon the waterandsanitationsector The units of analysisincludedthe householdand
demographicfeaturesof the communities,safe water supply accessibLlitv and availabilit~.~\atercollection. use and storage,waterquality and reliability, operationand maintenance,and comniunityorganizationandparticipation,andvillage sanitation
Besidescollecting field data directly from the householdheads,using quantitativequestionnaire.thesurvey also usedqualitative methodsof investigationto solicit for information concerningpeople’sattitudes and behavior towards water and sanitation provision, operation and maintenance Suchmformationprovidethe districtswith vital datafor designingcommunityanimationstrategies
The ultimate objective is to involve the beneficiary communities in identifying, implementing andmanagingdevelopmentprogrammeswhich addresstheir felt needs The attainmentof this objectiverequiresthatGovernmentofficers at thedistrict, divisional andlocationallevelsclearlyunderstandandappreciatethe developmentproblemsof thevarious conimunities in the districts Waterand sanitationis a priority need in any community but given the limited finds available for its development.pnoritizatiou of communitiesin termsof needis quite critical to thesector
1.1.1 Statementof objectives
Since the heginnmg of the 1980’s, the Governmentof Kenya has shown a greatercommitment todecentralizedplanning and implementationof developmentprogrammes This was articulatedwithin
theframeworkof the District Focusfor Rural DevelopmentStrategy~This strategyhas.however beenaffected by lack of district, divisional and community based data for effective planning and
p rogramniing
The first objective of the water and sanitationbaselinesurvey is, therefore, to provide a viabledatabasethat can be usedto assessthe supply and demandfor water and sanitationfacilities at thedivisional level, hence forming a basis for resourceallocation Inevitably, it should lead to betterunderstandingof the distribution of water and sanitationfacilities and empower the DWSDC •s ~vithinfonnationthat is requiredfor participatoryplanningof waterandsanitationactivities
The secondobjective is to provide information required for identification of target communities.whichshould benefitfrom improvedwaterandsanitationfacilities
Thirdly the survey seeks to provide insight on what is happeningto existing water sources andfacilities in termsof operationandmaintenance
The fourth objective is to examine socio-cultural practices that promote and or hindei activecommunityparticipationin waterandsanitationprovision
8

a a 55 S~S~S 5
The baselinedatashould leadto increasedefficiency in the planning, implementationand managementof water and sanitationsectoractivities If repeatedin subsequentyears, it will take on a monitoringrole b~nieasunng changes occurring in socio-economicdevelopmentand health status of thecommunitieswhich havebenefitedfrom improvedwaterandsanitationfacilities
1.1.2 The Survey Instruments and Sampling Procedure.
The survey has been based on the Central Bureau of Statistics’ National Sample Surve’s andEvaluationProgramme,PhaseIII (NASSEPIII) The district reportsprovidea detailedexplanationofthe programmeandits utilization
Five questionnaireshavebeenusedfor collectingdata QuestionnairesI (HouseholdCharacteristics).2(I-lousing. Water and Sanitation)and 3 (Householdincome) were standardquantitativequestionnaireadministeredby the Central Bureauof Statisticsenumeratorsat householdlevel Questionnaire4 \vasan inventory of water resourcesat sub-locationallevel andwas administeredby the assistantchiefs incollaborationwith village elders Questionnaire5 wasqualitativein natureandmeantto solicit peoples
opinions,attitudesandbehavioron vanousaspectsof culturethat relateto waterandsanitation It wasadministeredto key informantsby distnctsurveycoordinatorsatthe locational level
For the quantitative survey, a sufficiently large sample was drawn to cover all the various socio-economicgroupsin eachdistrict Thus,a20%sampleof listedhouseholdswas drawn,coveruig all therural clusters in the districts surveyed The list frames used were for NASSEP III (1990-1995)Selectionof householdswas basedon systematicrandomsampling,which wasrecommendeddue to thepatternof listing
For Qualitative Survey, a few locations from eachof the Divisions were randomly selected The
Questionnairewas admimsteredthroughfocusedgroup discussionsat the Locations This method wasdeemednecessarybecauseit was found to be costeffective,not time consumingandthe cultural beliefsandpracticesatthe locational level were thoughtto be relatively homogeneousIn areaswhere culturalheterogeneitywas expected,this was taken care of by isolating such communitiesand interviewingthem separately
The InventoryQuestionnairefor developedwater facilities wasadministeredin all sub-locationsof the
Districts usingthe AssistantChiefs
9

~S~S
10
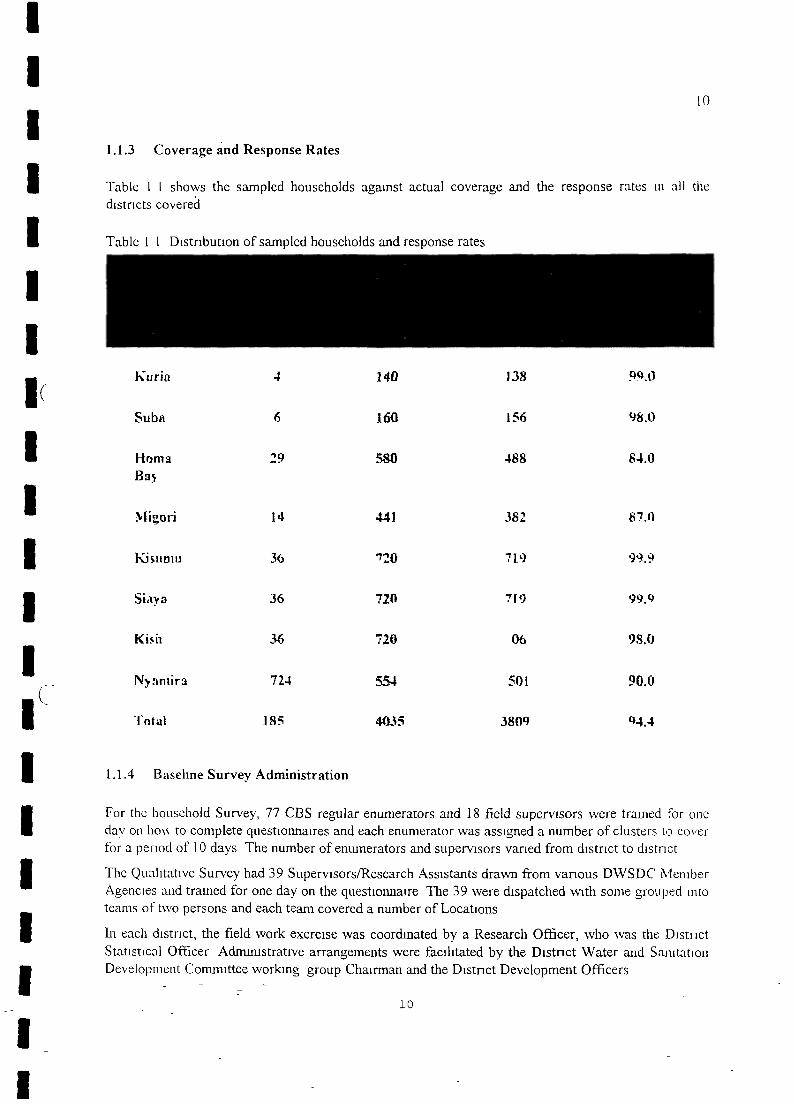
1.1.3 Coverageand ResponseRates
Table 1 1 showsthe sampledhouseholdsagainst actual coverageand the responserates in all thedistrictscovered
Table 1 1 Distributionof sampledhouseholdsandresponserates
Mi~oii 14
Si~~a 36
N’~amira 724
1.1.4 BaselineSurvey Administration
For the householdSurvey,77 CBS regularenumeratorsand 18 field supervisorswere trained for oneday on ho\\ to completequestionnairesandeachenumeratorwasassigneda numberof clustersto cover
for a pei-iod of 10 days The numberof enumeratorsandsupervisorsvariedfrom district to district
The QualitativeSurveyhad39 Supervisors/ResearchAssistantsdrawnfrom vanousDWSDC’ MemberAgenciesandtrained for onedayon the questionnaireThe 39 were dispatchedwith somegroupedintoteamsof two personsandeachteamcoveredanumberof Locations
hi eachdistnct, the field work exercisewas coordinatedby a ResearchOfficer, who was the DistrictStatisticalOfficer Administrative arrangementswere facilitated by the Distnct Water and SanitationDevelopmentCommitteeworking groupChairmanand the District DevelopmentOfficers
Kuria 4 140 138 99•fl
Suba 6 160 156 98.0
Homa 29 580 488 84.0Ba’~
441 382 87.’)
Ki~uniu 3~ 120 719 99.9
720 719 99.9
Ki~h 36 720 06 98.0
554 501 90.0
Total 185 4035 3809
(
10

a a a
II
Data from the Field Enumeratorwas received by the Supervisorsand checkedlscnitinizedandforwardedto the District StatisticalOfficers Editing clerks checkedeveryquestionnaireto ensurethatthe entrieswere madeas requiredbefore they were finally dispatchedto PMEU - Kisumu for furtherprocessing
1.1.5 Conceptsand Definitions
1 1 5 1 Household
In this survey,the householdhas beenusedas the basic unit of inquiry andof analysisof household-baseddata A householdis definedas a personor a group of personsusually (but not always) boundtogetherby ties of kinship, sharing common sourceof food, living within the samecompound (notnecessarilyfenced)or house,andanswerableto the samehead
11 5 2 Headof Household
The headof the householdwas definedas the key decision-makerwhoseauthority is acknowledgedb\’othermembers Identificationof who wasconsideredby otherhouseholdmembersto be the headof the
householdwas of analyticalimportancebecausethe economicstatusof the householdheadis oneof thefactorsthathasbeenusedin this report to classifythe householdsinto varioussocio-econoimcgi oups
115 3 HouseholdCharacteristics
Standarddemographicquestionswereaskedon namesof regularhouseholdmembers,their ages.sex.marital status,economicstatus,and relationshipto the headof the household In addition, questionswere askedon the highestlevel of educationattainedby eachmember,literacy, morbidity tiends. andmembershipof communitydevelopmentgroups
115 4 HouseholdIncome
WIule incomeis akey measureof householdwell-beingits measurementpossesa numberof conceptualandpractical problems An attempthas, however,been madeto capturehouseholdincome accruingfrom two main sources,agricultureandwage(or salary)from employment
1 1 5 5 Housing,WaterandSanitation
The qualit\ of housingandaccessto basicamenitiesare importantdeterminantsof household\\elthreQuestionswere therefore askedto generateinformation that has been used to assessadequac~ofhousingand sanitationbehavior,water accessibility,water collection and use,water reliabilit’... water
quality andoperationandmaintenance
11

a a a a a a a a a

12
1 1 5 6 OperationandMaintenance
Community participationin operationand maintenanceis important for long term sustainahilit~ofwater sources The existenceof ManagementCommittees and the availability Bank Account areindicatorscommunityparticipation
11 5 7 WaterReliability
Water is life and thereforeneededall the times for different uses Reliability of a water source isthereforedefinedby theavailability of water in that sourceall the times andmostof the time w lien thehouseholdsneedit
1 1 5 8 Accessto Toilet Facilities
Accessto toilet facilities is definedby the availability of a form of facility at the homesteador withineasyreachof a householdthat is usedfor the disposalof excreta Respondentswere askedto indicatethe type of toilet availablefor their useandthe materialsusedto constructthem
1 1 5 9 Toilet Facilities MaintenanceandUse
The availability of a toilet facility in ahomesteadis not enoughto determineuse Use of atoilet facilitymay he hamperedby lack of maintenanceleading to offensivesmell, presenceof flies and carelessdisposalof excretaon the floor Toilet facilities were thereforephysically checkedto deterniuietheirmaintenancestatusin additionto checkingfor thepresenceof a distincttrack leadingto the faciht\
1 1 3 10 Social Cultural BeliefsandPractices
Socio-culturalbeliefs and practicescomprisenorms and taboosthat regulate behavioi and .ittitudetowardsprovisionand useof water and sanitationfacilities Thesenorms and taboosmayhave bothpositive andnegativeimplicationson water andsanitation Questionswerethereforeaskedto establishthe impact this has on water usage,water sources,water collection, use and ownershipof latrines.waterstorageandprovision
1.2 The District Water and Sanitation DevelopmentCommittees
The District Water and SanitationDevelopmentCommittees (DWSDC) are technical arms of theDistrict DevelopmentCommittees(DDC) and the District Executive Comnuttees(DEC) The~v.eieformed through the initiative of the Ministry of Land Reclamation,Regional andWaterDevelopmentanda numberof donors andNGOsparticipatingin the water andsanitationsector
lii order to ensureeffective and coordinatedimplementationof Water and Sanitation Progiamnies
undertakenb\ various agenciesm NyanzaProvince, it was felt necessaryto haveatechnicalcommitteeat thedistrict level to overseeandcoordinatewaterandsanitationactivities in theProvince
The DWSDCs wereestablishedin June1992 in all thedistrictsexceptSubawhereit wasestablishedinJune-1996 Their main function was to advisethe_DDCand DEC on appropriatepolicy directions in
12


13
water and sanitation sector within the district The committees are composedof go~emmentdepartmentsand non-governmentalorganizations involved in the implementation of water andsanitationactivities in each district The committeesprovide a forum for all the actors in “~iteiandsanitationsectorthroughwhich to networkandaddressissuesof commoninterest The functioii’~of thecommitteeincludeCO-ordination,policy generation,planningand monitoringandevaluation
To perform the above functions effectively the DWSDC requires basicplanning up to data on: the current water and sanitation needs anddemand desegregated by administrative units, the existing water andsanitation potentials per administrative Unit and the social—culturalbriefs and practices of the community as appertains to water and
sanitation sector development and use by gender and various age—groups
Most of the datarequiredby the DWSDC is not available Thereis thereforea generallack of accurate.up to date data that can be used for focused planning and to form the basis for monitoring andevaluation It is againstthis backgroundthat the presentdistrict water and sanitationbaselinesurveywas commissionedin all the districts in NyanzaProvincewith a view to generatingthe necessari’dataat the districtanddivisional levels
13


14
CHAPTER 2: DEMOGRAPHIC PROFILE AND HOUSEHOLDCHARACTERISTICS
I
2.0 Introduction
The results of the 1989 population censusrecords the population of Kisumu as 664,086 Siaya(639.439).Kisii (747,042),Migon (378,459),HomaBay (468,943),Suba(115,896),Kuria (103.285)and Nvamira (471,461) The intercensalgrowth rate was 3 0% for Kisumu, Siaya (3 1%). Kisii(2 72%). Migori (3 0%), HomaBay (3 0%), Suba(3 0%), Kuria (3 0%), andNyamira(2 72) uith an
averageof 2 92%for Nyanzaprovince
2.1 Demographic Profile
The detailed findingsof the surveyare analyzedanddiscussedin variousdistrict reports The chapteis
below presenta summaryof the findings by district
2.1.1 HouseholdSize
According to the survey results,the averagehouseholdsize in NyanzaProvince rangesbetween4 2personsin Sia~ato 5 8 personsin Migon district A largepercentageof householdshavemore tLian sixpersons
Table2 1 PercentageDistribution Of HouseholdSizesby District
IDiSinc[ Members
Honia Ray 132 108 150 ii 6 i4 0 31 5 46Migon 74 58 76 87 153 553 58ki~umu ii 9 11 8 139 ii i i3 4 339 46Siava 184 i48 i27 149 i20 271 42Kisit 36 95 i05 i29 i24 510 55\‘.amLra 21 4 428 35 5
2.1.2 SexDistribution
The distribution of respondentsby sex is shown in the figure below As shown,women fomi a largerpcicentageof the population in all the districts exceptfor Nyarnira distnctwhere the proportionsarealmostequal
- 14


15
Figure 2.1: PercentageDistribution of Population by Gender
2.1.3 Household Heads
The headshipof a householdis consideredan importantdemographicvanable The sex of the head.her/hiseducationallevel, his/heroccupationand industryhaveeconomicandsocialimplications for thehousehold It is observedthat in rural areaswhere opportunitiesare scarceand, given that mostfemaleshavefew or no skills for high payingoccupations,dependentsof thesefemalehouseholdheadsare more likely to be relatively more depnvedof essentialnecessitiesof life Figure 2 2 shows thedistributionof householdheadsby gender
56rON~Ie IFfliel
54~
St
449950.1
C48
48
44
42
Fbn’n ~y W~godLb
N~janira
15


16
L
Figure 2.2: PercentageDistribution of Household Head By Sex
2,1.4 Marital Status
The mantalstatus of a populationhasdemographicimplications on its fertility rate Table 2 2 showsthat appro’umately60%of the populationin NyauzaProvincearesingle There is a small percentageof widowedpersons(about5 7% in Kisumu) Divorceand separationratesare low in all the districts
Table2.2:District.
Kuria
Suballama flawMigeriKisurnuS aJCLm
Ni. amira
PercentageDistribution of HouseholdMembers Marital Status By
,1~~
61.9
60.457.758.161.7
59.868.2
24.2
27.324.224.724.123.623.2
11.613
11.113.1)7.86.43.8
0.30.6040.30.70.90.7
, I,
4.40.4-7c
5.’9.3
4.1
16


17
2.1.5 Level of Education and Literacy
The surve~was interestedin both the literacy levels of the householdmembersand the educationalattatni-nentof the headof the householdThis was importantbecausethe literacy level of a populationgives a good indication that populations potential for participation in socto-economicdevelopmentLiterac~empowersthosewho possessit to receivea wide body of ideasand often to act positivelytowards the fulfillment of those ideas The rateof acceptanceand adoption programmesaimed atimprovementof healthandsan.itationstatusof the peoplewill largelydependon their educationstatus
The surve\’ results shown in figure 2 3 below reveal that about 60% of the respondentsiii all thedistrictswereableto readandwrite while about30% werenot
A relatedareaof interestwas to find out the educationattammentof thehouseholdmembersTable 2 3revealthat abouta quarterof the householdmembershavegoneto school up to the Primary level whileasimilar proportionhaveno educationatall in all the distncts
EYes
ONo70
60
50
40
30
20
10
0
Figure 2.3: PercentageDistribution of HouseholdLiteracy by district
-J
Nyamira
17


Table 2 3 PercentageDistnbutionof HouseholdMembersby EducationandDistrict
[8
I)tcIri~t None Level or Educmtlon
Std1—4
Std5-8
Form1-2
Form3-4
Form5-6
Univei-sty
Kuria
SubsHonia Ba~\ii~riLhurnuSiivakiss
~ssamira
217
12522632130334727!
171
294
26432 824525 8252168
240
302300362305
31 7334
344
336
282403 7Si
2225
75
200
05
454543
9340
133
4
2r,0 22-10 4
0210
07
Hi0)
00
I) 70100
53
I’-
2.1.5 Economic Status
Table2 4 showshouseholdmembersoccupationalstatus Mostof the householdmembersare ei1gagedin farming activities,with mostof the districtsrecordingover 30% of this occupation Nyanuradistricthas the lowest proportionof householdmembers about 38% in this category,However the ~‘outhfulpopulation impliesthat quite a sizablepercentageof the householdmembersarestudents
Table 2.4: PercentageDistribution of Economic Activity
2.2 Self-Help Activities
2.2.1 Introduction
EconomicActivity
The major aim of self-help groups is to tap the people’scapacity to help themselvesby undertakingprogrammesthat havea direct impacton their welfare Thesein turn improvethe quality of their lives.their capacity to organizethemselvesfor the commongood and their ability to use localI~availableresourcesThe participationof people in self help activities is of cntical importanceto wai:er andsanitationsectorbecausethe self help groupscan form the entry point for encouragingcommunit
participationin the provision andmaintenanceof waterandsanitationfacilities.
District None Student Farmer Reg.WageEarner
CasualEinployee
Business!Trade
Domestic~~orI~
KuiiaSubaHowaBavMigonKisumtiSiavaKisit
N~amira
0 7544432374 70820
0 006440000542.800490
96 566043081159042 7789383
2 119216511591 811079
0 7261022631 83034
0 03231751434 64800
1)1)
32p)0~O~I01)
0’)
18


[9
The surve~resultsshown in figure 2 4 indicate that over 75% of the respondents in all the districtswere not members of any self help group, and only about 25% were members Kisii district had about
19%of the respondents as members of self help groups while Kuna distnct had only about 6 5%
Figure 2.4~ Percentageof Householdsby Self-help Group Membership
Table 2 5 and 2 6, respectively, give the distnbution of self help group types and the predominantactivities the groups undertakeon a regularbasis It is quite evident that most people who join groups.
do so for the purposeof generatingincome The most predominantactivity as shown in table 2 6 issavings and credit followed by farming Apparently thereare very few householdinvolved in \vaterprojectsas the main activity.
Table 2.5: PercentageDistribution of types of Self-Help Groups by District
0% 10% 20% 30% 40% 50% 60% 70% 80% 90% 100%
District Group Types
Nusnber Income Socto- Heaith Otliei-’.
Generation
Kuria 546 378 29 7 29 7 3 0
Subs 560 230 71 i 00 59i-ioma Bas 200 49 4 383 0 0 i2 2?viigori 194 296 574 6 6 64
Kisurnu 60i 702 21 0 2 8 6 0Sia~a 229 584 400 00 I 6Kisti 348 795 i4 0 0 0 6 5Nyanitra 384 98 0 0 0 0 0 0 4
19


Distnct / Activities
FarmingTradlng/H.Crnft Livestock Savings
&Credit
Other
KurtaSubaHomaBavMigunKisumuSiayaKsstt
Nvamira
25058558058821539313270
5561892541695820474
0000003110164000
00465251193432
509577826
19113277136151
244730
2.3 Household Income
This study was primarily a baseline study of the water and sanitationsector. While income data is important to the water and sanitation sector,
particularly with respect to community financing of water and sanitationfacilities, it was not technically feasible to collect detailed income andexpenditure data. The survey therefore mainly collected data on the incomeof the household members based on farm, business and wage/salary Thus thetotal income of the household as per this study is derived from the sumof: -
1. Farm/Business income last month and last year2. Wage/salary income last month and last year
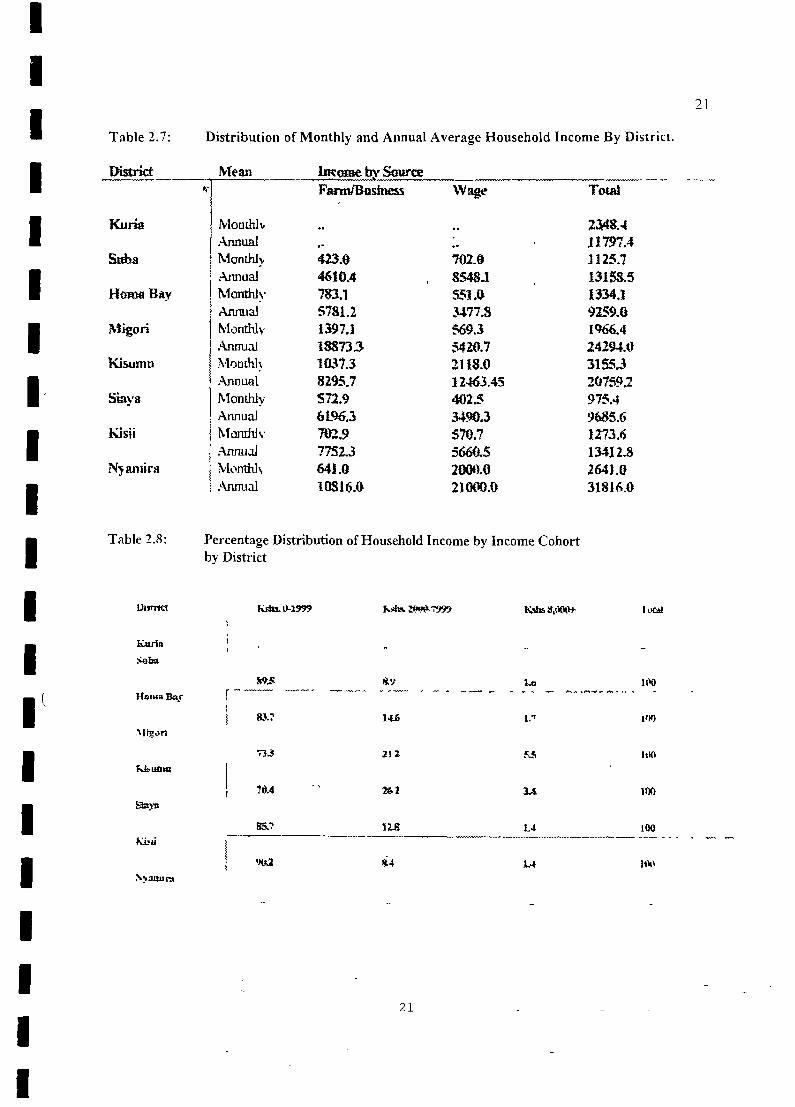
Table 2 7 presentsthis mformation Kisumu distncthas an averagemonthly and annual household
income of Kshs 3,15530 and 20,759 15 respectively Data on income was not collected in Kunadistnct NyamiraandKisti recordedthehighestincomes while Siaya had the lowest
Table 2 8 shows the percentagedistnbution of monthly householdincome by income grouping It isquite clear that threequartersof the householdsin NyanzaProvinceearnmonthly incomeof less thanKshs 2.000 while the rest of the householdseama monthly income of betweenKshs 2000 to 7999Less than2% of the householdearnoverKshs 8,000in all the districtsexceptMigon with 5 5%
I1IIIII
Table 2 6 PercentageDistribution of Self-helpgroup Activities by Distnct
20
20

I
I
21
12.8 L4 iouICi~5ii ---------------—-—---—----—-———--—--—-----—.-——.----——~ ---— - -
Li
‘I.
Table 2.7: Distribution of Monthly and Annual Average Household Income By District.
Mean hivomeby Source
Kuria
Stha
Floma Bay
Migori
Kisumu
Siava
Kisii
Ny aniira
Table 2.8:
FanWBosiness Wage Total
Monihh .. .. 2~4t4Annual ,. :. . J1797.4Monthh 423.0 7010 1125.7Annual 4610.4 , 85483 . 13158.5Monthly 783.1 551.0 13343Annual 5781.2 3477.8 9259.0Monthly 13973 569.3 1966.4Annual 188733 5420.7 24294.0Monthl~ ff137.3 2118.0 3155.3Annual 8295.7 12463.45 20759.2Monthly 572.9 4023 975.4Annual 6196.3 3490.3 9685.6Monthly 7029 570.7 1273.6Annual 77523 5660.5 13412.8Monthls 641.0 200410 2641.0Annual 10816.0 21000.0 31816.0
PercentageDistribution of Household Incomeby Income Cohortby District
LMiniC Rain. tt-i99~ Kits. lt!L*799) K~ts8,000* I oral
Ku ‘In
Soba. . .. -
floi~aBay ISt$ La 100
----..-,--..---
I li.~nI 81? i..’ I’M_i
733 211 53 lila
70.4 Li UK)
21


2.-I WealthStatus
2.4.1 Introduction
This section exarrunesthe general health trend as part of household characteristics in terms ofmorbidit~. the disease pattern and the kind of coping mechanismsat the householdlevel for iiiembers
~~hoare sick The tnformationpresentedin this section include morbidity pattern (this is provided bytwo ~~eeksmorbidity prevalence rates), type of sickness, options at household level for coping ~~ithmorbidity- this is provided by the type of treatment sought in the event of illness or for pre~iitionofdisease
2.4.2 GeneralMorbidity
A two ~~eekmorbidity prevalencewasdeterminedin eachdistrict for all the membersof the householdThe figure belowpresentsa two weekmorbidity of NyanzaProvincein March 1996
Figure 2 5: Distribution of Two Week Morbidity Prevalenceby District
2.4.3 Specific Morbidity
DNot SickISick
Morbidity ratesfor the commonestcausesof illness amongall the agegroupsis presentedin the table2 9 belo~~ Unexplained fever or illness identified as malaria, is the leading cause of morbidit~followed by respiratoryinfectionsand vomiting anddiarrhea related illnesses Thesefigures should beinterpreted with the understanding that they have not beenadjustedfor seasonality
These figures conform to nationalsituationandparticularlyto the 1990 Distnct Household \Velfai-eMonitoring and Evaluation Survey In thatstudy, Malanaaccountedfor mostof morbidity foI1ov~edbyrespiratoryinfections It points to the fact that since 1990, therehavebeenno gainsrecordediii termsof reductionof malaria and respiratorydiseases
Kuna Suba Homa Migon Kisumu Siaya KisilBay
22

a a a a a sa — a a a a a a ‘a a — — a a

a a a a a a — a a a a -~ a a a — a a a S
NiNi
N

I

24
Table 2.9: A two Week PercentageDistribution of Causesof Morbidity by District
District VomitIngJ
Diarr
FeverlMalaria
CoughICold
WoundIinjury
SkinRush
EseIiils,tIOii~
Other
kuna
Suba
1-iomaE~as\[igor,
KisurnuSia~a
Kisit
Nyarrura
5 0
144
[21
IS I
124
87
117
93
551
677
467502
444484
454
477
195
89
106
152
174
199
300
290
3 5
0067
21
IS
45
33
00
38
0044
55
30
16
04
00
4
7’2~
2 I’3(i27I 2
(‘(I
71
35162
199
7942
49
144
2.4.4 Options for Treatment
The factors which determinechoiceof treatmentincludeawarenessof the existenceof suchtreatment.attitudesgoverning causesof the illness, appropriatenessof treatmentfor the illness, psycho-socialinfluencesuchas opinion of peoplein thecommunity,educationalstatus,religion andtraditional beliefsand practicesand the perceivedseventyof the illness Optionsfor treatment amongthose~~ho~~ere
sick during the studyperiodarepresentedin table2 10
The main copingmechanismsrecordedweredecisionto takethe sick to ahealth facility, purchaseanduse of drugs and consultationwith a traditional medicine man/woman It is quite noticeablethatmajorit\ of thosewho fell ill either went to hospital or puichaseddrugs, a good indication that thehealthniessagesspreadby CommunityHealthWorkershavemadean impactto the communities
Table 2.10:District
PercentageDistribution of Action Taken by the householdas a result of illness by
District Took toHealthFacility
PurchasedDrugs
UsedTraditionalMedicine
ConsultedTraditionalSIedicine
Man
ConsultedFaithHealer
KurriSubs1-lonia ElasKIaririKisumu
S~iyi
KissY~amira
419
50940 8
452
450
~4
446492
466
41046 3380
422
513
426
405
17
003 2
59
49
45
3728
07
00
26
00
09
15
2800
((3
UU
I 4
~
US(U)
(3
(U)
~,
ui~~,
~o~
24

a a~ — — a a a

25
CHAPTER 3: “HOUSING, WATER AND SANITATION
3.0 Introduction
This chapter is basedon information on housingstatus,water availability, accessibility and quality.
operationandmaintenancestatus,and reliability On sanitation,respondentsgave information on t\peof toilet facilities, their maintenancestatusand interviewers verified the information by physicallycheckingon thefacility status
3.1 Housing
Housing is a basicneed It does not only provide shelter, but also social security A good houseismeasurednotjust by the quality ofthe materialsusedin its constructionOther importantconditIons for
agood houseincludesanitationof the environmentandavailability of amenitieslike water, lighting, andsecurity
For the purposesof this survey, the following information was soughtfrom the housing conditionsmaterials used in constructingthe house,numberof rooms in main house,numberof windows andnumberof peoplesleepingin mainhouse
3.1.1 Type of Main House
Table 3 1 shows details of the type of main houseby district In general most of the houses in theprovinceare constructedof mud walls,mudfloors andgrassthatchedroofs A numberhavecorrugatediron sheetroofs Tins indicateslow quality housingit termsof materialsusedfor construction
Table 3 2 below indicatesthat in Nyanza,majority of main houseshave2 or 3+ windows The tablefurther revealsthatabouthalfof the householdshave2 roomsin the main house
25


26
Table 3.1 PercentageDistribution of type of Main House by District
npearwAii Type of Floor TvpeofRoof
Kuria
Suba
Worn! Cement Mud Cement Others [nut Grass! Othe- Sheet Mahut r
109 tO 0.43 97.9 11.7 1.4 26.8 10.1 2.!
7.7 IlL!
lioma Ba~
Miori
92.5 0.0 7.4 87,7 12.2
92.2 0.0 7.2 88.9 10.9
‘Lu 39.3 611.3 0.3
0.0 36.3 t~u.2 2.4)
Kisbmu 81.3 ‘3,1’ 18.7 73,3 21.7 52.3 47,4) aj,7
Si aya
Kisü
Nyam! ta
0.0 12.9
82.7 4.2 13.3
84.9 5.1 0.0 4L0 59.u IL!)
8~ 7.9 2.2 GILt) 39.7 0.3
3.1.2 HouseCarrying Capacity
One way of looking at the quality of housingis to examinethe extentof crowding andthe ventilationsituation In this studycrowdingwas measuredby determiningthe numberof roomsin eachhouseandthe numberof peoplewho sleepin them Ventilation was measuredby thenumberof windows in eachroom OF ifl thehouse
Table3 2 presentsdataon the distributionof roomsandwindowsin the mainhouseby district
Table3.2: PercentageDistribution of Windows andRoomsin Main Houseby District
District
KuñaSatinllamaB;IyMigori
Kistuno
SiayaKisiiNyamira
3*
11.62o.4
37.Q
31.830.519.8
76.0
Distrie
OIL! 9.9 D.0 29.9 69.6 0.5
Numberof Windows - Number ofRocm,~‘0 1 2 3* .1 2OS) 20.5 34.2 24.7 29.3 39.!16.8 32.7 21.5 23.0 17.8 55.816.9 14.5 30.S 38.1 16.9 46.!18.8 22.7 29.7 28.8 16.5 50.116.7 13.6 30,7 33.9 17.5 52.032.0 18.4 22.0 27.8 35.7 43.0[.8 12.3 322 59.0 3.7 20.6
26

— — — — — — — l_ — — — — — —

27
3.2 Water Sup~ly
3.2.0 Introduction
Water is essentialto life and health It is requiredin considerablequantitiesfor drinking. v~ashing.cooking and personalhygiene Despiteits importance,water is not alwaysavailablein quantities andqualitiesrequiredyet the needfor it is suchthat peopletendto useanywaterthat is readily availabletothem. whether it is polluted or not Access to water is an miportant determinantof health Pollutedwaters when used for dnnking and bathing andcleamng, constituteone of the pnncipalmodes forinfection by diseasesFor any meamngflulgains to be realizedin improvementof health statusof thepeopleat householdlevel and thusenhancethe generalproductivityof the population,measuresmustbe taken to ensurethat people haveaccessto safewater The sourceof water should as much aspossiblesupplya quantityof safewaterthat is adequatefor the needsof the community
In this study safewater is definedas water that is not harmful to the user The results of the watersupplysituationarepresentedaccordingto five different levels of supplyconditions
Section 3 2 1 analysesthe water supply situation in Nyariza Province taking into accountall watersources used during wet and dry seasons The discussiondistinguishes between protected andunprotectedsourcesof water.
In section 3 2 2, the vanous modesused for watercollection are described,includmg the distince towatersourcesfrom the householdandthe timetakento andfrom the watersource
Section 3 2 3 describesthe methodsused to store waterat the householdlevel and the major usesofwater
Section3 2 4 looks atthe quality of drinking waterat the householdandthe vanoustreatmentoptionsusedb~thehouseholdsto improveon waterquality beforeuse
In Section 3 2 5, Waterpoint reliability is discussedin terms of availability of water at all times orotherv~i se
3.2.1 Accessto Water
Access to safe drinking waterdependspartly on the availability andpartly on the distribution of the\~ateri esources In Nyanzaprovince, the water table is generallyquite high in most of the areas.making it relatively easierfor ground waterexploitation This survey investigatedthe water ourcesusedb\ peopleboth during wet and dry seasonsTable 3 3 shows~iccessto safewater during the ~vetseason
NvanzaProvince lies alongthe LakeVictoria andsurroundsthe Kavirondogulf The main sourcesofwater in the provinceare Lake Victoria, Rivers Nyando, Miriu, Awach, Kuja and other numeiousstreams Despitethe presenceof thesenvers in the province,water still remains a much sought after
commodity’ The causesof waterproblemsin Nyanzainclude’
i) Long dry spellsbetweenthe longandshort rainsduring whichseasonalrivers dry up
ii) Lack of fundsto develop water points in areaswherethesearemostneeded
The abovenamednversservea sizablepopulationin the province Howeverit hasbeenestablishedthatthe culture of the cornmumtiesin the province,particularly the Luos, their beliefs and practiceshave
27

— — — — — — — — — — ,— — — — — ‘— — — —

II
28
adverscl\affected the equitableprovision of water in the province Thesebeliefs are mainl~rela[cd[ towateruseand watercollection
Rivers, lakes, unprotectedspringsand wells, dams andpondsarenormally consideredas the ~ouice ofunsafewater As canbe seenin the table below, mostof the householdsderive their water ironi iiiisat~sources
On a~erage.the rivers, wells andspringsare the mostprevalentsourceof watercateringfoi suppliesiii
mostof thedistricts
Table 33: PercentageDistribution of Main Water SourceBy Seasonand District Last ‘~ear(1995)
}k.~It~i~i~
\1i.~r,
3.2.2 ~VaterCollection and Distanceto Water Source
:‘r~1n: 7,f.d
4~. ~ ‘~%
~ L~i
lit) ,~sk ~
.4~ ~I .‘).
£~ ~dH
~3i “I
1k~t “~ ~2.’
-j ~t “J’
4,1 ~.J S,~’
t.~ ,_~1
36 iii
i’~1 l,~ ~
Water collection hascustomanlybeenthe domain of women In the division of labour. men cliii not
associate themselves ~vith this daily routine task The survey sought to find out the mode of
transpoitation from the sourceto the household,the distancesinvolved in fetchingwater from the mainsource to thehousehold andtimetakento fetchwater
Table 3 4 gives the distribution of different methodsused to fetch water by district The o~crah1situation indicate that most of the respondentsuse human porters as their dominant mode oftransportingwater from the sourceto the household Bicycles, vehiclesand domesticanimals aie notcommonl~used
I try
Pr~d 5cwe~. I ~i’ge~ted ~i.ti~
~I~1i ~ ~,. P~ i~f i.#t~I ~i~I i ~isii4’t
IT~tfr W~’r CDtthm~tis
&9 .15 1~ .~t) 2* !‘‘ &~. 14
4f) 15 ~ L~..t ~ Li
(‘#1 1’ ~ - 12,7 ~.i. L5,.z ~ I
i~u ‘~ i.4 .i~9
tl.3 LI (i_i i~ ?ii3 i1 L5U 14~.i
.1~ Uo ~l t3. i~ L~’~ 144 i52
~iij 3~ ~ it.tt 11$ ~ ~ L~J
‘Lt 44 ~,5 ~t7 ~4 J’ 4~.2, “.5
Is. ~ ‘,.i ~‘i1 )i -~I 312 7~.
ii~ 117 •‘L i~5 ~
~tl 72.5 iJ., 3~ ~ !12 ~
~t, 2.5 ~ ,ti r.1 3Z~ I4t~ 3l’~
,‘, .arnh’~,
V.,’ 3t&’i 1,9 ~‘fl ~. 5,~ ., ii :‘~ ‘‘
T5-~ .3~. u’J tiA 3.~ 2.1 U” I~4 Oil ii’~ 45’..,
-‘“t - ~ (‘~ i~ 4$ 4~ - M4 ,,“ ti, ii ~3’ .1’
i’trr ~92i (17 2.~. 3.’t Ii .777 ~t: ii: U~’ ~‘.
28


Table 3.5: PercentageDistribution of DistanceDuring Wet and Dry by District
to main water Source from the Household
Distancein KilometresDistrict <1 1 - 2 3 - 4 5+
Wet Dry Wet Dry Wet Dry Wet Dry
Kuria 64.1 31.0 35.2 41.5 0.7 24.6 0.0 2.8Suba 47.6 34.9 36.1 36.6 16.3 26.6 0.0 1.9Homa Bay 80.8 47.5 17.8 35.5 1.4 12.3 .. 4.7Migori 80.7 51.8 17.8 32.4 1.3 11.0 0.3 4.8Kisumu 93.6 73.6 6.3 21.6 0.1 4.9 0.0 0.1Siaya 87.6 65.7 12.0 25.7 0.4 8.5 .. 0.1Kisii 98.8 97.4 1.0 2.4 0.2 0.2 0.0 0.0Nyamira 43.5 42.8 .. .. 27.8 27.9 28.7 29.3
Table 3 4 PercentageDistributionof Methodsusedto FetchWaterby District
29
Disirict , Method Used To Fetch Water
Human Hand Bicycle Vehicle DomesticPorter Cart/W.
BarrowAnimal
Kuiin 950 21 29 00Suha 957 00 00 00HoinaBay 93 0 11 1 4 04Migon 971 10 05 05Kisumu 95 4 2 6 0 8 0 6Siava 91 7 11 1 7 0 1Kisu 961 06 01 00Nvanura
Oneof the main interestsof the studywas to knowthe distanceshouseholdstravel to fetch water bothduring the rainy and dry seasonsTable 3 5 reveals that distancestraveled increasedduring the dryseason
Table 3 6 gives the distribution of time taken to fetch water from the main water source to thehouseholdby district
I) I)3641I) I)06
18
29


30
Table 3.6: PercentageDistribution of Time Taken to Fetch Water in hours by DistrictTime taken to fetch
District , <lhr 1 - 2 hrs 3 - 4 hrs 5+ hrs
Wet Dry Wet Dry Wet Dry Wet Dry
Kuria 35.9 23.2 49.3 32.4 14.8 43.0 0.0 0.0Suba 58.1 20.3 26.9 56.4 16.1 15.2 0.0 8.1HornaBay 83.0 46.0 15.9 34.8 1.1 16.3 0.0 2.7Migori 80.0 61.1 17.0 20.6 2.4 14.7 0.6 3.6
Kisumii 85.1 62.0 14.3 33.0 0.4 5.0 0.2 0.3Siaya 88.3 64.2 10.0 25.0 1.6 9.6 0.1 2.4Kisii 94.6 90.5 5.1 9.2 0.2 0.2 0.0 0.0Nyamira 70.9 61.1 29.1 38.9 .. .. .. 0.0
3.2.3 Water Storageand Use
Waterstoragein the householdis quite importantaspectof waterquality Watercanbesafeand cleanfrom the sourcebut if it is not properly and hygienically stored it looses its safety The type ofcontainerusedfor storageis thereforeimportantfor mamtainmgquality of waterprovidedthe containeris also kept clean Plastic Bucketsand Clay Potsare relatively safer than other containerslike metalDn.ims for storageof water becausethey are rust free
As shown in table 3 7, the containerthat is most commonlyusedfor storingwater in the houseis theclay pot
Horna Bat,
Mi gun
Sia~a 12 7
Kisii
Nvaniira
~) S
The surve~furtherattemptedto establishthe variouswayswater is used once it reachesthe house It
was establishedthat almostall the water is usedfor washing,cookinganddrinking Bathing. livestockwatering and otherusesaccountedfor lessthan2% of the usesin all the districts
3.2.4 Quahtyof Drinking Water and Water Treatment Methods
Table 3.7:District
Percentage Distribution of Methods used to Store water at Household level by
Suba 58 3
7;
1 .t-’
~5 2
‘4
Kisunia
9 0 Iii
902
oQ U
6t~O
2117
(is
ii 0
R ij
0~i
o ~i
00
00
0 2I) I,
I oill_i
00
ii U
30


31
Earlier it hadbeenmentionedthat water is essentialto good health and thereforelife The qualit> ofwater accessibleto most householdsare from unprotectedsourceswhich are polluted An> fonii oftreatmentfor water that improvesquality before use is of vital importancefor maintenanceof goodhealth
31

32
Reliability Protected SourcesSpri Wells Bore Piped Roof Province Lakeng Hole Water Water Pond
Allthetinie 889 630 468 278
Unprotected SouicesSpring Wells RiversProvince
Mosttimes 111 120 290 495 00 20.3 750 465 140 246 40.0
NoteReliable
00 250 242 227 400 22.4 71 47 116 152 9.7
Table 3 6b showswaterpoint reliability by sourceduring wetseason
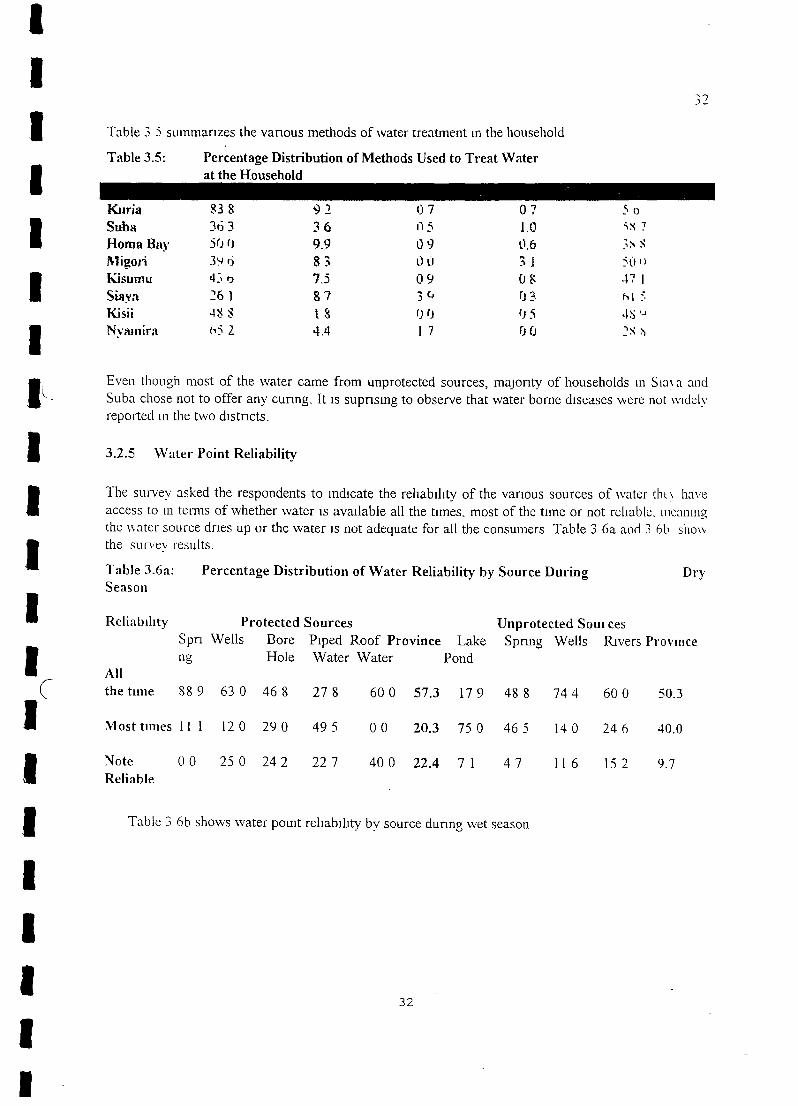
Table 3 5 summarizesthe various methodsof watertreatmentin the household
Table3.5: PercentageDistribution of MethodsUsed to Treat Waterat the Household
Kiiria 838 92 07 07 SnSt 363 36 05 1,0 S~7Homa Ba~’ 50 0 9.9 0 9 0,6 3~S
Migori 39’i 83 00 31 50°Kisumu 4,o 7.5 09 08 471Siaya 261 87 3C~ 03 h1
Kisii 488 18 00 05 45’~
Nyainira (“5 2 4,4 17 00 2i~,~
Even though mostof the water camefrom unprotectedsources,majority of householdsin Sin>a andSubachosenot to offer anycuring. It is suprisingto observethatwaterbornediseaseswerenot wideR’reportedin the two districts.
3.2.5 Water Point Reliability
The surveyaskedthe respondentsto indicate the reliability of the various sourcesof \vatertht> haveaccessto in termsof whetherwater is availableall the ttmes, mostof thetime or not reliable. nieaningthe watersourcedriesup or the wateris not adequatefor all the consumersTable 3 6aand 3 6h shov~the survey results
Table 3.6a: PercentageDistribution of Water Reliability by SourceDuring DrySeason
600 57.3 179 488 744 600 50.3
32

— — — ‘— — — — — — — — ‘— — ‘— — — — — — —

Table 3.6b: PercentageDistribution Water Reliability by SourceDuring Wet Season
Reliability Protected Sources Unprotected SourcesSpri Wells Bore Piped Roof Province Lake Spring Wells Rivers Provinceng Hole Water Water Pond
Allthe time 87 5 43 6 56 8
Most times 0 0 33 3 36 4 47 4
Not 12 5 23 1 6 8 19 2 43 0 21.0 19 5 3 7 23 1 23 1 [2.8
Reliable
As can be seenfrom the two table, protectedsourcesare more reliable during the dry seasonthanduring the wet seasonThepicturefor the unprotectedsourcesis the opposite
3.3 Sanitation
In Kenya, the most widespread form of water contamination results fromdisease—bearing human waste. This waste pose great health risks for people
who are compelled to drink and wash in untreated water In Nyanza Province,the major difficulty in providing adequate sanitation is in flood—proneareas High water levels makes it expensive for household to construct pitsand prevent pit latrines from providing a solution: pit latrines are in
fact health hazards in flooded areas since their contents soon mix up withwater used for drinking and for other household purposes. In some cases,communities have constructed pit latrines, not for convenience and use, hutto satisfy the local adnanistrative authorities. Consequently, manylatrines frequently fall into disuse.
3.3.1 Accessto Toilet Facilities
In order to find out the proportion of the householdswith accessto sanitary facilities, the surve> soughtto know the typesof toilets owned by householdby district (figure 3 2) The majority of the householdsin Nvanzause!atrmesandtoiletsexceptfor Suba,HomaBayandMigori
I 33 3 8 7 46.0 19 5 63 0 43 6 43 6
483 33.1 61 0 333 33 3 33 3
54.0
33.4
33


Figure 3.1: PercentageDistribution of Toilet Facilities By Type andDistrict
3 3.2 Toilet Facilities Maintenance
The surveysought to establishthe level of maintenanceof the toilet facilities Interviewersph~sicall~
checked the exact maintenance statusof the facility in terms of conditionof the wall, floor and roof andalsocheckingfor the presenceor absenceof flies, imtatmgsmell anddisposalof humanwaste on thefloor The maintenancestatusof the latrineswas important for this survey becauseit is a measureofthe level of householdssanitationawarenessas well the valueattachedthe latrine Tables3 7 and 3 $showthe maintenancestatusof thelatrinesSmell andflies in alatrine is an importantmeasureof the level of utilization andmaintenance
Table 3.7: PercentageDistribution of Toilet Facilities MaintenanceStatus by District
Nsamira
34
[ULatrineIloilet 0 None
Suba Homa Bay Migori
KurliSuhafl.in
1a Hay
Ki ~U LA U
SLiyaKisit
63.838 663 3~2.Ii4’. 864 6
13.845~423.222.6I’Lc21K27.6
3.4
0049
18
007.6
17.216.0Ic21 710011.616 6
17(I.’)II
00
30.60.0‘.3
34

— — — — — — — — — — — — — — — —
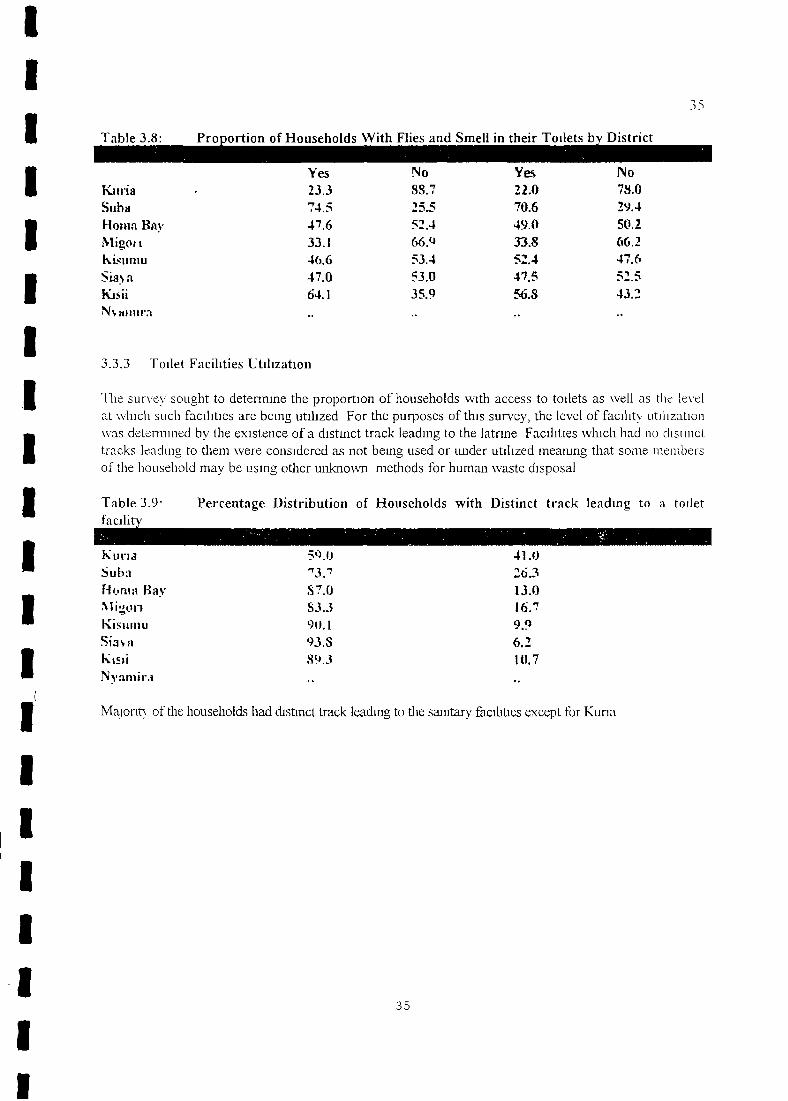
Table 3.8: Proportion of HouseholdsWith Flies and Smell in their Toilets by District
Yes23.3
No
74.5
~es
47.633.146.647.0
22.070.649.033.~~2.441~5
5a.S64.1
No7S.029.4511.2(i(~.2
47.(~
43.2
Kiiria . 88.7
Suha 25.5l-lomri Ra~ 52.4Migou
l~.isiimu 53.4Si~sa 53.0Ki~ii 35.9N~siiiira
3.3.3 Toilet Facilities Utilization
The survey sought to determinethe proportion of householdswith accessto toilets as well as the levelat whichsuch facilities arebeingutilized For the purposesof thissurvey, the level of facilit\ utilization
wasdeterminedby the existenceof a distinct trackleadingto the latrine Facilitieswhich hadno chisinct
tracks leading to them were consideredasnot being usedor wider utilized meawngthat sonic membersof thehoLiseholdmay be using otherunknown methodsfor humanwastedisposal
Table 3.9~ Percentage Distribution of Households with Distinct track leading to a toiletfacility
Kurpa 5Q.Ij 41.0Suha 26.3Hiinia Hay 87.0 13.0~lii-i 83.3 l6.~Kisii,nu L~ul 9.9.Sia~a 93.S 6.21~isii 89.3 10.7Nsarnira
Majorip of the householdshaddistinct trackleadingto thesanitaryfacilities exceptfor Kuria
35

— — — — — — — — — — — — — — — — — — — — —

CHAPTER 4: SOCIO-CULTURAL BELIEFS AND PRACTICES
4.1 Introduction
This chapter is basedon information analyzedfrom the focus group discussions The focus gioupmembersincluded leadersof womengroups,teachers,retired civil servants,village elders. chiefs andtheir assistants, councillors andpolitical party headersTheissuesdiscussedcanbroadly be categorized
as follows traditionalbeliefs and practicesrelatingto waterand sanitation,beliefs and practicesthathinder/promoteprovisionofwaterandsanitation,genderroles in provision.collectionand useoF wateraiid environmentalfactorsaffectingwater resources
Tradit~ona1beliefs andpracticesconstitutesome of the broad basic factors that havea beaiing onhealth status of a community Often thesefactors lag behind changes in the econoniicstructuie of asocien and affect the delivery of services Becauseof the fact that some of thesebeliefs are cleephvrooted, mostof the culturesare in transitionandthis explainswhy “modern” and“traditional ~ a~s ofliving often coexist
Waterhas invariably beenreferredto as asourceof life in many communitiesall overthe worhcl [t isindeeda commoditywithout which virtually no life canbe sustained Most of the diseases which affect
peoplein Tropical Africa are water related Deterioratinghealthstandardsare mainly attributed to lackof safedrinking water in mostof theaffectedareas
Among the Luo communityfor example,water is usedfor cleansingfor instancewhena new bah\ wasborn. the first bathwasconsideredto be an act of cleansmgWatei was considered blessed or sanctified
and so it v~asthe one commodity which did not needpurification
It wasseenas a sign of life \Vhile in transit from the river watercould never be given to somebod~todrink before it reachedits destination Mothers werenot allowedto bathewith watei from the son’s
house It was also taboo to use drinking water for bathing - water was stored in diffeient pots forcooking anddrinking
4.2 Customary Beliefs aiid practices relating to Water Collection
Watercollection was predominantlydoneby women andyoung girls Men were not allowed to carr~’water bLit in extreme caseswhere this had to happen, they would carry it on the shoulderor with bothhands but never on the head Onewas not allowed to sing while carrying water or to pass hirougli
somebod\‘5 homesteadon the way from the river This was because,it was fearedthat one could tnpand fall tInts breakingthe water pot which was a sign of bad omen There was restriction in \\ ater
collection in that widows who hadnotundergoneall the rites were not allowedto collect waterfi om theriver
With regard to constructionofwaterfacilities, a son wasnotallowedto constructa well in his
,tcther homesteadWomenwerenotallowed to own or constructwaterfacilities It wasbelievedthcu this work was a communaleffort and everyonewas expectedto participate .4nv~,icnbarc/user/ to participate in the constructionwasnotallowedto usethatwaterfacility,
36

37
4.3 Sanitation
Sanitationas coveredin this surveyincludedthe following latrine and toilet facilities, bathroom.cattlesheds,utensil racks,clearingof bushesand overgrown grass in and aroundthe homesteadand generalcleanlinessof the home
With regard to toilets, therewas mainly a restriction relating to sharing of the facility It was not
allowed for a father to share a toilet with his daughters, sons. anddaughtersin-law A son ui-law on avisit to his wife’s homewas not allowedto usea latnnewithm the homesteadas it wastaboo for a sonin law to be nakedin his father rn-law’s home
Children useof latrineswas not restricted,dependingon their ages They coulduse any latrine at theirconvenience hut they were mostly assistedor usedbushesto relieve themselves This was howevermerck a precautionto guardagainstthe possibility of them falling into the latrinepits
As concerns the disposalof children’s waste, the Luos believedthat children were a blessingandconsequently.the physicalpresenceof their wastein the homesteadwasa sign of abundant blessing In
the ver~old days, a Luo man’s wealth was measuredby the number of cattle, wives and childrenChildren’swastewas thereforeleft deliberatelyscatteredwithin the homesteadas it was believedthat
only a well fed child could produce wastematter This practicewas howeversupersededb~anotherbelief that one could use a child’s waste to bewitch the child The waste was therefore carefull’vdisposedof to avoidthis Children’s wastewasto be disposedof eitherin the latrine or by bun ing it
underthe soil It was never thrown in the compositepit for fear that it could be burnt along with therestof the rubbish - this burmngwasbelievedto causestoniachache
Therewerealso somebeliefs andpractices amongthe Luos in regardto the locationof latrines It was
a belief that answering the call of nature was something requiring privacy and so latrines wereconstructedin hidden places Most peopleinterviewedbelievedthat the best location for a latnne was
jLiSt outsidethe gate Thiswas to solve the issueof visiting rn-laws The wind directionwas also to beconsidered to prevent the foul smell occasionallyemitted from latrinesfrom spreadingto the houSes
4.4 Outdated Beliefs and Practices
The abovecases prove to us that the Luo community in particular, in their day to da\ life is acoinniunity governedby their cultural beliefs Someof thesebeliefs haveprovedvery useful to thecomrnunut\ especially in the division of labour which is a very important factor ui enhancingcomrnunit~participation Sonic of them arehoweveroutdatedandcouldbedoneaway with
Chief among the beliefs and practicesconsideredoutdatedby the Luo Community is the restrictioii ofwater collectionto women This was stronglyobjectedto by the womenwho felt that they weue ovei -
worked whereas men have been turned mto passive bystanders Most of the household choresundertakenby women are water related This meansthat above everythingelse the woman has to
ensurean adequatesupplyof waterin the housebeforeanywork can begin
The barring ofwidowswho havenotundergoneall the rites ofmourningfrom collecting wcii’er 1.5
vet anotherunrealisticbeliefwhichis bothbaselessandunrealistic
The belief that children’s waste could only be disposed of in the morning this implies that
children’s waste generated at night was to be kept overnight This practice is highly unhygieiiic and
37

38
can ~en easilycausediseasesThe carelessleavingof children’swastein the compoundas a signof wealth is a majorhealthhazard
The ideathat water is blessedandsanctifiedhas misledniany communitiesin this areato disregard
safety measuresregardiiigwater e g boiling. This is becausethey believe that what us sanctifiedcannotcausedeathor disease
Sonic peoplewithin the communityfelt very stronglyabouttheseoutdatedbeliefs and went further
to give recommendationson how thesepracticescanbe eliminated
It is also importantto note that the revision of genderroles cannotbe achievedovernight It us along processthat can only be achievedover time with patience It wasthereforesuggestedthat thegovernmentshoulddoubleits efforts to ensure“adequatewater supplyfor all by the year2000’
On theotherhand,peopleshouldbesensitizedon the importanceof genderrolesequality
4.5 Division of Labour
As in all other spheres of work in the communitytherewas division of labour along geuiderlines inregardto theprovisionandmanagementof water facilities eventhoughthesewereat timesdhisregardledl
they were clearly outlined
Among the Luo commumty, men played a very important role in provision of water facilities Theymake decision on where various water points were to be constructed They also do the actualconstnictuonof thesewater points theseincluded constructingwells both protectedand unprotectedGiven that iii most of thesecommumtiesmen are the sole bread winner, they also financedi waterprojects by assisting m the purchase of pipesandothermaterialsneeded
Even thoughmost men havebuilt housesusing iron sheetsfor roofing as a water provision measure.this has not beenachieved This is mainlybecauseof the unreliability of rain in Nyanza This meansthat roof catchment as awatersourceis still very iuireliably andthereforelargely insignificant
Wonien havenot beenleft behind either They assistin some light duties during the construction ofthesewater points The niost significantcontributionmadeby womenin the provisionof water facilitieshas however been through wonien groups Many women groups have through various Non-
governmentalOrganizationsdealingwith water beenableto constructprotectedwells A good evzuiipleus Kit Mikayi Womengroup in SemeEastlocation who haveconstructeda protectedboreholewith thehelp of Kenya WaterandHealthOrganization(KWAHO)
Provisionand managementof sanitationfacilities is yet anotherareathat has not escapedthe divisionof genderroles This is another area in which men did much more than women Most of the sanitationfacilities wereconstructedby men Generally,men constructedlatrines, cattlebonias, bathrooms.dishracks and evendrainagearoundthe home They ensured that bushesaroundthe homewere cleared.
dug compostPits for dumpingrubbishanddug up the soil for smeanngthe latrines
Women mostly did the finishing work e g smearing toilets and others They also maintainedthesefacilities by ensuring they were well cleaned
In comparison to water the sanitation sector is the one in which men participated fully Thereare only
a few cultural beliefs that have hindered the attainment of perfectsamtationstandards An e’aniple isthe belief that womenshouldnot constructa cattlebomaor fencethehome or evenfinance/supervisethe two In the current situations where rural - urban migration seems to dominate, women havevirtuahl~becomethe householdheads- at leastfor a good part of the year This meansthat if these
facilities are lackmg u-i the home-thewoman’shandsare tied Among the respondentsinterviewed,
36

— — — — — — — — — — — — — — — — — — —

39
women j-iau’ticuLarly’ felt that someof these roles should be reviewedwith particular cmphi’~usondecision uiiakiiig
The issueof provisionof water doesnotendwith theconstructionof the facility Mostwater poiuitsarelocatedfar from the homesteadsThis meansthat beforethe watercan be usedwithin thehousehold it
had to he collectedandstored while awaiting its use It is therefore vitally importantto e\amunethevarious modesof water collectionandstorageas well as the varioussafetymeasurestakeui to ensurethat the waterwhich is usedat the householdlevel is safe
4.6 Gender Roles in Water Collection
The suuivev established that the major modes of water collection are hun-ian porter - iiiostl\ wouiieui.bicycles. hauid carts,wheelbarrow’sanddonkeys
In niost of theplaceswomenstill formed80% of the humanportermentionedabove In sonic places it
was however establishedthat water collection has been commercializedandto sonie extent ruien arenow urn olved Note however that the men involved do it purely as a commercialactivit~anti iii mostcasesthiswater is soldto thosestaying in the local tradingcenters
This point to only onedirection: the women’sworkloadus still the sameif not greater This us becausethe distances to thewater pointsaregreatandthe time takenalso correspondsto the distancecoveredIn somecases,women haveto carry the family washingof clothesandutensilsto the river to wash-i Inextremecasesshe evenhadto drive the animals along the river to enableher saveall the wateu thatshe finally brings back to be used strictly for cooking and drinking In most casesthis us a vicarimpossibletask particularly in the weedmg,harvestingandplantingseasonwhen shestartsherdla\ by
going to the shamba
Lack of co-operation from the men even where an alternativemethod is available is a factor thatseriously worsens the situation for the already overivorked woman This is unainlv an attitude jju’obleuiiandone w inch definitely needsto be addressedIt is time men stoppedwaiting for ti-ic finished pioductand participatedin the processof providing food for the family for indeed thereis no food without
water
It is worth noting that thereweie many coniplaintsaboutthesestoragefacilities particuularh fiom thewon’uen they saudthat someof thesecontainerswere no longer as durable as they used to hi in the
olden days The sizes are small and should be enlargedto hold more water There were alsocomplaintsaboutthe pricesfor examplethat onejerrycancostsroughly 100 00
Therehavebeenconcreteefforts to improve the qualityof waterwith a view to making it safer To thusend. lie coiiimumtiesrecommendedthe following measuresto be takenin the collectionand storageof
water
While fetchingwater especially from the lake or rivers, one should moveas far off as possiblefromthe lake shore or river bank to ensurethat the filthy water from the shallow edgesis not t’etchedEnsurethat the containerusedfor fetchingwateris clean
Boiled water shouldbe filtered usinga cleanwhite cotton cloth which should be used strictly For thispurposeonly
The enumeratedprecautionsare howevernot being observedor practicedat householdlevels because
of various factors In somecases,it is sheerlazinessthat preventswomenfrom boiling drinking wateror adheringto the other safetymeasuresmentioned Some womenare howevergenuinelyoverworked
39


40
and thereforedo not havetime to carry out thosefiner details Thereis lack of fuel for boiling waterSomepeoplewerealso found to lack awarenesson the importanceof suchpractices
In their discussionsthe peopleexpressedtheir concernin convincing people to improve water qualityThe suggestedawarenesscampaignsto educatepeopleon the importanceof safe water and the highrisksof using unsafewater
They suggestedthe useof community basedworkers (Nyamrerwa)as possiblemeansof impleuiieiitingthe above They continue to pleadwith the governmentto avail safe water to major poiiits to theconimuni tv
Farniingus ouie of the main activities thataffect water resourcesin thisareaA piomunenti-iced in this area Thesechemicalsposeagreat dangerespeciallyduring the long iauuiswhenti-ic floods washthesameinto the rivers
The threesugar cane factories in Kisumu district Miwani, Muhoroni and Chemelil au-id the Agrochemical and food companyindustry in Muhoroni, are major causesof concernwherepollution in the
district us concernedThesecompaniesdo nothavewastetreatmentworks They thereforeemit effluentinto the threerivers thusmaking the waterimpossibleto useespeciallyat certaintimesof ti-ic \eai
Indeedthe residentssay therearesomeseasonswhenthe water from NyandoandOruba rivers turn soblackthat aquaticlife in the river dies andeventhevegetationaroundthe river driesup
The pcreuinial flooding of river Nyandohasalso brought its shareof environmental woesto the waterresouu’cesThus river floods mostly aroundthe nionths of March andApril andwhen it doesburst itsbanks.ti-ic flood spreadsas far as 10 kilometersalong the banksespeciallyu flat areas TI-ic water bed
in son-ic partsof Nyandoand Miwani are so close andas suchthey are usually able to sink severalboreholesduring dry spells The only problemcomesdurmg ti’ie flood whenall theseunprotected\\ellscavein while theprotectedone accumulateso much-i silt thatsome haveto be abandonedfor son-ic tune
Hunian activity in the form of charcoalburning and othersrelated to cutting down of tuees has alsoaffected water resourcesThere are some indigenoustrees such-i as ‘~Ng’oro”and “Ogongo chuma’
\vhicli attractwaterbutunfortunatelyalso makeverygood high quality charcoal Thesetreeshavebeencut down thuscausing very many water reservesto dry up
The planing of exotic trees such as Eucalyptus,which are renownedfor drying up water has alsocausedsonic springsto dry up Most residentsattributedthis factor to lack of proper inforniatioui aboutthe disadvantagesof the saidtrees
The aboveproblemsare indeedseriousand needvery urgentsolutions if the peopleof Kisuriiu districtaie to haveauiv hopesof having their water resourcesrestoredand conserved- theseare issuestheyhave indeeddiscussedin someof their Barazasand other leadersmeetings They had the followingrecomniendations
Tue go~emmentthroughthe local administrationshouldban charcoalburning as aneconomicactivityThis will reducethe fehlmg of trees More indigenoustreesshould be planted aroundwater sourceswhereasexotic treesshouldbe plantedvery far from water sources
The issue of the industriespolluting the rivers shouldbe looked into The chiefs in the areas couicerncdsaid they had discussedthis issueat the Locational Sub District DevelopmentCommitteeand hadforwarded this to the DDC but hadbeensnubbed- Residentsof North EastKano who were the worstaffectedsaid they were in a dilemmaof this asthe samefactoriessustainedthen-i financially go~en thatmost of them are sugarcane farmers They howeverfeel a solution of sonic sort should be found
beforean epidemicbrokeout.
40