washington state institute for - wsipp. 13-01-3401r). olympia: washington state institute for public...
TRANSCRIPT

January 2013
BRIGHT FUTURES GUIDELINES AND WASHINGTON STATE MEDICAL ASSISTANCE PROGRAMS, REVISED
1
Washington State Institute for Public Policy
110 Fifth Avenue SE, Suite 214 • P.O. Box 40999 • Olympia, WA 98504-0999 • (360) 586-2677 • FAX (360) 586-2793 • www.wsipp.wa.gov
Suggested citation: Bauer, J. (2013). Bright Futures Guidelines and Washington State Medical Assistance Programs (Document No. 13-01-3401r). Olympia: Washington State Institute for Public Policy.
The 2012 Legislature directed the Washington State Institute for Public Policy (Institute) to assess the costs and benefits of implementing the American Academy of Pediatrics’ Bright Futures Guidelines regarding the well-child visit schedule and universal screening for autism and developmental conditions.1 To implement Bright Futures Guidelines, Washington State medical assistance programs would have to pay for:
well-child visits at age 30 months,
annual instead of biennial visits for children over age 6,
developmental screens at 9, 18 and 24-30 months, and
autism screens at 18 and 24 months.
Current regulations give state Medicaid programs discretion regarding coverage of these benefits. Private health plans established after March 2010 are required to comply with Bright Futures.2 Coverage is not mandated for grandfathered private plans or state Medicaid programs.3 States are free to choose whether to comply with the guidelines or not, and this report attempts to inform that choice. The report is organized in three parts.
Part I: Well-Child Visit Schedule
Part II: Autism and Developmental Screening
Part III: Early Intervention and Special Education
1 HB 2127 § 606 (14), Laws of 2012
2 The requirement comes from Section 2713 of the Affordable Care
Act (ACA), in conjunction with the adoption of Bright Futures as the standard for preventive services by the Health Resources and Services Administration (HRSA). 3 The ACA does require that Medicaid cover preventive services
with an A or B rating from the US Preventive Task Force.
Summary
The 2012 Legislature directed the Institute to assess the costs and benefits of implementing Bright Futures Guidelines for (a) well-child visits and (b) developmental screening in medical assistance programs. Currently, federal regulations require non-grandfathered private health plans to comply with Bright Futures, but state Medicaid programs can choose whether to implement the guidelines or not.
Well-Child Visits. To implement the guidelines, we
estimate that Washington Medicaid would need to provide additional well-child visits at an estimated cost of $8 to $10 million per year. The state’s share is roughly half this total.
In addition to these direct visit costs, well-child visits identify care needs. Following a visit, utilization of dental, vision, behavioral health and developmental services increase significantly. In the first six weeks after well visits, average spending rises by an additional $70 per child. Some of these short-term costs will be offset by long-term savings; however, the degree to which long-term benefits might exceed costs is not known.
To assess possible downstream benefits, we reviewed the research literature. Unfortunately, no rigorous studies examine whether additional visits are associated with improved health outcomes or cost savings. The lack of evidence does not mean that additional visits are ineffective—there are simply no studies at the present time to calculate benefits and costs.
Developmental Screening. Providing the Bright Futures
recommended developmental and autism screens would cost Washington Medicaid an estimated $940,000 per year. The state’s share would be $470,000.
Autism and developmental delays impose substantial burdens on children and their families. We reviewed the literature and found a number of studies suggesting that screening is feasible, promotes earlier diagnosis, and increases referral rates to early intervention. We also reviewed studies that found that some early interventions are effective. The long-range benefits may exceed the costs but, unfortunately, the existing research literature is insufficiently developed to allow us to compute return-on-investment calculations for screening.
2
PART I: WELL-CHILD VISIT SCHEDULE
If the state chooses to implement Bright Futures Guidelines, Washington medical assistance programs would need to pay for up to ten additional well-child visits per client. The Washington Chapter of the American Academy of Pediatrics, however, emphasizes expanding the schedule to include eight visits: one at 30 months and annual visits after age 6. This analysis focuses on the implications of adding these eight visits.
Exhibit 1 Well-Child Visit Schedule
Age Washington
Medicaid Bright
Futures
Birth-11 months 5 visits 6 visits
12-24 months 3 visits 4 visits
30 months No visit 1 visit
3-6 years Annual visits Annual visits
7-20 years Biennial visits Annual visits Source: WSIPP analysis
In this section, we estimate the likely numbers of additional visits using current take-up rates (i.e., the percentages of children receiving visits at specified ages). The direct costs of providing these visits and the potential costs of additional follow-up services are assessed. Well-visit schedules in other state Medicaid programs are also examined. Finally, we review the evidence regarding how increasing the frequency of visits affects health outcomes.
WELL-VISIT TAKE-UP RATES AND ADDITIONAL
VISITS
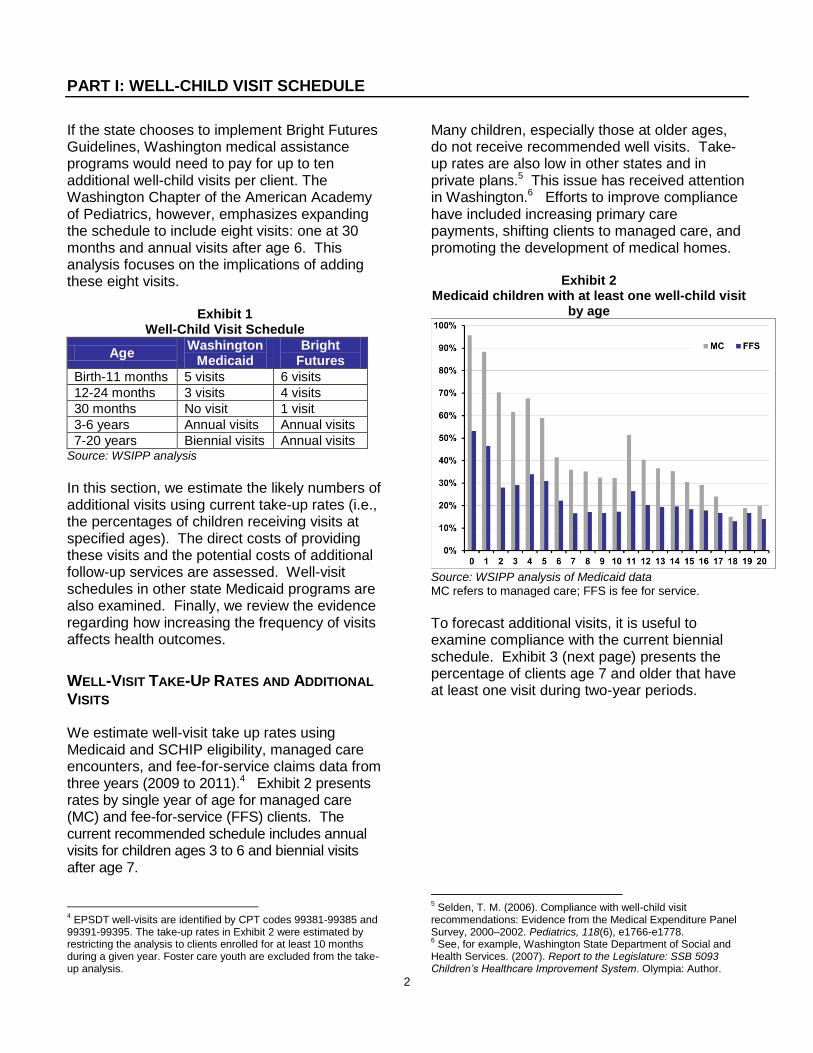
We estimate well-visit take up rates using Medicaid and SCHIP eligibility, managed care encounters, and fee-for-service claims data from three years (2009 to 2011).4 Exhibit 2 presents rates by single year of age for managed care (MC) and fee-for-service (FFS) clients. The current recommended schedule includes annual visits for children ages 3 to 6 and biennial visits after age 7.
4 EPSDT well-visits are identified by CPT codes 99381-99385 and
99391-99395. The take-up rates in Exhibit 2 were estimated by restricting the analysis to clients enrolled for at least 10 months during a given year. Foster care youth are excluded from the take-up analysis.
Many children, especially those at older ages, do not receive recommended well visits. Take-up rates are also low in other states and in private plans.5 This issue has received attention in Washington.6 Efforts to improve compliance have included increasing primary care payments, shifting clients to managed care, and promoting the development of medical homes.
Exhibit 2 Medicaid children with at least one well-child visit
by age
Source: WSIPP analysis of Medicaid data MC refers to managed care; FFS is fee for service.
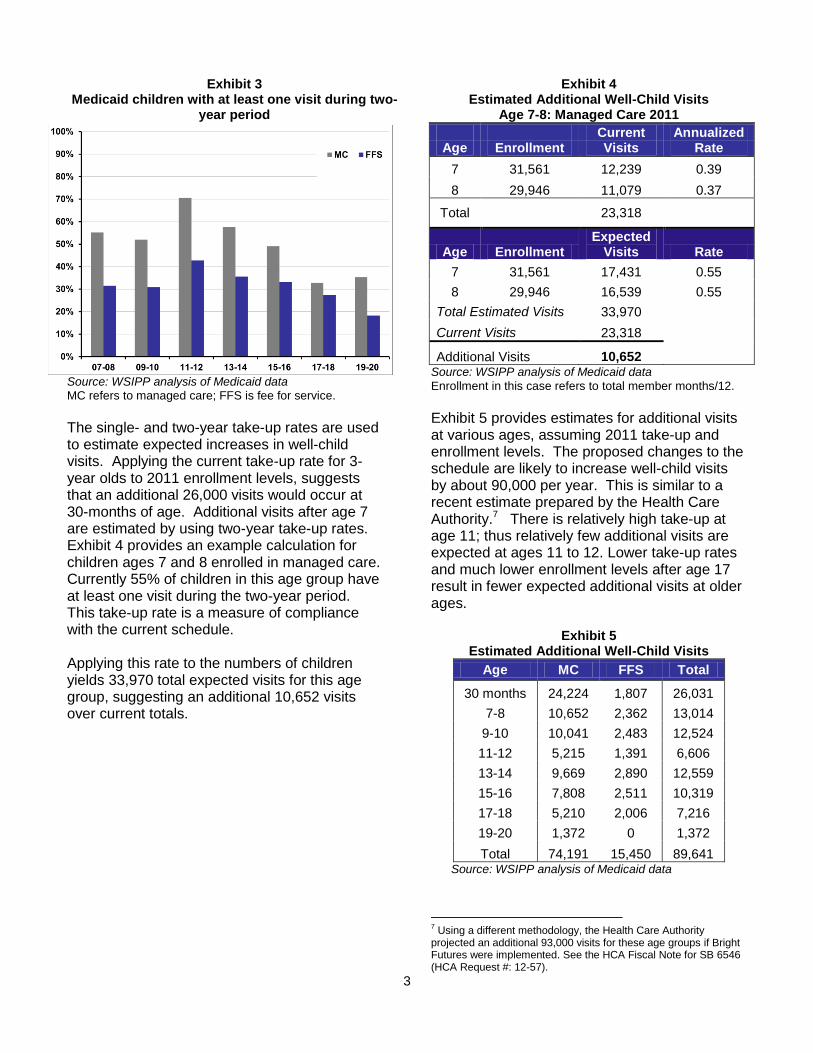
To forecast additional visits, it is useful to examine compliance with the current biennial schedule. Exhibit 3 (next page) presents the percentage of clients age 7 and older that have at least one visit during two-year periods.
5 Selden, T. M. (2006). Compliance with well-child visit
recommendations: Evidence from the Medical Expenditure Panel Survey, 2000–2002. Pediatrics, 118(6), e1766-e1778. 6 See, for example, Washington State Department of Social and
Health Services. (2007). Report to the Legislature: SSB 5093 Children’s Healthcare Improvement System. Olympia: Author.
3
Exhibit 3 Medicaid children with at least one visit during two-
year period
Source: WSIPP analysis of Medicaid data MC refers to managed care; FFS is fee for service.
The single- and two-year take-up rates are used to estimate expected increases in well-child visits. Applying the current take-up rate for 3-year olds to 2011 enrollment levels, suggests that an additional 26,000 visits would occur at 30-months of age. Additional visits after age 7 are estimated by using two-year take-up rates. Exhibit 4 provides an example calculation for children ages 7 and 8 enrolled in managed care. Currently 55% of children in this age group have at least one visit during the two-year period. This take-up rate is a measure of compliance with the current schedule. Applying this rate to the numbers of children yields 33,970 total expected visits for this age group, suggesting an additional 10,652 visits over current totals.
Exhibit 4 Estimated Additional Well-Child Visits
Age 7-8: Managed Care 2011
Current Annualized Age Enrollment Visits Rate
7 31,561 12,239 0.39
8 29,946 11,079 0.37
Total
23,318
Age Enrollment Expected
Visits Rate
7 31,561 17,431 0.55
8 29,946 16,539 0.55
Total Estimated Visits 33,970
Current Visits 23,318
Additional Visits 10,652 Source: WSIPP analysis of Medicaid data
Enrollment in this case refers to total member months/12.
Exhibit 5 provides estimates for additional visits at various ages, assuming 2011 take-up and enrollment levels. The proposed changes to the schedule are likely to increase well-child visits by about 90,000 per year. This is similar to a recent estimate prepared by the Health Care Authority.7 There is relatively high take-up at age 11; thus relatively few additional visits are expected at ages 11 to 12. Lower take-up rates and much lower enrollment levels after age 17 result in fewer expected additional visits at older ages.
Exhibit 5 Estimated Additional Well-Child Visits
Age MC FFS Total
30 months 24,224 1,807 26,031
7-8 10,652 2,362 13,014
9-10 10,041 2,483 12,524
11-12 5,215 1,391 6,606
13-14 9,669 2,890 12,559
15-16 7,808 2,511 10,319
17-18 5,210 2,006 7,216
19-20 1,372 0 1,372
Total 74,191 15,450 89,641 Source: WSIPP analysis of Medicaid data
7 Using a different methodology, the Health Care Authority
projected an additional 93,000 visits for these age groups if Bright Futures were implemented. See the HCA Fiscal Note for SB 6546 (HCA Request #: 12-57).

4
DIRECT COST OF ADDITIONAL WELL-VISITS
The current Early and Periodic Screening, Diagnosis, and Treatment (EPSDT) program fee schedule for Washington Medicaid is displayed in Exhibit 6. Allowable fees vary by age of the child, whether the patient is a new or established, and whether the child is under managed-care (MC) or fee-for-service (FFS).8
Exhibit 6 Washington State EPSDT Fee Schedule (7/1/2012)
Maximum Allowable
CPT Code MC FS Foster Care
99381 $93.08 $63.29 $120.00
99382 $97.38 $67.30 $120.00
99383 $100.81 $71.31 $120.00
99384 $113.41 $84.20 $120.00
99385 $110.55 $81.34 $120.00
99391 $82.77 $57.85 $120.00
99392 $88.50 $63.29 $120.00
99393 $88.21 $63.29 $120.00
99394 $96.52 $71.31 $120.00
99395 $98.52 $73.60 $120.00 Source: Washington State Health Care Authority
The average cost across visits is a blend of these rates. Exhibit 7 presents average allowed amounts for well-visits occurring between October 2010 and September 2011.9 Two cost measures are presented. The first includes all charges on the claims or encounters for the well-visit. The second, more inclusive, measure includes all services for any claim occurring on the day of the visit. These additional services primarily include immunizations for managed care and an all-inclusive clinic charge for FFS.10
8 Different current procedural terminology (CPT) codes are used
for well visits among children of different ages and for new and established patients. CPT codes are used to report health care services and procedures to payers for reimbursement. 9 The figures are weighted averages of MC and FFS allowable
amounts for different age groups. Extremely high and low amounts for individual visits were excluded from the analysis. 10
CPT code T1015.
Exhibit 7 Allowed Amounts: Oct 2010-Sept 2011
Age Well-Visit All Claims on
Claim Day of Visit
1-4 $91 $111
5-11 $89 $107
12-17 $97 $122
18+ $108 $168 Source: WSIPP analysis of Medicaid data
Applying these allowable amounts suggests a total cost of from $8 to $10 million per year—on a per-member, per-month (PMPM) basis this is $0.92 to $1.13. These estimates include both the state and federal shares. State costs are roughly half of the total.
Exhibit 8 Cost of Additional Well-Child Visits: Allowed
Age Visits Well-Visit
Claim
All Claims on Day of
Visit
30 MO 26,031 $2,368,937 $2,882,190
7-8 13,014 $1,153,824 $1,386,769
9-10 12,524 $1,110,356 $1,334,525
11-12 6,606 $585,649 $703,885
13-14 12,559 $1,222,035 $1,526,367
15-16 10,319 $1,004,080 $1,254,133
17-18 7,216 $702,149 $877,010
19-20 1,372 $148,015 $230,516
Total 89,641 $8,295,046 $10,195,395 Source: WSIPP analysis of Medicaid data

5
ADDITIONAL DOWNSTREAM SERVICES
Additional well-child visits will induce follow-up services. Identifying required care, after all, is one of the purposes of these examinations. The following analysis roughly gauges the cost of these additional services. Some of the short-term costs may be partially offset by longer-term savings.11 Some of the services, such as dental care, may well have been required later at potentially higher cost. Also, with the transition to an annual schedule for older children, the associated services for any single visit may decline. The following analysis identifies clients with well-visits between October 2010 and September 2011. We examined all encounters/claims for these clients that occur up to 90 days before and after well-visits. Exhibit 9 (next page) presents estimated average allowed amounts per member during the weeks before and after a visit.12 Spending tends to increase after visits.
11
Zhou et al. (2005), for example, has estimated a very high benefit-cost ratio for childhood immunizations. Zhou, F., Santoli, J., Messonnier, M. L., Yusuf, H. R., Shefer, A., Chu, S. Y., ... & Harpaz, R. (2005). Economic evaluation of the 7-vaccine routine childhood immunization schedule in the United States. Archives of Pediatrics & Adolescent Medicine, 159(12), 1136-1144. 12
The analysis excludes clients who are not enrolled during the 90 days before or after the visit. Clients under the age of two and those that have had a prior well-visit within 330 days are also excluded. The costs associated with childbirth, pregnancy, and emergency department visits are excluded.

6
Exhibit 9 Average Weekly Allowed Amount per Client:
Before and After Well-Child Visit
Source: WSIPP analysis of Medicaid data
We calculated the increase in weekly spending per client over levels in the three months prior to the visit (Exhibits 10, right, and 11, next page).13 Using a full-year prior-to-visit baseline, instead of three months, does not substantially alter the estimates. Also, the estimates do not vary dramatically for age groups (2-11, 12-20) and coverage type (MC, FFS), though the average cost of associated services tends to be higher for older children under FFS.
13
These estimates are produced using fixed effect regressions of weekly paid amounts on period dummies. The spending levels in each of these weeks (1-12) are statistically significantly higher than pre-visit levels.
Exhibit 10 Average Increase in Allowed Amounts per Client
per Week after Well Visit
Cumulative
Period Allowed Increase
Week1 $20.19 $20.19 Week2 $11.08 $31.27 Week3 $10.85 $42.12 Week4 $9.83 $51.95 Week5 $9.17 $61.13 Week6 $7.52 $68.64 Week7 $7.99 $76.63 Week8 $6.52 $83.15 Week9 $5.55 $88.70
Week10 $6.94 $95.64 Week11 $5.83 $101.47 Week12 $3.64 $105.11
Source: WSIPP analysis of Medicaid data

7
Exhibit 11 Increase in Weekly Allowed Amounts after Visit
Source: WSIPP analysis of Medicaid data During the first week after a well-visit, allowed amounts are on average $20 higher than during the three months prior to the visit. This is an average increase—some clients have no additional services after the well-visit, others do.
The net increase in spending declines over time, and levels off after 6 weeks. The cumulative increase in spending across these 6 weeks is around $70 dollars per child. An additional $70 dollars for each of the additional 89,641 expected visits increases total spending by $6.3 million (or $0.69 on a PMPM basis). Again, this includes both the state and federal shares. In terms of diagnoses, the services with the highest post-visit increases in allowed amounts are dental, vision, behavioral health and developmental issues.14 For procedure types, there are relatively large spending increases for dental procedures, psychiatry, evaluation and management (E&M), surgeries (primarily tonsils, adenoids, Eustachian tubes), pharmaceuticals, radiology and lab work. Increases in post-visit utilization of dental, behavioral health and developmental services provide evidence that well-child assessments identify needs for additional care.
14
The most common developmental issues include ADHD, conduct disturbance, oppositional defiant disorder, emotional disturbance, and various developmental delays.
Exhibit 12 Total Allowed Amounts Before and After Visit: Dental Services
Source: WSIPP analysis of Medicaid data

8
Exhibit 13 Total Allowed Before and After Visit: Vision/Hearing/Speech Services
Source: WSIPP analysis of Medicaid data
Exhibit 14
Total Allowed Before and After Visit: Developmental Conditions
Source: WSIPP analysis of Medicaid data

9
OTHER STATE PROGRAMS AND PRIVATE PAYER
BENCHMARKS
We examined the well-visit schedules adopted by other state Medicaid programs.15 The 30-month visit is covered in approximately 21 states. Annual visits for older children are covered in roughly 40 states. Among these 40, at least 3 states recommend biennial visits but will pay for annual ones. Federal health care reform legislation, as noted earlier, requires that Bright Futures guidelines be followed in private plans established after March 2010. Some grandfathered plans have opted to follow the Bright Futures schedule.16 In Washington, for example, Regence Blue Shield covers annual well-child visits after age 6. Group Health’s well-visit schedule does not include a 30-month visit, but annual visits from ages 10 to 17 are recommended.
HEALTH OUTCOMES AND COST EFFECTIVENESS
The Bright Futures recommended well-child visit schedule is based largely on the clinical experience and opinion of experts. Experts note, for example, that yearly exams for older children provide a baseline for assessment and facilitate compliance with influenza and other vaccines. Proponents cite studies by Hakim and colleagues (2001,2002), who found that compliance with established well-child visit schedules and immunizations among infants were associated with fewer avoidable hospitalizations and some types of emergency department visits.17 Moyer and Butler (2004) conducted a systemic review of studies but found no clinical trials that evaluated the benefits from repeated physical
15
This analysis relied heavily on a review of state websites conducted in November 2012. In some cases the information on these sites was incomplete, and the counts provided here are approximate. 16
Note that plans report annual HEDIS performance indicators, including measures on the number of children receiving well-visits. 17
Hakim, R. B., & Bye, B. V. (2001). Effectiveness of compliance with pediatric prevent care guidelines among Medicaid beneficiaries. Pediatrics, 101(1), 90-97; and Hakim, R. B., & Ronsaville, D. S. (2002). Effect of compliance with health supervision guidelines among US infants on emergency department visits. Archives of Pediatrics & Adolescent Medicine, 156(10), 1015-1020.
examinations.18 They did find studies that examined aspects of repeated examinations, including growth monitoring, routine blood pressure measurement, and scoliosis screening. Boulware and colleagues (2007) reviewed the evidence for adult health evaluations, which might be relevant for older teenagers.19 For adults, they found that evidence suggests patients benefit from periodic evaluations through improved delivery of recommended clinical services such as gynecologic exams, cholesterol screening, and fecal occult blood testing. They found no evidence regarding the required frequency of visits. The Institute requested the Center for Evidence-based Policy (CEbP) at Oregon Health and Science University to search for more recent evidence.20 Specifically, the CEbP was asked to systematically search for studies21 published between January 2002 and August 2012 that addressed the following two questions:
Do more frequent preventive visits improve outcomes compared to usual care or less frequent preventive visits?
Do more frequent preventive visits result in cost savings through reduced emergency department utilization, avoidable hospitalizations and other services compared to usual care or less frequent preventive visits?
Unfortunately, the CEbP search identified only two articles that examined specific aspects of well-visit monitoring (growth monitoring and newborn hearing screening). No studies that examined the benefits of more frequent visits were found.
18
Moyer, V. A., & Butler, M. (2004). Gaps in the evidence for well-child care: A challenge to our profession. Pediatrics, 114(6), 1511-1521. 19
Boulware, L. E., Marinopoulos, S., Phillips, K. A., Hwang, C. W., Maynor, K., Merenstein, D., ... & Daumit, G. L. (2006). Systematic review: The value of the periodic health evaluation. Annals of Internal Medicine, 146(4), 289-300. 20
The CEbP report, Ryan et al. 2012, is available on the Institute website. 21
Study designs in the search included systematic reviews, technology assessments, randomized controlled trials, and observational comparative study designs (prospective, retrospective, and controlled clinical trials) and all relevant economic evaluations, cost-effectiveness analyses, and economic simulation models.

10
Therefore, at the present time, the evidence regarding more frequent visits is inconclusive. The lack of evidence does not mean that additional well-child visits are ineffective—only that there are simply no studies that support or refute the recommendation.

11
PART II: AUTISM AND DEVELOPMENTAL SCREENING
Bright Futures guidelines recommend universal developmental and autism screening for children. Currently, Washington State medical assistance programs rely on surveillance (defined below) at EPSDT visits, rather than formal screening instruments, to identify developmental delays and disorders. To implement the guidelines, Washington would have to pay for up to three broadband developmental screens (at 9, 18, and 24 or 30 months) and two autism screens (at 18 and 24 months). Note that broadband developmental screens are not specifically designed to detect autism. Surveillance includes eliciting parental concerns, obtaining a developmental history, and making observations of children. Screening is the use of a standardized tool to detect a particular disease. The AAP’s rationale for universal screening is that:
surveillance alone detects less than 30% of developmental problems,
screening tools increase the identification rate substantially, and
early identification and treatment can improve outcomes for families and children.
There are several necessary conditions for screening to improve outcomes.
Screening instruments must be accurate and feasible.
Pediatricians must refer children that screen positive for further evaluation and intervention.
Parents need to comply with these referrals.
Intervention services must be accessible.
Interventions must be effective.
In Washington, advocates for universal developmental screening include the Children with Special Health Care Needs Program (CSHCN) at the Department of Health (DOH), the Early Support for Infants and Toddlers (ESIT) Program at the Department of Early Learning (DEL), the Washington Chapter of the American Academy of Pediatrics (WCAAP), and other nongovernmental organizations. In 2011, the DOH was awarded a three-year Health Resources and Services Administration (HRSA) grant to improve access to high-quality medical homes and early developmental screening in the state. TeKolste (2010) discusses efforts to promote screening and referrals for developmental interventions in Washington.22 This section of the report summarizes national estimates of the prevalence of autism and developmental conditions and discusses the burden imposed by these conditions. Medicaid claims and encounters data are used to assess prevalence among children enrolled in Washington Medicaid and SCHIP. We estimate the expected number and cost of screens for Washington’s medical assistance programs, and review the adoption of screening in other states’ programs. The evidence regarding effects of screening and the efficacy of early treatment is examined.
PREVALENCE
Prevalence estimates are derived from different national surveys, and estimates vary in part due to the various ways disability is defined.23 It is clear, however, that developmental and behavioral disabilities affect many children.
In the United States, about 13% of children 3 to 17 years of age have a developmental or behavioral disability such as autism, intellectual disability, and attention-
22
TeKolste, K. (2010). A strategic framework for universal developmental screening for the State of Washington. Olympia: Washington State Department of Health, Office of Maternal and Child Health. 23
Surveys share the limitation of having to rely on subjective parental reporting; see Halfon, N., Houtrow, A., Larson, K., & Newacheck, P. W. (2012). The changing landscape of disability in childhood. The Future of Children, 22(1), 13-42.

12
deficit/hyperactivity disorder. In addition, many children have delays in language or other areas that can affect school readiness.24
Between 10% and 13% of infants and toddlers experience developmental delays.25
Speech and language delay affects 5-8% of preschool children.26
About 1 in 88 children in the United States have been identified with Autism Spectrum Disorder (ASD).27 An estimated 8,000 to 12,000 children have ASD in Washington State.28
Using data from the 2009 National Health Interview Survey, Halfon and colleagues (2012) examine the prevalence of disabilities among children.29 Developmental, emotional, and behavioral conditions are much more common than the traditional physical conditions as causes of activity limitations. The most prevalent conditions that affect children are speech problems, learning disability, ADHD and other mental or behavioral issues. Other less prevalent conditions include asthma, birth defects, bone/joint/muscle problems, hearing and vision problems, intellectual disability, and epilepsy.
DIAGNOSES AMONG CHILDREN IN WASHINGTON
MEDICAID
Washington Medicaid and SCHIP encounter and claims data for 2011 were examined to assess
24
Centers for Disease Control and Prevention. See http://www.cdc.gov/ncbddd/childdevelopment /screening.html 25
Kavanagh, J., Gerdes, M., Sell, K., Jimenez, M., & Guevara, J. (2012, Summer). An integrated approach to supporting child development (series). Retrieved from http://www.helpmegrownational.org/includes/news/policylab_e2a_summer2012_series.pdf 26
Nelson, H. D., Nygren, P., Walker, M., & Panoscha, R. (2006). Screening for speech and language delay in preschool children: Systematic evidence review for the US Preventive Services Task Force. Pediatrics, 117(2), e298-e319. 27
Centers for Disease Control and Prevention. See http://www.cdc.gov/features/countingautism/ 28
Washington State Department of Health. See http://www.doh.wa.gov/YouandYourFamily/IllnessandDisease/Autism.aspx 29
Disability is defined using criteria that include: difficulty seeing or hearing; impairment or health problem that limits ability to crawl, walk, run or play; identified as having a learning disability; identified as having ADD/ADHD; needs help with bathing.
the extent to which children are diagnosed with developmental conditions and delays. Children were identified as having a given condition if they had two or more relevant diagnoses during the year.30 These counts are not an accurate measure of true prevalence. Some children with issues fail to be diagnosed, and information reported on claims is sometimes incomplete. However, the counts provide a measure of the relative importance of conditions and the ages at which they appear in claims. The focus of our analysis, given the recommended screens and screening ages, is autism spectrum disorder and developmental delay (Exhibit 15, next page). We identified 6,300 clients age 20 or younger with ASD diagnoses in 2011.31 Using the Centers for Disease Control and Prevention (CDC) reported prevalence of 1 in 88 children as a benchmark, fewer young children with autism than expected show up in the Washington Medicaid claims. Prevalence approaches the national benchmark by age 8; suggesting that many younger children with ASD go undiagnosed (Exhibit 16, next page). The median age of first diagnosis is about age 5. Children with autism often have other developmental conditions. Among Washington Medicaid clients under age 20 with ASD, 62% also had other developmental conditions— ADHD (22%), developmental delay (19%), conduct disorder (9%), emotional disorder (4%), epilepsy (5%), and intellectual disability (3%).32 Medicaid claims data identify 27,000 children with developmental delays in 2011. Among children aged 2 to 4 years, 7% have developmental delay diagnoses.33 Speech and language delays are the most prevalent diagnoses (Exhibit 17, page 14).
30
The diagnosis need not be primary. Diagnosis codes 1 through 5 on each claim or encounter were examined. 31
Diagnosis codes 29900 – 29990. If you count clients with only one ASD diagnoses, the count increases to 7,983. If you require three diagnoses, the count falls to 5,400. 32
A study by Lipkin and Hyman (2011) found that among children with ASD, 83% were also found to have another developmental disorder and 10% had a psychiatric condition; see Lipkin, P. H., & Hyman, S. L. (2011). Should all children be screened for autism spectrum disorders?. Am Fam Physician, 84(4), 361-378. 33
Diagnosis codes 31500–3159. If you count clients with only one diagnosis, the count increases to 38,439. If you require three, the count falls to 22,000.

13
Exhibit 15 Washington Medicaid/SCHIP Clients with
ASD & Developmental Delay Diagnoses by Age
Source: WSIPP analysis of Medicaid data
Exhibit 16
ASD Prevalence among Washington Medicaid/SCHIP Clients by Age (Cases per 1000 Children)
Source: WSIPP analysis of Medicaid data

14
Exhibit 17 Developmental Delay Claim Primary Diagnoses
Diagnosis Percent
Speech/language disorder NEC* (31539) 30.1%
Mixed receptive-expressive language disorder (31532) 19.2%
Developmental delay NOS (3159) 17.5%
Expressive language disorder (31531) 14.1%
Developmental coordination disorder (3154) 6.3%
Mixed development disorder (3155) 5.6%
Developmental delays NEC (3158) 4.2%
Speech/language delay due to hearing loss (31534) 1.9%
Other learning difficulties (3152) 0.7%
*NEC is not elsewhere classified; NOS is not otherwise specified.
Rarer diagnoses include reading, math and fluency disorders and dyslexia.
Source: WSIPP analysis of Medicaid data
Conduct disturbance, emotional disturbance, and, especially, attention deficit-hyperactivity disorder (ADHD) are prevalent. About 13,000 clients had conduct disturbance diagnoses, 8,500 emotional disturbances, and 37,500 ADHD (Exhibit 18). These conditions present at older ages and are not the target of the proposed developmental screening.
Exhibit 18 Washington Medicaid/SCHIP Clients with
Other Prevalent Developmental Condition Diagnoses by Age
Source: WSIPP analysis of Medicaid data

15
Other less prevalent conditions include epilepsy (5,700), cerebral palsy (2,300), intellectual disability (970 clients), and muscular dystrophy (340).
BURDEN AND CONSEQUENCES
The impact of developmental delays can extend beyond childhood. These children are more likely to be in poor health, have low educational attainment, and have lower income as adults than their peers.34 Speech and language delays often persist into the school years and may be associated with lower school performance and psychosocial problems.35
Autism spectrum disorder (ASD) includes the diagnostic categories autistic disorder, Asperger syndrome, and pervasive developmental disorder-not otherwise specified. These neurological disorders are characterized by deficits in social interaction, communication, and stereotyped or repetitive behaviors. Many adults with autism continue to have problems with language, social skills, and self-sufficiency. They often develop psychiatric disturbances, including affective disorders and obsessive-compulsive disorder. About a quarter of people with autism function fairly well as adults.36 Developmental conditions impose monetary and psychic costs on children and their families. Stabile and Allin (2012) examine the economic costs of childhood disability through a review of the literature.37 Studies tend to focus on monetary costs, and do not attempt to place a value on emotional stresses. Direct, indirect and long-term costs are examined. Direct costs are those associated with health care, therapies, educational services, and safety net programs. The largest indirect cost to the family arises from reduced employment among mothers of disabled children.38 Long-term costs arise from impacts on the child’s schooling and adult employment. Stabile and Allin roughly estimate
34
Kavanagh et al., 2012 35
Nelson et al., 2006 36
Al-Qabandi, M., Gorter, J. W., & Rosenbaum, P. (2011). Early autism detection: Are we ready for routine screening? Pediatrics, 128(1), e211-e217. 37
Stabile, M., & Allin, S. (2012). The economic costs of childhood disability. The Future of Children, 22(1), 65-96. 38
Among welfare recipients, having a child with a severe disability reduces employment of mothers by 15 percentage points.
the average annual cost of having a child with a disability. The estimates vary by condition.
Costs to the family—dominated by reduced employment of the mother and reduced future earnings of the child—average $10,800 and range from $3,200 to $25,500 per year.
Social program costs—mostly special education—average $19,700 and range from $19,500 to $40,000 per year.
Total annual costs average $30,500 and range from $19,500 to $65,500.
Given these costs, Stabile and Allin argue that even expensive interventions to reduce childhood disability may well be justified by a cost-benefit considerations. The costs associated with ASD are at the higher end of these ranges. Stabile and Allen cite a study from Sweden that estimates the annual cost to society of caring for children with autism to be about $70,000 (2005 dollars), including costs of services, informal care, and lost productivity.39
FEASIBILITY AND EFFECTIVENESS OF
UNIVERSAL SCREENING
Utilization of developmental screening by pediatricians has increased after Bright Futures Guidelines were published, but screening rates remain low. A survey of AAP members in 2005 found that only 23% of pediatricians used a standardized developmental screening instrument.40 In a 2009 AAP survey, 48% of pediatricians nationally reported using developmental screens. Most recently, a 2012 survey of AAP member pediatricians in six states found that roughly half ‘always used’ developmental and autism screens at 9-, 18-, and 24- or 30-month well-child visits.41
39
Jarbrink, K. (2007). The economic consequences of autistic spectrum disorder among children in a Swedish municipality. Autism, 11(5), 453-463. 40
Sand, N., Silverstein, M., Glascoe, F. P., Gupta, V. B., Tonniges, T. P., & O’Connor, K. G. (2005). Pediatricians’ reported practices regarding developmental screening: Do guidelines work? Do they help? Pediatrics, 116(1), 174-179. 41
Arunyanart, W., Fenick, A., Ukritchon, S., … & Weitzman, C. (2012). Developmental and autism screening: a survey across six states. Infants & Young Children, 25(3), 175-187; Note that this survey had a low response rate (10%). The six states include

16
Pediatricians most often used the Ages & Stages Questionnaire (ASQ) for broadband developmental screening and the Modified Checklist for Autism in Toddlers (MCHAT) for ASD. Studies have cited several reasons why many pediatricians have not adopted screening. These include: uncertainty over or lack of reimbursement; substantial time pressures in their practices, distrust of screening tools; belief that follow-up services are not available; limited background or time to help families navigate the fragmented network of services a child might need; and insufficient training.42 Low screening rates are a concern because many children with developmental issues go undetected, and they forgo potentially effective early interventions.
Fewer than half of children with developmental delays are identified before starting school, by which time significant delays already might have occurred and opportunities for treatment might have been missed.43
The median age of diagnosis for ASD is around 4 and half years. Roughly half of children with ASD are diagnosed only after entering school.
Pediatricians fail to identify and refer 60% to 80% of children with developmental delays in a timely manner.44
Pediatricians are more likely to identify and refer children who are over 3 years old and children with more severe disabilities for services.45
Connecticut, Hawaii, Massachusetts, Michigan, New Jersey and New York. Medicaid programs in 5 of these states cover developmental screening; though only 2 or 3 require them. 42
Sand et al., 2005; Kavanagh et al., 2012; and Pinto-Martin, J. A., Dunkle, M., Earls, M., Fliedner, D., & Landes, C. (2005). Developmental stages of developmental screening: Steps to implementation of a successful program. American Journal of Public Health, 95(11), 1928-1932. 43
Centers for Disease Control and Prevention. See http://www.cdc.gov/ncbddd/childdevelopment/screening.html 44
Hix-Small, H., Marks, K., Squires, J., & Nickel, R. (2007). Impact of implementing developmental screening at 12 and 24 months in a pediatric practice. Pediatrics, 120(2), 381-389. 45
Bailey, D. B., Hebbeler, K., Scarborough, A., Spiker, D., & Mallik, S. (2004). First experiences with early intervention: A national perspective. Pediatrics, 113(4), 887-896.
ACCURACY OF SCREENING INSTRUMENTS
There are three common measures of the diagnostic accuracy of screening instruments.
Sensitivity – the percentage of children with the condition that screen positive.
Specificity – the percentage of children without the condition that screen negative.
Positive predictive value (PPV) – the proportion of children with a positive screen that have the condition.
Sensitivity and specificity are relatively straightforward. Positive predictive value (PPV) is a bit more complicated, but it plays a critical role in assessing the utility of screening instruments. PPV is determined by both the instrument’s specificity and the condition’s underlying prevalence. Consider applying a screen that has specificity and sensitivity of 0.90 to a population where the underlying prevalence of the targeted condition is 10%. The PPV would hover around 0.50 – roughly half of the patients identified as at risk would not have the condition (Exhibit 19, next page). If the underlying prevalence were only 1%, then the PPV would drop to around 0.08. The issue of false positive screens factors into the discussion in the next section.

17
Exhibit 19 Illustrative Example for Screening Metrics
1000 screens, prevalence=10%, sensitivity=0.9, specificity=0.9
True Screen result
status Positive Negative
Has condition 100 90 10
Does not have condition 900 90 810
Total positive screens 180
False positives 90
Positive predictive value 0.5 Source: WSIPP analysis
There are ‘broadband’ screens, such as the ASQ, that can identify general developmental delays and targeted screens, such as the MCHAT, that identify specific conditions. Screens are short questionnaires, usually completed by parents. Bright Futures recommends that:
both broadband and autism-specific screens be administered, because broadband screens lack sufficient sensitivity in identifying ASD,
a series of screens be administered to enhance sensitivity,46 and
screening be used to supplement, not replace, pediatrician surveillance.
AUTISM SCREENS
The Modified Checklist for Autism in Toddlers (MCHAT) is the most commonly used screen for ASD. The MCHAT has moderate sensitivity (0.85-0.87) and high specificity (0.93–0.99). Despite the high specificity, there has been concern over low positive predictive values. Studies have reported PPVs as low as 0.11 (a false-positive rate of 0.89). False-positive screens are a concern because they may result in stress and the added expense of diagnostic evaluation. However, other developmental disorders (e.g. global developmental delay) are
46
For example, Gupta et al. (2007) emphasize that screening at both 18 and 24 months is required. Screening at 18 months may miss children with ASDs because the parents have either not become concerned or noted signs of regression. See Gupta, V. B., Hyman, S. L., Johnson, C. P., Bryant, J., Byers, B., Kallen, R., ... & Yeargin-Allsopp, M. (2007). Identifying children with autism early?. Pediatrics, 119(1), 152-153.
often diagnosed in children who falsely test positive for ASD.47 Also, use of a structured follow-up interview substantially increases the PPV. Follow-up interviews are typically administered by phone.
BROADBAND DEVELOPMENTAL SCREENS
Two commonly used broadband screens are the Ages & Stages Questionnaire (ASQ) and the Parents Evaluation of Developmental Status (PEDS). The ASQ has an estimated sensitivity in the range 0.70-0.90 and specificity in the range 0.76-0.91. PEDS has sensitivity in the range 0.74-0.79 and specificity of 0.70-0.80.48 Broadband screening instruments result in false positives for 15 to 30% of children. Many children who screen positive for developmental delays are ultimately determined to be ineligible for early Intervention services (IDEA Part C).49 However, these children may benefit from other programs not funded by IDEA.50
47
Lipkin, P. H., & Hyman, S. L. (2011). Should all children be screened for autism spectrum disorders?. Am Fam Physician, 84(4), 361-378. 48
American Academy of Pediatrics (2006). Identifying infants and young children with developmental disorders in the medical home: An algorithm for developmental surveillance and screening. Pediatrics, 118(1), 405-420. 49
Individuals with Disabilities Act (IDEA), Part C, early Intervention programs provide an array of services to children with special needs, birth through three years of age, and their families. Implications for Washington’s program are discussed in Part 3. 50
Marks, K. P., Page Glascoe, F., & Macias, M. M. (2011). Enhancing the algorithm for developmental–behavioral surveillance and screening in children 0 to 5 years. Clinical Pediatrics, 50(9), 853-868.

18
FEASIBILITY AND EFFECTS
A growing number of studies have documented efforts to implement autism and broadband developmental screening in pediatric office settings. These studies find that screening is feasible, substantially increases early diagnoses, and results in higher referral rates to early intervention.
AUTISM SCREENING STUDIES
Studies have shown that autism screening improves identification of ASD over physician surveillance alone. Robins and colleagues (2001) found pediatrician judgment misses five times as many cases of ASD compared to screening with the MCHAT.51 In a more recent study, Robins (2008) examined the application of the MCHAT and Follow-Up Interview during toddler checkups at 42 sites in the Atlanta area.52 Among the 21 children ultimately diagnosed with ASD, only 4 were previously flagged by a pediatrician. Similar results were found by Miller and colleagues (2011) in a screening implementation study at a large pediatric practice in Salt Lake City.53 Oosterling and colleagues (2009) conducted a trial in Netherlands.54 In the experimental region, professionals were trained to recognize early signs of autism and use the Early Screening of Autistic Traits Questionnaire (ESAT). ASD was diagnosed on average 21 months earlier in experimental region than in control; children were nine times more likely to be diagnosed before age 36 months. False positives are an issue with the MCHAT, but application of the Follow-Up Interview reduces the problem.55 Kleinman and
51
Robins, D. L., Fein, D., Barton, M. L., & Green, J. A. (2001). The Modified Checklist for Autism in Toddlers: An initial study investigating the early detection of autism and pervasive developmental disorders. Journal of Autism and Developmental Disorders, 31(2), 131-144. 52
Robins, D. L. (2008). Screening for autism spectrum disorders in primary care settings. Autism, 12(5), 537-556. 53
Miller, J.S., Gabrielsen, T., Villalobos, M., … & Segura, B. (2011). The each child study: systematic screening for autism spectrum disorders in a pediatric setting. Pediatrics, 127, 866-871. 54
Oosterling, I., Wensing, M., Swinkels, S., … & Buitelaar, J. (2009). Advancing early detection of autism spectrum disorder by applying an integrated two-state screening approach. Journal of Child Psychology and Psychiatry, 51(3), 250-258. 55
See Robins et al., 2001; Miller et al., 2011; and Kleinman, J. M., Robins, D. L., Ventola, P. E., Pandey, J., Boorstein, H. C., Esser,
colleagues (2008), for example, report that the PPV improves to 0.76 after the follow-up interview.56 Nygren and colleagues (2012) report on a general screening conducted for 2.5-year-old children at child health centers in Sweden. Using MCHAT and observation made by trained nurses, they were able to achieve a PPV of 0.90.57 It is instructive to look at the detailed findings to get a feel for the numbers. The following counts from screens to diagnoses are reported by Robins and colleagues (2008) in their Atlanta study. 4797 MCHAT Screens
►466 (9.7%) positive screens
►362 completed follow-up interviews
►61 determined at risk after follow-up
►41 were clinically evaluated
►21 were diagnosed with ASD, 17 with other delays, 3 normal development
BROADBAND DEVELOPMENTAL SCREENING
STUDIES
Research reveals a similar story for broadband developmental screening. Unstructured surveillance by pediatricians misses the majority of children with developmental problems. Screening dramatically increases early detection and early intervention referral. Relatively high percentages of screen-based referrals are ultimately deemed non-eligible for early intervention, but many of these children may benefit from other services.58
E. L., ... & Fein, D. (2008). The modified checklist for autism in toddlers: A follow-up study investigating the early detection of autism spectrum disorders. Journal of Autism and Developmental Disorders, 38(5), 827-839. 56
Kleinman et al., 2008 57
Nygren, G., Sandberg, E., Gillstedt, F., … & Gillberg, C. (2012). A new screening program for autism in a general population of Swedish toddlers. Research in Developmental Disabilities, 33(4), 1200-1210. 58
Hix-Small et al., 2007; Marks et al., 2011; TeKolste, 2010; Kavanagh et al., 2012; Marks, K., Hix-Small, H., Clark, K., & Newman, J. (2009). Lowering developmental screening thresholds and raising quality improvement for preterm children. Pediatrics, 123(6), 1516-1523; Earls, M. F., & Hay, S. S. (2006). Setting the stage for success: Implementation of developmental and behavioral screening and surveillance in primary care practice—the North Carolina Assuring Better Child Health and Development (ABCD) Project. Pediatrics, 118(1), e183-e188; Jee, S. H.,

19
Jee and colleagues (2010), for example, found that using the ASQ doubled the detection rate for developmental problems among foster care children in a pediatric medical home.59 Pinto-Martin and colleagues (2005) describe how screening promotion efforts in North Carolina helped increase the referral rate to early intervention from 2.6% in 2000 to 7-8% by 2004.60 Hix-Small and colleagues (2007) examined a pilot for ASQ screening during 12- and 24-month well visits at a large medical group in Oregon.61 Parents of children attending visits were contacted and asked to complete the ASQ. Screening results where then compared with physician assessments. Administration of the ASQ more than doubled the number of children who were identified with delays and later became eligible for early intervention. Details are instructive. The authors report the following counts. 1428 children in sample
►770 completed ASQ screens
►107 referrals to early intervention (63 due to ASQ alone)
► 39 determined eligible for early
intervention Hix-Small and colleagues note that some children were referred to early intervention on the basis of physician observation alone, some on the basis of the ASQ screen alone, and some on the basis of both. Physician identified referrals were more likely to be determined eligible for early intervention than were ASQ-only referrals.62 The early intervention eligibility rate was 60% for joint physician-ASQ referrals, 40% for physician-only referrals, and 26% for ASQ-only referrals. Marks and Macias (2011) conclude that pediatrician surveillance has good
Szilagyi, M., Ovenshire, C., Norton, A., Conn, A. M., Blumkin, A., & Szilagyi, P. G. (2010). Improved detection of developmental delays among young children in foster care. Pediatrics, 125(2), 282-289; and King, T. M., Tandon, S. D., Macias, M. M., Healy, J. A., Duncan, P. M., Swigonski, N. L., … & Lipkin, P. H. (2010). Implementing developmental screening and referrals: Lessons learned from a national project. Pediatrics, 125(2), 350-360. 59
Jee et al., 2010 60
Pinto-Martin et al., 2005 61
Hix-Small et al., 2007 62
Ibid
specificity but poor sensitivity. Clinicians have difficulty identifying the less obvious delays.63
EXPECTED SCREENING VOLUME AND COST
Bright Futures recommends broadband developmental screens at the 9-month, 18-month, and 24- or 30-month well-child visits. Autism specific screens are recommended at the 18-month and 24-month visits. Our analysis assumes that the third developmental screen occurs at the 24-month visit. This simplifies estimation and divorces the decisions regarding screening and the well-visit schedule. The assumption does not substantially affect the estimated number of screens. According to Bright Futures recommendations, a child that fails an initial screen should be referred for extended developmental testing and for early intervention services (IDEA, Part C). Estimates for both the number of initial and extended screens are needed to assess potential costs. The estimates begin with counts of 9-month, 18-month, and 24-month well-visits based on 2011 Washington Medicaid data. There were roughly 85,000 visits. Many children with 18-month and 24-month visits also had earlier visits in the series. Roughly 42,000 children received one or more of the visits in the 85,000 count64 (Exhibit 20, next page).
63
Marks et al., 2011 64
The 42,000 figure relies on using counts of 9- and 18-month visits for these clients in 2009, 2010 and 2011. This ‘steady state’ estimate assumes enough time after implementation for clients to flow through the screening series. If you restrict the analysis to 2011, the count of unique children increases to about 70,000. This higher count reflects the number of children screened during the first year of implementation.

20
Exhibit 20 Number of Children in Washington Medicaid with Well-Child Visits in 2011
Visit Prior Visits for Children
Unique Count of
Well-Visit Count 9-Month 9- or 18-Month Children
9-Month 31,006 31,006
18-Month 28,027 20,751 7,276
24-Month 25,898 22,272 3,626
Total 84,931 41,908
The 9-month visit count is the number of clients with a visit between 8-11 months of age, the 18-month visit is for 16-20 months, and the 24-month is for 22-26 months.
Prior visits for these clients are based on three years of claims and encounter data.
Source: WSIPP analysis of Medicaid data To forecast screens based on visits, we need to make assumptions regarding the percentage of children who will be screened and the proportion of positive screens that are referred for extended testing. The considerations that guide these assumptions are as follows.
SCREENING RATE
Bright Futures Guidelines emphasize the need for both broadband and autism-specific testing. We should not assume in the forecasts that only one screen occurs in a given visit.
Repeated screening is important to identifying conditions. We should not assume in the forecasts that a child is screened only once.
National surveys of pediatricians indicate autism and developmental screening rates of around 50%. Studies of developmental screening pilot programs report screening rates ranging from 54-85%.65 Not all children will be screened.
This analysis assumes that 65% of children attending any given well-visit will receive the recommended autism and developmental screens. This is an assumption, not a prediction, and the estimates given below are only illustrative. Ultimately, the screening rate
65
King et al., 2010; Pinto-Martin el al., 2008; Hix-Small et al., 2007; and Kavanagh et al., 2012
will depend upon several critical implementation decisions. Will screening be required or merely a covered benefit? What will be the reimbursement rate, and will payment be fee-for-service or part of an EPSDT global payment? If the state requires the screens, applies a generous fee-for-service payment, and implements a performance measure, the screening rate may well be higher.
EXTENDED TESTING RATE
Autism Screens. There are not many studies to guide us. Robins (2008) reports a MCHAT positive screen rate of 9.7%;66 Miller and colleagues (2011) report 24%.67 However, in both of these studies the use of the Follow-Up Interview substantially reduced the number of children deemed at risk, and relatively low percentages of positive screens ultimately resulted in clinical evaluations. Nygren and colleagues (2012) also report in their study of a pilot in Sweden that structured observation by nurses can substantially reduce the numbers still considered at risk after initial positive screens.68
Broadband Developmental Screens. Few studies report the rate for positive screens.
66
Robins, 2008 67
Miller, et al., 2011 68
Nygren, G., Sandberg, E., Gillstedt, F., … & Gillberg, C. (2012). A new screening program for autism in a general population of Swedish toddlers. Research in Developmental Disabilities, 33(4), 1200-1210.

21
King and colleagues (2010) report an 11% rate for the ASQ;69 Kavanagh and colleagues (2012) report 20%.70 Developmental screening pilot studies tend to focus on referrals to early intervention rather than extended testing outside of early intervention programs. Referral rates to early intervention, as a percentage of total screens, range from 8.5-14%.71
A recent analysis by the Washington State Health Care Authority assumed that 10% of autism and developmental screens result in extended testing.72
It is unlikely that a child would be sent for extended testing more than once. We should use the number of children screened, rather than numbers of screens, to forecast the volume of extended testing.
This analysis assumes that 10% of children with at least one screen will receive extended developmental testing. Among the children going through all or part of the 3-visit series, 85% are assumed to have at least one screen.73 Again, there is considerable uncertainty over these rates, and the estimates are illustrative.
SCREENING COSTS
Federal Centers for Medicare and Medicaid Services (CMS) reimbursement rates for screens (CPT 96110) and extended testing (CPT 96111) have declined due to relative value unit (RVU) revisions. Washington reimbursement rates, especially for extended testing, are low compared to CMS rates (Exhibit 21). Currently, Washington Medicaid only reimburses psychologists for developmental screenings. There is no provision for primary care physician reimbursement. More widespread screening and testing may require
69
King et al., 2010 70
Kavanagh et al., 2012 71
Hix-Small et al., 2007; King et al., 2010; and Kavanagh et al., 2012 72
Washington State Health Care Authority. (2012). Individual State Agency Fiscal Note for SB 6546 – Medicaid managed care. Retrieved from https://fortress.wa.gov/ofm/fnspublic/ LegSearch.asp?BillNumber=6546&SessionNumber=62 73
This is consistent with children having a screening probability of 65% at any visit, taking into consideration that some do not attend all three visits in the series.
higher reimbursement levels. This analysis applies the CMS rates.
Exhibit 21 2010 Medicaid Rates
CMS Oregon Washington*
96110 $6.75 $5.10 $6.05
96111 $93.25 $91.98 $74.63
*NFS allowable. Washington Medicaid pays only for selected screening by some types of providers.
Source: CMS, Washington Health Care Authority, Oregon Health Authority
Applying our assumptions regarding screening rates and the CMS reimbursement rates generates the estimates in Exhibit 22. The total Medicaid and SCHIP cost would be around $940,000 ($0.10 on a PMPM basis). The cost in terms of state funds would be roughly half this ($470,000). These estimates do not include any adjustment for federally qualified health center (FQHC) differential rates.74
Exhibit 22 Annual Number and Cost of Screens and Extended Testing, Washington Medicaid
Number of Screens
Well-Visit Developmental Autism All
9-Month 20,154
20,154
18-Month 18,218 18,218 36,435
24-Month 16,834 16,834 33,667
Total 55,205 35,051 90,256
Number of Extended Developmental Testing 3,562
Costs
Screens $609,231
Extended Testing $332,173
Total $941,404 Source: WSIPP analysis of Medicaid data
74
These cost estimates are derived by applying the CMS rates given in Exhibit 21. They are not based on allowed amounts from claims and encounter data. Note that other costs estimates presented in this report are derived from claims and encounter data that include FQHC payments.

22
SPENDING ON CHILDREN WITH ASD AND
DEVELOPMENTAL DELAYS
Medicaid spending on services for children with ASD and developmental delays will increase with improved detection. It is difficult, however, to predict the likely increase in diagnoses and spending. Below we provide rough estimates based on evidence from screening implementation studies and our analysis of Medicaid claims data. Screening roughly 42,000 children annually (Exhibit 20), given an underlying prevalence of 1 in 88 and MCHAT sensitivity of 0.85, could identify 400 ASD cases per year. This is consistent with autism screening implementation studies that report yields of around 10 diagnoses per 1000 screens.75 Across all Medicaid and SCHIP clients age 20 or younger, the average per-member, per-month (PMPM) allowed amount in 2011 was $190 (annualized to $2,300). Spending for children with autism is high. Clients with ASD76 had an average PMPM of $860 (annualized at $10,300).77 Future spending may increase if utilization of Applied Behavioral Analysis therapies increases. There is considerable variation in spending across children with autism. The high average PMPM reflects very high spending for a quarter of cases. Although the average PMPM is $860, the median is only $240. PMPM is greater than $730 for 25% of these clients and above $2,250 for 10%. It is not clear where in this spending distribution the additional children—identified through screening, but not surveillance—would fall. Pediatricians are more likely to identify the most severe cases; screening helps to identify the less obvious cases. Our analysis of 2011 Medicaid data found that 7,000 two and three-year olds were diagnosed with developmental delays, a prevalence rate of around 7%. National benchmark prevalence
75
See Miller et al., 2011 and Nygren et al., 2011 76
These children are identified by having two or more ASD diagnoses. 77
The estimate is consistent with other studies. Peacock et al., 2012, for example, estimates the average medical costs for Medicaid-enrolled children with an ASD to be $10,709 per child.
rates of 10 to 13% imply that we should be finding 10,000 to 13,500 Washington Medicaid children aged two to three with diagnosed delays. Given our assumed screening rates and ASQ sensitivity, screening has the potential to identify roughly 2,500 to 4,500 additional two and three-year olds with delays—above what is currently identified through surveillance. Spending is also high among children with delays. The average PMPM for children with developmental delays during 2011 was $590 (annualized at $7,125). Again, spending varies across these children. The median PMPM was only $146; 10% had PMPMs above $1,185.
OPTIMIZING SCREENING AND REFERRALS
If the decision is made to provide universal developmental screening in Washington’s Medicaid program, the Health Care Authority (HCA), Department of Early Learning (DEL) and Department of Health (DOH) should consider measures to optimize the screening and referral process. Kenney and Pelletier (2010) provide a list of measures: “simplifying and clarifying billing practices for developmental screenings; providing incentives in managed care contracts for using standardized tools; providing reminder sheets to providers and parents; conducting provider trainings; and establishing a network of primary care, specialist, and community-based service providers for referrals and follow-up services can improve screening rates among children.”78 The DOH, DEL and partner organizations have been working on efforts to improve system coordination.79 The extent to which pediatricians ultimately adopt screening will depend not only on reimbursement levels, but also on payment models. Some states bundle payments for all services during a well-child visit, and providers receive no additional payment for screenings. Other states reimburse providers separately for each screen. States can also promote
78
Kenney, G. M., & Pelletier, J. E. (2010, December). Improving the lives of young children: The role of developmental screenings in Medicaid and CHIP. Washington, DC: The Urban Institute. 79
See TeKolste (2010) for a discussion of efforts in Washington and other states.

23
screening through incentive payments to providers.80 Universal screening will increase referrals to the Early Support for Infants & Toddlers (ESIT), Washington’s IDEA Part C early intervention program (see Part 3 of this report for a discussion). Demands on ESIT funding sources, including Medicaid, will grow. A report from the Department of Early Learning suggests that Medicaid funding is being leveraged to a much lower extent than would be expected given Medicaid eligibility rates among ESIT clients.81
OTHER STATE AND PRIVATE PAYER
BENCHMARKS
The National Academy for State Health Policy (NASHP) surveyed state Medicaid programs regarding their coverage of developmental screening during May 2011.82 This information, supplemented by our review of state Medicaid program websites in November 2012, suggests that about 38 state Medicaid programs (three quarters) will pay for developmental and autism screening. Among the states that pay for screens, about half require them. The NASHP survey found that
14 states required screening,
18 states did not require screening but paid for them,
7 states, including Washington, did not require or pay for screening;
11 states did not respond. Our review of state websites suggests that half of the states that did not respond to the NASHP survey pay for screening. The Affordable Care Act and HRSA regulations, as noted above, require private health plans
80
Kenny & Pelletier, 2010 81
Washington State Department of Early Learning & Berk and Emerald Consulting. (2011, September). Early support for infants & toddlers cost study. Olympia, WA: Author. 82
National Academy for State Health Policy. (2011). State Medicaid policies that require and reimburse for developmental screening. See http://nashp.org/sites/default/files/ abcd/ABCDresources.org/abcd3.devscreeningmap.052011.pdf
established after March 2010 to comply with Bright Futures guidelines. Grandfathered private plans are not required, though some have opted to do so. Nationally, according to the AAP, about half of the Blue Cross Blue Shield plans pay for developmental screening. United Healthcare, the largest carrier in the U.S., covers developmental and autism screening with no frequency limit. In Washington, Regence Blue Shield does pay for screening and extended developmental testing.83 Group Health does not use formal developmental screens such as the ASQ or MCHAT. The company has added questions to their electronic medical record for pediatricians to screen for developmental issues.
HEALTH OUTCOMES AND COST EFFECTIVENESS
This section reviews the evidence on the effects of screening, the efficacy of therapies for autism and other developmental conditions, and cost effectiveness.
Screening and Outcomes
The accuracy and feasibility of screening instruments have been discussed above. The effectiveness of treatments will be discussed further below. In this section, we assess the evidence for the direct relationship between screening and patient outcomes. Moyer and Butler (2004), in an often cited but now dated study, searched the literature for randomized and controlled nonrandomized trials of the effects of developmental screening on outcomes.84 They found no relevant studies. King and colleagues (2010) more recently concluded that studies have failed to document
83
According to Regence Blue Shield policies effective January 1, 2011, developmental and behavioral assessment for screening purposes are considered an integral part of the pediatric preventive examination and should not be reported separately. Time-intensive, comprehensive developmental testing is eligible for separate reimbursement only if an abnormality has been identified and further testing is required for diagnosis and treatment. A written interpretation and report must be documented in the medical records for claims that include this level of service. 84
Moyer, V. A., & Butler, M. (2004). Gaps in the evidence for well-child care: A challenge to our profession. Pediatrics, 114(6), 1511-1521.

24
a direct link between routine screening and improved child outcomes.85 The Institute requested the Center for Evidence-based Policy (CEbP) at Oregon Health and Science University to search for more recent evidence.86 The CEbP examined two key questions regarding developmental and autism screening.
Do screens (as recommended by Bright Futures) compared to routine visits identify developmental conditions that would improve patient outcomes through early diagnosis and treatment?
What are the cost implications of early diagnosis and treatment (e.g., healthcare, school readiness, special education) for conditions identified by a developmental screen tool?
A search of the MEDLINE, Cochrane Database of Systematic Reviews, and Cochrane Controlled Trials Register databases was completed for the last 10 years (January 2002–August 2012). The inclusion criteria include systematic reviews, technology assessments, randomized controlled trials, and observational comparative study designs and all relevant economic evaluations, cost-effectiveness analyses, and economic simulation models. Unfortunately, no studies that met inclusion criteria were identified. No published studies have examined the direct link between autism or developmental screening and outcomes for children. None have examined the potential cost savings from earlier treatment.
Autism Treatment Efficacy
Warren and colleagues (2011) reviewed evidence on therapies for children with ASD for the Agency for Healthcare Research and Quality (AHRQ).87 Their review, which included studies
85
King et al., 2010 86
See Ryan et al., 2012, available on the Institute website. 87
Warren, Z., Veenstra-VanderWeele, J., Stone, W., Bruzek, J. L., Nahmias, A. S., Foss-Feig, J. H., … & McPheeters, M. L. (2011, April). Therapies for children with autism spectrum disorders. Comparative Effectiveness Review, 26. Rockville, MD: Agency for Healthcare Research and Quality; and Warren, Z., McPheeters, M. L., Sathe, N., Foss-Feig, J. H., Glasser, A., & Veenstra-VanderWeele, J. (2011). A systematic review of early intensive
published through May 2010, examined behavioral, educational, medical and allied health interventions. The main focus was on early intensive behavioral and developmental interventions. These interventions, which are derived from principles of applied behavior analysis (ABA), include the University of California, Los Angeles (UCLA/Lovass) model, the Early Start Denver Model (ESDM), and less-intensive interventions aimed at teaching behaviors to parents. Conclusions, excerpted from their study, are given below.
Studies have found that the UCLA/Lovass model and ESDM have improved cognitive performance, language skills, and adaptive behavior in some groups of children. The authors conclude, however, that the strength of evidence is low—future research may well change estimates of efficacy.
Less intensive interventions focusing on providing parent training for bolstering social communication skills and managing challenging behaviors have been associated with short-term gains in social communication and language use. The evidence, however, does not permit firm conclusions regarding effects.
Among educational interventions, studies have shown that the Treatment and Education of Autistic and Communication related handicapped Children (TEACCH) program has demonstrated improvements in motor skills and cognitive measures. The strength of evidence limited given the number of studies.
Among the medical interventions, there is evidence that medications can help to address challenging behaviors, though the drugs have significant side-effects.
The Washington State Health Technology Assessment Program (HTA) reviewed evidence and approved coverage of early intensive behavioral and developmental intervention using either the UCLA/Lovass model or ESDM. The Health Technology Clinical Committee concluded that “overall, the evidence is insufficient, but two of the most studied ABA
intervention for autism spectrum disorders. Pediatrics, 127(5), e1303-e1311.

25
based interventions: the UCLA/Lovass and ESDM models of early intensive behavioral interventions have some (though still low quality) evidence that show a possible effect on certain outcomes for some individuals with ASD.”88
Autism Therapy Cost-Benefit
Given the high costs associated with caring for children and adults with ASD, studies suggest that early interventions are cost effective. Jacobson, Mulick, and Green (1998) estimated the costs and benefits associated with ABA-based treatments for ASD.89 Benefits accrue from fewer children attending intensive special education and fewer adults requiring income and family support services. Assumptions regarding the efficacy of treatments were derived from outcome studies from late 1980s and 1990s. Applying treatment, education and support service costs, they concluded that benefits far outweighed costs. Some have criticized the study because estimated treatment effects are lower in more recent studies. Peters-Scheffer and colleagues (2012) use more recent evidence to model benefits in their analysis of early intensive behavioral and developmental intervention (EIBI) in the Netherlands.90 According to the authors, EIBI may improve cognitive, adaptive and social functions of children with ASD; some children make substantial progress, while others gain little. The authors focus on school placement as the best efficacy measure. Across studies, after EIBI treatment, 29% of children are placed in regular education, 34% in less intensive special education, and 37% in special education. Based on these findings, they categorize children into three groups: children who
88
Washington State Health Care Authority. (2011). Findings and Coverage Decision: Applied Behavioral Analysis (ABA or ABA Therapy) based Behavioral Interventions for the Treatment of Autism Spectrum Disorder. Olympia: Health Technology Clinical Committee. Retrieved from http://www.hta.hca.wa.gov/ documents/findings_decision_aba.pdf 89
Jacobson, J. W., Mulick, J. A., & Green, G. (1998). Cost–benefit estimates for early intensive behavioral intervention for young children with autism—General model and single state case. Behavioral Interventions, 13(4), 201-226. 90
Peters-Scheffer, N., Didden, R., Korzilius, H., & Matson, J. (2012). Cost comparison of early intensive behavioral intervention and treatment as usual for children with autism spectrum disorder in the Netherlands. Research in Developmental Disabilities, 33(6), 1763-1772.
achieve normal functioning, regular education, adult employment,
participate in less-intensive special education and have reduced dependency, and
participate in intensive education and require adult services.
This categorization drives the estimate for savings from reduced education and adult service needs. The costs of EIBI are high, but the study estimates that savings far exceed these costs. Savings per child from EIBI rather than treatment as usual was estimated to be $1.45 million dollars from age 3 to 65.
Treatment of Developmental Delays
There are a wide range of developmental disabilities and delays. In an earlier Institute report, Lee and Miller (2009) reviewed research on programs for individuals with developmental disabilities.91 Part of the review focused on programs for children with non-specific or various developmental disabilities. They found evidence that some parent support programs significantly improved child cognitive development and parent well-being. In some evaluations, children of supported parents did better on tests of cognitive development, and parents reported feeling less depressed and anxious. Evaluations of group-based parent training found significant reductions in problem behavior. The evidence review in this report focuses on the treatment of speech and language delays. These delays account for the bulk of developmental diagnoses among toddlers.92 Speech and language development is a useful indicator of a child’s overall development and cognitive ability and is related to school success. Preschoolers with speech and language delay may be at increased risk for learning disabilities once they reach school, exhibit poor reading
91
Lee, S., & Miller, M. (2009). Children and adults with developmental disabilities: Services in Washington, research evidence (Document No. 09-10-3901). Olympia: Washington State Institute for Public Policy. 92
Other interventions used to address developmental issues, including occupational and physical therapy, are beyond the scope of this report.

26
skills, have difficulty with written language, and exhibit more behavioral problems.93 Nelson and colleagues reviewed studies on speech and language delays for the AHRQ.94 Their review included studies published through November 2004. The Institute requested the Center for Evidence-based Policy (CEbP) to conduct a literature search to update the Nelson report.95 Kriz and colleagues were asked to search for new studies addressing key questions regarding treatment outcomes and cost effectiveness.96 The following discussion summarizes the Nelson report and updated findings. Do interventions for speech and language delay improve speech and language outcomes? Nelson and colleagues examined studies that evaluated individual and group therapies, provided by clinicians and parents. They concluded that studies for multiple types of interventions found significant improvement in speech and language outcomes.97 In general, studies were small and reported only short-term outcomes. The updated search by Kriz and colleagues identified 30 additional studies that addressed this question. Overall, many studies reported positive findings in favor of interventions targeting speech and language outcomes and would support Nelson’s overall conclusions. Studies typically contained small sample sizes and had inadequate follow-up timeframes.
93
Nelson et al., 2006 94
Nelson, H., Nygren, P., Walker, M., & Panoscha, R. (2006, February). Screening for speech and language delay in preschool children. Report prepared for the Agency for Healthcare Research and Quality at the Evidence-based Practice Center, Oregon Health and Science University; in addition to their AHRQ report, Nelson and colleagues published a summary article in Pediatrics (Nelson et al., 2006). 95
Kriz, H., Gilbert, J., Thielke, A., Kriz, H., & King, V. (2012). Screening for speech and language delay in preschool children—Updated literature search. Portland, OR: Center for Evidence-based Policy, Oregon Health and Science University; this CEbP report is also available on the Institute website. 96 This search, including studies published through October 2012,
retrieved 1,150 unique citations. Thirty-one studies met inclusion criteria. 97
Improvements were found in several domains including: articulation, phonology, expressive language, receptive language, lexical acquisition, and syntax.
Given methodological limitations, this conclusion should be interpreted cautiously.98 Do interventions for speech and language delay improve other non-speech outcomes? The Nelson review concluded that improvement in other functional outcomes, such as socialization skills, self-esteem, and improved play themes, were demonstrated in some, but not all, of the studies measuring them. The updated search by Kriz and colleagues found four additional studies that addressed this question.99 Again, findings were mixed, and the studies did not provide strong evidence for improvements in non-speech outcomes. What are cost effectiveness issues? The Nelson review found no studies that addressed this question. The updated search by Kriz identified two articles (Buschmann 2009; Law 2012) that met inclusion criteria. Buschmann used a random control design to evaluate a parent-based intervention program for language delay. Treatment was given to a group of two-year old children with expressive language delay. These children required significantly less treatment for language impairment at age three than did the control group. The reduced need for subsequent treatment made the program cost-effective.100
98
Kriz et al., 2012 99
Glogowska, M., Roulstone, S., Peters, T. J., & Enderby, P. (2006). Early speech-and language-impaired children: Linguistic, literacy, and social outcomes. Developmental Medicine & Child Neurology, 48(06), 489-494; and Lunkenheimer, E. S., Dishion, T. J., Shaw, D. S., Connell, A. M., Gardner, F., Wilson, M. N., & Skuban, E. M. (2008). Collateral benefits of the family check-up on early childhood school readiness: Indirect effects of parents' positive behavior support. Developmental Psychology, 44(6), 1737-1752; and Mendelsohn, A. L., Dreyer, B. P., Flynn, V., Tomopoulos, S., Rovira, I., Tineo, W., ... & Nixon, A. F. (2005). Use of videotaped interactions during pediatric well-child care to promote child development: a randomized, controlled trial. Journal of Developmental and Behavioral Pediatrics, 26(1), 34-41; and Wake, M., Tobin, S., Girolametto, L., Ukoumunne, O. C., Gold, L., Levickis, P., ... & Reilly, S. (2011). Outcomes of population based language promotion for slow to talk toddlers at ages 2 and 3 years: Let’s learn language cluster randomised controlled trial. BMJ, 343(4741), 1-10. 100
Buschmann, A., Jooss, B., Rupp, A., Feldhusen, F., Pietz, J., & Philippi, H. (2009). Parent based language intervention for 2-year-old children with specific expressive language delay: A randomised controlled trial. Archives of Disease in Childhood, 94(2), 110-116.

27
Law reviewed five cost-effectiveness studies for speech and language interventions.101 These studies provide evidence for the relative effectiveness of different speech and language interventions. These are not cost-benefit studies, however, and do not tell us if potential savings outweigh program costs. Two of the studies compared different interventions provided by therapists and three included parent-based interventions. Barnett and colleagues (1988) compared home-based and clinic-based interventions. They concluded that home-based intervention was more efficient.102 Eiserman and colleagues (1990) examined home-based versus clinic-based intervention programs. They found that trained mothers could provide effective therapy to their children, but home-based treatment was more expensive when the value of parent time is included.103 Gibbard and colleagues (2004) also concluded that parent-based treatment was more costly.104 Dickson and colleagues (2009) examined the costs and effects of five interventions—direct-individual therapy, direct-group therapy, indirect-individual therapy, indirect-group therapy, standard therapy. They found no significant differences in effectiveness; indirect therapy was least costly.105
101
Law, J., Zeng, B., Lindsay, G., & Beecham, J. (2012). Cost-effectiveness of interventions for children with speech, language and communication needs (SLCN): A review using the Drummond and Jefferson (1996) 'Referee's Checklist'. International Journal of Language & Communication Disorders, 47(1), 1-10. 102
Barnett, W. S., Escobar, C. M., & Ravsten, M. T. (1988). Parent and clinic early intervention for children with language handicaps: A cost-effectiveness analysis. Journal of Early Intervention, 12(4), 290-298. 103
Eiserman, W. D., McCoun, M., & Escobar, C. M. (1990). A cost-effectiveness analysis of two alternative program models for serving speech-disordered preschoolers. Journal of Early Intervention, 14(4), 297-317. 104
Gibbard, D., Coglan, L., & MacDonald, J. (2004). Cost‐effectiveness analysis of current practice and parent intervention for children under 3 years presenting with expressive language delay. International Journal of Language & Communication Disorders, 39(2), 229-244. 105
Dickson, K., Marshall, M., Boyle, J., McCartney, E., O'Hare, A., & Forbes, J. (2009). Cost analysis of direct versus indirect and individual versus group modes of manual-based speech-and-language therapy for primary school-age children with primary language impairment. International Journal of Language & Communication Disorders, 44(3), 369-381.

28
PART III: IMPLICATIONS FOR EARLY INTERVENTION AND SPECIAL EDUCATION
If Washington Medicaid did implement developmental screening, more young children would be identified with autism and developmental delays. Many of these children would receive early intervention and special education services.
EARLY INTERVENTION
Early Support for Infants and Toddlers (ESIT), administered by the Department of Early Learning (DEL), is Washington’s IDEA, Part C early intervention program for children under the age of three. Between July 1, 2010 and June 30, 2011, the program served 5,600 children at any one time; 10,060 received services throughout the fiscal year.106 IDEA Part C is a payer of last resort and many services are paid for with non-Part C funds. State and local health and education agencies, a child’s public or private insurance, and a child’s family may be required to help finance services.107 In Washington State, ESIT refers to using public and private insurance to help pay for some early intervention services as Family Cost Participation. Funding for early intervention services in Washington during FY2011 totaled about $54 million.108 This included $8.5 million in federal funds administered by DEL and $35 million in special education funds administered by the Office of Superintendent of Public Instruction. Other funding sources included the Division for Developmental Disabilities at Department of Social and Health Services, Medicaid, and the Children with Special Health Care Needs Program at the Department of Health.
106
Washington State Department of Early Learning. (2012, February). Fast facts about ESIT. Olympia, WA: Author. 107
Pelletier, J.E., & Kenney, G. M. (2010, December). Improving the lives of young children: Increasing referrals and follow-up treatment in Medicaid and CHIP. Washington, DC: The Urban Institute. 108
Washington State Department of Early Learning, Fast facts about ESIT, 2012. Note that services are provided from a variety of sources and data are incomplete. Costs and revenues figures are estimates. See the ESIT Cost Study for a discussion (Washington State Department of Early Learning, 2011).
The U.S. Department of Education publishes annual figures for IDEA Part C enrollments. The percentage of population served from birth to 3 years varies across states. Average enrollment rates in 2010-2011 ranged from a low of 1.57% in Georgia, to a high of 6.83% in Massachusetts. Washington, with 2.12% served, ranked 13th from the bottom– 37 states served higher percentages of their infants and toddlers.109 McManus and colleagues (2009) examined early intervention participation across states. They concluded that the overwhelming factor determining participation was state policy regarding eligibility.110 This does not appear to be the case in Washington, because the state has what is described as a broad eligibility policy. Other factors, which they could not measure, included state regulations for developmental screenings through Medicaid and outreach to vulnerable populations.
109
These figures are based the data published by the U.S. Department of Education, Office of Special Education Programs, “Infants and Toddlers Receiving Early Intervention Services in Accordance with Part C,” various years. 110
McManus, B., McCormick, M. C., Acevedo-Garcia, D., Ganz, M., & Hauser-Cram, P. (2009). The effect of state early intervention eligibility policy on participation among a cohort of young CSHCN. Pediatrics, 124(Supplement 4), S368-S374.

29
Exhibit 23 Percentage of Birth to 3 Population Served by IDEA Part C (2010-11)
Source: U.S. Department of Education, Office of Special Education Programs, Data Analysis System (DANS), OMB #1820-0557: "Infants and Toddlers Receiving Early Intervention Services in Accordance with Part C," 2011. Data updated as of July 15, 2012.
Developmental screening in Medicaid would increase referrals to early intervention. The NASHP (2011) survey, discussed above, identified 14 states that required screening in their Medicaid programs; additional states paid for screens, but did not require them. The percentage of young children served in these states is higher and has increased more over time than in Washington (Exhibit 24, right). Studies of screening implementation pilots find that that every 1000 screens yield roughly 85 additional referrals to early intervention.111 Applying this to our estimate of 42,000 children screened annually in Washington suggests that an additional 3,600 Medicaid clients could be referred to ESIT each year. According to these studies, roughly 30% of referrals (1,200) are ultimately deemed eligible for services.
111
King et al., 2010; Kavanagh et al., 2012; and Hix-Small et al., 2007
Exhibit 24 Percentage of Birth to 3 Population Served by
IDEA Part C
Source: WSIPP analysis of U.S. Dept. of Education data
Figures for ‘States Requiring Screening’ are averages across 14 states.

30
To the extent that these children are referred to the early intervention program, funding levels would have to increase or services be rationed. A recent ESIT cost study concludes that the system is not adequately funded.112 Local lead agencies report challenges.
It is difficult to find and retain qualified providers—physical therapists, occupational therapists, and speech therapists/speech pathologists.
Funding has remained the same for several years; costs and demand for services have risen; increased workloads reduce ability to provide adequate services.
Medicaid reimbursement is not available for services to infants and toddlers served by school district providers.
Pelletier and Kenney (2010) write that reimbursement rates and complex billing rules may make it difficult for providers to serve Medicaid enrollees. “Increasing reimbursement rates for specialty care and treatment services, modifying rules that prevent billing for physical and mental health visits on the same day, addressing delays in reimbursement from Medicaid, expanding the types of providers and settings eligible for Medicaid reimbursement are strategies states can use to better align billing and reimbursement rules with the needs of young children.”113
SPECIAL EDUCATION
Special education (IDEA Part B) serves children ages 3 to 21. Children with special needs in Washington receive assistance from the Office of Superintendent of Public Instruction in the following ways.
School districts receive special education funding (state and federal) based on their number of special education students.
Districts that can demonstrate a need for additional funding on behalf of high needs
112
Washington State Department of Early Learning & Berk and Emerald Consulting. (2011, September). Early support for infants & toddlers cost study. Olympia, WA: Author. 113
Pelletier & Kenney, 2010
students or community impact factors can apply for Safety Net funds.
Medicaid reimbursement is available for some services.
The average allocation of state special education funding is currently $4,677 per student. If developmental screening in Medicaid were to have an impact on special education, the largest effects are likely to be among preschool-age children. Screening shifts diagnosis and intervention to younger ages. IDEA Part B served 12,588 children ages 3 to 5 in Washington during 2011. Six percent of these children (878) had autism. The number of children eligible for early intervention (birth to 3), as discussed above, is likely to increase substantially if developmental screening was implemented. However, it is not clear how many of these additional children will continue to require services from ages 3 to 5. Proponents claim that early intervention reduces, but does not eliminate, the need for special education throughout the student’s educational career (grades K-12). Focusing on the potential increase in ASD diagnoses provides a conservative estimate for Part B enrollment impacts. Our analysis suggested that Medicaid screening could identify an additional 400 toddlers with ASD each year. Assuming that these children continue to receive services throughout their preschool years, an additional 1,200 children age 3 to 5 would be served in special education (a 9.5% increase over 2011 enrollment). Given an average allocation of state special education funding of $4,677, this would result in an additional $5.6 million in state spending.

31
ACKNOWLEDGEMENTS
The author gratefully acknowledges helpful assistance from the following:
Dr. Beth Harvey, Washington Chapter of the American Academy of Pediatrics
The Center for Evidence-based Policy at Oregon Health & Sciences University
David Mancuso, Chief, Program Research and Evaluation Section, Research and Data Analysis Division, Washington State Department of Social and Health Services
Barbara Lantz, Manager, Quality and Care Management Section, Washington Health Care Authority
Douglass Gill, Director of Special Education, Office of the Superintendent of Public Instruction
Karen Walker, Administrator, Early Support for Infants and Toddlers, Department of Early Learning
For further information, contact: John Bauer at (360) 586-2783, [email protected] Document No. 13-01-3401r
Washington State Institute for Public Policy
The Washington State Legislature created the Washington State Institute for Public Policy in 1983. A Board of Directors—representing the legislature, the governor, and public universities—governs the Institute and guides the development of all activities. The Institute’s mission is to carry out practical research, at legislative direction, on issues of importance to Washington State.