washington state institute for public policy 2012 how does washington state’s learning assistance...
TRANSCRIPT

August 2012
HOW DOES WASHINGTON STATE’S LEARNING ASSISTANCE PROGRAM IMPACT STUDENT OUTCOMES?
Final Report
Washington State
Institute for Public Policy
110 Fifth Avenue Southeast, Suite 214 PO Box 40999 Olympia, WA 98504-0999 (360) 586-2677 www.wsipp.wa.gov
Washington State provides supplemental funding to school districts through the Learning Assistance Program (LAP) to help students at-risk of not meeting state learning standards. The state Quality Education Council (QEC) makes recommendations to the legislature regarding basic education, including LAP. The QEC requested that the Washington State Institute for Public Policy (Institute) study the impact of LAP-funded remediation strategies on student achievement.1 The Learning Assistance Program has been the subject of six other studies since 1995 (see Appendix A). These studies primarily focused on the funding formula the state uses to distribute LAP funds. Most recently, the Institute’s December 2011 preliminary report found that the state’s K–12 data system does not reliably identify which students receive LAP-funded services. In response, the Office of Superintendent of Public Instruction (OSPI) modified district reporting requirements to ensure that LAP students will be identified in state data from 2011-12 and beyond. This final Institute report describes how LAP is implemented in Washington State (Section 1). We also present results from a school-level analysis of the association between LAP and student outcomes (Section 2).
1Specifically, the QEC called for “a research study to
measure the impact of LAP programs on student achievement … to determine what programs and strategies are most effective and efficient in assisting struggling students in the areas of math, literacy, and science, as well as outcome measures for use by policy makers in evaluating program success.” Quality Education Council (2011). Report to the Legislature. January 15, 2011. The Institute provides research support to the QEC under a legislative assignment (HB 1087 § 610 (4), 2011). This project was approved by the Institute’s Board of Directors.
Summary
Washington State’s Learning Assistance Program (LAP) is a funding stream for school districts to offer remediation to underachieving students. In 2010-11, the state allocated $140 million for LAP (about 1% of total state and federal K–12 spending). The money was distributed to 56% of Washington public schools and served 12% of public K–12 students in 2010-11.
LAP primarily pays for teachers and instructional aides to provide tutoring, small group instruction, and extended learning time. Educators use assessment tests, teacher feedback, and other measures to identify eligible students. Similar methods are used to evaluate the effectiveness of services at the local level.
The Institute was asked by the QEC to study the impact of LAP-funded remediation strategies on student achievement.
Given that student-level data are presently not available, we cannot determine LAP’s specific effect on individual student achievement. LAP funding data by school, however, are available for 2008-09 to 2010-11, allowing us to approximate the average impact of LAP expenditures on school performance on assessment tests and graduation rates. The results suggest LAP has a similar small, positive impact on student outcomes as K–12 spending in general.
OSPI recently modified K–12 data rules to require districts to report which students receive LAP-funded remediation. By the close of 2015, three years of individual-level data will be available to replicate this analysis with greater precision.
Suggested citation: Pennucci, A., Lemon, M., & Anderson, L. (2012). How Does Washington State’s Learning Assistance Program Impact Student Outcomes? Final Report. (Document No. 12-08-2201). Olympia: Washington State Institute for Public Policy.

2
SECTION 1. HOW IS LAP IMPLEMENTED IN
WASHINGTON SCHOOL DISTRICTS?
This section describes how LAP funds are used in schools throughout Washington State. The information comes from two sources:
iGrants data that school districts submit to OSPI each year (see Appendix B for details);2 and
interviews the Institute conducted with representatives from 30 schools and districts around the state (see Appendix C).3
The following sub-sections describe the allowable uses of LAP funds and variation in services provided, how districts identify eligible students for LAP-funded services, and how districts evaluate their programs.
1A. Allowable Uses of LAP Funds and Services Provided
Washington State distributes Learning Assistance Program (LAP) funds to districts each year. Districts apply to OSPI for approval, and then OSPI allocates the funding based on the percent of low-income students in each district using a formula set by the legislature.4 In 2010-11, the state allocated $140 million for LAP and distributed the money to 282 (out of 295) districts around the state.5 Districts reported that 124,922 students (about 12% of all public school students) received LAP-funded services during this school year. In comparison, in 2010-11, 33% of students in grades 3–8 did not meet standards in reading, and 42% in math.
2 We analyzed all 282 district applications from the 2010-
11 iGrants data for this study. 3 We conducted interviews with teachers, principals, and
administrators from districts and schools across the state. Appendix C describes the interview process, including the sampling strategy, schools and districts included in the sample, and the interview questions. 4 The funding formula has varied over time. Currently,
each district’s kindergarten through 12th
grade full-time equivalent (FTE) enrollment is multiplied by the percent of students eligible for free or reduced priced meals and the per-student allocation ($282.13 in 2010-11). 5 This total reflects the initial allocation. Budget revisions
and carryovers from the previous year put the final budget amount slightly higher.
A 2010 state workgroup estimated that about one-fourth of eligible students receive LAP-funded services.6 The average per-pupil LAP expenditure was $1,380 in 2010-11. LAP represents 1.2% of state and federal K–12 funding in Washington State (see Exhibit 1). We learned from educators that LAP operates in complementary ways with three other major sources of federal and state supplementary assistance: federal Title I, Part A (2.2% of total funds), state and federal special education (12%) and state and federal bilingual programs (1%).7
Exhibit 1 Washington State and Federal K–12 Funding
(Local Funds Not Included)
Seventeen other states operate programs similar to LAP—that is, they allocate supplemental funding for districts to provide remediation for K–12 students. Nine of these states allocate the funding based on poverty rates (as Washington does), and ten allocate the funding based on student performance measures (three use both factors to determine funding amounts). Appendix D provides details about other states’ programs.
6 Pauley, G. (2010). Learning Assistance Program
Technical Working Group Recommendations. Olympia, WA: Office of Superintendent of Public Instruction. 7 Out of $10.3 billion in total state and federal K–12 funding.
OSPI (April 2012). Financial Reporting Summary p. 27-28.
Other basic
education52.5%
LAP, 1.2%
Title 1, Part A, 2.2%
Special education
(state & federal), 12.1%
Bilingual (state & federal),
1.1%
All other K-12
funds 30.9%
Data source: OSPI

3
Supplemental Instruction
67%
Consultant Teachers
12% Grade 8, 11,
and 12 Services
6%
Professional Development
5%
Extended Learning
Time 5%
Indirect 4%
Parent Outreach
1%
In Washington State, districts have discretion to select and implement remedial strategies with LAP dollars. Districts can distribute their LAP funds to all or some school buildings within the district. In 2010-11, 1,273 out of 2,281 schools (56%) received LAP funding. State law allows school districts to allocate LAP funds across six categories of activities:
extended learning time;
special assistance for 8th, 11th and 12th grade students;
professional development;
consultant teachers;
supplemental literacy and math instruction; and
parent outreach.8 Exhibit 2 summarizes the distribution of LAP funds in 2010-11. Variation among districts is detailed in Appendix B. Accelerated Learning Plans. All students served through LAP must have an Accelerated Student Learning Plan (ALP). The plan can be developed for individual students or for a group of students with similar academic needs, and may be combined with other student
8 RCW 28A.165.035 and WAC 392-162-072
achievement plans such as the Title I Parent/Student/Teacher compact.9 The ALPs are intended to set achievement goals, outline the expected roles of students, teachers, and parents, and establish communication procedures with families.10
9 Pauley, G. (2010). Learning Assistance Program
Technical Working Group Recommendations. Olympia, WA: Office of Superintendent of Public Instruction. 10
WAC 392-162-034
Exhibit 2 Statewide Distribution of LAP Funds among
Allowable Categories, 2010-11
Data source: OSPI
Examples of Funding Allocations in Districts
These examples from district program descriptions and interviews with educators across the state illustrate how districts of varying sizes allocate LAP dollars.
A large district’s LAP budget totaled about $3.5 million for over 4,500 students, for an average per-pupil expenditure of $790. The district distributed funds to 38 out of 42 schools for an average allocation of $60,500 per school (ranging from $19,000 to over $300,000). The district allocated funds to all six allowable categories, ranging from $2.3 million in supplemental instruction for “double dose” classes, before and after school tutoring, and supplemental curricula, to $30,000 for 11
th and 12
th grade summer school credit retrieval classes.
A mid-size district’s LAP budget totaled about $487,000 and served 290 students for an average per-pupil expenditure of $1,680. The district distributed $329,000 to five out of six schools, with about half of the funding ($161,000) going to its high school. The district used $438,000 in supplemental instruction to purchase supplies and materials for a “limited pull-out” model and learning labs in reading, writing, and math. $35,000 was dedicated to extended learning time (after-school tutoring with a certificated teacher one day per week).
A small district had a $50,000 LAP budget and served 80 students for an average per-pupil expenditure of $630. The district distributed LAP funds to its two schools. The funds were allocated to four categories, including $42,000 in supplemental instruction (small group tutoring and test preparation) in junior high, $500 in family outreach (a “Math Family Fun Night”) and $5,500 in extended learning time for K-2 summer school.
4
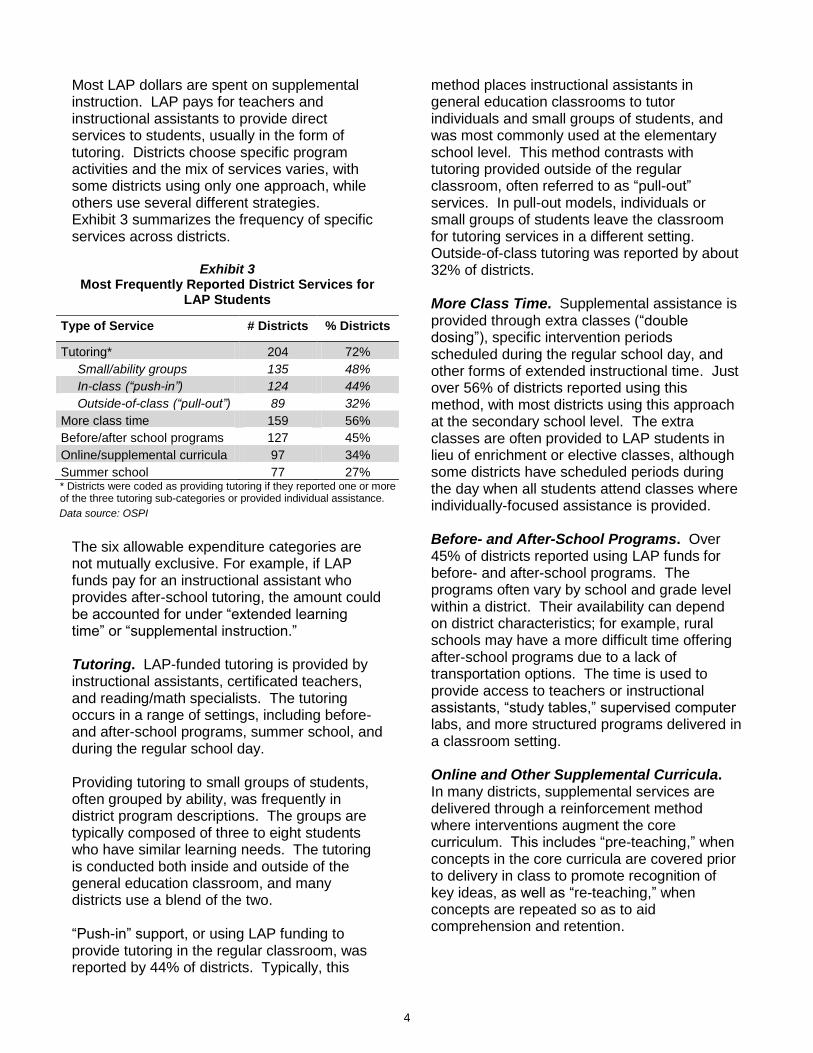
Most LAP dollars are spent on supplemental instruction. LAP pays for teachers and instructional assistants to provide direct services to students, usually in the form of tutoring. Districts choose specific program activities and the mix of services varies, with some districts using only one approach, while others use several different strategies. Exhibit 3 summarizes the frequency of specific services across districts.
Exhibit 3 Most Frequently Reported District Services for
LAP Students
Type of Service # Districts % Districts
Tutoring* 204 72%
Small/ability groups 135 48%
In-class (“push-in”) 124 44%
Outside-of-class (“pull-out”) 89 32%
More class time 159 56%
Before/after school programs 127 45%
Online/supplemental curricula 97 34%
Summer school 77 27% * Districts were coded as providing tutoring if they reported one or more of the three tutoring sub-categories or provided individual assistance.
The six allowable expenditure categories are not mutually exclusive. For example, if LAP funds pay for an instructional assistant who provides after-school tutoring, the amount could be accounted for under “extended learning time” or “supplemental instruction.” Tutoring. LAP-funded tutoring is provided by instructional assistants, certificated teachers, and reading/math specialists. The tutoring occurs in a range of settings, including before- and after-school programs, summer school, and during the regular school day. Providing tutoring to small groups of students, often grouped by ability, was frequently in district program descriptions. The groups are typically composed of three to eight students who have similar learning needs. The tutoring is conducted both inside and outside of the general education classroom, and many districts use a blend of the two. “Push-in” support, or using LAP funding to provide tutoring in the regular classroom, was reported by 44% of districts. Typically, this
method places instructional assistants in general education classrooms to tutor individuals and small groups of students, and was most commonly used at the elementary school level. This method contrasts with tutoring provided outside of the regular classroom, often referred to as “pull-out” services. In pull-out models, individuals or small groups of students leave the classroom for tutoring services in a different setting. Outside-of-class tutoring was reported by about 32% of districts. More Class Time. Supplemental assistance is provided through extra classes (“double dosing”), specific intervention periods scheduled during the regular school day, and other forms of extended instructional time. Just over 56% of districts reported using this method, with most districts using this approach at the secondary school level. The extra classes are often provided to LAP students in lieu of enrichment or elective classes, although some districts have scheduled periods during the day when all students attend classes where individually-focused assistance is provided. Before- and After-School Programs. Over 45% of districts reported using LAP funds for before- and after-school programs. The programs often vary by school and grade level within a district. Their availability can depend on district characteristics; for example, rural schools may have a more difficult time offering after-school programs due to a lack of transportation options. The time is used to provide access to teachers or instructional assistants, “study tables,” supervised computer labs, and more structured programs delivered in a classroom setting. Online and Other Supplemental Curricula. In many districts, supplemental services are delivered through a reinforcement method where interventions augment the core curriculum. This includes “pre-teaching,” when concepts in the core curricula are covered prior to delivery in class to promote recognition of key ideas, as well as “re-teaching,” when concepts are repeated so as to aid comprehension and retention.
Data source: OSPI
5
About 34% of districts reported using LAP money to purchase supplemental curricula, including online or computer-based learning systems, commercially purchased curricula delivered through teachers or instructional assistants, or a combination of the two. One of the most widely reported curricula was READ 180, which is a combination of whole-group instruction, small-group instruction, instructional software, and independent reading time in a rotation format.11 Exhibit B3 (Appendix B) includes a list of some of the supplemental and online curricula funded by LAP. Summer School. Similar to before- and after-school programs, LAP-funded summer school is provided in various ways across the state. Some districts or schools offer a structured, multi-week summer session, while others offer programs like a “Math Camp,” “Summer Academy,” or more informal access to tutoring services during the summer. About 27% of districts reported using LAP funds to support summer school activities.
11
See http://read180.scholastic.com/ for more information.
What Does Research Say about the Effectiveness of LAP-funded Services?
At present, descriptions of LAP services are not linked to individual schools or students, so we were unable to evaluate the relative effectiveness of different remediation strategies implemented with LAP funding. The Institute has, for previous legislative assignments, systematically reviewed the high-quality research literature on some of the most frequently used LAP remediation strategies.12 The research we reviewed provides evidence that the following strategies can improve student outcomes:
one-on-one tutoring;
content-specific professional development;
additional instructional time; and
parent involvement programs.
12
Lee, S., Aos, S., Drake, E., Pennucci, A., Miller, M., & Anderson, L. (2012). Return on investment: Evidence-based options to improve statewide outcomes, April 2012 (Document No. 12-04-1201). Olympia: Washington State Institute for Public Policy.
Examples of LAP-funded Services in Schools
There is considerable variation among districts and schools in the supplemental services provided to students. A few examples from interviews with educators illustrate this variety.
An elementary school adheres to an early intervention philosophy and provides LAP-funded services to students in kindergarten, second, and fifth grade. Kindergarten and second grade students are provided a “pull-out” model, in which an instructional assistant conducts interventions with small groups of students outside the regular classroom. These interventions are in addition to the 90 minutes of instruction students receive in core classes each day. They use the “Read Well” curriculum. For fifth grade students, the school relies on “literature circles” with students in small groups according to reading level. The students are provided instructional materials appropriate for their level.
A middle school uses an “inclusion” or “block” model with assorted classes for students with different needs. LAP students are placed in “targeted” classes which average about 18 students (regular class size averages 28 students). The smaller LAP class size allows for more intensive and tailored instruction. The school also runs a summer school program for incoming LAP-eligible students when funds allow.
A high school uses several different models to provide LAP-funded supplemental instruction. The school provides class periods called “Literacy Lab” and “Math Lab” to students in all grades. The labs use a team-teaching model. The school also offers credit retrieval programs and courses during the regular school day for 11
th and 12
th grade students at risk of not graduating. Finally, the school provides
extended day and year programs, including a mandatory after-school program called “Success First” that meets two times per week. School representatives report that the mandatory nature of this program has increased participation considerably and the attendance rate for targeted students is over 90%. The school also offers a winter break program, an after-school study center, and an after-school learning lab for English language learners.

6
Our review of district program descriptions and the interviews we conducted suggest that LAP funds are frequently used for these activities—tutoring and additional instructional time in particular. For other LAP-funded activities, such as small group instruction, Accelerated Learning Plans, and consultant teachers, we have not yet reviewed the research.13
1B. How Districts Identify Eligible Students for LAP-funded Services
Students are eligible for LAP-funded services if their performance on state or local academic assessments is below standard for mastering basic skills, or if they are 11th and 12th grade students at risk of not meeting state or local graduation requirements.14 Local school districts have discretion in the specific assessment systems they use to identify students for services,15 and there is substantial variation among districts regarding the mix of assessments and other measures they select. Most districts use multiple measures to identify eligible students (Exhibit 4).
Exhibit 4 Average Number of Measures Used to Identify
Students to Receive LAP-funded Services
Level # Districts Average # Measures
Elementary (K-6) 255 3.7
Middle (7-8) 248 3.0
High (9-12) 226 2.9
Over 90% of districts that receive LAP funds use the state assessments (Measures of Student Progress/High School Proficiency Exam) as at least one measure to identify K–12 students in need of remediation. Other common measures include:
13
We have, however, reviewed research that shows that providing mentors to new teachers (similar to consultant teachers) can improve student learning. Pennucci, A. (2012). Teacher compensation and training policies: Impacts on student outcomes. (Document No. 12-05-2201). Olympia: Washington State Institute for Public Policy. 14
WAC 392-162-180 15
WAC 392-162-032, WAC 392-162-025
Measures of Academic Progress (MAP);
Dynamic Indicators of Basic Early Literacy Skills (DIBELS);
teacher recommendations and parent referrals; and
credits earned and GPA (in high schools). Additional details about each method are in Appendix B. Ranking Systems. Many districts report that they prioritize using LAP to help students with the greatest need. Districts use a combination of measures to place students on a rank-order list and generally serve students beginning with the most in need and moving down the list as funds allow. Coordination with Other Programs. To avoid unnecessary overlap among LAP, Title I, special education, and services for English Language Learners, districts report that they carefully coordinate services. Assessment measures are used to determine which funding stream provides the most appropriate services for each individual student in need of assistance. Some students receive services from more than one program. For example, one school noted that a struggling student may receive LAP services for math and special education services for reading, if reading is part of the student’s individualized education plan (IEP) but math is not. Some schools reported that their data systems are helpful in tracking student needs and specific services provided. The Importance of Data Systems. Many educators we interviewed told us that students typically receive LAP services for short periods of time; for example, for a month or two rather than the entire school year. If students show sufficient progress, the LAP resource is shifted to another at-risk student. Some, usually larger, districts have data systems that compile classroom and formative assessment results as soon as they are available. Teachers say the immediate feedback helps them optimize LAP and other supplemental funding streams by quickly identifying who is improving or still
Data source: OSPI

7
Examples of How Schools Identify Students to Receive LAP-funded Assistance
Examples from interviews illuminate how schools identify students for LAP services.
An elementary school uses DIBELS for students in kindergarten and first grade. All students who score in the “intensive” category are eligible for LAP. For grades 4-6, the school uses the MSP; students who score below the 10
th percentile are eligible for LAP services, while students in the 11
th to10
th percentile are placed
on a watch list. Teachers at the school may request that a student be screened if they believe he or she is at-risk for not meeting learning standards.
A junior high school uses the reading MSP and spring MAP results to identify potentially eligible students. Students are listed in rank-order based on assessment results. Those with the lowest scores receive LAP-funded services first and the school tries to improve their skills quickly so they can be moved out of LAP and other students can receive assistance.
A high school uses a two-pronged approach: credit recovery for 11th and 12
th grade students and “on-time
interventions” for 9th and 10
th grade students. The school uses the results of 8
th grade MSP, MAP, and
classroom performance in literacy, math, and core academics to identify eligible students.
One school district uses a six-step process to select students for LAP:
a) State law is the first filter, so students must be below standard on state assessments. b) The LAP staff meets with teachers to gather clarifying information to identify students in greatest need. c) District-administered diagnostic test results are examined for trends in students’ progress. d) Student attendance records are examined. If poor attendance may indicate homelessness, the school
can consider using federal McKinney-Vento Homeless Assistance funds to help those students. e) Students are assessed to determine if they are having difficulty with language acquisition and may
benefit from assistance through the Transitional Bilingual Instruction Program (TBIP). f) If a student has shown a lack of progress in previous interventions, the district may determine that the
student may be best served through special education.
After all these filters, the district selects students for LAP.
struggling. Several small districts mentioned that their technical capacity to collect and analyze data was limited and expressed a need for more assistance in this area.
1C. How Districts Evaluate LAP-funded Services
Districts are required to submit information annually to OSPI on “How a program evaluation will be conducted to determine direction for the following school year.”16 A review of districts’ responses to this requirement reveals three main components (Exhibit 5) that districts consider when evaluating their LAP programs:
Almost all districts report using student assessment data, usually from the same tests given to initially identify students for services, to evaluate their programs. Districts also consider the number of students served, grade point averages, and credits earned.
16
WAC 392-162-068
Several districts reported using the Accelerated Learning Plans to measure progress toward student goals.
Over half of districts (56%) report using some form of qualitative information, such as stakeholder surveys, meetings, conferences, and classroom observations.
A few districts (5%) use measures not directly related to academic performance, such as attendance, disciplinary referrals, and indicators of student engagement, such as interest in particular course offerings.
Exhibit 5
School Districts’ LAP Evaluation Methods
Method # Districts % Districts
Assessment data 253 90%
Survey/qualitative feedback 158 56%
Both assessment and qualitative feedback
140 50%
Non-academic indicators 14 5%
Data source: OSPI

8
Examples of LAP Evaluation in Schools and Districts
An elementary school uses a combination of summative and formative assessments to evaluate on-going student progress. The school uses DIBELS, MAP, and AIMS formative assessments and MSP as a summative measure. Intervention teams meet one to two times per month. District staff meets with grade level and instructional specialists three times per year to review results and adjust intervention strategies. The district has developed benchmark comparisons against demographically and socio-economically similar districts in the state.
A middle school follows a district-developed evaluation system that includes computer-based tracking and data aggregation, which helps in the development of Accelerated Learning Plans (ALPs). The district uses pre- and post-tests to examine the impact of LAP on individual students, while DIBELS and other formative tests provide on-going feedback and allow the district to see a student’s growth over time. The overall program is evaluated through an analysis of assessment data and feedback from parents. The district recently found that parent surveys were not useful due to a low return rate, and has begun to solicit feedback via focus groups, parent-teacher conferences, and other face-to-face meetings.
A high school uses a combination of observations, stakeholder feedback, and close examination of student progress to evaluate their program. LAP-funded classes are observed multiple times by building principals, district administrators, and the superintendent. Administrators review schools’ benchmark assessments, pre- and post-assessments, standardized tests, teacher observations, grades, and attendance. The district also conducts a survey, in three languages, of parents each year.

9
SECTION 2. HOW DOES LAP IMPACT STUDENT
OUTCOMES?
Does LAP funding work to improve student outcomes such as test scores and graduation rates? An answer to this question can only be approximated at this time due to constraints in the state's data system. Our original study plan aimed to measure how LAP funding impacts the outcomes of students who receive remediation services. However, state data do not indicate which grade levels or students get LAP-funded services within each school. Therefore, we use school-level rates to measure student outcomes. We would not expect school-level rates to change substantially based on services provided to a relatively small proportion of students (12%). In the available data, any potential impact of LAP is mixed with other students’ outcomes. If individual-level data were available, the outcome of students served with LAP funds could be directly compared with similar students in schools that do not receive LAP funds. Exhibit 6 helps illustrate this issue. Following the Institute’s December 2011 preliminary report, OSPI modified the K–12 data system to ensure that individual-level data will be available for analysis beginning with the 2011-12 school year. When three years of student-level data are available, a more precise estimate of the impact of LAP can be made. If OSPI takes an additional step to link standard program descriptions to every school that receives LAP funding, a follow-up analysis could also examine the relative impact of different remedial strategies. The OSPI Title I/LAP office plans to begin collecting school-level program data during the 2012-13 school year. By 2015, the necessary data will be in place to answer the specific question posed by the QEC (the effectiveness of different remediation strategies funded by LAP). At present, however, only school-level data are available. In this report, we analyze these "second-best" data to draw approximate inferences about the effectiveness of LAP
funds. The analysis uses Washington State K–12 data for 2008-09 through 2010-11.17 Descriptions of our statistical analysis methods and results follow.
Exhibit 6
School versus Student Level Data
2A. Research Approach
Our methods have been refined since the December 2011 preliminary report was issued. Our preliminary findings were based on a regression analysis that takes into account factors influencing student outcomes at the school level (such as the composition of the student body and teacher workforce). However, there may be other, unobserved influences present in schools, such as school culture or discipline policies. Therefore, here we use what is termed a “fixed effect” regression analysis to estimate the association between LAP funding and student outcomes. While still an approximation using school-level data, this approach allows us to take into account each school’s unique characteristics, including unobserved factors. Technical details of this approach are described in Appendix E.
17
The school characteristics, assessment, graduation, and LAP funding data were provided by OSPI.
LAP
School
Student level:
LAP students can be directly compared with similar students in non-LAP schools
School
level:
LAP and non-LAP student data are mixed together
at-risk students
students not at-risk
Non-LAP
School

10
How “LAP” is Measured. We use per-pupil LAP funding to measure LAP services provided in schools that receive the funding. The amount of LAP dollars a school receives is divided by the total number of students in that school building. If a school does not receive LAP funding, that amount is zero. We assign the per-pupil expenditure dollar amount to each school as a proxy for LAP activities.18 Student Outcomes. Student outcomes are also measured at the school-level: the proportion of students in the school who achieve a particular outcome. The specific measures are:
“Met standard” rates for state reading and math assessments in grades 4–8;19
The percentage of students who score above the most basic level on the state reading and math assessments (above level 1);20 and
On-time (four-year) and extended (five-year) high school graduation rates.
Other Factors. The statistical models also take into account school characteristics measured in available data: the percentage of students by gender, poverty, special education status, English language learner (ELL) status, and race/ethnicity. We include two measures of teacher characteristics typically used in analyses of K–12 outcomes: percent with graduate degrees and average years of
18
This amount represents a lower-end estimate of LAP per-pupil funding because it is based on all students in the school. In practice, LAP funds are used to assist struggling students only. Data on LAP students per school are unavailable (the number of students served by LAP is only reported at the district level). Thus, the school-level analysis uses total school enrollment as the denominator for calculating per-pupil funding (each school building’s total LAP funding divided by the school’s total enrollment). Title I, Part A funding was handled in the same manner. 19
Students “meet standard” if they score high enough (at least a 400 scale score) to be considered proficient in that subject area. In the 2008-09 school year, the statewide assessment was the Washington Assessment of Student Learning (WASL). In 2009-10 and 2010-11, it was the Measures of Student Progress (MSP). Both assessments measure whether students meet the same underlying standards (the Essential Academic Learning Requirements or EALRs). 20
We include the second measure because LAP is intended to serve students at the lower end of the assessment spectrum.
teaching experience. The school’s prior year test score outcome or graduation rate is also included in the analysis. Additionally, as noted, we also included school and year fixed effects.
2B. Student Test Score Results
The statistical models measure the impact of LAP funding on the percentage of students meeting standard, or scoring above basic levels, on the state reading and math assessments—holding other factors constant. Our result suggests that LAP probably has a similar impact on student outcomes as general K–12 spending—a relatively small but positive impact. We recently reviewed the body of evidence—focusing on high quality studies—regarding impacts from changes in per-pupil expenditures on test scores and high school graduation rates. In a forthcoming publication, we find an overall small positive impact: a 10% increase in per-pupil expenditures is associated with a 0.21% improvement in annual student achievement.21 Our final results for LAP fall within the range of findings we estimate from this research literature: a 0.23% improvement in annual student learning per 10% increase in funding. Again, this is only an approximate finding at this time, and a more refined estimate will require the student-level data that is now being collected by OSPI. The state assessment tests, which evaluate students’ mastery of state learning standards, are appropriate measures to evaluate whether LAP funding serves the goals set in legislation: to “[p]romote the use of assessment data when developing programs to assist underachieving students.”22 When individual-level data are available, estimates of the impacts on test scores will be much more precise. To estimate impacts in grades K–2, non-state assessments would need to be used, since the statewide assessment is only given in grades 3–8 and 10.
21
Aos, S., & Pennucci, A. (Forthcoming, 2012 ). K-12 Spending and Student Outcomes: A Review of the Evidence. Washington State Institute for Public Policy. 22
RCW 28A.165.005

11
2C. High School Graduation Results
High school graduation rates, which measure the cumulative impact of 13 years of K–12 resources, are less likely to be affected by a relatively small, short-term funding stream such as LAP. However, since the funding can be used to assist 11th and 12th grade students meet graduation requirements, we examined whether LAP impacts school graduation rates. The high school analysis has mixed results. Schools’ on-time (four-year) graduation rates do not appear to improve with LAP funding, although LAP is associated with slightly higher extended (five-year) graduation rates.
CONCLUSION
Washington State’s Learning Assistance Program (LAP) primarily funds supplemental instruction (tutoring and extended learning time), although how school districts use the money varies across the state. Teachers and administrators use multiple measures to identify students for LAP-funded services. Many educators interviewed for this study noted the usefulness of data systems in targeting services to students most in need of remediation. Given the data presently available regarding the LAP program, we cannot determine its specific effect on individual student achievement. The measured impacts at the school level suggest that LAP has a similar small, positive impact on school outcomes as other funding streams. Recent improvements to the state data system will allow future research to determine whether the impact of LAP is larger than measured here, because the analysis will be able to focus on students who receive LAP services. By the close of 2015, three years of individual-level data will be available to replicate this analysis with more precision.

12
13
APPENDIX A: PRIOR LAP STUDIES
Legislative Budget Committee (now JLARC). (1995). K–12 Learning Assistance Program Fiscal Study (Report 95-2). Olympia, WA: Author.
Office of the Superintendent of Public Instruction. (1999). Report to the Legislature on Funding and Programmatic
Recommendations for the Learning Assistance Program. Olympia, WA: Author. McLain, B., & Miller, M. (2002). The Learning Assistance Program: Options to revise the state funding formula
(Document No. 02-06-2201). Olympia, WA: Washington State Institute for Public Policy. Pauley, G. (2008). Learning Assistance Program in Washington State. Olympia, WA: Office of Superintendent of
Public Instruction. Pauley, G. (2010). Learning Assistance Program Technical Working Group Recommendations. Olympia, WA:
Office of Superintendent of Public Instruction. Pennucci, A. & Anderson, L. (2011). How Does Washington State’s Learning Assistance Program Impact Student
Outcomes? Preliminary Results. (Document No. 11-12-2201). Olympia: Washington State Institute for Public Policy.
Washington State Auditor’s Office. (2010). Learning Assistance Program: 2005-06 through 2007-08 (Report No.
1002985). Olympia, WA: Author.

14

15
APPENDIX B: LEARNING ASSISTANCE PROGRAM DISTRICT-LEVEL DETAILS
Each year, Washington school districts apply for Learning Assistance Program (LAP) funding from the state Office of Superintendent of Public Instruction (OSPI) Title I, Part A, and Learning Assistance Program Office. This appendix summarizes information from district-level descriptions of their LAP-funded activities. Reports from all 282 districts who applied in the 2010-11 school year were analyzed; the information is summarized from the district LAP applications as well as from end-of-year and end-of-summer reports. The Institute reviewed district responses to questions related to budget allocations, services provided, identification of eligible students, and program evaluation. Where applicable, a rubric was created for each section and each district’s response was coded. The information analyzed for each section included:
Budget Allocations: The information in this section was derived from “Page 2: Allowable Expenditures”,
“Page 3: Student Information”, and “Page 4: LAP – Public School Breakdown” of the district applications
(“Form 218”).
LAP Services Provided: The information in this section was derived from question “A” on “Page 1:
Basic Program Elements” and sections one (“Extended learning time opportunities”) and five
(“Supplemental instruction”) on “Page 2” of the district applications. In addition, summer school
information was derived from “Form 247” submitted by participating schools at the end of each summer
session to OSPI. The information regarding services for 11th and 12
th grade students was found in the
end-of-year reports “Form 245” and “Form 247”.
Identification of Eligible Students: The information in this section was derived from question two on
“Page 1” of “Form 218”. A separate rubric was created for each grade span (kindergarten through 6th
grade, 7th and 8
th grades, and 9
th through 12
th grades).
Program Evaluation: The information in this section was derived from question seven on “Page 1” of
“Form 218.”
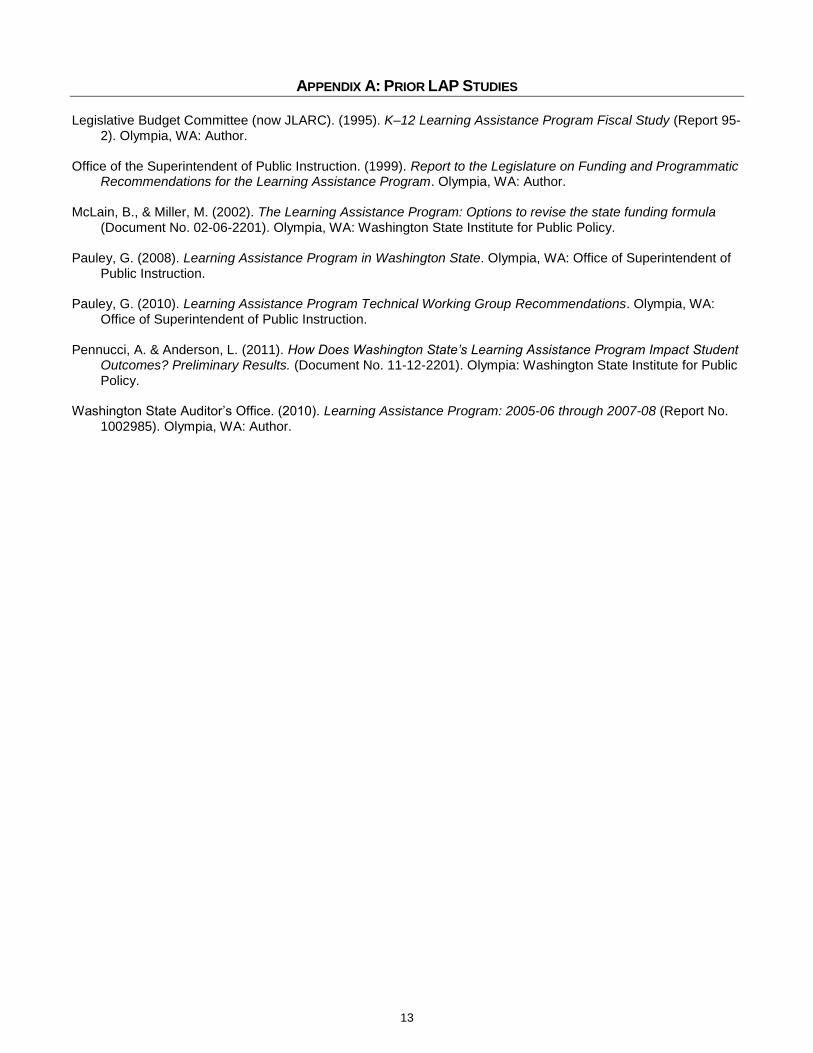
Exhibit B1 displays how each school district that received LAP funding in the 2010-11 school year distributed the funding among the allowable expenditure categories, and Exhibit B2 provides detail about those categories.
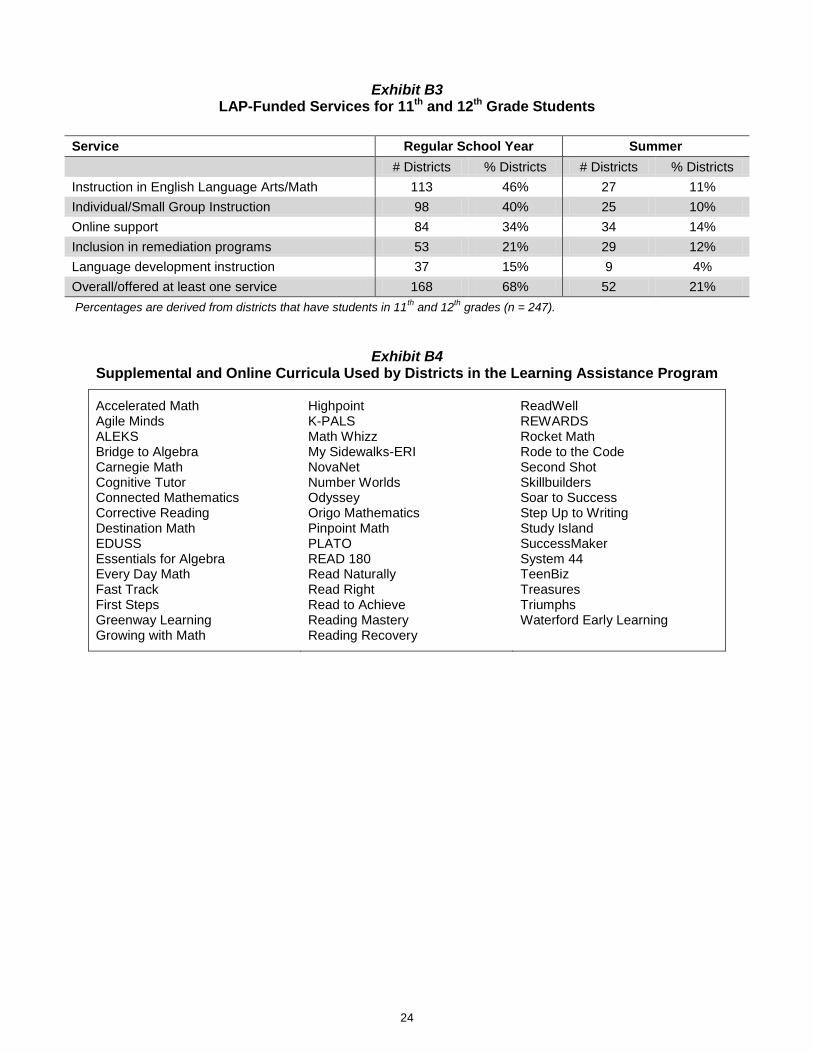
Exhibit B3 provides detail on LAP-funded services provided to 11th and 12
th graders.
Exhibit B4 provides detail on the curricula used by districts for LAP-funded instruction.
Exhibit B5 through B9 provide detail on methods used to identify students eligible for LAP-funded services.
Exhibit B10 displays the questions asked in the district application form (“Form 218”) from 2010-11.

16
Exhibit B1 School Districts’ Distribution of LAP Funding among Allowable Expenditure Categories
(Totals may exceed 100% due to rounding)
District Ext. Time
11/12 Services
Prof. Dev.
Cons. Teacher
Supp. Instruction
Family Outreach
Indirect Costs
Total LAP Budget
Estimate Served
Per-Pupil LAP Expenditure
Aberdeen 1% 12% 0% 0% 85% 0% 3% $726,434 404 $1,798
Adna 40% 0% 0% 0% 58% 0% 2% $52,069 55 $947
Almira 0% 0% 0% 0% 100% 0% 0% $9,123 13 $702
Anacortes 19% 7% 5% 0% 64% 3% 2% $218,123 383 $570
Arlington 8% 0% 0% 0% 90% 0% 3% $356,127 190 $1,874
Asotin-Anatone 11% 34% 3% 0% 44% 0% 7% $43,537 45 $967
Auburn 4% 2% 7% 2% 81% 1% 2% $2,065,251 1,057 $1,954
Bainbridge Island 0% 0% 0% 0% 100% 0% 0% $69,954 161 $434
Battle Ground 4% 8% 13% 17% 54% 2% 3% $1,448,102 1,710 $847
Bellevue 8% 10% 5% 22% 50% 3% 2% $972,095 521 $1,866
Bellingham 0% 14% 1% 14% 68% 0% 3% $1,056,978 260 $4,065
Bethel 1% 9% 1% 53% 33% 0% 4% $1,879,236 1,339 $1,403
Blaine 2% 2% 1% 0% 93% 0% 2% $269,500 163 $1,653
Boistfort 0% 0% 0% 0% 93% 0% 7% $15,912 12 $1,326
Bremerton 10% 15% 2% 7% 61% 0% 4% $1,056,985 420 $2,517
Brewster 0% 8% 4% 0% 85% 0% 3% $362,159 878 $412
Bridgeport 24% 10% 3% 0% 52% 5% 6% $300,466 168 $1,788
Brinnon 0% 0% 0% 0% 91% 0% 9% $7,469 14 $534
Burlington-Edison 3% 12% 2% 4% 73% 1% 5% $452,987 466 $972
Camas 0% 0% 0% 0% 97% 0% 3% $273,405 220 $1,243
Cape Flattery 0% 66% 2% 0% 29% 0% 2% $107,325 53 $2,025
Carbonado 0% 0% 0% 0% 98% 0% 2% $11,958 35 $342
Cascade 0% 3% 0% 0% 88% 6% 3% $161,983 595 $272
Cashmere 0% 5% 0% 0% 91% 0% 4% $220,764 126 $1,752
Castle Rock 10% 8% 13% 0% 66% 1% 2% $208,187 500 $416
Centerville 0% 0% 0% 8% 82% 0% 10% $12,501 10 $1,250
Central Kitsap 1% 0% 1% 1% 92% 0% 5% $883,518 661 $1,337
Central Valley 4% 14% 2% 11% 65% 0% 3% $1,141,984 1,677 $681
Centralia 3% 1% 0% 0% 93% 0% 3% $853,600 1,208 $707
Chehalis 6% 0% 4% 16% 69% 3% 2% $318,287 258 $1,234
Cheney 9% 3% 2% 0% 81% 1% 3% $527,206 1,110 $475
Chewelah 9% 18% 2% 0% 67% 0% 3% $216,842 97 $2,235
Chimacum 25% 1% 1% 26% 43% 1% 4% $160,425 154 $1,042
Clarkston 7% 6% 3% 8% 73% 0% 2% $536,099 750 $715
Cle Elum-Roslyn 0% 5% 7% 0% 82% 0% 6% $83,309 85 $980
Clover Park 13% 0% 13% 0% 67% 1% 5% $3,000,933 1,176 $2,552
Colfax 5% 48% 0% 0% 45% 0% 2% $51,483 48 $1,073
College Place 0% 0% 7% 0% 86% 2% 4% $173,555 117 $1,483
Colton 0% 0% 0% 0% 97% 0% 3% $8,337 6 $1,390
Columbia (Stevens)
6% 17% 0% 0% 74% 0% 3% $70,402 85 $828
Columbia 0% 0% 0% 0% 96% 0% 4% $102,503 130 $788

17
Exhibit B1 School Districts’ Distribution of LAP Funding among Allowable Expenditure Categories
(Totals may exceed 100% due to rounding)
District Ext. Time
11/12 Services
Prof. Dev.
Cons. Teacher
Supp. Instruction
Family Outreach
Indirect Costs
Total LAP Budget
Estimate Served
Per-Pupil LAP Expenditure
(Walla Walla)
Colville 7% 0% 0% 0% 90% 0% 3% $487,131 290 $1,680
Concrete 12% 0% 14% 6% 40% 28% 1% $126,499 385 $329
Conway 0% 0% 0% 0% 100% 0% 0% $34,698 30 $1,157
Cosmopolis 0% 0% 0% 0% 94% 0% 6% $17,662 22 $803
Coulee-Hartline 0% 0% 0% 0% 99% 0% 1% $27,497 10 $2,750
Coupeville 0% 31% 0% 0% 62% 3% 4% $106,047 90 $1,178
Crescent 0% 0% 3% 0% 92% 0% 5% $64,609 69 $936
Creston 0% 0% 0% 0% 91% 0% 9% $13,606 22 $618
Curlew 23% 23% 0% 0% 54% 0% 0% $45,268 100 $453
Cusick 0% 0% 0% 0% 96% 0% 4% $57,942 30 $1,931
Darrington 0% 2% 0% 0% 91% 0% 6% $88,524 60 $1,475
Davenport 0% 7% 0% 0% 91% 0% 2% $100,585 104 $967
Dayton 6% 4% 1% 0% 85% 1% 3% $83,610 58 $1,442
Deer Park 1% 23% 1% 37% 35% 0% 3% $499,635 820 $609
Dieringer 0% 0% 0% 0% 100% 0% 0% $37,141 55 $675
Dixie 0% 0% 0% 0% 100% 0% 0% $5,868 4 $1,467
East Valley (Spokane)
1% 16% 6% 5% 66% 2% 4% $730,917 336 $2,175
East Valley (Yakima)
0% 17% 12% 3% 64% 0% 4% $438,827 800 $549
Eastmont 2% 13% 2% 15% 60% 6% 4% $1,049,596 1,335 $786
Easton 0% 0% 76% 24% 0% 0% 0% $20,599 63 $327
Eatonville 0% 0% 1% 4% 92% 0% 3% $182,844 180 $1,016
Edmonds 0% 15% 0% 0% 82% 0% 3% $1,461,568 1,194 $1,224
Ellensburg 1% 2% 0% 12% 79% 0% 5% $282,008 282 $1,000
Elma 0% 0% 18% 7% 70% 0% 5% $280,739 148 $1,897
Endicott 0% 0% 0% 0% 95% 0% 5% $10,114 21 $482
Entiat 0% 27% 1% 31% 33% 0% 8% $69,570 322 $216
Enumclaw 11% 6% 2% 0% 78% 1% 2% $344,951 355 $972
Ephrata 0% 0% 1% 5% 91% 0% 4% $345,529 216 $1,600
Everett 5% 3% 1% 2% 86% 0% 4% $1,937,067 1,550 $1,250
Evergreen (Clark) 0% 15% 0% 2% 79% 0% 3% $2,937,945 1,392 $2,111
Evergreen (Stevens)
0% 0% 0% 0% 98% 0% 2% $3,597 20 $180
Federal Way 3% 0% 1% 65% 27% 1% 3% $3,657,501 2,316 $1,579
Ferndale 10% 13% 3% 0% 70% 0% 4% $787,819 779 $1,011
Fife 0% 0% 1% 0% 97% 0% 3% $365,381 151 $2,420
Finley 0% 14% 1% 1% 80% 0% 3% $240,852 90 $2,676
Franklin Pierce 1% 1% 3% 7% 83% 0% 5% $1,672,744 1,010 $1,656
Freeman 0% 0% 0% 0% 97% 0% 3% $48,926 118 $415
Garfield 0% 0% 0% 0% 94% 0% 6% $15,299 15 $1,020
Glenwood 0% 0% 0% 0% 96% 0% 4% $6,706 39 $172

18
Exhibit B1 School Districts’ Distribution of LAP Funding among Allowable Expenditure Categories
(Totals may exceed 100% due to rounding)
District Ext. Time
11/12 Services
Prof. Dev.
Cons. Teacher
Supp. Instruction
Family Outreach
Indirect Costs
Total LAP Budget
Estimate Served
Per-Pupil LAP Expenditure
Goldendale 0% 0% 1% 0% 96% 0% 3% $194,248 328 $592
Grand Coulee Dam
17% 17% 4% 0% 56% 1% 5% $142,770 218 $655
Grandview 5% 6% 16% 12% 53% 2% 5% $1,236,043 2,157 $573
Granger 4% 5% 2% 0% 83% 1% 5% $643,652 1,058 $608
Granite Falls 0% 6% 14% 8% 66% 3% 3% $221,171 133 $1,663
Grapeview 0% 0% 0% 0% 100% 0% 0% $20,000 25 $800
Green Mountain 0% 0% 0% 0% 94% 0% 6% $10,188 53 $192
Griffin 0% 0% 0% 0% 95% 0% 5% $34,623 125 $277
Harrington 0% 0% 0% 0% 96% 0% 4% $16,775 55 $305
Highland 2% 0% 6% 0% 87% 0% 5% $338,494 675 $501
Highline 5% 4% 16% 16% 51% 5% 4% $4,080,178 3,200 $1,275
Hockinson 0% 0% 2% 23% 71% 0% 4% $104,110 143 $728
Hood Canal 55% 0% 0% 3% 42% 0% 0% $91,589 116 $790
Hoquiam 0% 16% 4% 0% 77% 0% 4% $422,337 816 $518
Inchelium 0% 0% 2% 2% 90% 0% 6% $56,571 63 $898
Issaquah 0% 0% 2% 0% 98% 0% 0% $386,835 1,460 $265
Kahlotus 0% 0% 0% 0% 95% 0% 5% $11,062 8 $1,383
Kalama 9% 8% 0% 0% 76% 5% 3% $92,318 70 $1,319
Keller 0% 0% 0% 0% 100% 0% 0% $9,281 5 $1,856
Kelso 1% 3% 0% 20% 71% 0% 5% $851,995 889 $958
Kennewick 3% 5% 4% 3% 77% 3% 4% $2,725,169 1,955 $1,394
Kent 3% 1% 14% 9% 66% 3% 5% $3,474,456 4,534 $766
Kettle Falls 0% 12% 0% 0% 78% 8% 2% $209,359 245 $855
Kiona-Benton City 3% 0% 0% 0% 92% 0% 5% $347,748 167 $2,082
Kittitas 0% 0% 0% 0% 97% 0% 3% $102,547 94 $1,091
Klickitat 0% 0% 0% 0% 100% 0% 0% $27,656 109 $254
La Center 4% 20% 1% 0% 72% 0% 3% $118,612 500 $237
La Conner 6% 13% 1% 6% 71% 0% 2% $77,335 75 $1,031
LaCrosse 0% 0% 34% 0% 66% 0% 0% $11,021 47 $234
Lake Chelan 4% 5% 23% 0% 63% 0% 6% $336,268 156 $2,156
Lake Stevens 6% 2% 13% 0% 76% 2% 1% $636,745 332 $1,918
Lake Washington 10% 2% 0% 8% 78% 0% 2% $961,156 363 $2,648
Lakewood 0% 0% 0% 0% 96% 0% 4% $215,821 165 $1,308
Lamont 0% 0% 0% 0% 87% 0% 13% $7,820 11 $711
Liberty 0% 0% 0% 0% 96% 0% 4% $76,440 75 $1,019
Lind 0% 42% 1% 0% 57% 0% 0% $52,239 37 $1,412
Longview 7% 4% 0% 50% 35% 0% 4% $1,211,776 2,891 $419
Loon Lake 0% 0% 0% 0% 100% 0% 0% $95,396 90 $1,060
Lopez 0% 0% 0% 0% 96% 0% 4% $32,054 92 $348
Lyle 0% 7% 0% 0% 90% 1% 2% $78,585 108 $728
Lynden 4% 8% 5% 0% 73% 8% 3% $280,443 276 $1,016

19
Exhibit B1 School Districts’ Distribution of LAP Funding among Allowable Expenditure Categories
(Totals may exceed 100% due to rounding)
District Ext. Time
11/12 Services
Prof. Dev.
Cons. Teacher
Supp. Instruction
Family Outreach
Indirect Costs
Total LAP Budget
Estimate Served
Per-Pupil LAP Expenditure
Mabton 10% 3% 9% 17% 47% 7% 7% $408,706 271 $1,508
Mansfield 0% 1% 1% 0% 97% 0% 0% $23,800 26 $915
Manson 1% 2% 11% 0% 83% 0% 3% $210,293 324 $649
Mary M Knight 0% 70% 10% 0% 16% 0% 4% $36,460 86 $424
Mary Walker 0% 0% 0% 0% 97% 0% 3% $175,377 261 $672
Marysville 2% 1% 1% 7% 83% 0% 5% $1,335,217 660 $2,023
McCleary 7% 0% 0% 0% 92% 1% 0% $51,001 95 $537
Mead 0% 0% 0% 0% 97% 0% 3% $633,480 655 $967
Medical Lake 4% 30% 0% 29% 35% 0% 3% $167,920 138 $1,217
Mercer Island 0% 0% 0% 0% 100% 0% 0% $31,657 8 $3,957
Meridian 0% 44% 2% 0% 44% 0% 9% $157,911 56 $2,820
Methow Valley 0% 0% 0% 0% 97% 0% 3% $72,010 82 $878
Mill A 0% 0% 0% 0% 100% 0% 0% $12,350 45 $274
Monroe 0% 0% 7% 0% 93% 0% 0% $495,418 320 $1,548
Montesano 9% 7% 3% 0% 78% 0% 3% $109,752 89 $1,233
Morton 0% 15% 21% 0% 56% 3% 5% $67,918 151 $450
Moses Lake 6% 16% 5% 2% 68% 1% 3% $1,530,254 1,175 $1,302
Mossyrock 0% 0% 0% 0% 96% 0% 3% $107,473 173 $621
Mount Adams 19% 7% 0% 0% 68% 1% 5% $317,399 700 $453
Mount Baker 0% 9% 0% 0% 89% 0% 2% $381,091 284 $1,342
Mount Pleasant 0% 0% 0% 0% 100% 0% 0% $2,622 16 $164
Mount Vernon 7% 3% 4% 42% 38% 2% 3% $1,531,891 4,634 $331
Mukilteo 9% 14% 2% 0% 70% 1% 4% $2,037,280 1,665 $1,224
Naches Valley 0% 0% 2% 0% 92% 1% 5% $149,127 70 $2,130
Napavine 0% 0% 11% 0% 84% 0% 4% $98,782 122 $810
Naselle-Grays River Valley
5% 0% 0% 0% 94% 0% 2% $52,360 24 $2,182
Nespelem 14% 0% 0% 21% 59% 0% 7% $44,004 252 $175
Newport 10% 2% 1% 2% 84% 0% 2% $232,340 130 $1,787
Nine Mile Falls 0% 0% 2% 0% 96% 0% 2% $106,340 292 $364
Nooksack Valley 0% 5% 0% 0% 92% 0% 3% $310,755 364 $854
North Beach 0% 4% 0% 0% 92% 0% 4% $137,466 120 $1,146
North Franklin 0% 7% 0% 0% 91% 0% 2% $630,150 1,220 $517
North Kitsap 4% 13% 2% 0% 78% 1% 3% $499,440 1,014 $493
North Mason 1% 17% 4% 52% 20% 0% 5% $268,426 177 $1,517
North River 0% 0% 0% 0% 97% 0% 3% $11,718 13 $901
North Thurston 2% 8% 0% 19% 67% 1% 3% $1,308,630 774 $1,691
Northport 18% 2% 1% 0% 74% 0% 4% $114,770 46 $2,495
Northshore 0% 0% 1% 14% 81% 1% 3% $772,766 925 $835
Oak Harbor 2% 14% 0% 0% 80% 0% 4% $564,910 404 $1,398
Oakesdale 0% 58% 9% 0% 28% 0% 5% $11,192 30 $373
Oakville 11% 0% 1% 56% 13% 14% 5% $90,465 159 $569

20
Exhibit B1 School Districts’ Distribution of LAP Funding among Allowable Expenditure Categories
(Totals may exceed 100% due to rounding)
District Ext. Time
11/12 Services
Prof. Dev.
Cons. Teacher
Supp. Instruction
Family Outreach
Indirect Costs
Total LAP Budget
Estimate Served
Per-Pupil LAP Expenditure
Ocean Beach 0% 78% 0% 0% 20% 0% 2% $232,555 157 $1,481
Ocosta 0% 0% 6% 36% 55% 0% 3% $166,318 159 $1,046
Odessa 0% 0% 0% 0% 100% 0% 0% $23,390 60 $390
Okanogan 2% 1% 1% 0% 92% 0% 4% $225,027 356 $632
Olympia 0% 0% 2% 12% 78% 6% 3% $616,415 451 $1,367
Omak 5% 1% 6% 4% 74% 6% 4% $408,702 250 $1,635
Onalaska 15% 9% 2% 16% 56% 0% 3% $169,980 252 $675
Onion Creek 7% 0% 31% 0% 54% 0% 8% $14,759 10 $1,476
Orcas Island 0% 21% 3% 0% 76% 0% 0% $47,275 65 $727
Orchard Prairie 0% 0% 0% 0% 97% 0% 3% $535 4 $134
Orient 23% 0% 22% 0% 48% 0% 7% $51,074 29 $1,761
Orondo 2% 0% 1% 1% 93% 0% 3% $72,375 108 $670
Oroville 3% 37% 0% 0% 57% 0% 3% $177,481 122 $1,455
Orting 5% 2% 3% 54% 29% 2% 4% $186,656 148 $1,261
Othello 6% 3% 3% 10% 72% 3% 3% $1,293,332 1,400 $924
Palisades 12% 0% 0% 0% 82% 0% 6% $10,565 11 $960
Palouse 0% 0% 0% 0% 96% 0% 4% $19,150 57 $336
Pasco 4% 5% 10% 23% 51% 2% 5% $4,249,149 7,250 $586
Pateros 12% 10% 0% 0% 68% 1% 9% $71,082 75 $948
Paterson 10% 0% 0% 0% 90% 0% 0% $30,346 248 $122
Pe Ell 0% 0% 0% 0% 97% 0% 3% $65,861 23 $2,864
Peninsula 2% 25% 3% 3% 63% 1% 2% $591,569 618 $957
Pioneer 0% 0% 0% 48% 52% 0% 0% $128,357 180 $713
Pomeroy 5% 7% 9% 0% 76% 2% 2% $58,128 55 $1,057
Port Angeles 0% 3% 1% 5% 87% 0% 4% $576,310 738 $781
Port Townsend 5% 2% 8% 0% 79% 4% 3% $197,562 151 $1,308
Prescott 15% 1% 2% 0% 74% 1% 7% $89,725 163 $550
Prosser 1% 0% 4% 1% 90% 0% 4% $632,379 637 $993
Pullman 2% 3% 3% 0% 92% 0% 0% $159,856 354 $452
Puyallup 0% 2% 4% 22% 68% 0% 4% $1,579,377 1,175 $1,344
Queets-Clearwater
0% 0% 0% 88% 0% 0% 12% $8,726 50 $175
Quilcene 0% 10% 2% 0% 84% 1% 3% $45,730 31 $1,475
Quillayute Valley 3% 15% 0% 22% 54% 3% 2% $798,385 349 $2,288
Lake Quinault 0% 3% 14% 0% 80% 0% 3% $75,024 76 $987
Quincy 3% 5% 0% 5% 84% 0% 4% $924,558 1,053 $878
Rainier 10% 11% 0% 0% 74% 1% 3% $95,789 125 $766
Raymond 0% 20% 0% 0% 78% 0% 2% $142,860 62 $2,304
Reardan-Edwall 0% 0% 0% 0% 98% 0% 2% $67,883 191 $355
Renton 1% 4% 2% 2% 87% 0% 3% $2,020,421 1,500 $1,347
Republic 2% 2% 10% 0% 82% 0% 4% $76,994 107 $720
Richland 1% 0% 9% 0% 84% 0% 6% $878,959 842 $1,044
21
Exhibit B1 School Districts’ Distribution of LAP Funding among Allowable Expenditure Categories
(Totals may exceed 100% due to rounding)
District Ext. Time
11/12 Services
Prof. Dev.
Cons. Teacher
Supp. Instruction
Family Outreach
Indirect Costs
Total LAP Budget
Estimate Served
Per-Pupil LAP Expenditure
Ridgefield 0% 25% 2% 30% 43% 1% 0% $152,288 87 $1,750
Ritzville 0% 0% 0% 0% 98% 0% 2% $36,861 40 $922
Riverside 5% 27% 1% 13% 50% 0% 4% $289,367 278 $1,041
Riverview 11% 0% 3% 0% 82% 0% 3% $133,739 125 $1,070
Rochester 8% 0% 0% 0% 92% 0% 0% $317,170 593 $535
Rosalia 0% 100% 0% 0% 0% 0% 0% $41,390 30 $1,380
Royal 15% 7% 3% 2% 68% 0% 5% $438,038 810 $541
San Juan Island 0% 0% 0% 0% 95% 0% 5% $81,229 147 $553
Satsop 0% 0% 0% 0% 95% 0% 5% $6,998 9 $778
Seattle 7% 2% 1% 12% 75% 1% 3% $5,145,780 6,792 $758
Sedro-Woolley 5% 4% 1% 6% 79% 6% 0% $566,713 394 $1,438
Selah 7% 7% 3% 10% 69% 0% 4% $372,421 550 $677
Selkirk 0% 0% 0% 0% 97% 0% 3% $57,482 40 $1,437
Sequim 1% 2% 5% 0% 87% 2% 2% $307,451 148 $2,077
Shelton 2% 0% 1% 15% 80% 0% 1% $803,021 430 $1,867
Shoreline 0% 0% 0% 8% 88% 2% 3% $585,483 846 $692
Skamania 0% 0% 0% 0% 100% 0% 0% $12,781 19 $673
Skykomish 0% 46% 0% 0% 46% 0% 9% $8,723 15 $582
Snohomish 0% 11% 11% 11% 63% 0% 4% $495,950 237 $2,093
Snoqualmie Valley 0% 5% 1% 0% 89% 1% 4% $213,252 234 $911
Soap Lake 0% 8% 2% 0% 83% 1% 7% $129,776 500 $260
South Bend 2% 35% 4% 11% 46% 0% 3% $115,729 115 $1,006
Tukwila 5% 5% 0% 24% 59% 0% 6% $1,021,354 893 $1,144
South Kitsap 0% 19% 2% 39% 37% 0% 4% $967,318 874 $1,107
South Whidbey 9% 2% 0% 0% 79% 5% 5% $116,612 135 $864
Southside 0% 0% 5% 0% 89% 1% 5% $22,560 30 $752
Spokane 4% 8% 11% 30% 44% 0% 3% $5,050,535 9,797 $516
Sprague 18% 7% 22% 0% 53% 0% 0% $22,495 22 $1,023
St. John 31% 0% 0% 0% 66% 0% 3% $17,165 24 $715
Stanwood-Camano
0% 0% 0% 0% 96% 0% 4% $335,221 267 $1,256
Steilacoom Hist. 1% 8% 0% 0% 88% 1% 2% $219,010 150 $1,460
Stevenson-Carson 14% 16% 4% 28% 35% 0% 3% $177,784 117 $1,520
Sultan 5% 10% 0% 0% 81% 0% 3% $238,740 141 $1,693
Summit Valley 0% 0% 4% 0% 87% 0% 9% $26,470 33 $802
Sumner 0% 3% 2% 5% 85% 2% 3% $660,112 395 $1,671
Sunnyside 2% 0% 32% 8% 54% 0% 4% $1,964,373 3,117 $630
Tacoma 3% 5% 0% 0% 87% 0% 5% $5,877,409 3,255 $1,806
Taholah 37% 7% 5% 0% 46% 0% 6% $58,717 78 $753
Tahoma 4% 0% 6% 0% 90% 0% 0% $250,590 528 $475
Tekoa 0% 0% 0% 0% 96% 0% 4% $40,817 79 $517
Tenino 4% 5% 0% 0% 87% 2% 2% $134,817 383 $352

22
Exhibit B1 School Districts’ Distribution of LAP Funding among Allowable Expenditure Categories
(Totals may exceed 100% due to rounding)
District Ext. Time
11/12 Services
Prof. Dev.
Cons. Teacher
Supp. Instruction
Family Outreach
Indirect Costs
Total LAP Budget
Estimate Served
Per-Pupil LAP Expenditure
Thorp 0% 47% 0% 0% 45% 0% 8% $22,179 31 $715
Toledo 0% 0% 0% 0% 94% 2% 4% $146,170 84 $1,740
Tonasket 10% 3% 6% 19% 56% 3% 4% $242,022 295 $820
Toppenish 1% 22% 5% 4% 54% 6% 9% $1,449,798 2,576 $563
Touchet 0% 16% 0% 0% 81% 0% 3% $61,986 13 $4,768
Toutle Lake 16% 5% 0% 0% 75% 0% 3% $65,093 256 $254
Tumwater 2% 0% 12% 18% 65% 1% 2% $487,567 320 $1,524
Union Gap 15% 0% 4% 5% 71% 1% 4% $201,347 830 $243
University Place 10% 4% 0% 0% 82% 0% 4% $493,055 380 $1,298
Valley 0% 0% 9% 0% 86% 0% 5% $236,423 165 $1,433
Vancouver 7% 7% 18% 14% 51% 1% 3% $3,676,096 2,200 $1,671
Vashon Island 0% 5% 0% 0% 90% 2% 3% $59,664 83 $719
Wahkiakum 2% 2% 2% 0% 90% 1% 1% $81,599 76 $1,074
Wahluke 3% 3% 13% 17% 54% 4% 6% $938,527 522 $1,798
Waitsburg 0% 0% 0% 0% 96% 0% 4% $38,565 59 $654
Walla Walla 2% 1% 4% 7% 74% 8% 4% $1,110,539 1,027 $1,081
Wapato 4% 7% 0% 6% 78% 0% 6% $1,131,877 4,331 $261
Warden 11% 7% 12% 9% 58% 0% 1% $306,500 541 $567
Washougal 4% 0% 0% 0% 92% 0% 4% $322,644 415 $777
Washtucna 36% 7% 6% 0% 45% 4% 2% $13,931 9 $1,548
Waterville 0% 1% 0% 11% 84% 0% 5% $45,720 55 $831
Wellpinit 0% 44% 0% 0% 52% 0% 5% $196,642 815 $241
Wenatchee 0% 12% 13% 19% 48% 4% 4% $1,400,471 770 $1,819
West Valley (Spokane)
7% 29% 1% 20% 40% 0% 3% $585,056 305 $1,918
West Valley (Yakima)
1% 4% 2% 0% 89% 0% 4% $501,618 938 $535
White Pass 0% 5% 0% 3% 88% 0% 3% $74,525 129 $578
White River 0% 0% 2% 23% 70% 0% 5% $307,867 329 $936
White Salmon Valley
0% 4% 1% 6% 82% 4% 2% $202,202 400 $506
Wilbur 0% 0% 0% 0% 100% 0% 0% $30,459 45 $677
Willapa Valley 11% 0% 2% 0% 84% 1% 3% $50,411 80 $630
Wilson Creek 0% 0% 0% 0% 90% 3% 8% $19,216 22 $873
Winlock 0% 6% 0% 0% 92% 0% 2% $176,658 212 $833
Wishkah Valley 0% 5% 0% 10% 82% 1% 1% $20,910 51 $410
Wishram 0% 0% 0% 0% 99% 0% 1% $24,298 120 $202
Woodland 0% 0% 1% 35% 62% 0% 2% $244,061 381 $641
Yakima 21% 0% 15% 10% 52% 0% 2% $4,966,465 2,500 $1,987
Yelm 0% 6% 0% 0% 90% 0% 5% $525,365 374 $1,405
Zillah 0% 9% 13% 0% 65% 6% 7% $231,409 1,326 $175

23
Exhibit B2 Allowable Spending Categories for LAP Funds
Supplemental Instruction. Supplemental instruction consists of instructional services beyond core classes provided by certificated teachers, instructional assistants, volunteer staff, tutors, or specialists (e.g. reading or math specialists). This category includes individual or small group tutoring, “push-in” or in-class assistance, “pull-out” or out-of-class instruction, supplemental or remedial classes, and other activities. Nearly all (about 99%) districts allocated funds to this category. Extended Learning Time. Extended learning time refers to remediation activities before or after the regular school day, on Saturdays, or beyond the regular school year such as summer school or during scheduled breaks. Activities reported under this category often overlap with “supplemental instruction.” About half (51%) of districts allocated funds to this category in 2010-11. Many districts also offer extended day and year services through other funding streams. Consultant Teachers. Consultant teachers include “teachers-on-special-assignment” (TOSAs), reading and math coaches, and other personnel. The consultants provide coaching, modeling, and training to LAP teachers, coaching, modeling, and training in instructional practices. While this category was not widely used and only 103 districts (37%) allocated funds for this purpose, those districts that did use consultant teachers tended to concentrate funds here relative to other uses, with an average allocation of over 16% in those districts. Special Assistance for 8
th, 11
th and 12
th Grade Students. School districts can use LAP funds to assist 11
th
and 12th grade students at risk of not meeting state or local graduation requirements, as well as 8
th grade
students who need additional assistance for successful entry into high school. Activities in this category include individual or small group instruction, English language arts and math instruction, remediation programs, summer school, language development instruction for English language learners, online curricula, credit retrieval in Grades 11 and 12, and preparatory classes for state assessments. Reading improvement specialists at Educational Service Districts may provide professional development to eighth, eleventh, and twelfth grade educators. These grade-level specific services did not represent a large proportion of LAP spending. However, of the 247 districts that had students enrolled in grades 11 and 12 during the 2010-11 school year, 68% provided at least one service to eligible students during the regular school year, while 21% provided at least one service during the summer (see Exhibit B3). Professional Development. LAP can fund development activities for teachers, instructional assistants, and volunteer staff in areas such as diverse student population needs; specific literacy and math content and instructional strategies; or the use of student work to guide instruction. Most districts did not spend a large share of LAP funding on professional development, and 120 districts did not allocate any funds to this category. In interviews and program descriptions, many district and school staff mentioned the importance of professional development, and noted that professional development is more typically funded by non-LAP sources, such as federal Title II. Family Outreach. Activities in this category promote support and outreach efforts for parents and guardians of LAP students. The specific activities include conferences, open house events, educational literacy classes for parents, and more. Family outreach is the least utilized expenditure category and 159 districts did not allocate any funds for this purpose.
24
Exhibit B4 Supplemental and Online Curricula Used by Districts in the Learning Assistance Program
Accelerated Math Agile Minds ALEKS Bridge to Algebra Carnegie Math Cognitive Tutor Connected Mathematics Corrective Reading Destination Math EDUSS Essentials for Algebra Every Day Math Fast Track First Steps Greenway Learning Growing with Math
Highpoint K-PALS Math Whizz My Sidewalks-ERI NovaNet Number Worlds Odyssey Origo Mathematics Pinpoint Math PLATO READ 180 Read Naturally Read Right Read to Achieve Reading Mastery Reading Recovery
ReadWell REWARDS Rocket Math Rode to the Code Second Shot Skillbuilders Soar to Success Step Up to Writing Study Island SuccessMaker System 44 TeenBiz Treasures Triumphs Waterford Early Learning
Service Regular School Year Summer
# Districts % Districts # Districts % Districts
Instruction in English Language Arts/Math 113 46% 27 11%
Individual/Small Group Instruction 98 40% 25 10%
Online support 84 34% 34 14%
Inclusion in remediation programs 53 21% 29 12%
Language development instruction 37 15% 9 4%
Overall/offered at least one service 168 68% 52 21%
Percentages are derived from districts that have students in 11th
and 12th
grades (n = 247).
Exhibit B3 LAP-Funded Services for 11th and 12th Grade Students

25
Exhibit B5 District Measures Used to Determine Student Eligibility for LAP Services
State Assessments. The state assessments are the Measurements of Student Progress (MSP) and the High School Proficiency Exam (HSPE). These assessments are administered each spring in grades 3–8 (MSP) and grade 10 (HSPE). Over 90% of districts that receive LAP funds use the state assessment as at least one measure to identify students in need of services. Districts or schools who use LAP funding in K–2 rely on other measures; MSP is not administered until 3
rd grade.
Measures of Academic Progress (MAP). The MAP is a commercial assessment system developed by the Northwest Evaluation Association and is used in several districts around the state as a screening and progress monitoring tool. MAP is the most commonly mentioned non-state assessment used to identify students for LAP services across grade levels, with approximately one in three districts reporting its use. This exam is administered three to four times per year, and many districts report using its results to move students in and out of the LAP program on an on-going basis.
Dynamic Indicators of Basic Early Literacy Skills (DIBELS). The DIBELS system is an exam developed by the University of Oregon Center on Teaching and Learning. This assessment is most commonly used to identify struggling learners in grades K–2, but is also used in other elementary grades. About half of districts in the state report using this measure to identify students at the elementary level. Similar to MAP, this assessment is often administered a few times per year to monitor student progress.
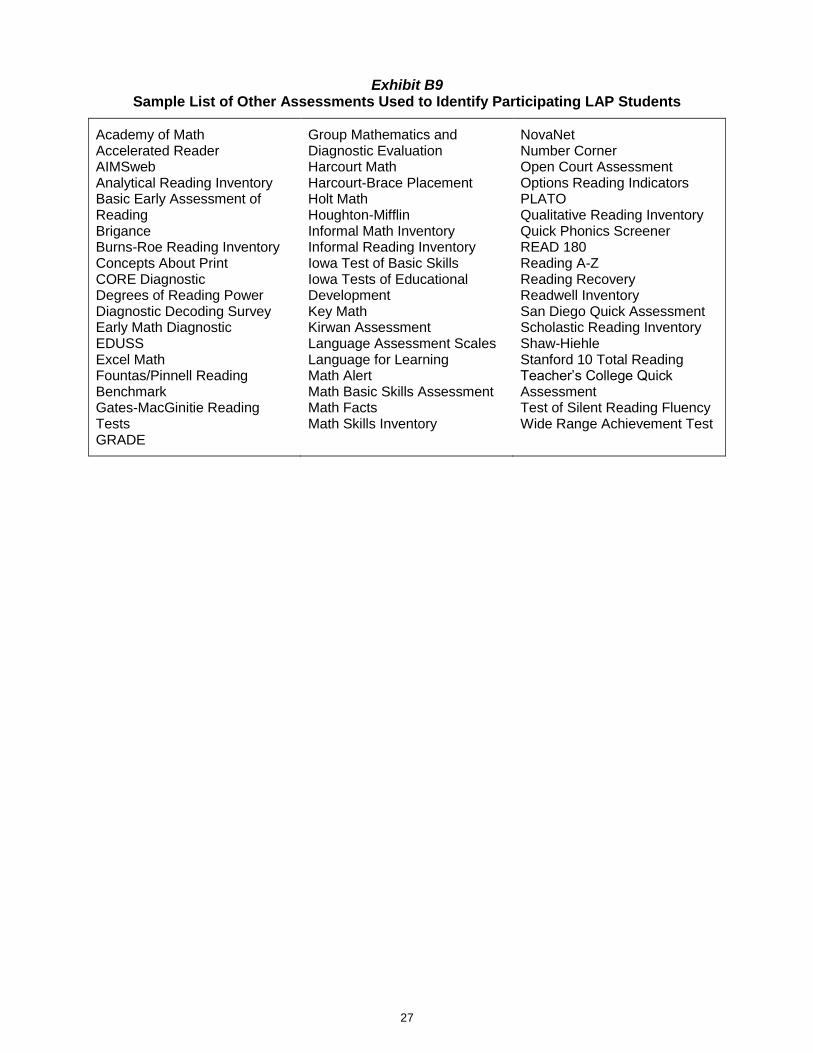
Other Assessments. Districts use a variety of other assessments in addition to the systems already discussed. Sixty-nine percent of districts use one or more other assessments at the elementary level, while about half of districts use other assessments in secondary schools. In most cases, these systems are purchased from commercial vendors, such as the STAR
1 assessments used by 15% of districts at the
elementary level and 10% at the middle school level. Some assessments are developed at the local level or are derived from state standards, such as classroom and curriculum based assessments. A sample list of other assessments used can be found in Appendix B.
Teacher Recommendations and Parental Referrals. Many districts use anecdotal or qualitative data as one way to identify students for LAP-funded services. This can include teacher reports on classroom performance, as well as recommendations by teachers and staff based on behavior, attendance, or other non-academic issues. In addition, several districts consider requests or recommendations from parents. Generally, recommendations are used to identify possible LAP students, and then screening assessments are administered to determine eligibility. Recommendations were mentioned as one measure used in about one-third of districts for elementary and middle schools, and one in five districts for high school.
High School-Specific Measures. Districts can use LAP funds to help grade 11 and 12 students at-risk of not meeting graduation requirements. Current state standards require at least 19 credits to graduate, though many districts have additional credit requirements. Students must also pass the state assessment or an approved alternative.
1 About 27% of districts reported using LAP funds to assist students at-risk of
not graduating due to credit deficiency or other factors, while about 17% reported using specific course grades, GPA, and general classroom performance to identify students in need.
26
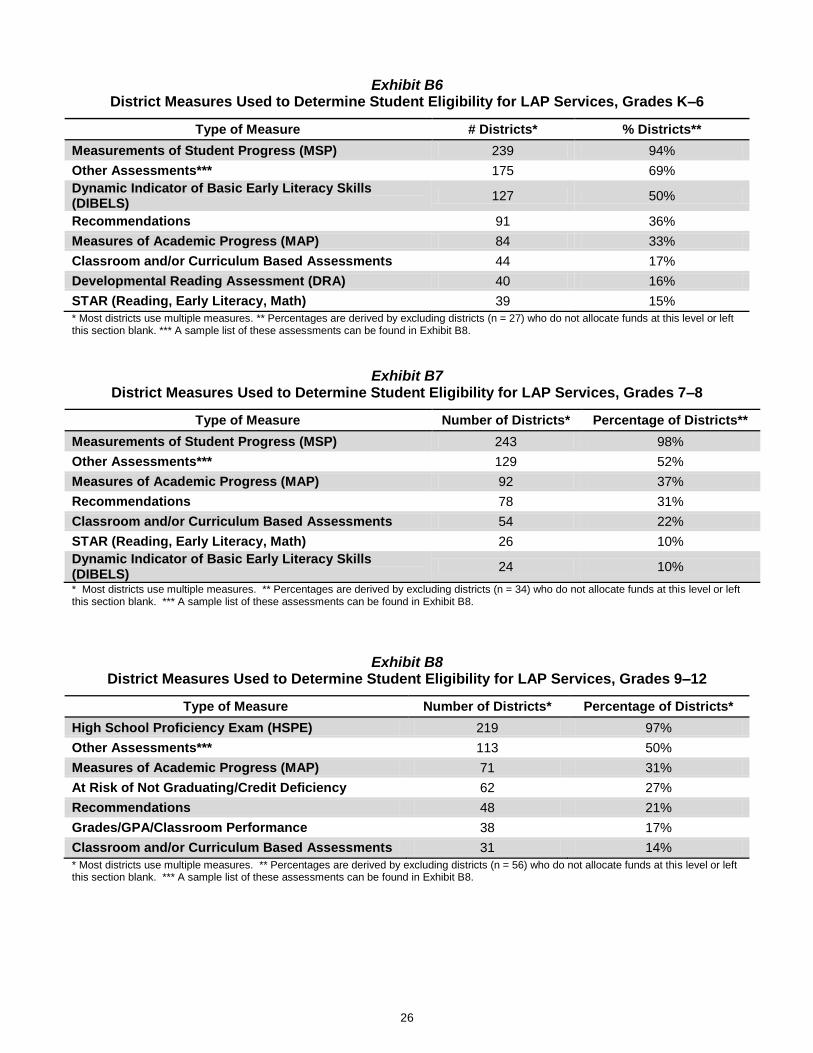
Exhibit B6 District Measures Used to Determine Student Eligibility for LAP Services, Grades K–6
Type of Measure # Districts* % Districts**
Measurements of Student Progress (MSP) 239 94%
Other Assessments*** 175 69%
Dynamic Indicator of Basic Early Literacy Skills (DIBELS)
127 50%
Recommendations 91 36%
Measures of Academic Progress (MAP) 84 33%
Classroom and/or Curriculum Based Assessments 44 17%
Developmental Reading Assessment (DRA) 40 16%
STAR (Reading, Early Literacy, Math) 39 15%
* Most districts use multiple measures. ** Percentages are derived by excluding districts (n = 27) who do not allocate funds at this level or left this section blank. *** A sample list of these assessments can be found in Exhibit B8.
Exhibit B7 District Measures Used to Determine Student Eligibility for LAP Services, Grades 7–8
Type of Measure Number of Districts* Percentage of Districts**
Measurements of Student Progress (MSP) 243 98%
Other Assessments*** 129 52%
Measures of Academic Progress (MAP) 92 37%
Recommendations 78 31%
Classroom and/or Curriculum Based Assessments 54 22%
STAR (Reading, Early Literacy, Math) 26 10%
Dynamic Indicator of Basic Early Literacy Skills (DIBELS)
24 10%
* Most districts use multiple measures. ** Percentages are derived by excluding districts (n = 34) who do not allocate funds at this level or left this section blank. *** A sample list of these assessments can be found in Exhibit B8.
Exhibit B8 District Measures Used to Determine Student Eligibility for LAP Services, Grades 9–12
Type of Measure Number of Districts* Percentage of Districts*
High School Proficiency Exam (HSPE) 219 97%
Other Assessments*** 113 50%
Measures of Academic Progress (MAP) 71 31%
At Risk of Not Graduating/Credit Deficiency 62 27%
Recommendations 48 21%
Grades/GPA/Classroom Performance 38 17%
Classroom and/or Curriculum Based Assessments 31 14%
* Most districts use multiple measures. ** Percentages are derived by excluding districts (n = 56) who do not allocate funds at this level or left this section blank. *** A sample list of these assessments can be found in Exhibit B8.
27
Exhibit B9 Sample List of Other Assessments Used to Identify Participating LAP Students
Academy of Math Accelerated Reader AIMSweb Analytical Reading Inventory Basic Early Assessment of Reading Brigance Burns-Roe Reading Inventory Concepts About Print CORE Diagnostic Degrees of Reading Power Diagnostic Decoding Survey Early Math Diagnostic EDUSS Excel Math Fountas/Pinnell Reading Benchmark Gates-MacGinitie Reading Tests GRADE
Group Mathematics and Diagnostic Evaluation Harcourt Math Harcourt-Brace Placement Holt Math Houghton-Mifflin Informal Math Inventory Informal Reading Inventory Iowa Test of Basic Skills Iowa Tests of Educational Development Key Math Kirwan Assessment Language Assessment Scales Language for Learning Math Alert Math Basic Skills Assessment Math Facts Math Skills Inventory
NovaNet Number Corner Open Court Assessment Options Reading Indicators PLATO Qualitative Reading Inventory Quick Phonics Screener READ 180 Reading A-Z Reading Recovery Readwell Inventory San Diego Quick Assessment Scholastic Reading Inventory Shaw-Hiehle Stanford 10 Total Reading Teacher’s College Quick Assessment Test of Silent Reading Fluency Wide Range Achievement Test

28
Exhibit B10 Example iGrant Application for 2010-2011 School Year
218 Learning Assistance Program Fiscal Year: Milestone: District: Organization Code: ESD: Page 1 Basic Program Elements Chapter 28A.165 RCW requires submission of a district Learning Assistance Program (LAP) plan, which includes any significant changes to a previously submitted and approved application, to OSPI by July 1 of each year. A. Provide a brief description of the district’s Learning Assistance Program (limit 500 words). B. How will the district measure the use of the Learning Assistance Program in improving student achievement (limit 200 words)? (Q.1) Explain district assessment/data trends for the prior three years and describe how the district will use this information to design LAP programs in reading, writing, mathematics, and/or readiness in those subjects. Grades K–6 Grades 7–8 Grades 9–12 (Q.2) Describe the processes used for identifying eligible students to be served by the Learning Assistance Program.
Grades K–6 Grades 7–8 Grades 9–12 (Q.3) Accelerated Student Learning Plans – Indicate if these four required elements are included in the accelerated learning plans. Student achievement goals: Roles of students, parents, teachers: Communication procedures regarding student accomplishment: Review of the learning plan/process for adjustment as needed: (Q.4) Describe how focused and intentional instructional strategies are identified and implemented in the LAP program. (Q.5) Describe how the district will develop and support the most highly qualified instructional staff to work with LAP students in each building. (Q.6) Describe how LAP is coordinated with other state, federal, district, and school resources in the district’s strategic plan and in school improvement plans. (Q.7) Describe the process to be used for evaluating the LAP program plan each year to determine its direction for the following school year. (Q.8) Describe the extended learning opportunities for eligible eleventh and twelfth grade students who are not on track to meet local or state graduation requirements.

29
Page 2 Allowable Expenditures LAP legislation outlines six areas of allowable expenditures. Districts may select any of the categories for delivery of services. Describe how the schools will provide program activities to increase opportunities for student success in meeting state standards for academic achievement. Fill in any of the following that apply. Also indicate amount of the budget allocated to each category in the box to the right.
Description Amount
(1) Extended learning time opportunities occurring before or after the regular school day, on Saturday, and beyond the regular school year:
(2) Services for grades 11 and 12 to provide extended learning opportunities to eligible students which can include, but are not limited to:
Individual or small group instruction;
Instruction in English language arts and/or mathematics needed by eligible students to pass all of part of the WASL;
Inclusion in remediation programs, including summer school;
Language development instruction for English language learners;
Online curriculum and instructional support, including programs for credit retrieval and WASL preparatory classes
(3) Professional development for certificated, classified, and volunteer staff, focusing on (a) the needs of a diverse student population, (b) specific literacy and math content and instructional strategies, (c) the use of student work to guide instruction, (d) utilization of ESD resources:
(4) Consultant teachers (TOSA’s, reading/math coaches, etc.) to assist in implementation of effective instructional practices by teachers serving participating students:
(5) Supplemental instruction (certificated, classified, and volunteer staff, tutors, specialists) to provide additional learning services to low-performing students
(6) Family outreach and support for parents of participating students:
Subtotal:
Indirects (MUST match budget)
Total:
Page 3 Student Information (Grades K–12) Enter the total number of eligible students served by using LAP (head count) data. Head Count:
Select Yes or No Grade Level Number Served
Reading
Math
Language Arts
Readiness
Total Served (Duplicated Count):
Page 4 LAP – Public School Breakdown
Building Name
Building Number
Grade Span
Building Enroll
Y/N LAP Served
LAP Allocation
Y/N Title I Served
Y/N Comment?
Total LAP Allocated:

30
31
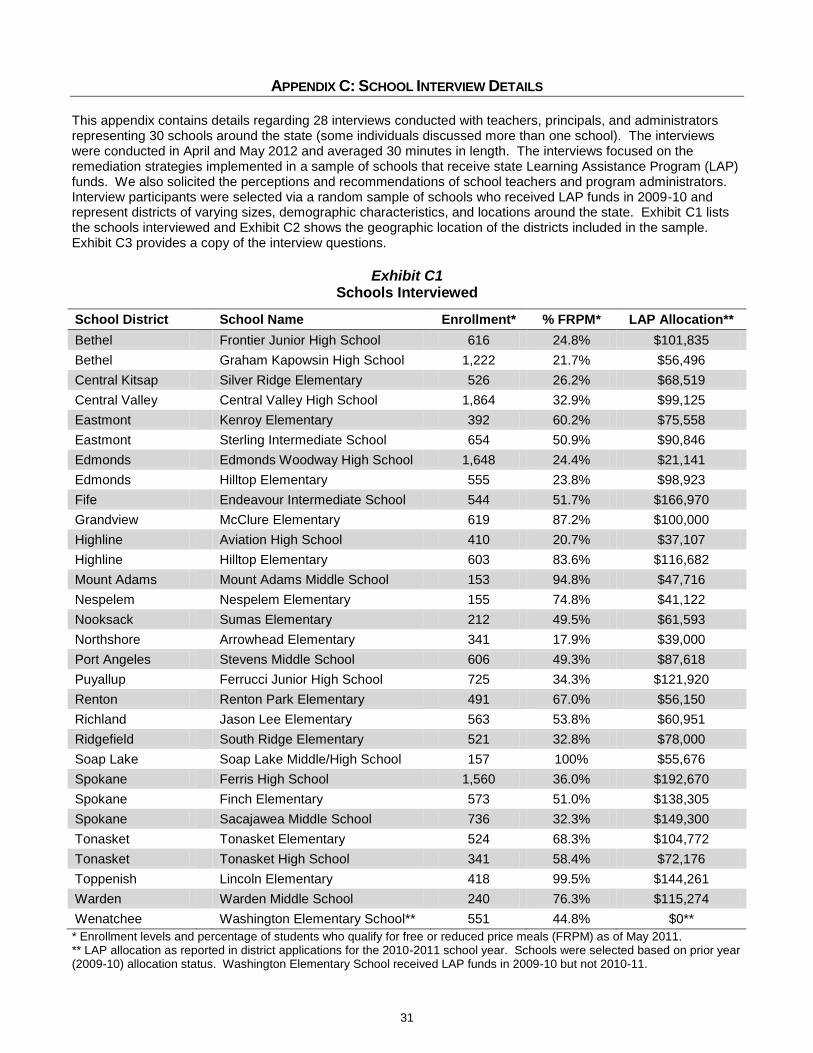
APPENDIX C: SCHOOL INTERVIEW DETAILS
This appendix contains details regarding 28 interviews conducted with teachers, principals, and administrators representing 30 schools around the state (some individuals discussed more than one school). The interviews were conducted in April and May 2012 and averaged 30 minutes in length. The interviews focused on the remediation strategies implemented in a sample of schools that receive state Learning Assistance Program (LAP) funds. We also solicited the perceptions and recommendations of school teachers and program administrators. Interview participants were selected via a random sample of schools who received LAP funds in 2009-10 and represent districts of varying sizes, demographic characteristics, and locations around the state. Exhibit C1 lists the schools interviewed and Exhibit C2 shows the geographic location of the districts included in the sample. Exhibit C3 provides a copy of the interview questions.
Exhibit C1
Schools Interviewed
School District
School Name Enrollment* % FRPM* LAP Allocation**
Bethel
Frontier Junior High School 616 24.8% $101,835
Bethel
Graham Kapowsin High School 1,222 21.7% $56,496
Central Kitsap
Silver Ridge Elementary 526 26.2% $68,519
Central Valley
Central Valley High School 1,864 32.9% $99,125
Eastmont
Kenroy Elementary 392 60.2% $75,558
Eastmont
Sterling Intermediate School 654 50.9% $90,846
Edmonds
Edmonds Woodway High School 1,648 24.4% $21,141
Edmonds
Hilltop Elementary 555 23.8% $98,923
Fife
Endeavour Intermediate School 544 51.7% $166,970
Grandview
McClure Elementary 619 87.2% $100,000
Highline
Aviation High School 410 20.7% $37,107
Highline
Hilltop Elementary 603 83.6% $116,682
Mount Adams
Mount Adams Middle School 153 94.8% $47,716
Nespelem
Nespelem Elementary 155 74.8% $41,122
Nooksack
Sumas Elementary 212 49.5% $61,593
Northshore
Arrowhead Elementary 341 17.9% $39,000
Port Angeles
Stevens Middle School 606 49.3% $87,618
Puyallup
Ferrucci Junior High School 725 34.3% $121,920
Renton
Renton Park Elementary 491 67.0% $56,150
Richland
Jason Lee Elementary 563 53.8% $60,951
Ridgefield
South Ridge Elementary 521 32.8% $78,000
Soap Lake
Soap Lake Middle/High School 157 100% $55,676
Spokane
Ferris High School 1,560 36.0% $192,670
Spokane
Finch Elementary 573 51.0% $138,305
Spokane
Sacajawea Middle School 736 32.3% $149,300
Tonasket
Tonasket Elementary 524 68.3% $104,772
Tonasket
Tonasket High School 341 58.4% $72,176
Toppenish
Lincoln Elementary 418 99.5% $144,261
Warden
Warden Middle School 240 76.3% $115,274
Wenatchee
Washington Elementary School** 551 44.8% $0**
* Enrollment levels and percentage of students who qualify for free or reduced price meals (FRPM) as of May 2011. ** LAP allocation as reported in district applications for the 2010-2011 school year. Schools were selected based on prior year (2009-10) allocation status. Washington Elementary School received LAP funds in 2009-10 but not 2010-11.

32
Exhibit C2 Locations of School Districts with Schools Included in LAP Interviews
Exhibit C3 LAP Interview Questions
1. Often there are more at-risk students than available resources. Which students do you target for LAP
assistance? What is the rationale for focusing on these students?
2. Describe the services that are supported by LAP funds in your school. Why have you chosen to implement
those particular strategies?
3. In your school, how are LAP services coordinated with other supplemental programs (e.g. Title I Part A,
Transitional Bilingual Instructional Program, Special Education)?
4. How do you determine if the LAP-funded strategies in your district/school are effective?
5. If you had additional LAP funding, how would you use it?
6. Do you have any recommendations for policymakers on how to improve LAP?

33
APPENDIX D: OTHER STATE PROGRAMS SIMILAR TO LAP
This appendix presents a summary of state programs similar to the Learning Assistance Program (LAP). Each of the states in Exhibit D1 distributes supplemental funding for school districts to provide struggling students with extra instructional assistance. The information was found on websites of state education departments. Seventeen states besides Washington provide funding streams similar to LAP. Other states offer additional assistance for certain subgroups of students (such as those at risk of dropping out of high school) or run competitive grant programs; those states are not included in the Exhibit.
Exhibit D1 Other State’s Programs Similar to LAP
Funding Allocated by:
State Program Name Low-income
status? Student
performance? Program Purpose
AL Alabama Student Assistance
Plan: State At-Risk X
Develop an assistance program at each school for at-risk students performing below the standards set by the State Board of Education
AR National School Lunch
Student Categorical Funding X
Funds educational support programs for low-income students (eligible for the federal free or reduced price meals).
CA Economic Impact Aid X Supports programs in grades K–12 designed to assist educationally disadvantaged students meet state standards
FL Supplemental Academic
Instruction Program X
Academic intervention and dropout prevention program to provide supplemental strategies such as modified curriculum, reading instruction, and extended day services
GA Early Intervention Program X X
Additional instructional resources to help K-5 students who are below grade level obtain necessary academic skills to reach grade level performance
KS At-Risk Pupil Assistance
Program X
Provides at-risk students additional educational opportunities and instructional services to close the achievement gap
KY Extended School Services
Program X X
Assists students who are having difficulty in one or more content areas with services provided beyond the regular school day
MA Academic Support Services
Program X
For students in grades 8-12 who have not yet passed the 10th grade English language arts, mathematics, and science MCAS tests
MI At-Risk Pupils Program X
Funding to districts for supplementary instructional/ support services for pupils who meet at-risk criteria specified in legislation, incl. low achievement on state assessments
MN Compensatory Education
Revenue X
Used to meet the educational needs of pupils who enroll under-prepared to learn and are not meeting state or local standards or age-appropriate levels
NY Academic Intervention
Services X
For students struggling to meet standards in English language arts and mathematics in K–12 and social studies and science in 4-12.
NC Disadvantaged student supplemental funding
X Meet the educational needs of disadvantaged students not achieving grade level proficiency
OK Reading Sufficiency Act X Ensures that each child attains the necessary reading skills by completion of the third grade.
PA Educational Assistance
Program X
Support for tutoring services for students who do not meet proficiency standards
UT At-Risk Students Program X X To improve achievement of at-risk pupils, low-performance, poverty, limited English proficiency, and mobility.
VA Remediation programs X Programs funded to assist students at risk of not passing the state assessment.

34

35
APPENDIX E: STATISTICAL ANALYSIS METHODS AND RESULTS
This appendix presents results from 18 alternative statistical models we use to estimate the effect of the Learning Assistance Program (LAP) on student outcomes. We use school-level enrollment and assessment data from the Office of Superintendent of Public Instruction (OSPI) report card website for school years 2008-09, 2009-10, and 2010-11.
23 We limit the analysis to these years because these are the only years that school-level LAP funding
data are available. Information about LAP and Title I, Part A funding is from the OSPI Title I, Part A and Learning Assistance Program Office. Ideally, because LAP is designed to assist individual students in need of remediation, an outcomes study would use individual-level data to measure impacts only on those students who got the “treatment.” However, state data do not indicate which grade levels or students get LAP-funded services within each school. Therefore, we use school-level LAP spending and outcomes data. The use of school-level data imposes a significant constraint in the analysis, because one would not expect school-level rates to change substantially based on services provided to a relatively small proportion of students. In the analysis described in this appendix, we make adjustments to our regression coefficients in order to interpret the findings within the context of other K–12 research. We describe the Ordinary Least Squares (OLS) models and then our preferred OLS models with fixed effects (FE). The OLS models do not account for possible omitted-variable bias, while the FE models attempt to take this issue into account.
24
Ordinary Least Squares Estimation The ordinary least squares model (Model 1) takes the following form:
O = f(L, e)
The model estimates school-level student outcomes, O, as a linear function of the amount of LAP per-pupil funding (L) and an error term, e. We analyze school-level assessment outcomes for all Washington public schools that could be classified as an elementary or middle school with at least 50 students who took the state assessment.
25 We also analyze graduation rates for public high schools in Washington State that are not
categorized as “alternative” and include at least 100 students in the graduation rate calculation.26
L represents the amount of LAP funding each building receives, divided by total enrollment in the school and in log form.
27
Outcome Measures. Reading and math school-level student outcomes, O, are defined four ways, with the first two based on test scores (1) the percent of students who “met standard” (scored at least 400 points or above “level 2”) on the statewide assessments; and (2) the percent of students who scored above “basic” or “level 1” on the statewide assessments.
28 The third and fourth outcome measures are graduation rates: (3) the percent of
high school students who graduate “on-time” (within four years) and (4) the percent of high school students who graduate within five years (the “extended” rate). For each of the outcomes, we present three models. In the detailed results table (Exhibit E4), the first column (model 1) presents results from the simple linear relationship between logged LAP per-pupil funding and school-level student outcomes. The second column (model 2) adds a vector of covariates, X, which includes variables typically found in the education research literature and available at the school level for all years included in the analysis. Model 2 takes the following form:
O = f(L, X, e)
23
http://reportcard.ospi.k12.wa.us/DataDownload.aspx 24
Wooldridge, J. M. (2010). Econometric Analysis of Cross Section and Panel Data, 2nd Edition. The MIT Press. 25
In our sample, 29 schools in 2010-11 had less than 50 students who took the reading assessment for the main reading test score analysis. Schools could be classified as elementary or middle schools if their grade spans fell within specified ranges (e.g., K-5, K-6, 6-8, or 7-8). 26
In our sample, 10 high schools in 2010-11 had less than 100 students included in the graduation rate calculation. 27
We use total enrollment (as of October in each school year) as the denominator because we do not know how many students receive LAP-funded services in each school. We also tested the models using total LAP funding for each building, as well as unlogged per-pupil expenditures, and had similar results. 28
We include the second measure because LAP is intended to serve students at the lower end of the assessment spectrum (those struggling to meet state learning standards). In the 2008-09 school year, the statewide assessment was the Washington Assessment of Student Learning (WASL). In 2009-10 and 2010-11, the statewide assessment was the Measures of Student Progress (MSP). The assessments measure whether students meet the same underlying standards (the Essential Academic Learning Requirements or EALRs).

36
Covariates. Covariates for this analysis are: Title I per-pupil funding;29
total school enrollment;30
the percentage of students who are male, eligible for free/reduced price meals, American Indian, African American, Asian, Hispanic, Pacific Islander, an English language learner (in the state transitional bilingual instructional program), or in special education; the percentage of teachers who have a master’s degree or higher; and average years of teaching experience.
31 The reading and math models include the prior year’s met standard rate as an additional
“value-added” control, and the graduation rate models include the prior year’s rate as a control. Exhibits E1 and E2 display the means and standard deviations for all of the variables included in the statistical models.
Exhibit E1 Means and Standard Deviations for Elementary and Middle Schools in the Test Score Analysis
Variable Mean Standard Deviation
Reading percent met standard 69.7 13.3
Reading percent above level 1 91.0 5.8
Math percent met standard 57.7 15.9
Math percent above level 1 77.9 11.6
Prior year reading percent met standard 70.5 12.9
Prior year reading percent above level 1 91.2 5.6
Prior year math percent met standard 57.2 15.8
Prior year math percent above level 1 78.3 11.7
LAP per-pupil funding $103.3 $127.9
Title I per-pupil funding $214.4 $255.6
Total school enrollment 479.3 180.1
Percent male 51.6 2.6
Percent free and reduced price meals 46.5 23.9
Percent American Indian 2.6 6.9
Percent African American 5.7 8.3
Percent Asian 7.9 8.9
Percent Hispanic 17.2 19.3
Percent Pacific Islander 0.9 1.5
Percent English language learners (ELL) 10.3 13.0
Percent in special education 13.8 4.7
Percent of teachers with at least a master’s degree 63.9 13.1
Average years of teaching experience 12.3 2.7
Number of observations = 3,381; Number of schools = 1,127
29
Title I, Part A, per-pupil funding is calculated the same way as LAP per-pupil funding (total building allocation divided by total enrollment, in log form). 30
We also include a squared term for this variable to account for a potentially non-linear relationship. 31
We also include a squared term for this variable to account for a potentially non-linear relationship.
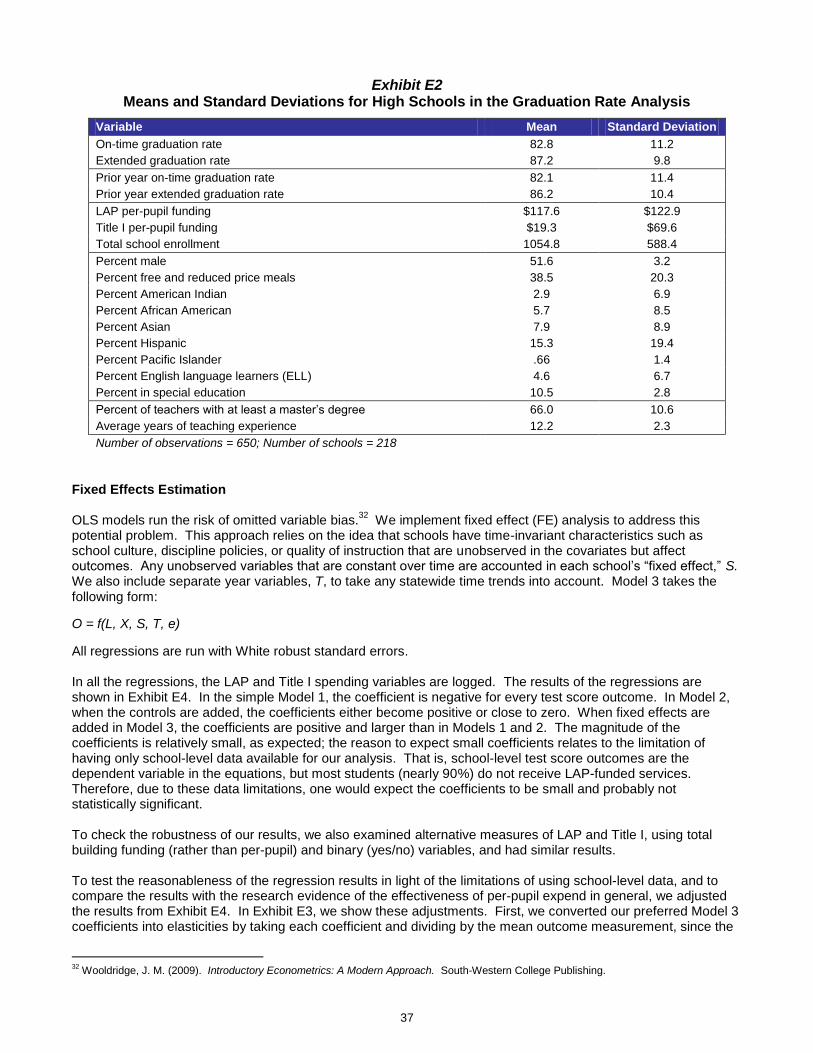
37
Exhibit E2 Means and Standard Deviations for High Schools in the Graduation Rate Analysis
Variable Mean Standard Deviation
On-time graduation rate 82.8 11.2
Extended graduation rate 87.2 9.8
Prior year on-time graduation rate 82.1 11.4
Prior year extended graduation rate 86.2 10.4
LAP per-pupil funding $117.6 $122.9
Title I per-pupil funding $19.3 $69.6
Total school enrollment 1054.8 588.4
Percent male 51.6 3.2
Percent free and reduced price meals 38.5 20.3
Percent American Indian 2.9 6.9
Percent African American 5.7 8.5
Percent Asian 7.9 8.9
Percent Hispanic 15.3 19.4
Percent Pacific Islander .66 1.4
Percent English language learners (ELL) 4.6 6.7
Percent in special education 10.5 2.8
Percent of teachers with at least a master’s degree 66.0 10.6
Average years of teaching experience 12.2 2.3
Number of observations = 650; Number of schools = 218
Fixed Effects Estimation OLS models run the risk of omitted variable bias.
32 We implement fixed effect (FE) analysis to address this
potential problem. This approach relies on the idea that schools have time-invariant characteristics such as school culture, discipline policies, or quality of instruction that are unobserved in the covariates but affect outcomes. Any unobserved variables that are constant over time are accounted in each school’s “fixed effect,” S. We also include separate year variables, T, to take any statewide time trends into account. Model 3 takes the following form:
O = f(L, X, S, T, e)
All regressions are run with White robust standard errors. In all the regressions, the LAP and Title I spending variables are logged. The results of the regressions are shown in Exhibit E4. In the simple Model 1, the coefficient is negative for every test score outcome. In Model 2, when the controls are added, the coefficients either become positive or close to zero. When fixed effects are added in Model 3, the coefficients are positive and larger than in Models 1 and 2. The magnitude of the coefficients is relatively small, as expected; the reason to expect small coefficients relates to the limitation of having only school-level data available for our analysis. That is, school-level test score outcomes are the dependent variable in the equations, but most students (nearly 90%) do not receive LAP-funded services. Therefore, due to these data limitations, one would expect the coefficients to be small and probably not statistically significant. To check the robustness of our results, we also examined alternative measures of LAP and Title I, using total building funding (rather than per-pupil) and binary (yes/no) variables, and had similar results. To test the reasonableness of the regression results in light of the limitations of using school-level data, and to compare the results with the research evidence of the effectiveness of per-pupil expend in general, we adjusted the results from Exhibit E4. In Exhibit E3, we show these adjustments. First, we converted our preferred Model 3 coefficients into elasticities by taking each coefficient and dividing by the mean outcome measurement, since the
32
Wooldridge, J. M. (2009). Introductory Econometrics: A Modern Approach. South-Western College Publishing.
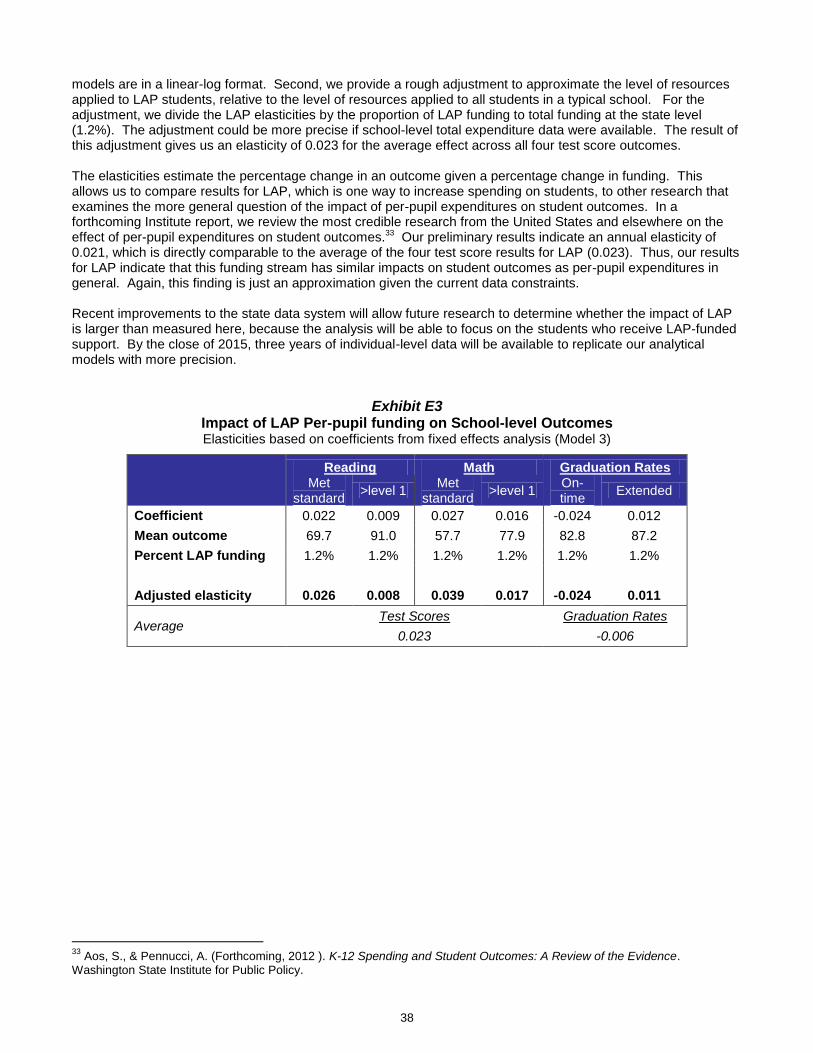
38
models are in a linear-log format. Second, we provide a rough adjustment to approximate the level of resources applied to LAP students, relative to the level of resources applied to all students in a typical school. For the adjustment, we divide the LAP elasticities by the proportion of LAP funding to total funding at the state level (1.2%). The adjustment could be more precise if school-level total expenditure data were available. The result of this adjustment gives us an elasticity of 0.023 for the average effect across all four test score outcomes. The elasticities estimate the percentage change in an outcome given a percentage change in funding. This allows us to compare results for LAP, which is one way to increase spending on students, to other research that examines the more general question of the impact of per-pupil expenditures on student outcomes. In a forthcoming Institute report, we review the most credible research from the United States and elsewhere on the effect of per-pupil expenditures on student outcomes.33 Our preliminary results indicate an annual elasticity of 0.021, which is directly comparable to the average of the four test score results for LAP (0.023). Thus, our results for LAP indicate that this funding stream has similar impacts on student outcomes as per-pupil expenditures in general. Again, this finding is just an approximation given the current data constraints. Recent improvements to the state data system will allow future research to determine whether the impact of LAP is larger than measured here, because the analysis will be able to focus on the students who receive LAP-funded support. By the close of 2015, three years of individual-level data will be available to replicate our analytical models with more precision.
Exhibit E3 Impact of LAP Per-pupil funding on School-level Outcomes Elasticities based on coefficients from fixed effects analysis (Model 3)
Reading Math Graduation Rates
Met standard
>level 1 Met
standard >level 1
On-time
Extended
Coefficient 0.022 0.009 0.027 0.016 -0.024 0.012
Mean outcome 69.7 91.0 57.7 77.9 82.8 87.2
Percent LAP funding 1.2% 1.2% 1.2% 1.2% 1.2% 1.2%
Adjusted elasticity 0.026 0.008 0.039 0.017 -0.024 0.011
Average Test Scores Graduation Rates
0.023 -0.006
33
Aos, S., & Pennucci, A. (Forthcoming, 2012 ). K-12 Spending and Student Outcomes: A Review of the Evidence. Washington State Institute for Public Policy.

39
Exhibit E4 Impact of LAP Funding on School-level Outcomes
Detailed Results from Fixed Effects Models
Reading % Met Standard Reading > Level 1
Model 1: Simple
Model 2: Controls
Model 3: Controls
+ FE
Model 1: Simple
Model 2: Controls
Model 3: Controls
+ FE
Log LAP per pupil funding -0.116*** -0.003 0.022 -0.038*** 0.002 0.009
(0.02) (0.009) (0.017) (0.009) (0.005) (0.009)
Log Title I per pupil funding 0.027** -0.001 0.033*** 0.019
(0.011) (0.026) (0.006) (0.013)
Total enrollment 0.004 -0.001 0.001 -0.009*
(0.003) (0.01) (0.001) (0.005)
Total enrollment2 0.000* 0.000 0.000 0.000
(0) (0) (0) (0)
Prior year results 0.744*** -0.049* 0.591*** -0.113***
(0.016) (0.029) (0.019) (0.032)
Percent male -0.041 -0.025 -0.012 -0.003
(0.042) (0.063) (0.022) (0.034)
Percent free and reduced price meals -0.096*** -0.034 -0.059*** -0.029
(0.011) (0.034) (0.005) (0.019)
Percent American Indian -0.084*** 0.047 -0.103*** -0.042
(0.018) (0.186) (0.014) (0.092)
Percent African American -0.050*** -0.081 -0.051*** -0.036
(0.018) (0.073) (0.012) (0.037)
Percent Asian 0.038*** -0.045 0.004 0.005
(0.015) (0.076) (0.009) (0.034)
Percent Hispanic -0.035*** -0.048 -0.022*** -0.003
(0.012) (0.058) (0.007) (0.031)
Percent Pacific Islander -0.012 -0.172 0.004 -0.181**
(0.078) (0.152) (0.047) (0.086)
Percent ELL -0.004 -0.306*** 0.002 -0.088**
(0.017) (0.08) (0.012) (0.038)
Percent in special education -0.034 -0.268*** -0.051*** -0.203***
(0.024) (0.055) (0.013) (0.033)
Percent of teachers w/ master’s degree -0.003 0.014 -0.012*** 0.002
(0.008) (0.023) (0.005) (0.012)
Average years of teaching experience 0.068 0.125 0.120 -0.200
(0.201) (0.487) (0.102) (0.199)
Average years of teaching experience2 0.000 0.009 -0.003 0.014
(0.008) (0.019) (0.004) (0.009)
Adjusted R2 0.009
0.836 0.892 0.005
0.719 0.838
Number of Schools 1132 1132 1132 1132 1132 1132
Number of Observations 3382 3381 3381 3385 3385 3385
* p < .10, ** p < .05, *** p < .01. Robust standard errors in parentheses.
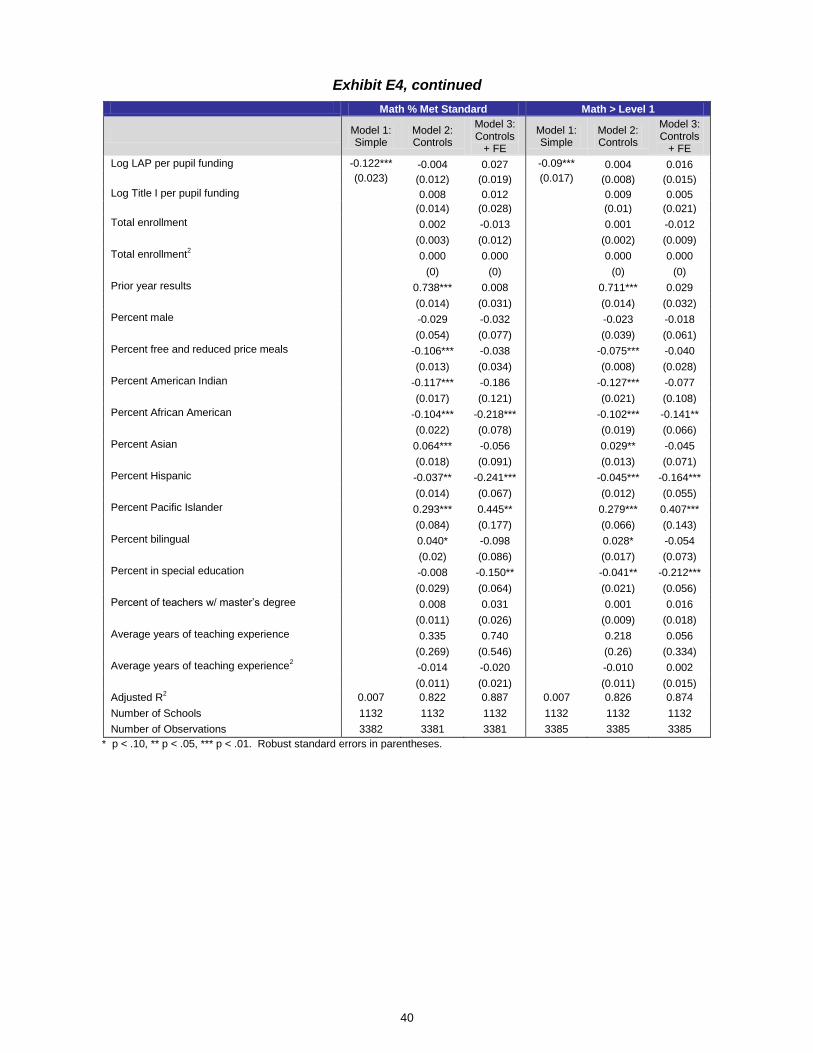
40
Exhibit E4, continued
Math % Met Standard Math > Level 1
Model 1: Simple
Model 2: Controls
Model 3: Controls
+ FE
Model 1: Simple
Model 2: Controls
Model 3: Controls
+ FE
Log LAP per pupil funding -0.122*** -0.004 0.027 -0.09*** 0.004 0.016
(0.023) (0.012) (0.019) (0.017) (0.008) (0.015)
Log Title I per pupil funding 0.008 0.012 0.009 0.005
(0.014) (0.028) (0.01) (0.021)
Total enrollment 0.002 -0.013 0.001 -0.012
(0.003) (0.012) (0.002) (0.009)
Total enrollment2 0.000 0.000 0.000 0.000
(0) (0) (0) (0)
Prior year results 0.738*** 0.008 0.711*** 0.029
(0.014) (0.031) (0.014) (0.032)
Percent male -0.029 -0.032 -0.023 -0.018
(0.054) (0.077) (0.039) (0.061)
Percent free and reduced price meals -0.106*** -0.038 -0.075*** -0.040
(0.013) (0.034) (0.008) (0.028)
Percent American Indian -0.117*** -0.186 -0.127*** -0.077
(0.017) (0.121) (0.021) (0.108)
Percent African American -0.104*** -0.218*** -0.102*** -0.141**
(0.022) (0.078) (0.019) (0.066)
Percent Asian 0.064*** -0.056 0.029** -0.045
(0.018) (0.091) (0.013) (0.071)
Percent Hispanic -0.037** -0.241*** -0.045*** -0.164***
(0.014) (0.067) (0.012) (0.055)
Percent Pacific Islander 0.293*** 0.445** 0.279*** 0.407***
(0.084) (0.177) (0.066) (0.143)
Percent bilingual 0.040* -0.098 0.028* -0.054
(0.02) (0.086) (0.017) (0.073)
Percent in special education -0.008 -0.150** -0.041** -0.212***
(0.029) (0.064) (0.021) (0.056)
Percent of teachers w/ master’s degree 0.008 0.031 0.001 0.016
(0.011) (0.026) (0.009) (0.018)
Average years of teaching experience 0.335 0.740 0.218 0.056
(0.269) (0.546) (0.26) (0.334)
Average years of teaching experience2 -0.014 -0.020 -0.010 0.002
(0.011) (0.021) (0.011) (0.015)
Adjusted R2 0.007
0.822 0.887 0.007
0.826 0.874
Number of Schools 1132 1132 1132 1132 1132 1132
Number of Observations 3382 3381 3381 3385 3385 3385
* p < .10, ** p < .05, *** p < .01. Robust standard errors in parentheses.

41
Exhibit E4, continued
On-time graduation rate Extended graduation rate
Model 1: Simple
Model 2: Controls
Model 3: Controls
+ FE
Model 1: Simple
Model 2: Controls
Model 3: Controls
+ FE
Log LAP per pupil funding -0.186*** 0.003 -0.024 -0.143*** 0.010 0.012
(0.05) (0.027) (0.039) (0.044) (0.031) (0.053)
Log Title I per pupil funding 0.051 -0.073 0.007 -0.116
(0.053) (0.076) (0.061) (0.084)
Total enrollment 0.001 0.000 -0.001 0.010
(0.002) (0.013) (0.002) (0.013)
Total enrollment2 0.000 0.000 0.000 0.000
(0) (0) (0) (0)
Prior year results 0.618*** -0.095 0.498*** -0.110*
(0.039) (0.057) (0.044) (0.062)
Percent male -0.143 0.061 -0.128 0.235
(0.104) (0.203) (0.109) (0.254)
Percent free and reduced price meals -0.064** 0.075 -0.101*** 0.033
(0.031) (0.095) (0.032) (0.097)
Percent American Indian -0.224*** -0.170 -0.196*** -0.508**
(0.067) (0.192) (0.054) (0.237)
Percent African American -0.184*** -0.124 -0.124* -0.170
(0.068) (0.273) (0.075) (0.322)
Percent Asian 0.110** 0.210 0.093** 0.057
(0.044) (0.285) (0.043) (0.286)
Percent Hispanic -0.013 -0.307 0.005 -0.341
(0.036) (0.214) (0.038) (0.259)
Percent Pacific Islander -0.251 -0.219 -0.208 -0.183
(0.348) (0.504) (0.359) (0.587)
Percent bilingual -0.049 -0.165 0.006 -0.143
(0.106) (0.378) (0.114) (0.409)
Percent in special education -0.050 0.148 -0.021 0.331
(0.113) (0.265) (0.118) (0.308)
Percent of teachers w/ master’s degree -0.017 0.078 -0.021 0.092
(0.032) (0.071) (0.031) (0.077)
Average years of teaching experience 0.758 0.951 1.059** 0.843
(0.548) (1.344) (0.531) (1.354)
Average years of teaching experience2 -0.028 -0.030 -0.042* -0.024
(0.023) (0.058) (0.023) (0.058)
Adjusted R2 0.016
0.686 0.807 0.012
0.536 0.69
Number of Schools 218 218 218 218 218 218
Number of Observations 651 650 650 651 650 650
* p < .10, ** p < .05, *** p < .01. Robust standard errors in parentheses.

For further information, contact: Annie Pennucci at (360) 586-3952, [email protected]. Document No. 12-08-2201
Washington State Institute for Public Policy
The Washington State Legislature created the Washington State Institute for Public Policy in 1983. A Board of Directors—representing the legislature, the governor, and public universities—governs the Institute and guides the development of all activities. The Institute’s mission is to carry out practical research, at legislative direction, on issues of importance to Washington State.