washington ground squirrel distribution sampling … · washington ground squirrel distribution...
TRANSCRIPT
WASHINGTON GROUND SQUIRREL DISTRIBUTION SAMPLING
BOARDMAN CONSERVATION AREA
Prepared by
Jeff Rosier
February 2015
The Nature Conservancy
821 SE 14th Avenue
Portland, OR 97214
Table of Contents
Introduction .................................................................................................................................................. 3
Methods ........................................................................................................................................................ 3
Distribution Mapping on the BCA....................................................................................................... 4
Detection dog effectiveness ............................................................................................................... 4
Results........................................................................................................................................................... 7
Distribution Mapping on the BCA....................................................................................................... 7
Detection dog effectiveness ............................................................................................................... 8
Discussion ................................................................................................................................................... 14
Additional WGS monitoring and analyses ........................................................................................ 15
Literature Cited........................................................................................................................................... 18
List of Figures
Figure 1 ......................................................................................................................................................... 5
Figure 2 ......................................................................................................................................................... 6
Figure 3 ......................................................................................................................................................... 7
Figure 4 ......................................................................................................................................................... 9
Figure 5 ....................................................................................................................................................... 10
Figure 6 ....................................................................................................................................................... 11
Figure 7 ....................................................................................................................................................... 12
Figure 8 ....................................................................................................................................................... 13
Figure 9. ...................................................................................................................................................... 17
List of Tables
Table1 .......................................................................................................................................................... 16
3
Introduction
The Boardman Conservation Area (BCA) includes 9163 ha (22,642 ac) of grassland and shrub-steppe
habitat southwest of Boardman, Oregon, owned by Threemile Canyon Farms and managed by The
Nature Conservancy (TNC). Under a Multi-Species Candidate Conservation Agreement (2003; MSCCAA);
developed through a collaborative effort among Threemile Canyon Farms, The Nature Conservancy,
Portland General Electric, the U.S. Fish and Wildlife Service, and the Oregon Department of Fish and
Wildlife; conservation measures are stipulated for several species of concern. Included in these
measures is a requirement that the number and distribution of Washington ground squirrel (Urocitellus
washingtoni; WGS) sites on the BCA be determined through monitoring every two to five years.
WGS distribution mapping on the BCA was initiated in 1999 and completed in 2001. One-hundred and
twenty-nine WGS sites were identified during this initial mapping effort. Subsequent monitoring
consisted of revisiting each site to determine occupancy status, and new sites, identified during the
course of field work, were included in subsequent monitoring efforts. However, given the high cost and
effort of WGS distribution mapping, a complete reassessment of WGS distribution on the BCA has not
been repeated. In an effort to reduce the cost and time involved with distribution mapping TNC
implemented a pilot study in 2009 (Marr 2009) to estimate WGS density as a surrogate for distribution
mapping. A distance-based point and transect sampling scheme at randomly selected points was used
and seven sites were identified along transects during these surveys. The limited results of the 2009
pilot study have prompted us to seek alternative sampling methods to assess the distribution of
Washington ground squirrels more efficiently.
There are three accepted factors used to confirm the presence of WGS: burrows with scat, calls, and
visual observations of animals. Surveys of known WGS sites indicate that most detections are based on
the observation of burrows with scat (Rosier 2013). Given this information, we implemented a pilot
study to evaluate the use of scat detection dogs to map the distribution of WGS in areas outside of
previously identified sites.
Methods
We contracted a detection dog team from the University of Washington’s Center for Conservation
Biology Conservation Canines program to survey WGS habitat on the BCA in the spring of 2014.
Detection dog team training began in Washington State using ground squirrel scat samples from the BCA
provided by TNC. The detection dog was trained to sit at the source of the odor allowing the dog handler
to confirm and record the location of the sample. The dog was rewarded by playing fetch for a brief
period and then instructed to find the next sample. Upon arrival in Boardman the dog team visited
known ground squirrel locations to continue training before beginning surveys. Once the dog handler
confirmed the dog’s ability to detect the specific odor of WGS scat in ambient survey conditions the dog
team began to search the BCA for ground squirrel presence. TNC staff assisted the dog team by
providing maps of the survey area, navigational guidance, and confirmation of the identification of
collected scat. The dog team provided GPS locations of ground squirrel scat detections, GPS track logs
of the areas surveyed by the team, and samples of the ground squirrel scat collected in the field. In
addition to the WGS distribution surveys implemented on the BCA, we also conducted a trial to compare
rates of detection and efficiency of the detection dog team as compared to human observers. This trial
was conducted in conjunction with on-going survey work on the adjacent Naval Weapons Systems
Training Facility Boardman (NWSTF Boardman).
4
Distribution Mapping on the BCA
We used a detection dog team to assess the distribution of WGS outside of known monitoring points on
the BCA in the spring of 2014 (Cotterill 2014). We used 65 ha (160 ac; ¼ section) sampling units for
consistency with prior surveys by Morgan and Nugent (1999). Nearly all of the BCA is considered
potential WGS habitat; however, in order to increase survey efficiency, we eliminated sampling units in
which occupied WGS monitoring points were identified in 2013 surveys (Rosier 2013; Fig. 1). Occupied
sites were buffered by 300m and intersecting sampling units were removed from the survey area. The
300m buffer was selected based on findings from telemetry space-use studies and field observations
which indicate much of the annual WGS activity is concentrated within 300m of an activity site (Delavan
2008, Marr 2009). Detection dogs depend on wind-born scent to find the target, thus they are most
efficient when sampling large areas (i.e. 100 ha (≥ 247 ac); H. Smith, Conservation Canines, personal
communication). To accommodate the use of detection dogs we surveyed two sampling units (130 ha
(320 ac)), a sampling block, simultaneously. We also eliminated all partial sampling units, resulting from
the irregular shape of the BCA, < 12.1 ha (30 ac) in size for logistical reasons. The initial sampling unit of
each sampling block was randomly selected. The second sampling unit comprising the sampling block
was an adjacent, unsurveyed, unit. The dog handler determined the best search pattern to ensure
complete coverage of the sampling block based on ambient environmental conditions. In general, the
search pattern consisted of the dog team walking through each sampling block four times at
approximately equally spaced intervals and generally proceeding north and south. The dog and handler
did not adhere to transect lines but rather the dog was allowed to pursue scent at will resulting in
sinuous survey paths (Cotterill 2014). Surveys were terminated when winds were ≥ 24km/h (15 miles/h).
Detection dog effectiveness
Detection dogs have been used to survey for a wide variety of wildlife species in a diversity of habitats
(Cablk and Heaton 2006). The efficacy of detection dogs as a survey tool varies by target species,
habitat, environmental conditions, dog-handler relationship, and sampling strategy, among other factors
(Wasser 2004, Cablk and Heaton 2006). To our knowledge, detection dog surveys have never been
conducted for WGS. Therefore, we conducted a pilot study to assess the field effectiveness, that is “the
accuracy of the dogs under natural conditions” (Cablk and Heaton 2006) in the spring of 2014. Human
survey teams from Northwest Wildlife Consultants LLC (NWWC) were contracted to survey the southern
portion of NWSTF Boardman in the spring of 2014 using the standard pedestrian survey protocol
(Morgan and Nugent 1999; standard surveys). We used these standard surveys as the baseline for
comparison with dog surveys. We compared status (i.e. occupied or vacant), number of WGS detections
per unit, mean survey effort (time), cost, and transect or dog track length as a measure of search effort.
For consistency with historic surveys we used 65 ha (160 ac, ¼ section) sampling units. We selected 10
sampling units on NWSTF Boardman (Fig. 2). Sampling units were not randomly selected due to
logistical constraints. Rather, we selected units which were historically occupied by WGS (most since
2005-2006) and adjacent to one another. Sampling order and search patterns within each sampling unit
were determined by the dog handler and survey crew leader during respective surveys. For instance,
human surveyors sampled several units together using long transect lines rather than stopping at
sampling unit boundaries for each pass (Gerhardt and Anderson, 2014). Similarly, the dog handler
determined the best search pattern to ensure complete coverage of the sampling unit(s) based on
environmental conditions (Cotterill 2014).
Survey effort (mean time and distance per sampling unit) was calculated from GPS tracklogs from the
detection dog and NWWC surveyors. The dog team carried two GPS units, one embedded in the dog’s
harness (860E GPS data logger; TranSystems Inc. Taiwan), and a second carried by the dog handler
(Columbus 900 GPS data logger; Victory Technology Co. Ltd.). NWWC recorded each surveyor’s tracklog
5
using handheld GPS units. Distance and time intervals were calculated using the movement.pathmetric
script in Geospatial Modeling Environment (v 0.7.2.1) or directly from transect line shapefiles generated
from GPS tracklogs. Data points which fell outside of sampling units were excluded.
Detections were defined as confirmed evidence of WGS presence (i.e. scat and burrows, audio or visual
observation) ≥30 m apart, one half the distance between transect lines. For observations <30 m apart
we calculated the mean geographic center point using the mean center tool in ArcGIS (v10.1; ESRI
Redlands, CA). The resulting location was considered a single detection.
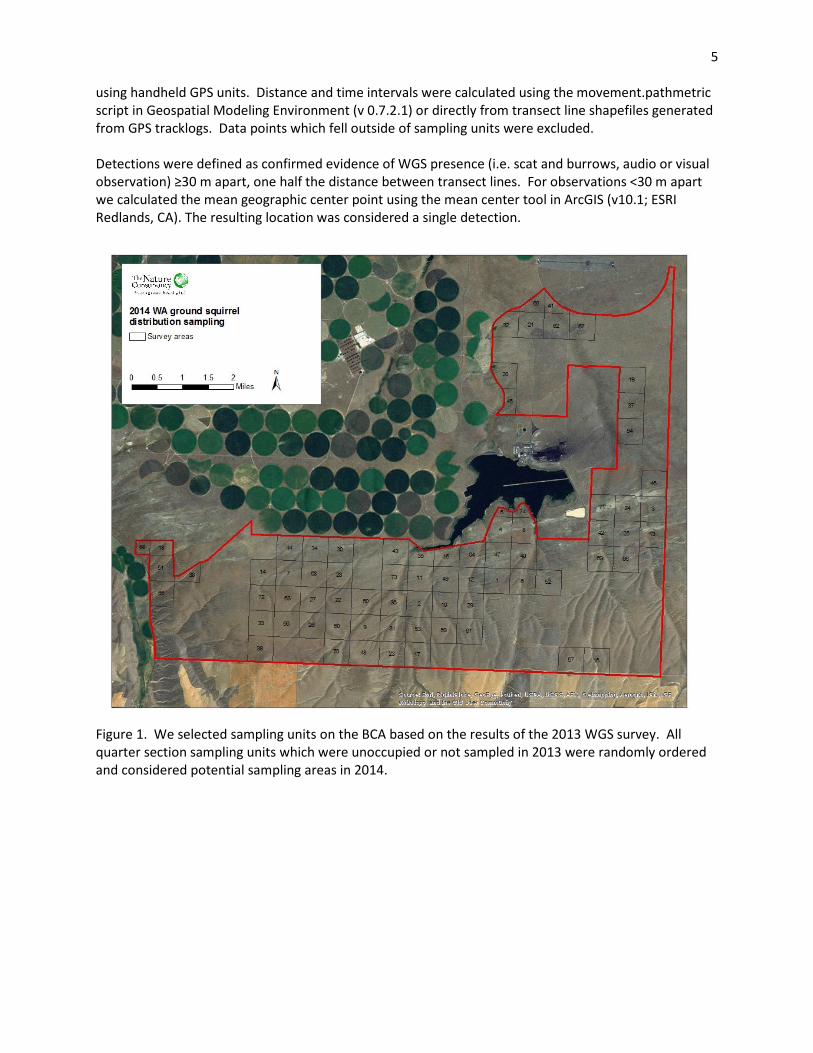
Figure 1. We selected sampling units on the BCA based on the results of the 2013 WGS survey. All
quarter section sampling units which were unoccupied or not sampled in 2013 were randomly ordered
and considered potential sampling areas in 2014.
6
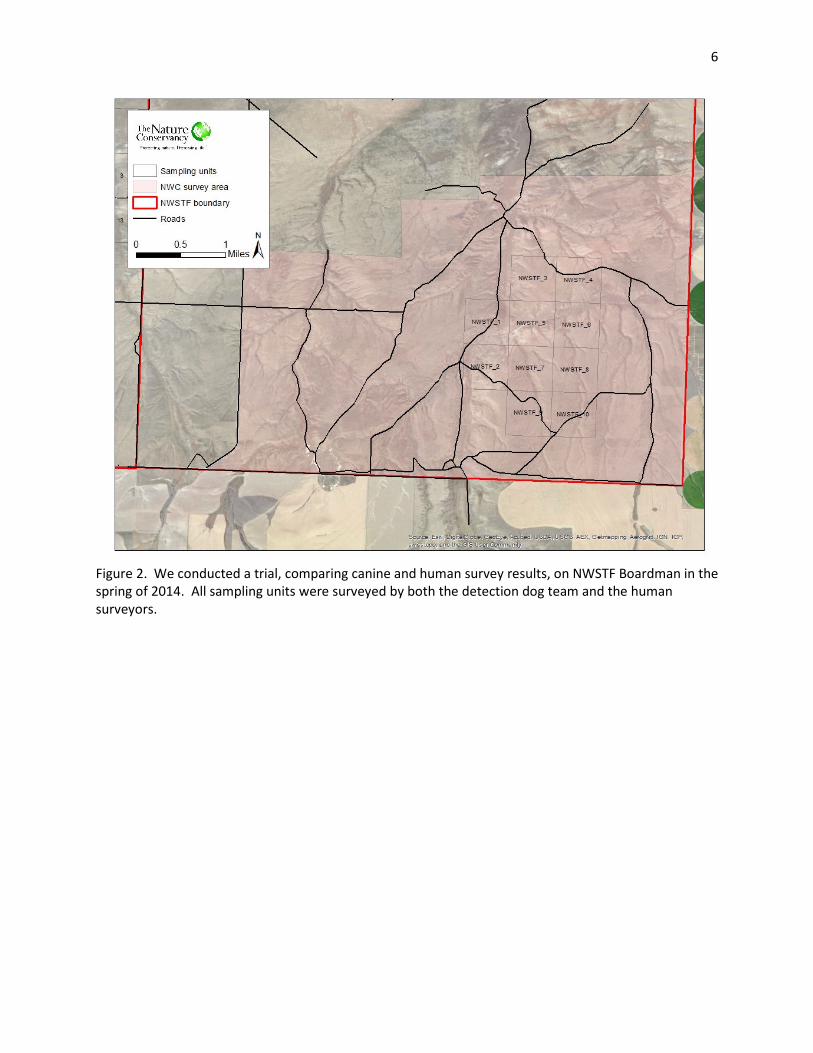
Figure 2. We conducted a trial, comparing canine and human survey results, on NWSTF Boardman in the
spring of 2014. All sampling units were surveyed by both the detection dog team and the human
surveyors.
7
Results
Distribution Mapping on the BCA
Detection dog surveys were conducted on 15 days between March 18 and April 16, 2014 on the BCA.
During this time period the dog team surveyed 31 of 74 sampling units (42%) encompassing 1795 ha.
Detection rates were low. WGS were detected at only 4 locations resulting in an occupancy estimate of
10% (2 detections occurred within the same sampling unit; Fig 3). These detections ranged from 349m
to 854m (�̅=564m) from historic WGS activity sites. We calculated mean track length (m/ha) and survey
time (min/ha) per sampling unit as measures of survey effort. On average, the dog team covered 167
m/ha (SE = 8.3, n=31) and spent 2.4 min/ha (SE = 0.1, n=31). However, midway through the survey
period additional training sites became available for the dog team and were visited on March 31 and
April 2. Based on the dog team’s performance at these sites we modified the search protocol by
increasing the number of passes per sampling block from 4 to 8-10, thus reducing the spacing between
passes to approximately 100m (Cotterill 2014). As a result of this modification mean survey effort
increased from 163 m/ha (SE=9.4, n=22) and 2.2 min/ha (SE=0.1, n=22) prior to the modification to 176
m/ha (SE=17.4, n=9) and 3.1 min/ha (SE=0.3, n=9) following the change.
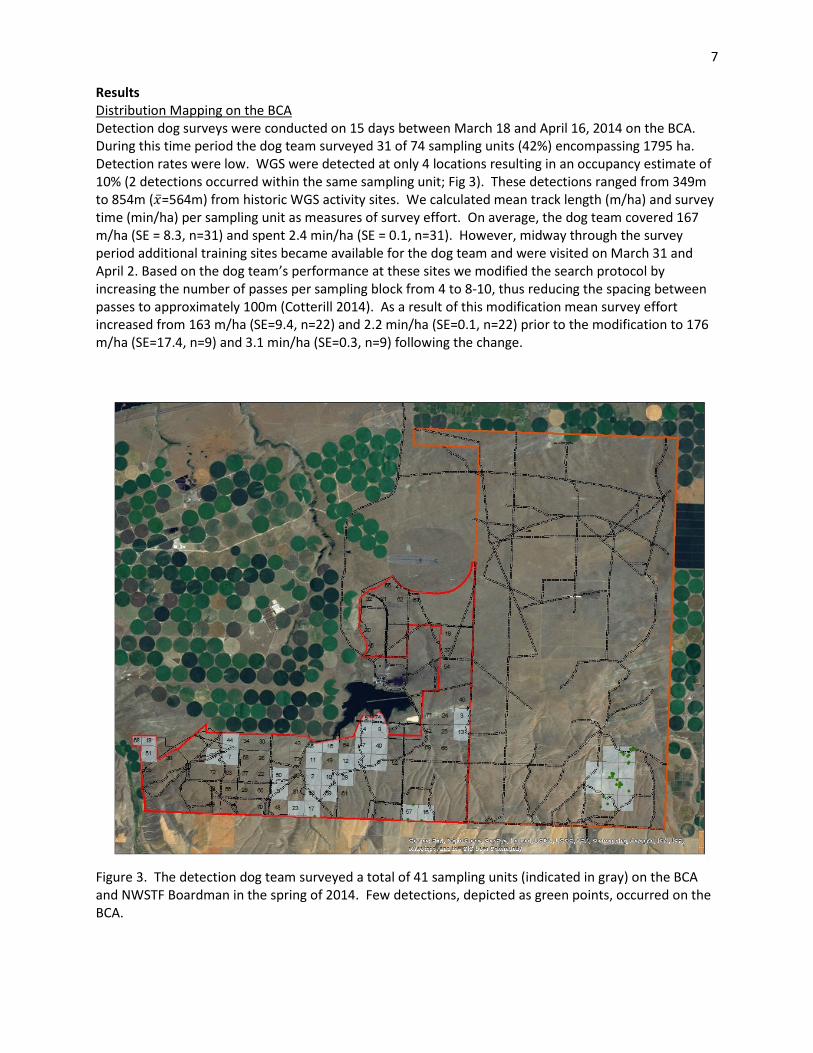
Figure 3. The detection dog team surveyed a total of 41 sampling units (indicated in gray) on the BCA
and NWSTF Boardman in the spring of 2014. Few detections, depicted as green points, occurred on the
BCA.
8
Detection dog effectiveness
Detection dog surveys were conducted on NWSTF Boardman on 5 days between April 1 and April 11,
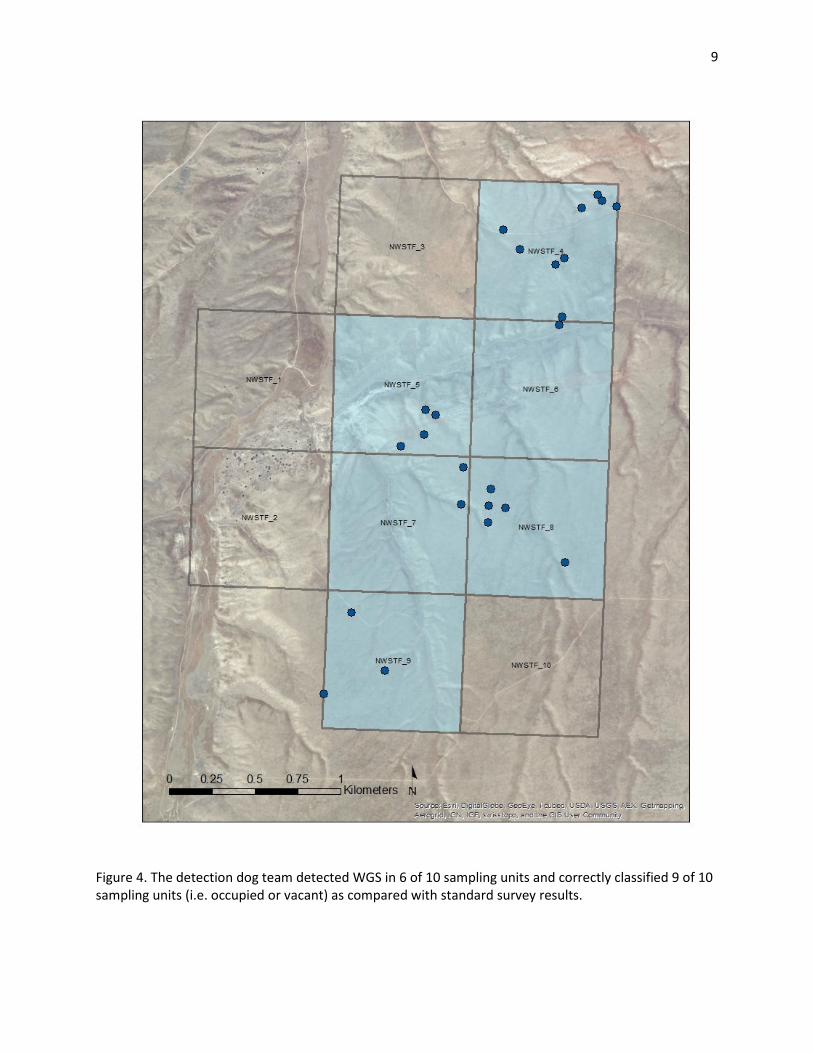
2014, covering 10 sampling units (650 ha). WGS were detected at 24 locations in 6 of 10 sampling units
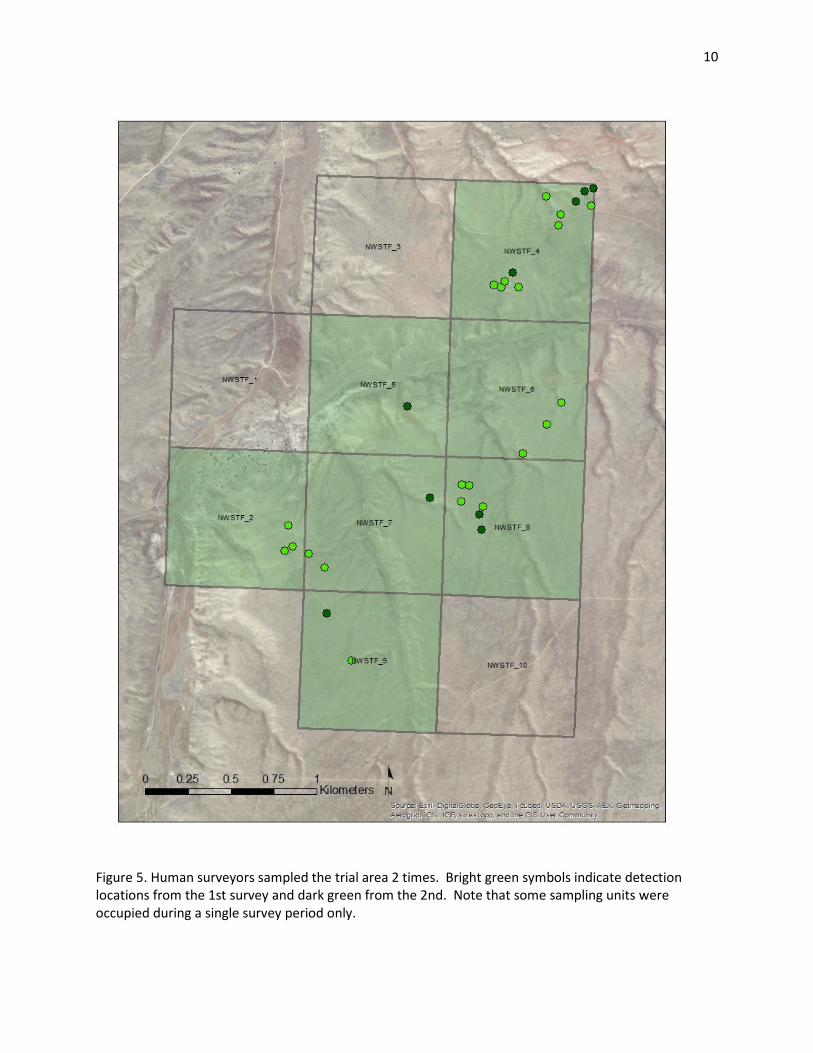
(60%; Fig. 4). Standard surveys occurred from March 5 – 6, 2014 and were repeated from May 7-13,
2014. WGS were detected at a total of 30 locations (9 locations in the 1st survey period and 21 in the
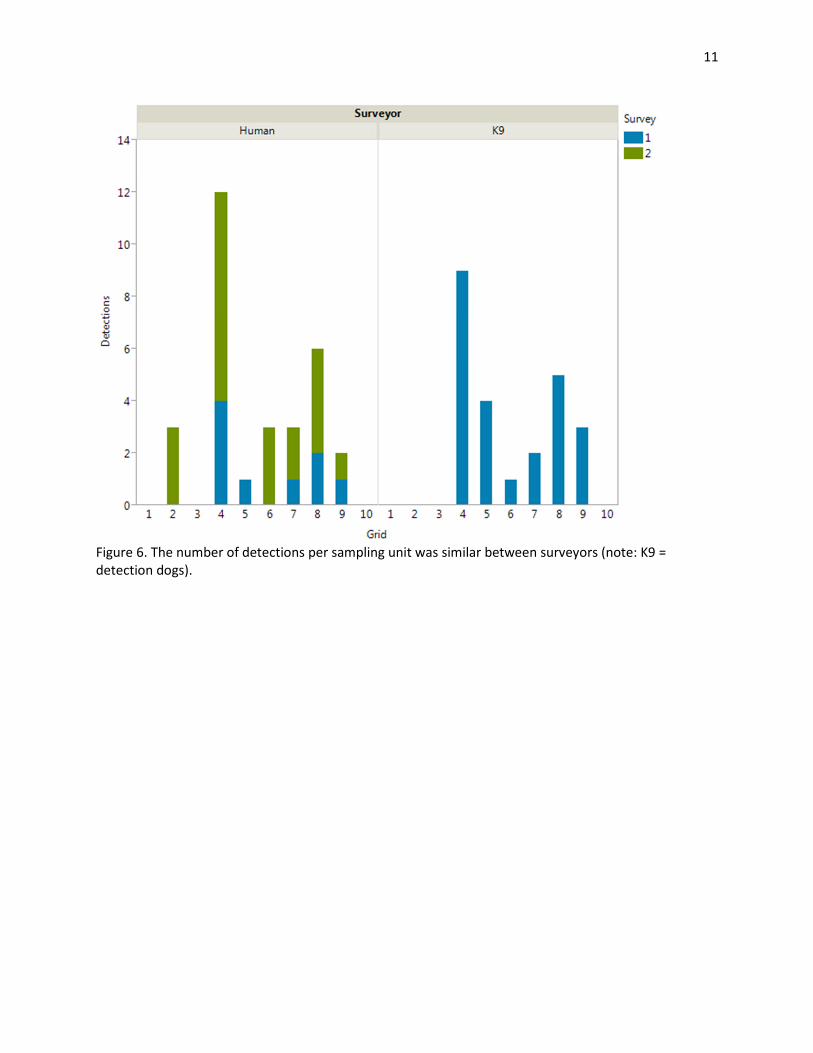
2nd) in 7 of 10 sampling units (70%; Fig. 5). The number of detections per sampling unit were similar
between survey methods (Fig. 6) and the status of 9 of 10 (90%) sampling units were correctly classified
(i.e. occupied or vacant) after a single detection dog survey as compared with results of both standard
surveys.
We calculated mean track length (m/ha) and survey time (min/ha) per sampling unit as measures of
survey effort for both the detection dog and standard surveys. On April 3, 2014 the dog’s GPS failed so
no data points were collected. Rather than excluding this survey effort from the analysis we chose to
use the dog handler’s tracklog for this date. These data are likely representative of the survey effort;
however, they may underestimate the survey distance covered by the dog. Additionally, human
surveyors failed to include a time/date field for some tracklog files during the second survey period
(east/west transects); therefore survey duration was calculated for the first survey period only. On
average, the detection dog track length was 197 m/ha (SE = 12.9m) and average time 3.8 min/ha (SE =
0.4 min) compared with an average track length of 173 m/ha (SE = 1.1 m) and an average time of 2.7
min/ha (SE = 0.1 min) for a single survey by human surveyors (Figs. 7 and 8). Further, the dog team’s
survey effort was comparable between the effectiveness trials and surveys conducted on the BCA after
the search protocol modification (min/ha p=0.2364, m/ha p=0.2703)
Finally, we also estimated survey cost for each method. Detection dog surveys cost approximately $5 /
ha or $3,200 for a single survey of the trial area, whereas standard surveys cost approximately $6.50 /
ha for a single survey or $13 / ha for both surveys prescribed by Morgan and Nugent (1999), for a total
cost of approximately $8,300 for the trial area.
9
Figure 4. The detection dog team detected WGS in 6 of 10 sampling units and correctly classified 9 of 10
sampling units (i.e. occupied or vacant) as compared with standard survey results.
10
Figure 5. Human surveyors sampled the trial area 2 times. Bright green symbols indicate detection
locations from the 1st survey and dark green from the 2nd. Note that some sampling units were
occupied during a single survey period only.
11
Figure 6. The number of detections per sampling unit was similar between surveyors (note: K9 =
detection dogs).
12
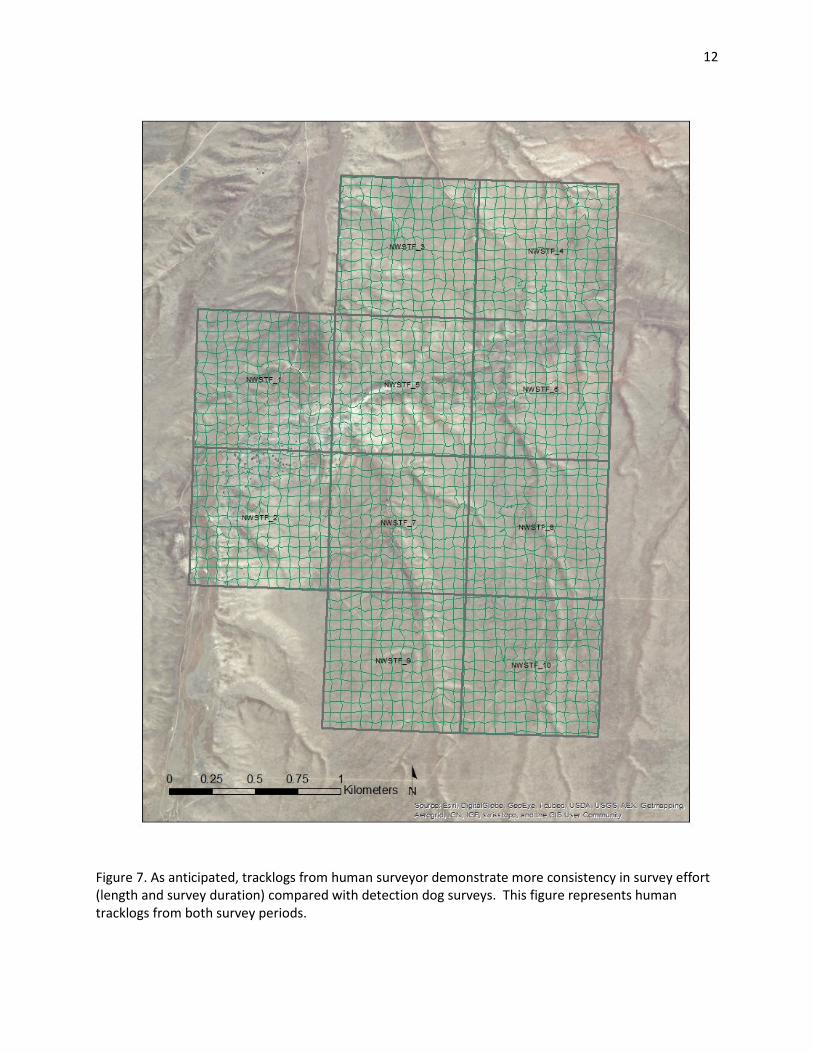
Figure 7. As anticipated, tracklogs from human surveyor demonstrate more consistency in survey effort
(length and survey duration) compared with detection dog surveys. This figure represents human
tracklogs from both survey periods.
13
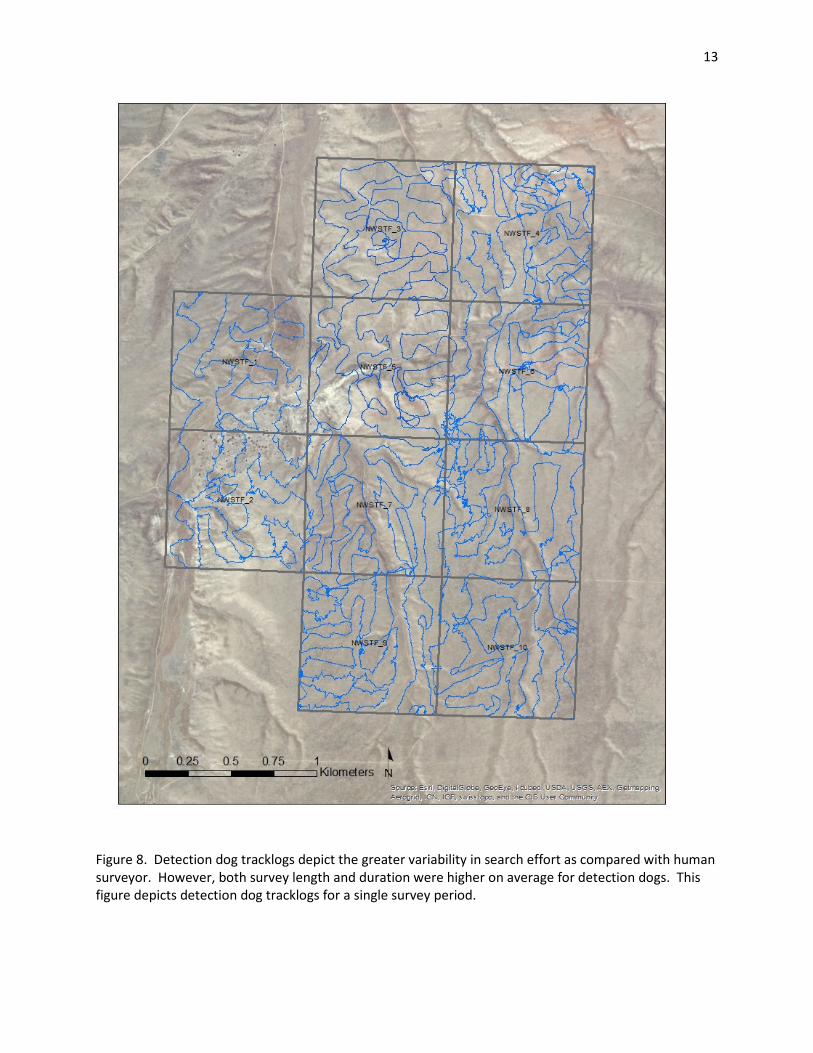
Figure 8. Detection dog tracklogs depict the greater variability in search effort as compared with human
surveyor. However, both survey length and duration were higher on average for detection dogs. This
figure depicts detection dog tracklogs for a single survey period.
14
Discussion
The cryptic nature, small stature, and semi-fossorial habits of WGS in combination with a broad
distribution across the expansive landscape of the BCA make WGS a challenging species to monitor.
Current monitoring methods are labor intensive and expensive to implement, prompting us to explore
alternative survey options. As an alternative method, detection dogs seemed well suited to this task as
they are trained to locate scat, one of the three factors used to confirm WGS presence, and can cover
large tracts of land rapidly.
Results of our evaluation of detection dogs as an alternative to human surveyors indicate that detection
dogs are a viable option for WGS surveys and may offer substantial cost savings over traditional survey
methods. However, standard surveys do offer some advantages. For example, standard surveys were
less variable in both length and time per survey unit and human surveyors are more tolerant of high
temperatures encountered during field surveys. Also, with minor adjustments to field data collection
methods, standard survey data could be used to estimate WGS densities using DISTANCE estimators
(Buckland et al. 1993, Greene and Anthony 2009, Marr 2009). We believe most of these shortcomings
could be addressed through minor changes to field methods for detection dog surveys. Standardizing
search time and adhering to a general search pattern could reduce variability in effort among sampling
units. Further, adjusting survey timing to compensate for high temperature by resting the dog during
the heat of the day allowed surveys to continue during periods of high temperature encountered during
the 2014 surveys (Cotterill 2014). However, generating WGS density estimates which account for
detection probability would likely be challenging using detection dogs.
Detection rates on the BCA were low, similar to results observed in 2009. However, we believe this
effort differed from the 2009 pilot study in important ways. First, we did not attempt to estimate WGS
density, but rather we assessed distribution by determining WGS presence/absence across randomly
selected sampling units. In our opinion detection dogs are well suited for this task as they are capable of
surveying large tracts of land rapidly and cost effectively, important considerations when monitoring low
density, widely dispersed animals. Further, the results of the comparison between standard surveys and
detection dog surveys indicated the two were comparable. Finally, we intentionally sampled locations
which were unoccupied or not assessed in 2013 to better understand the distribution of WGS outside of
historic activity sites. WGS have never been detected in some of these areas, which may, in part,
account for the low rates of detection we observed.
Other factors may have also contributed to the low number of detections we observed on the BCA in
2014 including: survey timing, inexperience of the dog team, and overall low abundance of WGS. Survey
timing, relative to WGS above-ground activity periods, plays an important role in survey outcome. Marr
(2009) indicates “that prior to emergence of litters, little calling occurred and adult females spent about
80% of morning daylight hours under ground, making them difficult to detect”. TNC and NWWC staff,
conducting standard WGS surveys on NWSTF Boardman also noted low WGS activity in March of 2014.
Timing detection dog surveys to correspond with peak periods of above-ground WGS activity would
likely increase detection rates. Based on conditions observed in 2014, we recommend beginning
surveys on April 1 (Cotterill 2014). The inexperience of the dog team with WGS likely contributed to low
detection rates on the BCA during the initial two weeks of surveys. Although we allowed several days of
on-site training at known WGS activity sites prior to the start of surveys, further training at new
locations mid-season resulted in protocol modifications. Identifying WGS activity sites and allowing
several days of on-site training prior to the start of surveys is critical to survey outcome. Also, we found
that slowing the dog helped conserve the dog’s energy level and likely reduced the chances of missing
15
WGS (Cotterill 2014). Finally, based on recent survey results (Marr 2009, Rosier 2013 and 2014) and
antidotal observations, WGS abundance on both the BCA and NWSTF Boardman appears to be low,
likely resulting in decreased detection rates. Only 71 of 238 (30%) known WGS sites on NWSTF
Boardman were occupied in 2014 and 40 of 100 (40%) sampled sites on the BCA were occupied in 2013.
Additional WGS monitoring and analyses
In addition to the WGS monitoring described above, TNC staff and a contractor, Northwest Wildlife
Consultants (NWWC), conducted WGS surveys on NWSTF Boardman in the spring of 2014 (Gerhardt and
Anderson 2014, Rosier 2014). Some of the key findings of that work may help refine future monitoring
efforts on the BCA and therefore we have included the following summary.
NWWC completed systematic transect surveys on 3885 ha in the SE portion of NWSTF Boardman
between March 4, 2014 and May 15, 2014 resulting in 106 WGS detections (Gerhardt and Anderson
2014). Using these results we evaluated the minimum distance between detection locations and
historic WGS sites located within the survey area. The relationship is highly skewed and ranged from 45
m to 1704 m (n=106, median = 427m, IQR = 188 – 624 m). Importantly, only 36 detections (34%) were ≤
300 m, the search area used at historic sites in 2014, and only 50 detections (47%) were ≤ 400 m, the
search area used in surveys prior to 2014. These results indicate a potential limitation of using a
sampling scheme based on visiting historic sites. In a large, contiguous grassland with few apparent
barriers to dispersal, animal movement is likely confounded with demographic changes. Although we
cannot attribute these results directly to animal movement, they do suggest historic site surveys may
not be representative of WGS occupancy. Further, we found that historic monitoring sites were located
closer to linear features (i.e. roads, trails, and fire breaks) than transect detections and random points
and therefore may not be representative of the entire study area (Rosier 2014). A similar situation may
exist on the BCA, particularly with monitoring sites added after initial surveys were completed in 2001.
Therefore, we do not recommend using the historic WGS sites identified after 2001 when assessing
spatial relationships due to this bias.
Finally, we used the results of the NWWC systematic transects to evaluate the relationship between
WGS detections and published soil texture information for the 2014 survey area on NWSTF Boardman.
We simplified this analysis by combining soil types into 2 soil texture classes, silt loam and sandy loam,
which covered 86% and 12% of the survey area respectively. The results of this analysis indicated WGS
detections by soil texture differed little from expected and soil texture at detection locations varied little
from those at random locations (Rosier 2014). The results of this analysis prompted us to conduct a
similar analysis for the BCA using WGS locations identified during the 1999 and 2001 systematic transect
surveys.
To assess the relationship between soil characteristics at occupied WGS sites and random locations on
the BCA we used published soil information (USDA NRCS 2015) and survey results from systematic
surveys completed in 1999 and 2001 (Morgan and Nugent 1999). We compared percent silt content, by
soil horizon, at occupied WGS sites and randomly selected sites >300m from occupied sites. We
selected the parameter percent silt content based on the findings of Greene and Anthony (2009) and we
eliminated other textural classes (i.e. sand and clay) from this analysis because they are highly
correlated (e.g. r2 = 0.95 for percent sand and silt in horizon 1). The 300m buffer was selected based on
findings from telemetry space-use studies and field observations which indicate much of the annual
WGS activity is concentrated within 300m of an activity site (Delavan 2008, Marr 2009). Further, we
included soil horizons, which represent physical boundaries (i.e. changes in texture or structure) within a
soil profile, to assess textural changes with depth. We used nonparametric Wilcoxon/Kruskal-Wallis test
16
in JMP 11.1.1 (SAS Institute Inc. Cary, NC) to evaluate these relationships. Results of this analysis
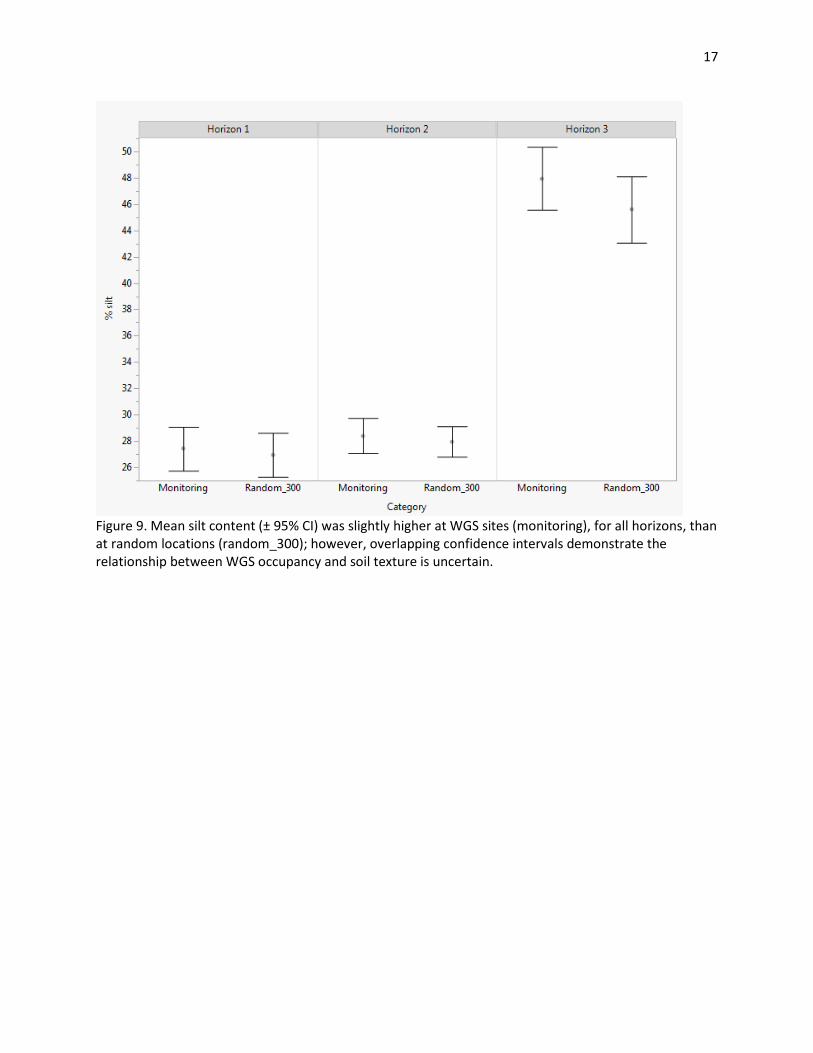
indicated soils at occupied sites had slightly higher silt content compared with random locations for all
horizons; however, overlapping confidence intervals demonstrate the relationship between WGS
occupancy and soil texture is uncertain (Table 1, Fig. 9). The largest difference was observed in horizon
3 where mean silt content was 2.4% higher for occupied sites than at random sites. The biological
importance of this small increase, if any, is unknown as both occupied and random sites have relatively
high silt content in horizon 3 (�̅ = 47.96 and �̅ = 45.59 respectively) and the variability in the data
indicate a high degree of overlap. Our results contrast with the findings of Greene and Anthony (2009)
which indicate WGS select sites with higher silt content. Field soil measurements, rather than reliance
on published soil data, may produce different results. However, based on this evaluation, soil texture
does not differ greatly between occupied and random sites on the BCA.
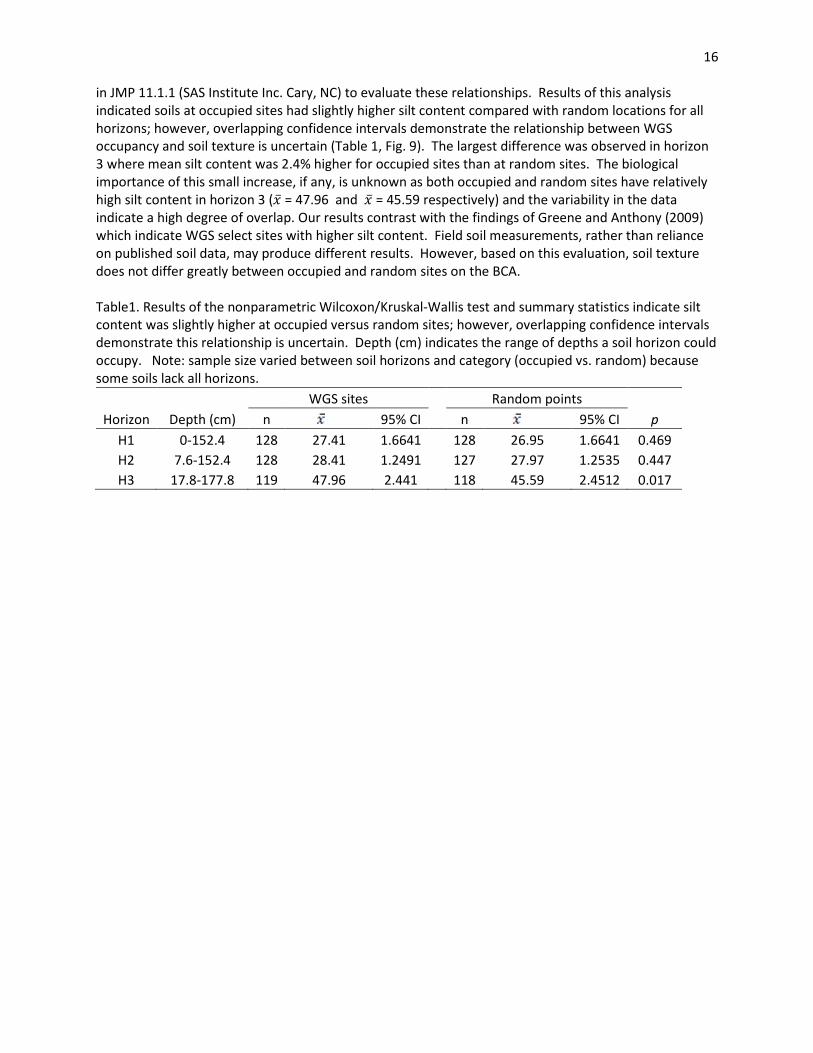
Table1. Results of the nonparametric Wilcoxon/Kruskal-Wallis test and summary statistics indicate silt
content was slightly higher at occupied versus random sites; however, overlapping confidence intervals
demonstrate this relationship is uncertain. Depth (cm) indicates the range of depths a soil horizon could
occupy. Note: sample size varied between soil horizons and category (occupied vs. random) because
some soils lack all horizons.
WGS sites Random points
Horizon Depth (cm) n
95% CI n
95% CI p
H1 0-152.4 128 27.41 1.6641
128 26.95 1.6641 0.469
H2 7.6-152.4 128 28.41 1.2491
127 27.97 1.2535 0.447
H3 17.8-177.8 119 47.96 2.441 118 45.59 2.4512 0.017
17
Figure 9. Mean silt content (± 95% CI) was slightly higher at WGS sites (monitoring), for all horizons, than
at random locations (random_300); however, overlapping confidence intervals demonstrate the
relationship between WGS occupancy and soil texture is uncertain.
18
Literature Cited
Buckland, S.T., Anderson, D.R., Burnham, K.P. and Laake, J.L. 1993. Distance Sampling: Estimating
Abundance of Biological Populations. Chapman and Hall, London. 446pp.
Cablk, M.E. and J.S. Heaton. 2006. Accuracy and reliability of dogs in surveying for desert tortoise
(Gopherus agassizii). Ecological Applications. 16: 1926-1935.
Cotterill, Gavin. 2014. 2014 Washington ground squirrel surveys, Boardman Conservation Area and
Naval Weapons Systems Training Facility, Boardman. Conservation Canines, Center for Conservation
Biology University of Washington, Unpublished report.
Delavan, J.L. 2008. The Washington ground squirrel (Spermophilus washingtoni): home range and
movement by habitat type and population size in Morrow County, Oregon. Thesis, Portland State
University, Portland, USA.
Greene, E. and R.G. Anthony. 2009. Abundance and habitat associations of Washington ground squirrels
in the Columbia Basin, Oregon. American Midland Naturalist. 162:29-42.
Gerhardt, R. and B. Anderson. 2014. Washington ground squirrel surveys Boardman Naval Weapons
Systems Training Facility. Unpublished report. Northwest Wildlife Consultants, Inc.
Marr, V. 2009. Washington ground squirrel monitoring, Boardman Conservation Area 2009: Distance
sampling pilot project, Monitoring point sampling. The Nature Conservancy, Unpublished report.
Morgan, R.L., and M. Nugent. 1999. Status and habitat use of the Washington ground squirrel
Spermophilus washingtoni on State of Oregon lands, South Boeing, Oregon in 1999. Oregon Department
of Fish and Wildlife, Unpublished report.
Multi-Species Candidate Conservation Agreement with Assurances between Threemile Canyon Farms,
The Nature Conservancy, Portland General Electric, U.S. Fish and Wildlife Service and Oregon
Department of Fish and Wildlife. February 2003.
Rosier, J. 2013. Washington ground squirrel monitoring report 2013 and summary of monitoring 1999-
2013 Boardman Conservation Area. The Nature Conservancy, Unpublished report.
Rosier, J. 2014. Washington ground squirrel monitoring report 2014 Naval Weapons System Training
Facility Boardman. The Nature Conservancy, Unpublished report.
Wasser, S.K., B. Davenport, E.R. Ramage, K.E. Hunt, M. Parker, C. Clarke, and G. Stenhouse. 2004. Scat
detection dogs in wildlife research and management: application to grizzly and black bears in the
Yellowhead ecosystem, Alberta Canada. Canadian Journal of Zoology. 82: 475-492.
USDA Natural Resources Conservation Service [NRCS]. 2015. Web Soil Survey.
http://websoilsurvey.sc.egov.usda.gov/App/HomePage.htm accessed. Accessed 7 Feb 2015.