warrnambool area property watch q1 2013
DESCRIPTION
Warrnambool Area Property Watch Q1 2013TRANSCRIPT
www.prdresearch.com.au Your home of property knowledge
First Quarter │2013
WARRNAMBOOL AREA Property Watch®
HOUSE PRICE POINTS
Prepared by PRDnationwide Research. Source: PDS
MARKET INDICATORS
Change from Last Year Half Year
HOUSE SALES
HOUSE MEDIAN
HOUSE RENTS
LAND SALES
LAND MEDIAN
UNIT SALES
UNIT MEDIAN
UNIT RENTS
The indicators depicted above are based on the year ending 30 June 2012,
with exception to rental indicators which are based on the year ending 30
October 2012.
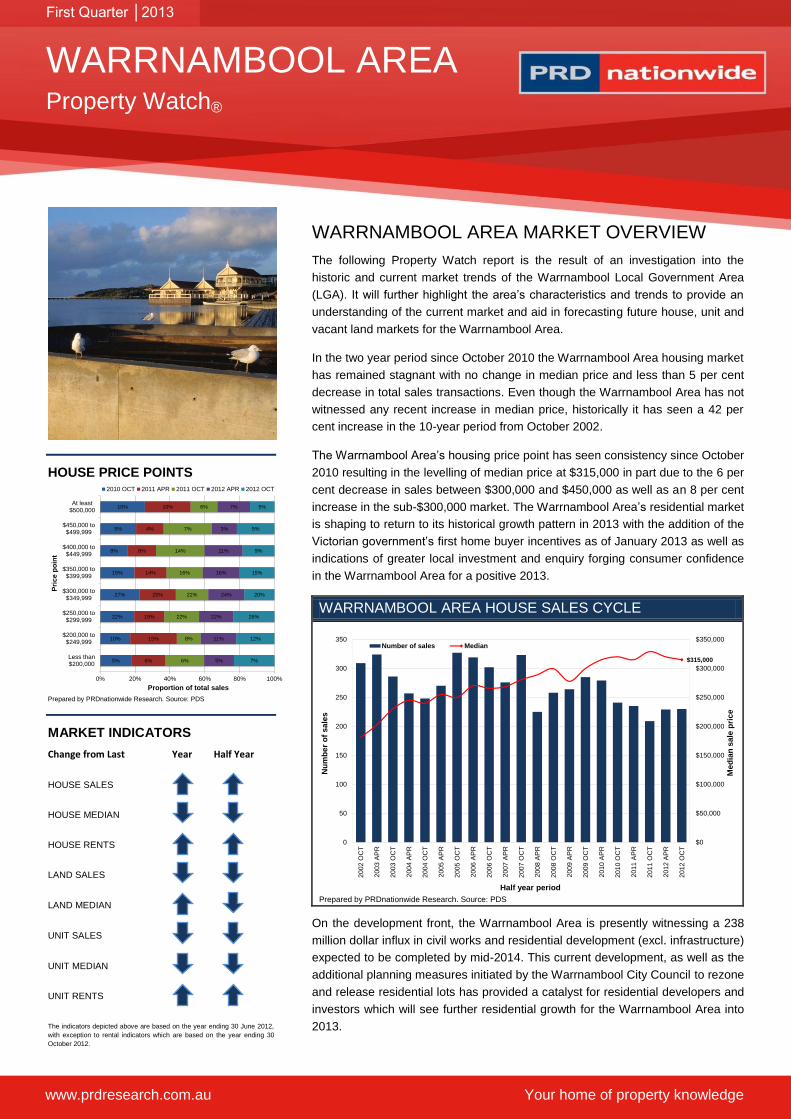
WARRNAMBOOL AREA MARKET OVERVIEW
The following Property Watch report is the result of an investigation into the
historic and current market trends of the Warrnambool Local Government Area
(LGA). It will further highlight the area’s characteristics and trends to provide an
understanding of the current market and aid in forecasting future house, unit and
vacant land markets for the Warrnambool Area.
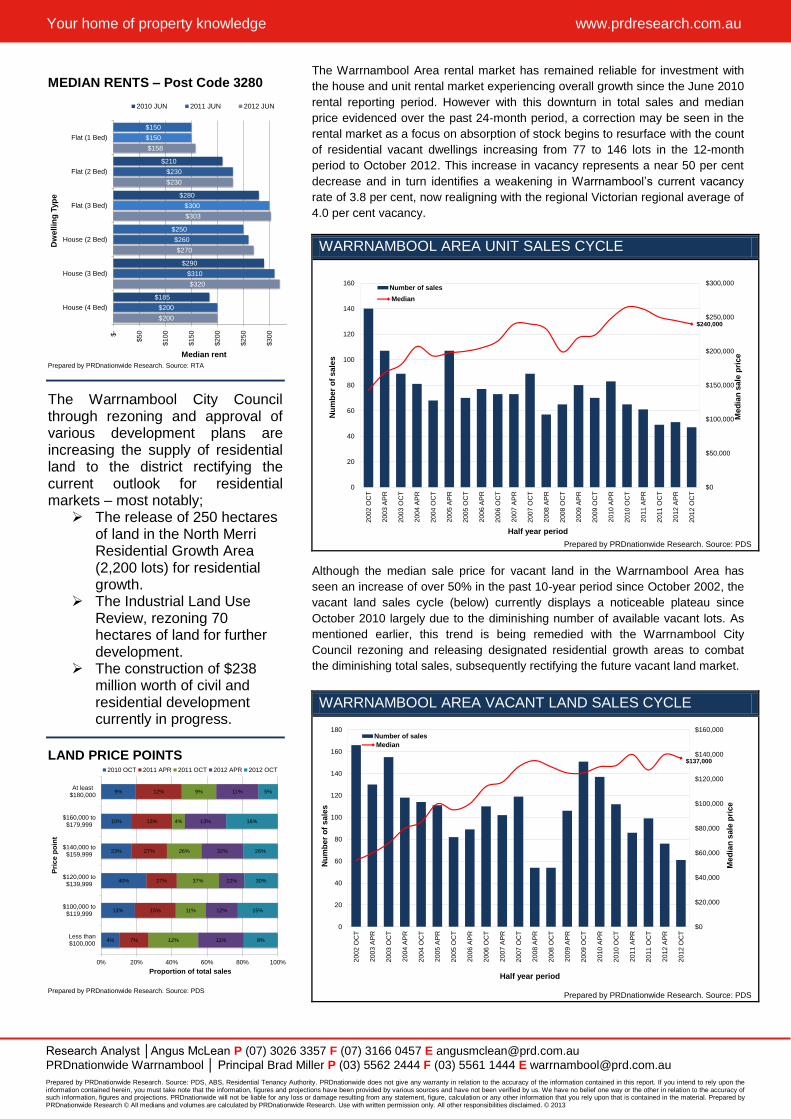
In the two year period since October 2010 the Warrnambool Area housing market
has remained stagnant with no change in median price and less than 5 per cent
decrease in total sales transactions. Even though the Warrnambool Area has not
witnessed any recent increase in median price, historically it has seen a 42 per
cent increase in the 10-year period from October 2002.
The Warrnambool Area’s housing price point has seen consistency since October
2010 resulting in the levelling of median price at $315,000 in part due to the 6 per
cent decrease in sales between $300,000 and $450,000 as well as an 8 per cent
increase in the sub-$300,000 market. The Warrnambool Area’s residential market
is shaping to return to its historical growth pattern in 2013 with the addition of the
Victorian government’s first home buyer incentives as of January 2013 as well as
indications of greater local investment and enquiry forging consumer confidence
in the Warrnambool Area for a positive 2013.
WARRNAMBOOL AREA HOUSE SALES CYCLE
Prepared by PRDnationwide Research. Source: PDS
On the development front, the Warrnambool Area is presently witnessing a 238
million dollar influx in civil works and residential development (excl. infrastructure)
expected to be completed by mid-2014. This current development, as well as the
additional planning measures initiated by the Warrnambool City Council to rezone
and release residential lots has provided a catalyst for residential developers and
investors which will see further residential growth for the Warrnambool Area into
2013.
5%
10%
22%
27%
15%
8%
5%
10%
6%
15%
19%
25%
14%
8%
4%
10%
6%
8%
22%
22%
16%
14%
7%
6%
5%
11%
22%
24%
16%
11%
3%
7%
7%
12%
26%
20%
15%
9%
5%
5%
0% 20% 40% 60% 80% 100%
Less than$200,000
$200,000 to$249,999
$250,000 to$299,999
$300,000 to$349,999
$350,000 to$399,999
$400,000 to$449,999
$450,000 to$499,999
At least$500,000
Proportion of total sales
Pri
ce
po
int
2010 OCT 2011 APR 2011 OCT 2012 APR 2012 OCT
$315,000
$0
$50,000
$100,000
$150,000
$200,000
$250,000
$300,000
$350,000
0
50
100
150
200
250
300
350
200
2 O
CT
200
3 A
PR
200
3 O
CT
200
4 A
PR
200
4 O
CT
200
5 A
PR
200
5 O
CT
200
6 A
PR
200
6 O
CT
200
7 A
PR
200
7 O
CT
200
8 A
PR
200
8 O
CT
200
9 A
PR
200
9 O
CT
201
0 A
PR
201
0 O
CT
201
1 A
PR
201
1 O
CT
201
2 A
PR
201
2 O
CT
Me
dia
n s
ale
pri
ce
Nu
mb
er
of
sa
les
Half year period
Number of sales Median
Prepared by PRDnationwide Research. Source: PDS, ABS, Residential Tenancy Authority. PRDnationwide does not give any warranty in relation to the accuracy of the information contained in this report. If you intend to rely upon the information contained herein, you must take note that the information, figures and projections have been provided by various sources and have not been verified by us. We have no belief one way or the other in relation to the accuracy of such information, figures and projections. PRDnationwide will not be liable for any loss or damage resulting from any statement, figure, calculation or any other information that you rely upon that is contained in the material. Prepared by PRDnationwide Research © All medians and volumes are calculated by PRDnationwide Research. Use with written permission only. All other responsibilities disclaimed. © 2013
Your home of property knowledge www.prdresearch.com.au
Research Analyst │Angus McLean P (07) 3026 3357 F (07) 3166 0457 E [email protected]
PRDnationwide Warrnambool │ Principal Brad Miller P (03) 5562 2444 F (03) 5561 1444 E [email protected]
MEDIAN RENTS – Post Code 3280
Prepared by PRDnationwide Research. Source: RTA
The Warrnambool City Council through rezoning and approval of various development plans are increasing the supply of residential land to the district rectifying the current outlook for residential markets – most notably;
The release of 250 hectares of land in the North Merri Residential Growth Area (2,200 lots) for residential growth.
The Industrial Land Use Review, rezoning 70 hectares of land for further development.
The construction of $238 million worth of civil and residential development currently in progress.
LAND PRICE POINTS
Prepared by PRDnationwide Research. Source: PDS
The Warrnambool Area rental market has remained reliable for investment with
the house and unit rental market experiencing overall growth since the June 2010
rental reporting period. However with this downturn in total sales and median
price evidenced over the past 24-month period, a correction may be seen in the
rental market as a focus on absorption of stock begins to resurface with the count
of residential vacant dwellings increasing from 77 to 146 lots in the 12-month
period to October 2012. This increase in vacancy represents a near 50 per cent
decrease and in turn identifies a weakening in Warrnambool’s current vacancy
rate of 3.8 per cent, now realigning with the regional Victorian regional average of
4.0 per cent vacancy.
WARRNAMBOOL AREA UNIT SALES CYCLE
Prepared by PRDnationwide Research. Source: PDS
Although the median sale price for vacant land in the Warrnambool Area has
seen an increase of over 50% in the past 10-year period since October 2002, the
vacant land sales cycle (below) currently displays a noticeable plateau since
October 2010 largely due to the diminishing number of available vacant lots. As
mentioned earlier, this trend is being remedied with the Warrnambool City
Council rezoning and releasing designated residential growth areas to combat
the diminishing total sales, subsequently rectifying the future vacant land market.
WARRNAMBOOL AREA VACANT LAND SALES CYCLE
Prepared by PRDnationwide Research. Source: PDS
$150
$210
$280
$250
$290
$185
$150
$230
$300
$260
$310
$200
$158
$230
$303
$270
$320
$200
$-
$5
0
$1
00
$1
50
$2
00
$2
50
$3
00
$3
50
Flat (1 Bed)
Flat (2 Bed)
Flat (3 Bed)
House (2 Bed)
House (3 Bed)
House (4 Bed)
Median rent
Dw
ellin
g T
yp
e
2010 JUN 2011 JUN 2012 JUN
4%
13%
40%
23%
10%
9%
7%
15%
27%
27%
13%
12%
12%
11%
37%
26%
4%
9%
11%
12%
22%
32%
13%
11%
8%
15%
30%
26%
16%
5%
0% 20% 40% 60% 80% 100%
Less than$100,000
$100,000 to$119,999
$120,000 to$139,999
$140,000 to$159,999
$160,000 to$179,999
At least$180,000
Proportion of total sales
Pri
ce
po
int
2010 OCT 2011 APR 2011 OCT 2012 APR 2012 OCT
$240,000
$0
$50,000
$100,000
$150,000
$200,000
$250,000
$300,000
0
20
40
60
80
100
120
140
160
200
2 O
CT
200
3 A
PR
200
3 O
CT
200
4 A
PR
200
4 O
CT
200
5 A
PR
200
5 O
CT
200
6 A
PR
200
6 O
CT
200
7 A
PR
200
7 O
CT
200
8 A
PR
200
8 O
CT
200
9 A
PR
200
9 O
CT
201
0 A
PR
201
0 O
CT
201
1 A
PR
201
1 O
CT
201
2 A
PR
201
2 O
CT
Med
ian
sale
pri
ce
Nu
mb
er
of
sale
s
Half year period
Number of sales
Median
$137,000
$0
$20,000
$40,000
$60,000
$80,000
$100,000
$120,000
$140,000
$160,000
0
20
40
60
80
100
120
140
160
180
200
2 O
CT
200
3 A
PR
200
3 O
CT
200
4 A
PR
200
4 O
CT
200
5 A
PR
200
5 O
CT
200
6 A
PR
200
6 O
CT
200
7 A
PR
200
7 O
CT
200
8 A
PR
200
8 O
CT
200
9 A
PR
200
9 O
CT
201
0 A
PR
201
0 O
CT
201
1 A
PR
201
1 O
CT
201
2 A
PR
201
2 O
CT
Med
ian
sale
pri
ce
Nu
mb
er
of
sale
s
Half year period
Number of sales
Median