warning system based on real-time flood forecasts in são...
TRANSCRIPT

1
WARNING SYSTEM BASED ON REAL-TIME FLOOD FORECASTS IN SÃO PAULO, BRAZIL
C.P.M. Oliveira2, C.V.F. da Silva1&2, A.S.K.B. Sosnoski1, P.L. Bozzini1&2, D.M. Rossi1&2, S. Uemura1, F. Conde1 1. Fundação Centro Tecnológico de Hidráulica (FCTH). São Paulo, SP, Brazil 2. LabSid, Escola Politécnica, Universidade de São Paulo (USP). São Paulo, SP, Brazil
ABSTRACT: Floods are natural events that can cause victims and various social and economic losses. These events are originated from intense rainfall that exceeds soil infiltration capacity leading to major water runoff that surpasses the capacity of drainage systems causing flooding and overflows. In particular, at highly urbanized basins, the problem becomes even more complex since it involves land use issues, not only by raised flood peaks caused by broadened impervious surface areas, but also by increased vulnerability to flooding due to highest population densities located in flood prone areas. Yet there are frequent cases when the impacts of these floods are aggravated by lack of consistent information, which implies poorly conceived projects, bad maintenance and faulty decisions by public officials, investors and society in general. Based on this scenario, the São Paulo City Hall (PMSP) has invested in a flood management system for evaluation, monitoring, forecasting and warning in order to promote stormwater management efficiency and effectiveness of preventive and corrective actions. Therefore, PMSP maintains a technical assistance contract with the Hydraulics Technology Center Foundation (FCTH). At first, this partnership addressed activities of atmospheric monitoring of precipitation using radar and land precipitation monitoring, as well as channel and reservoir levels through telemetric network and weather forecast. Seeking to understand and evaluate the response of basins and major drainage structures to different precipitation, a rainfall-runoff model followed by a hydraulic model are now being applied to predict outflow and flood extents in critical watersheds, in order to support the management of the impacts of extreme hydrological events.
PMSP selected six priority independent watersheds with distinct characteristics that represent about 15.5% of municipal territory area for the initial implementation of this technology, namely Aricanduva, Água Espraiada, Cabuçu de Baixo, Mandaqui, Morro do S and Pirajuçara. Selected watersheds already hold flood control structures, but still experience flood related problems, except Mandaqui.
Hydrological modeling of the subcatchments and hydraulic modeling of the main channels were performed employing PCSWMM (CHI), which consists of a set of solutions associated with the core calculation SWMM5 EPA, incorporated into a modern GIS engine. The models were calibrated for each watershed adopting recent extreme event data. As a result, PCSWMM delivers profiles and hydrographs along simulated channels, reservoir states, flood inundation extents and affected buildings. In addition, there is a PCSWMM Real-Time module that discloses prediction results for flood inundation sites based on radar rainfall forecasts, taken every 10 minutes to a prediction horizon of 3 hours. These outputs are addressed to the Emergency Management Center (CGE) in real time on the internet, with an intuitive graphical web-interface, easily allowing access to information and analysis of complex problems by technicians.
Key Words: flood forecasting, hydrologic and hydraulic modeling, radar rainfall, SWMM, warning system.

2
1. INTRODUCTION
Floods are natural events that can cause victims and various social and economic losses. These events originate from intense rainfall that exceeds soil infiltration capacity leading to major water runoff that surpasses the capacity of drainage systems causing flooding and overflows. In particular, at highly urbanized basins, the problem becomes even more complex since it involves land use issues, not only by raised flood peaks caused by broadened impervious surface areas, but also by increased vulnerability to flooding due to highest population densities located in flood prone areas. Yet there are frequent cases when the impacts of these floods are aggravated by lack of consistent information, which implies poorly conceived projects, bad maintenance and faulty decisions by public officials, investors and society in general.
The city of São Paulo, located in the Alto Tietê basin, suffers every year from October to March from the impact of heavy rains. The floods occur in various parts of the city due to the large number of culverts, canals and bridges with insufficient section for stormwater, silted streams and obstructions by debris at various points; the presence of buildings very close to the river bed and the adoption of inadequate technical project parameters, reflecting the capacity of pipelines. In cases like this, simulation models and hydrological monitoring are effective for analysis of the effects caused by urban growth of river basins tools, enabling the appropriate development planning of cities.
Based on this scenario, the São Paulo City Hall (PMSP) has invested in a flood management project centered on a system for evaluation, monitoring, forecasting and warning in order to promote stormwater management efficiency and effectiveness of preventive and corrective actions. PMSP maintains a technical assistance contract with the Hydraulics Technology Center Foundation (FCTH), which researches and develops new technologies that assist in flood mitigation and prevention, and operates the São Paulo Flood Warning System (SAISP). The SAISP performs real-time monitoring of hydrometeorological variables and levels in rivers and reservoirs, real-time forecasting of rainfall and streamflow and the dissemination of timely information to the action of the organs involved.
The following sections describe the methodology for modeling six pilot watersheds and its online use for real-time alert of monitored and predicted flood spots. The system relies on a rainfall-runoff model, which allows the estimation of current and predicted levels of channels and reservoirs conditions, based on the simulation of hydrologic and hydraulic behavior applying PCSWMM Professional 2D, which integrates the Storm Water Management model (SWMM) with advanced geoprocessing tools. In addition, there is a version of PCSWMM Real-Time disclosing prediction results for flood inundation sites addressed to the Emergency Management Center (CGE) in real time on the internet.
2. METHODOLOGY
2.1 Sites description
The study basins cover an area of 267.8 km² and comprise five watersheds fully inserted in the City of São Paulo (Aricanduva, Água Espraiada, Cabuçu de Baixo, Mandaqui and Morro do S) plus the Pirajuçara basin, which also lies in the municipalities of Taboão da Serra and Embu. The study sites possess miscellaneous characteristics that represent the heterogeneity of a large city like São Paulo.
2.1.1 Água Espraiada
This watershed located in the southern part of the city is a tributary of Pinheiros River’s right margin. It is highly urbanized and densely populated, with almost all of its 11.3 km² being covered by urban area and an average population density of 120.8 inhab./ha. There is a great number of slums, most of them located in risk areas. The region faces flooding problems since the 1960s and had a great urban development since then due to public investments in infrastructure. The upper part of the basin presents higher terrain slopes and greater pervious area. It is currently where most of the flood problems happens, mainly affecting low income population. The lower areas have lower slope and greater impervious area. Floods

3
in this area also affect poor communities and heavily impact the traffic. However, since the construction of the reservoir, floods became less frequent in this part of the basin.
The upstream portion of the main channel still keeps its natural conditions, despite the fact that bridges, slums and poor maintenance interfere on the water flow. The downstream portion of the river is a rectangular concrete channel along an important avenue. A detention reservoir is located at the central part of the basin. By the time it was built, in 2000, it was the largest reservoir in the country with 360,000 m³ of storage capacity. In addition, it had sports courts and skate rinks, so the population could use its area for recreation during dry periods.
The watershed is part of a municipal urban development program. In partnership with the private initiative, the city hall provides incentives for economic and social development while guaranteeing environmental conservation. Among the several projects that are part of the program there is a linear park designed for the upstream area. The park increases the floodplain, reducing damage caused by floods and it is also a public green area that can be used for recreational purposes. Another important project is the new subway line being built along the river. Though it is designed to not interfere on the hydraulic performance of the drainage system during normal conditions, the tracks support pillars are placed over the concrete channel and the maneuvering and maintenance yard, over the reservoir.
2.1.2 Aricanduva
The Aricanduva watershed, left tributary of the Tietê River, is located in the eastern region of São Paulo and has approximately 100 km² and an average population density of 107.6 inhab./ha. The major watercourse is the Aricanduva River which headwaters are located near Mauá, in the highest part of the basin, a region with higher slopes, while the downstream part is flatter. The last population count verified that the population in the Aricanduva watershed increased significantly. Due to this occupation, the watershed lost more than 50% of permeable areas, reducing the infiltration capacity and increasing the runoff velocity and the water volume in the channel. Currently, the lower area of watershed is fully occupied, while it is still possible to observe the presence of vegetation in the headwater areas. The most densely populated areas are situated downstream, where many points of flooding can be observed.
The channelization of Aricanduva River started in 1970 and covered more than 13 km between the Aricanduva III reservoir and Tietê River. The section between the headwater and the mentioned reservoir still maintains its natural condition. In 1990, 8 detention reservoirs (3 are built in-stream and 5 are off-stream) were built in the watershed to solve the recurring flooding problems. In 2000, in order to increase the flow capacity of the channel, the section was extended, a stretch with a length of approximately 4.4 km, and was built a linear park with playgrounds, gardens, and sport courts along the extended portions. The construction of two reservoirs assisted by federal program are planned to increase the reservation capacity of the basin.
2.1.3 Cabuçu de Baixo
This 42.5 km² watershed has only 96.1 inhab./ha, concentrated in the central and lower portions of the basin, while the headwaters areas belong to an important state environmental protection zone. The intersection of these areas is occupied by slums and poor settlements, which suffer from floods of the main stream tributaries and also from the lack of sanitation.
The basin has two in-stream flood control reservoirs in major tributaries and one flood control reservoir in the main stream, which operates off-stream for Cabuçu de Baixo Stream and in-stream for Guaraú stream. The main stream consists of a rectified channel until the reservoir, from where it flows by reinforced underground galleries, which are in poor state of conservation. The lack of maintenance is also reflected in the reservoir conditions, since, by means of field surveys, it was observed that they have lost a significant part of their design capacity.
Transport and housing policies are planned for the basins aiming to stabilize the population density and contain the occupation process, preventing the expansion of residential areas in environmental protected
4
areas. Public policies also include the establishment of linear parks along major tributaries, as a barrier to occupation of areas subject to flooding and landslides and the recovery of degraded landscape. Planned flood control measures also include the revision of the drainage system upstream Bananal reservoir and the stormwater runoff system of the region. In addition, the Bananal reservoir should undergo changes in order to serve as a public facility for recreation during dry periods.
2.1.4 Mandaqui
The Mandaqui Stream is a tributary of Tietê River’s right margin. Its basin has an area of 18.6 km² and is nearly completely urbanized. It is also a densely populated region with an average of 143 inhab./km². The waterheads areas still have some preserved vegetation, but even those areas are mostly covered by urban sectors. Though higher in the uppermost areas, most of the basin presents high slopes.
The upstream part of Mandaqui Stream and its main tributary, the Lauzane Stream, both run inside closed section galleries under important avenues in the northern region of the city. The downstream part runs in a concrete open channel with regular section, built in 1998. The basin used to suffer with flood problems, however, the interventions in the main channel have minimized the occurrence of floods. Therefore, there are no major flood control structures in this watershed.
Several tributaries, though, still face frequent flooding issues, like the Tabatinguera Stream. Some of those tributaries are part of current and near future projects from the city hall for channeling and/or frequent maintenance. For the main channel itself there is a greenway designed for the part of the avenue above the gallery. While it doesn’t have a great impact on the hydraulic performance of the stream, it slightly increases the pervious area and surface roughness, and is a public space for pedestrians.
2.1.5 Morro do S
Morro do S watershed is located in the southwestern region of São Paulo and is a tributary of the left margin of the Pinheiros River. The basin has an area of 22.6 km², of which more than 90% is urbanized, resulting in an average population density of 182.2 inhab./ha.
The basin has critical areas that suffer from severe flooding, located in the upstream section and in the downstream connection with underground galleries that changes to pressure flow each time critical rainfall events strike. Alongside with an uncontrolled growth, there are several aspects that cause the basin problems, such as the morphology of its terrain, and the restrictions in some points of the main drainage channel sections. There are two main projects to prevent the flooding in the watershed: (i) the construction of a reservoir located upstream of the main channel, with a volume of 192.000 m³, and (ii) the restructuring of the channels that are upstream from the designed reservoir. Some other minor structures are planned for the basin, like building a park alongside the river that is under construction. There are also 13 drainage improvements projected, planned with the Tietê’s basin macro-drainage master plan, including other two reservoirs and several channel restructuring.
2.1.6 Pirajuçara
The Pirajuçara Stream is a Pinheiros River’s left margin tributary. Its basin is located at São Paulo Metropolitan Region western zone and drains an area of approximately 72 km², also laying in the municipalities of Taboão da Serra and Embu. The Pirajuçara watershed is almost totally urbanized with an average population density of 125.6 inhab./ha. Although there are some places with vegetation (virgin forest inside Poá sub-basin, isolated forests and green areas), the flooding effects are recurrent due to high density urban land use.
In order to prevent these issues, the river was channeled and six off-stream reservoirs were implanted: four of them at Pirajuçara Stream, with a total storage capacity of 843,000 m³, and two of them on tributaries (Joaquim Cachoeira and Poá streams) with a total storage capacity of 237,000 m³. Currently, the Olaria reservoir is being built alongside the channel to control the flood of the Olaria River. Furthemore, six other interventions are planned: two reservoirs in Antonico Stream, one reservoir in Poá

5
Stream, two polders in Campo Limpo and Taboão da Serra and channeling of some parts of Pirajuçara and Poá streams.
Figure 1 illustrates the location of study watersheds and the limits of the city of São Paulo.
Figure 1: Area view of study watersheds and the limits of the city of São Paulo
2.2 Meteorological monitoring
Rainfall data and prediction are obtained, processed and disclosed by the Flooding Alert System of São Paulo (SAISP), established in 1977 after the critical storm events from previous year showed the need for a real time hydrologic monitoring. The System operates the meteorological radar that belongs to Department of Water and Energy of the State of São Paulo (DAEE) as well as over 200 telemetric stations responsible for the collection and transmission of water depth and rainfall data.
Each telemetric station contains a data logger, GSM modem with antenna, stationary battery with solar panel and several sensors as tipping bucket rain gauge, weather station, water level sensor and water quality probe. New data is normally obtained every 10 minutes, but frequency can be increased to 1 minute during storm events. Acquired data are stored on the data logger and then are immediately transferred via the GSM modem to a data receiving system located at CTH, where it is then stored in the data repository of telemetric network.
The weather radar is located on the border of the municipalities of Biritiba Mirim and Salesópolis, at the Ponte Nova dam, in the headwaters of the Tietê River. The radar operates in S-band frequency and has a standard 2x2 km horizontal spatial resolution within a radius of 240 km. The images are scanned every 30 min when no precipitation is detected and every 5 minutes from the moment it detects traces of precipitation. In this work the CAPPI (Constant Altitude Plan Position Indicator) product was used at 3 km height above sea level. Spatial rainfall forecast is generated by the SHARP model (Short-Term Automatic Rainfall Prediction). The model is based on the spatial correlation between two CAPPI images at different moments and produces rainfall prediction every 10 minutes for up to 3 hours ahead. Flow forecast can

6
also be generated by using the radar data with a stochastic linear model. All data generated by weather radar, including forecast, are transmitted via the Internet to the SAISP datacenter and stored in the repository of weather radar data.
Figure 2: Rain gauges and weather radar location and range
Both measures of precipitation with rain gauge network and rainfall estimates from weather radar contain errors. The inaccuracies associated with the estimation of precipitation by weather radar are related to calibration of equipment, processing of effective reflectivity precipitation rate equation, bright band, and others (Gonçalves, 2005). On the other hand, rainfall measured by rain gauges are local and do not have large spatial representativeness. When the flood control system relies on reservoirs and other hydraulic structures, the flow spatial and temporal distributions play an important role in system performance and therefore it is not permissible to accept the hypothesis of homogeneous precipitation, which would allow the use of a discrete rain data. The integration of rainfall measured by a network of rain gauges with data from weather radar can minimize errors in the precipitation estimation (Rocha Filho et al, 2013). The method applied for the integration of radar data and telemetry by SAISP is the Conditional Merging, which assumes that the weather radar is able to accurately capture the spatial precipitation field, but not its intensity, while the rain gauge is able to measure accurately the rain in a given point in the basin. Once using data from a network of rain gauges to correct the radar, it is expected that spatial inaccuracies and local rainfall intensity errors are minimized. A complete description of the methodology can be found in Ehet (2002). Therefore, the integrated rainfall gathers the best from each data source and integrates them, storing them in the integrated rainfall repository at SAISP data center. These integrated data are finally available through a SQL Server database.
2.3 Model development
The system allows the estimate of flow and water depth on channels and reservoirs as well as the extents of flooded areas. The model applied was the Storm Water Management Model (SWMM), available by US Environmental Protection Agency (EPA), with the PCSWMM interface, developed by Computational Hydraulics International (CHI). The results can be viewed as graphics, tables, maps and profiles, both of which can be animated. The model also alerts to more vulnerable areas, based on previous definition of strategic areas of interest, which can be available at several platforms in real time so technicians from Emergency Management Center (CGE) and competent authorities can access it.
The rainfall-runoff model is represented by the subcatchment parameters, which describe watershed’s geometric characteristics (area, width or flow length, average slope), surface characteristics (surface roughness and depression storage for both pervious and impervious area) and the infiltration capacity,

7
modeled in this project with the Soil Conservation Service (SCS) curve number (CN) method. Due to the complexity of the groundwater modeling methodology, which requires up to 24 parameters per subcatchment, and also due to the lack of information to parameterize this model component, this module is not being adopted in this modeling step.
A fundamental tool to the development of digital watershed modeling consists in the Digital Terrain Models (DTMs), on which the delimitation of subcatchments, the average surface slope and the boundaries of the flood extents are based. Thus the DTMs used in the model must rely on the most accurate available information. In this study, data from a very detailed field survey provided by PMSP and supplementary data from the basin plan of the Upper Tietê river for the Pirajuçara basin were combined with hydrography data using a tool from ESRI ArcGIS 10.1 in order to produce a DTM that accurately represents the terrain slope both inside and outside the channels. Consequently, dividing the basins was substantiated on DTM features, based on the main points of interest of each basin. The choice of the points of interest considered the selection of channels to be modeled, important confluences, major control points of precipitation and flow, installed rain or water level gauges and also the location of flood control hydraulic structures.
For the estimation of surface and infiltration parameters, the state land use and occupation database of the Paulista Company of Metropolitan Planning (Emplasa), dated 2002, was extensively applied. Firstly, the parameters were estimated for each land use based on literature recommended values. Then, the values of each subcatchment were calculated as an area weighted average of the different existing land uses within its area, representing the average occupation of the basin. Finally, CN values were validated with the ones presented in the Master Plan of Drainage and Stormwater Management in São Paulo (PMAPSP), indicating the consistency of the applied method. However, in the case of SWMM modeling, the CN parameter is only related to the pervious area, requiring a posterior conversion of average CN values. Those estimated parameters were then more accurately determined during the model calibration process.
In addition to the individual parameters of the subcatchments, the hydrological model was provided with data from evaporation, an important variable for continuous simulation runs. In this study, evaporation data were input as a daily abstraction rate for each calendar month, based on the historical average monthly evaporation in the city of São Paulo (Sentelhas et al, 1999):
The hydraulic model consists of flow networks built on PCSWMM, representing the hydrography and other flood control structures. The hydrodynamic model utilizes the dynamic wave method to route flows through the drainage system, which is the most complex and accurate model to simulate the occurrence of conduit overflow through manholes. The runoff from each subcatchment is concentrated in the most downstream node making the modeling of channels in headwater subcatchments unnecessary, considering only these subcatchment hydrologic contributions. Since groundwater was not considered in this model, the specific baseflow rate for each basin was determined based on a field survey performed by the local sanitation company, considering the smallest flow during dry weather. Its value and daily variation were calibrated according to observed time series, fitting the results to the dry weather pattern of telemetric data. Portions of the time series when no rain occurred were analyzed to create a dimensionless pattern of its variation during a day. A multiplier factor is then adjusted for each subcatchment so the baseflow is the product of the pattern and this factor.
Data for channels and other hydraulic structures regarding modeled rivers were obtained from original structural projects and field surveys. The surveys are extremely important due to the absence of as built projects and poor maintenance of drainage system. In order to obtain a good representation of the channel characteristics, while trying to achieve maximum compatibility with the DTM, surveyed and available project data were combined with the DTM information. Average cross sections based on the DTM were obtained for each reach through a PCSWMM tools. The channel sections were then fitted on these average sections.
In order to generate flood inundation polygons above the underground network, a second network was added on the ground level, connected to the first one through orifices, configuring a dual drainage

8
system. The first level represents the storm sewers which, once at full capacity, turns into pipe flow and makes the hydraulic grade line to raise above the ground level. The second level represents the superficial network, the surface where stormwater flows when sewers are surcharged. The flood inundation polygon will then be drawn as long as underground and superficial networks are connected. To do so, orifices with diameter similar to a standard manhole were used so the water could flow both ways in the model, representing the drainage system in a more accurate way. A similar approach was used to model bridges: two parallel conduits exists between the nodes around the bridge, one representing the section under the bridge, and the second representing the flow over the bridge.
Table 1 and Figure 3 illustrate the hydrologic and hydraulic networks for each of the basins.
Table 1: Model networks summary
Água
Espraiada Aricanduva
Cabuçu de Baixo
Mandaqui Morro do S Pirajuçara
Area (km²) 11.3 101.5 42.5 18.5 22.6 65.8
Subcatchments 4 23 12 5 7 11
Links 126 224 390 65 102 168
Modeled length (km) 7.2 30.0 31.8 3.6 8.8 30.2
Junctions 112 178 375 45 93 137
Storage units 1 13 3 - - 6
Total storage volume (m³) 360,000 2,416,955 1,099,591 - - 1,080,000
Orifices 3 15 28 1 29 8
Weirs 1 13 3 - - 10
Figure 3: Model network for each basin
9
Resulting water levels were compared to observed values during dry and rainy periods, allowing a fine-tuning of some subcatchment parameters, like CN values, manning's n and depression storage.
In addition to long-term rainfall records, design storm events were applied. The design storms applied were characterized through the intensity-duration-frequency (IDF) relations, which assign the average precipitation intensity at a given duration and probability of occurrence, usually expressed as a period that is the inverse of frequency. These relations are obtained by a series of intense rainfall data, sufficiently long and representative. The equation used for our studies is inferred from the station IAG / USP - E3-035 (23°39'S, 46°38'W). Its applied data period is 1933-1997 (65 years), as described by Martinez Jr. & Magni (1999). In this study, the alternating block method is applied to the temporal distribution of rainfall obtained using IDF relations, adopting a 2-hour critical duration. This distribution is not related to physical phenomena, but it is an empirical method that characterizes a critical condition. Return periods selected correspond to 5, 10, 50 and 100 year and an areal reduction factor for each basin. Offline watershed calibrated projects for design storms are available to specialists so they can evaluate and carry out new structural projects. The technicians also undergo training courses in order to take full advantage of the model capabilities.
3. RESULTS AND DISCUSSIONS
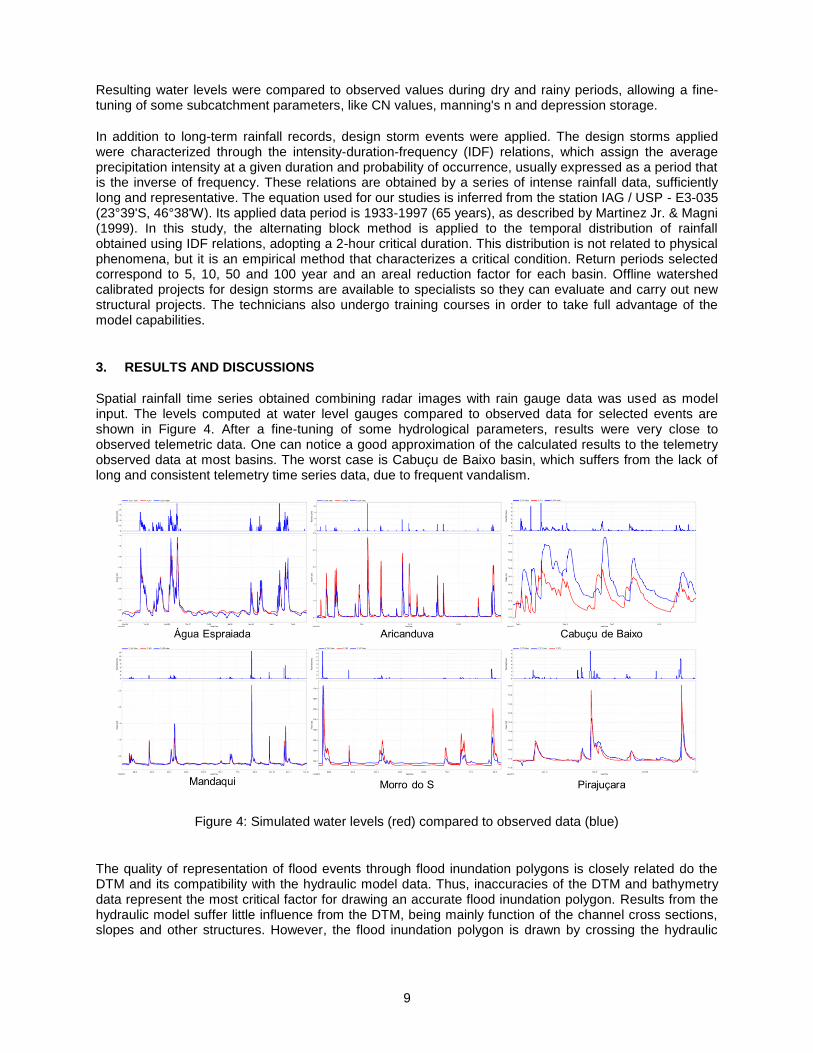
Spatial rainfall time series obtained combining radar images with rain gauge data was used as model input. The levels computed at water level gauges compared to observed data for selected events are shown in Figure 4. After a fine-tuning of some hydrological parameters, results were very close to observed telemetric data. One can notice a good approximation of the calculated results to the telemetry observed data at most basins. The worst case is Cabuçu de Baixo basin, which suffers from the lack of long and consistent telemetry time series data, due to frequent vandalism.
Figure 4: Simulated water levels (red) compared to observed data (blue)
The quality of representation of flood events through flood inundation polygons is closely related do the DTM and its compatibility with the hydraulic model data. Thus, inaccuracies of the DTM and bathymetry data represent the most critical factor for drawing an accurate flood inundation polygon. Results from the hydraulic model suffer little influence from the DTM, being mainly function of the channel cross sections, slopes and other structures. However, the flood inundation polygon is drawn by crossing the hydraulic
10
model results for water level in channels with the DTM elevation. The existence of any divergence between these elevations may lead to spatially inaccurate polygons.
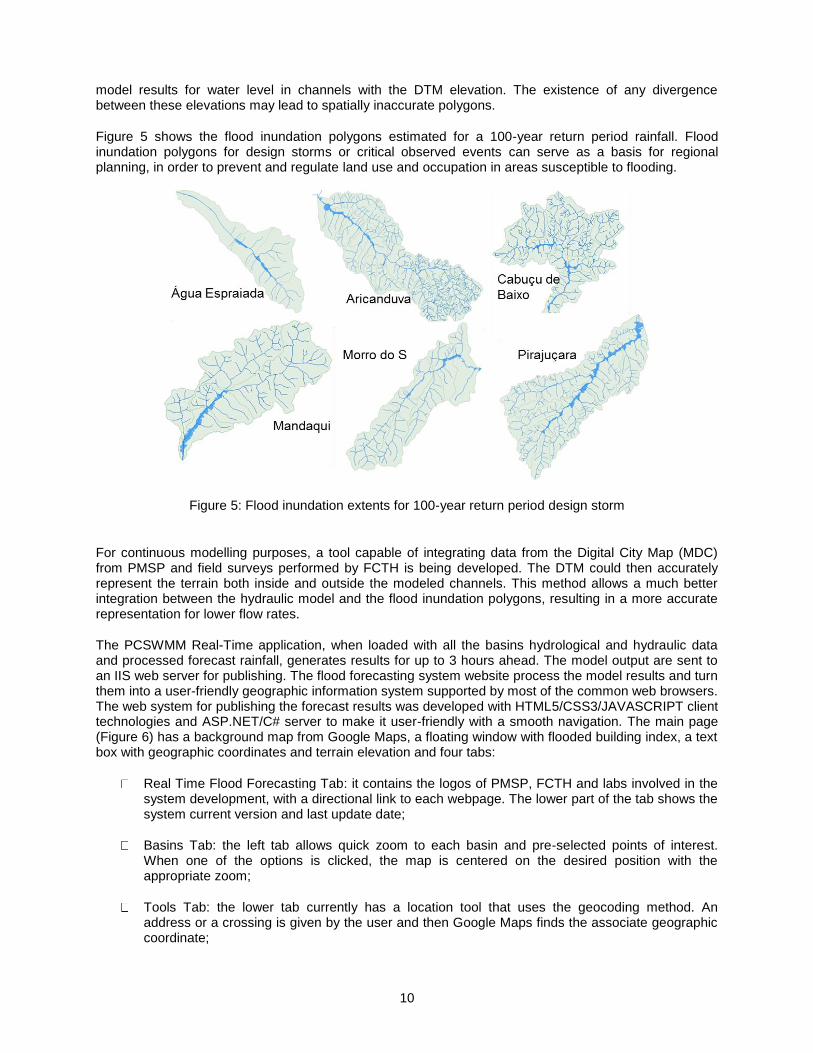
Figure 5 shows the flood inundation polygons estimated for a 100-year return period rainfall. Flood inundation polygons for design storms or critical observed events can serve as a basis for regional planning, in order to prevent and regulate land use and occupation in areas susceptible to flooding.
Figure 5: Flood inundation extents for 100-year return period design storm
For continuous modelling purposes, a tool capable of integrating data from the Digital City Map (MDC) from PMSP and field surveys performed by FCTH is being developed. The DTM could then accurately represent the terrain both inside and outside the modeled channels. This method allows a much better integration between the hydraulic model and the flood inundation polygons, resulting in a more accurate representation for lower flow rates.
The PCSWMM Real-Time application, when loaded with all the basins hydrological and hydraulic data and processed forecast rainfall, generates results for up to 3 hours ahead. The model output are sent to an IIS web server for publishing. The flood forecasting system website process the model results and turn them into a user-friendly geographic information system supported by most of the common web browsers. The web system for publishing the forecast results was developed with HTML5/CSS3/JAVASCRIPT client technologies and ASP.NET/C# server to make it user-friendly with a smooth navigation. The main page (Figure 6) has a background map from Google Maps, a floating window with flooded building index, a text box with geographic coordinates and terrain elevation and four tabs:
Real Time Flood Forecasting Tab: it contains the logos of PMSP, FCTH and labs involved in the system development, with a directional link to each webpage. The lower part of the tab shows the system current version and last update date;
Basins Tab: the left tab allows quick zoom to each basin and pre-selected points of interest. When one of the options is clicked, the map is centered on the desired position with the appropriate zoom;
Tools Tab: the lower tab currently has a location tool that uses the geocoding method. An address or a crossing is given by the user and then Google Maps finds the associate geographic coordinate;

11
Map Layers Tab: the right tab lets the user turn some map layers on or off. The current layers are:
o Common layers: rainfall radar image animation and other yet to be included layers;
o Basin specific layer: drainage basin boundaries, subcatchments, hydrography, telemetric stations, hydraulic structures and flood inundation polygon animation.
Figure 6: Real-time system main page
The background map keeps all its features from Google Maps, such as Pan, Zoom In, Zoom Out, Street View and the image options Map/Satellite/Terrain. In addition to that, a new feature was added: a small box on the lower right corner shows geographic coordinates for the mouse pointer. After 1 second standing on the same position, the box also shows the Google maps elevation on the box. The page is refreshed every 1 min, however, model input data is updated every 10 min.
A floating window, which can also be seen in Figure 6, shows flooded building indexes according to the last updated input data. From the surface flood levels, a flood risk analysis of buildings was carried out, quantifying the risks. This analysis was conducted from a flood elevation assigned to the building, originating from the DTM, compared to the water head in the hydraulic segment closest to this building. This analysis tool is part of the differentials of the PCSWMM interface. The bar graph on the left indicates the number of buildings subject to flooding risk for each basin, while the graph on the right indicates the current situation of the most critical building among all the basins. The risk levels are:
Above 100 cm: no imminent risk;
Between 100 and 50 cm: attention;
Between 50 and 20 cm: alert;
Between 20 and 0 cm: emergency; and
Below 0 cm: flooded.
12
4. CONCLUSIONS
The presented model allows a good analysis of storm events and its consequences. However, there are some obstacles to obtain accurate results. As in any transformation process, poor raw material leads to poor outcome. Absence, insufficiency or low quality data are major issues for the model application, producing inaccurate results. The main problems faced in this project were:
Scarce cross section data, which led to field surveys not planned in the initial budget;
Low quality of available DTM, limiting the flood inundation polygon accuracy;
Lack of operating rules for polders and reservoir and lack of as-built drawing for hydraulic structures, forcing the use of inputs that may not well represent the current state of such structures;
Poor structure maintenance, causing their performance to decrease as time passes by;
Vandalism at rainfall and flow gauge stations, reducing the availability of data;
Lack of flooding reports.
The study demonstrates the need of better data and information, which is very common issue in Brazil. However, even with some difficulties, the proposed system serves as an important assistance to emergency management in forecasting and during floods, providing real time, user-friendly information of affected areas. In addition, the model is able to identify inefficiencies and failures of hydraulic structures and operating rules and/or procedures, indicating the best improvements opportunities.
5. REFERENCES
Gonçalves, J. E. et al. Estudo da viabilidade da utilização de estimativas de chuva efetuadas por radar na modelagem hidrológica. In: Congresso Brasileiro de Meteorologia, 13., 2004, Fortaleza, CD-ROM
Martinez Junior, F.; Magni, N.L.G. Equações de chuvas intensas do Estado de São Paulo. São Paulo: Departamento de Águas e Energia Elétrica, Escola Politécnica da Universidade de São Paulo, São Paulo. 1999. 125 p
Rocha Filho, K.L;Conde, F.; Andrioli, C.P. Correção em tempo real da precipitação estimada por uma radar metrológico com uma rede de superfície. In Anais do XX Simpósio Brasileiro de Recursos Hídricos, Bento Gonçalves, Nov. 2013.
Sentelhas, P.C.; Pereira, A.R.; Marin, F.R.; Angelocci, L.R.; Alfonsi, R.R.; Caramori, P.H.; Swart, S. Balanços Hídricos Climatológicos do Brasil - 500 balanços hídricos de localidades brasileiras. Piracicaba: ESALQ, 1999.