cost optimal river dike design using...
TRANSCRIPT

1
COST OPTIMAL RIVER DIKE DESIGN USING PROBABILISTIC METHODS K. Bischiniotis1, W. Kanning1&2, S.N. Jonkman1 1. TU Delft 2. Deltares
ABSTRACT: This research focuses on the optimization of river dikes using probabilistic methods. Its aim is to develop a generic method that automatically estimates the failure probabilities of many river dike cross-sections and gives the one with the least cost, taking into account the boundary conditions and the requirements that are set by the user. Even though there are many ways that may provoke the dike failure, the literature study showed that the failure mechanisms that contribute most to the failure of the typical Dutch river dikes are overflowing, piping and inner slope stability. Based on these, the most important design variables of the dike cross-section dimensions are set and following probabilistic design methods, the probability of failure of many different dike cross-sections is estimated taking into account the abovementioned failure mechanisms. Different cross-section configurations may all comply with a set target probability of failure. Of these, the cross-section that results in the lowest cost is considered the optimal. This approach is applied to several representative dikes, each of which gives a different optimal design, depending on the local boundary conditions. The method shows that the use of probabilistic optimization gives more cost-efficient designs than the traditional partial safety factor designs.
Key Words: River dike, Optimization, Probabilistic design, Cross-section, Failure probability
1. INTRODUCTION
Dikes are important types of hydraulic structures, which aim to protect the inland from flooding. Especially in the Netherlands, where the local conditions make the country vulnerable to flooding, they occupy thousands of kilometers all across the coast and the rivers. Like the majority of the civil engineering structures, their design is based on guidelines that follow the semi-probabilistic methodology using partial safety factors. On the one hand, this methodology produces results, which satisfy the requirements with relatively easy calculations. On the other, it often leads to the over dimensioning of the structures, which means that the designs are not the most economical ones or, in other cases, do not reflect the required safety level. Therefore, during the last years, the Dutch defense policy is turning towards more risk-based approaches (Jonkman et al., 2011; Schweckendiek et al., 2012). This means that the failure probabilities are quantified and the future safety standards will most likely be expressed as required failure probabilities (and not as design water levels with a probability of exceedance).
The most important criterion for the dike design is the fulfillment of the safety requirements. These are based on a risk analysis and will be expressed in the new future as a failure probability, either for a dike ring system or individual dike sections.
In this study, a methodology for calculating the probability of failure of a single river dike cross-section is developed in order to allow its probabilistic optimization. Based on a predetermined target failure probability and taking into account the failure mechanisms that contribute most to the river dike failure, the optimal cross-section, in terms of minimal construction costs, is determined. The model differs from existing methods in that sense that it adds the optimization capability over a large number of cross sections, mechanisms and configurations, whereas existing models mostly focus on the reliability analysis for a single geometry (e.g. PC Ring, see section 2), or on the optimization for a single failure mode.

2
.
2. MODEL FOR PROBABILISTIC OPTIMIZATION OF RIVER DIKES
2.1 General Procedure For Finding The Optimal Cross-Section
The introduction of the computer power and the improved load and strength models have made it possible to quantify in a more elaborated way the probability of a dike failure and to estimate, which are the parameters that contribute most to the occurrence of a flood. Characteristically, in 1990’s, a software program called PC-Ring was developed by the Dutch authorities, on which a probability based flood protection design method was established. This software combines more than 50 variables (geotechnical, hydraulic, etc.) in order to determine the probability of failure for every single dike section within a specified dike ring area (de Boer, 2007).
In the Netherlands, the dikes are typically assessed based on a safety standard, which is a water level with a certain probability of exceedance (HR, 2006). In this paper, we assume that the target probability of failure is equal to the safety standard. The aim is to design new dikes and reform the existing dikes in such a way that they fulfill this safety requirement. With the current methods, the geometric characteristics of the dikes during the design are usually roughly estimated, having as a consequence, the final design to deviate significantly from the more economical solution.
The modeling approach presented herein, develops a methodology for achieving the cost-optimal, in terms of construction costs, river dike cross-section by changing the 4 main cross-section parameters. It is based on the previous work of Voortman, who developed a decision framework to reach the optimal dimensions of the coastal flood defence structures (Voortman, 2003) and Smolders, who optimized the river dike cross-section by changing 2 design parameters (Smolders, 2010). The analytical procedure used to determine the cost-optimal cross-section can be divided in three distinct steps. The first step comprises the analysis of the failure mechanism of the inner slope stability using the software DGeoStability and the probabilistic calculations of the failure mechanisms of overflowing and piping using Matlab. In the second step, the total probability of failure of the river dike cross-section is calculated and evaluated, while the third step involves the cost estimation based on material quantities. The procedure is repeated for many different dike cross-sections and finally, the cross-section with the least cost that fulfills the safety requirements is indicated. This optimization procedure is illustrated in Figure 1, where Pf is the actual probability of failure of the cross-section and Pftarget the target probability of failure for the cross-section.
Figure 1: Optimization Procedure

3
2.2 Failure Mechanisms Of River Dikes
One of the most important steps in the risk analysis of a flood defence system is the determination of the failure mechanisms that are taken into account. Although there are a lot of ways that can provoke the dike failure, it has been identified (TAW, 1989), (Möllmann & Vermeer, 2010) that the failure mechanisms that contribute most to the failure of a river dike are overflowing, piping and inner slope stability. These failure mechanisms are the ones that are taken into consideration in this study and are expected to be most relevant for typical Dutch river dikes.
Overflowing occurs when the still water level plus an increase because of wave overtopping exceeds the dike crest. Piping is the erosion that occurs under the cohesive layer in the subsoil and is induced by the water level difference between the lee side and the protected side. Finally, the inner slope stability occurs when the inner slope of the dike collapses (e.g. because of weak soil, high phreatic line inside the dike core).
In the probabilistic assessments, the quantitative analysis of the failure is done based on a mathematical expression, the so-called Limit State Function Z, which has the form of Equation 1:
Z = Resistance – Load [1]
When Z=0, it is the boundary between the failure (negative values of Z) and the non-failure situation (positive values of Z). Hence the probability of failure is expressed as P {Z<0}. Each failure mechanism has its own Limit State Function, which can be shown in Table 1.
Table 1: Limit State Functions of the failure mechanisms in this research
Failure mechanism Limit State Function Symbols
Overflowing
Z! = H!"#$ − H!"#$% Hdike [m] is the height of the dike crest and Hwater [m] is the still water level
Piping
Z! = H!"#$ − H!"#$%
Hcrit [m] is the critical water height difference between the unprotected and the lee side of the dike (use of the Sellmeijer equation (Sellmeijer, 1988) ) and Hwater [m] is the still water level.
Inner slope stability
𝑍! =𝑅!𝑆!
− 1 ΣRM Resultant of the resistance moments, ΣSM Resultant of the load moments
As it is mentioned in the table, the critical water height difference in the Limit State Function of piping is given by the Sellmeijer equation, which is:
H!"#$ = a ∙ c ∙ !!!!∙ tan θ ∙ 0.68 − 0.10 ∙ lnc ∙ L [2]
where

4
a = !!
!.!"!!!.!
!! [3]
𝑐 = 𝜂 ∗ 𝑑!" ∗!!!
!! [4]
𝜅 = !!∗ 𝑘 [5]
where L[m] seepage length, ρρ [kg/m3] density of water grains under water, ρw [kg/m3] density of water, θ [degrees] bedding angle, D [m] thickness of the erodible layer, d70 [m] sand particle diameter of 70% weight grain size distribution, η [-] hydraulic drag factor, κ [m2] intrinsic permeability, u [m2/s] kinematic viscosity, g [m/s2] gravitational acceleration, k [m/s] permeability.
2.3 Probabilistic Analysis Of River Dikes
2.3.1 Reliability methods
The reliability of a structure or of an element in civil engineering projects is usually expressed as its probability of non-failure. Due to the fact there are not always certain or known values neither for the resistance nor for the loads, inevitably, there is uncertainty at their determination. Varying from case to case, the safety can be calculated with different methods for reiability analysis, which can be grouped under three basic ‘levels (CUR190, 1997):
Level I: This is the semi-probabilistic approach, where safety factors and characteristic values are used. The structure is considered reliable in case a certain margin is kept between the representative values of the strength and of the load.
Level II: It is one of the two fully probabilistic levels. It calculates the failure probability by linearizing the reliability function at a certain point and approximating the probability functions of the variables by standard normal distributions (e.g. FORM, SORM).
Level III: It is a fully probabilistic method that considers the probability density functions of the random variables that are extended over the safety domain. The reliability is directly linked to the probability of failure (e.g. Monte Carlo Simulation, Numerical Integration).
A combination of level II and level III methods is followed in this research.
2.3.2 Probabilistic methods used to determine the fragility curves of the considered failure mechanisms
The first step that is followed in this research in order to estimate the probability of failure of the dike cross-section is the creation of the fragility curves.
A fragility curve is a curve that expresses the conditional probability of failure as a function of the load. Hence, for each deterministically defined water level, the conditional probability of failure can be found. A typical fragility curve for the piping mechanism is shown in Figure 2.

5
. Figure 2: Typical fragility curve for a piping sensitive dike (Bischiniotis, 2014)
In this research, an effective routine of the Monte Carlo analysis is developed for constructing the fragility curves of overflowing and piping failure mechanisms. The basic idea is to produce a large number of sample values of the random variables according to their distribution functions and their statistical properties and by using Matlab scripts, approximate a solution by the use of the Limit State Function.
As for the fragility curve of the inner slope stability, an automated procedure that combines Matlab and the software DGeoStability is developed. The created Matlab scripts generate the different river dike cross-sections and save them to files that are compatible with DGeoStability. The DGeoStability runs the batch files giving the probability of failure for each cross-section for different water levels, making use of Level II probabilistic method of FORM. Once again, the Matlab scripts read the produced files and the fragility curve of the inner slope stability can be constructed.
2.3.3 Determination of the cross-section fragility curve using fault trees
The fault tree analysis is a crucial step for the safety evaluation. In order to approach the solution, it is necessary to define how the base events lead to the failure of the system. Thus, in this study, the base events are the failure mechanisms and they form a series sytem of independent components. This means that whichever of the three mechanisms happen, the cross-section of the river dike fails. The fault tree in Figure 3 shows the relation between the failure mechanisms and the failure of a river dike section, which results in the inundation of the protected side.
Figure 3: Fault tree of the river dike, showing the three considered failure mechanisms
Hence, knowing the probability of failure of all the failure mechanisms for each water level, the combined total probability of failure for each water level can be found using the formula of Equation 6:
P!"!#$ = 1 − 1 − P!!!!! [6]
where Ptotal is the total probability of failure and Pi is the probability of individual failure mechanisms.
In this way, a combined fragility curve can be constructed.

6
2.3.4 Determination of the annual failure probability using numerical integration
This method is used for calculating the annual failure probability of the river dike cross-section, taking into account all the failure mechanisms.
Following the assumption that the strength (R) and the load (S) are independent, the failure probability for a certain value of the load, which in this study is only the water level, can be described by the integral in Equation 7 (van der Meer et al., 2009):
P! = f!"!!!!!!! h! F! h! dh! [7]
in which fhw(hw) is the probability distribution function of the water level and FR(hw) is the cumulative distribution function of the strength given a certain water level hw (i.e. in this study is the combined fragility curve).
2.4 Target Failure Probability And Cost-Optimization
In the Netherlands, each dike section has to comply with predetermined safety standards. These standards - here expressed by means of a target failure probability - can be achieved through different cross-section configurations. In this study, after setting the safety standards, the cross-sections that comply with them are determined. For these cross-sections the cost is estimated. Finally, the optimal cross-section is selected and it is the one that both complies with the safety requirements and has the lowest cost. The cost of each cross-section is estimated taking into account the volumes of the materials that are required for the construction, their excavation and their transport, their delivery and their installation and the required land area that is expropriated.
As for the safety standards, the target probability of failure is chosen in accordance with the current flood protection standards in the Netherlands (1/1250 per year). It is considered that the cross-sections, which have this probability of failure with a deviation of 10%, fulfill the safety requirements.
2.5 Generation Of Multiple Cross-Sections
The methodology of this research is applied on a river dike cross-section, which consists of the dike core and the berm. Four important geometric characteristics are the design variables; the height of the dike (Hdike [m]), the inner slope of the dike (θinternal), the height of the berm (Hberm [m]) and the width of the berm (Wberm [m]). Some geometric characteristics that are affected by the change of the design variables also alter. These are the total width (Wtotal [m]) and the gradient of the external slope (θexternal). The ones that they are not affected by the change of the design variables, they keep a constant value. These are the width of the crest (Wcrest [m]), the width of the ditch Wditch [m], the height of the ditch Hditch [m], and the width of the three layers of the subsoil D1 [m], D2 [m], D3 [m]. Figure 4 illustrates in blue the design variables and in black the rest geometric characteristic of the cross-section that is used.

7
Figure 4: typical cross-section and variables used in the research
The boundary values of the design variables and which failure mechanism is directly affected by them are presented in Table 2.
Table 2: Boundary values of the design variables Design Variable Symbol Unit Min-Max Value Directly affected failure mechanism Height of the dike Hdike m MHW-MHW+3.5m Overflowing Inner slope θinner - 1:10-1:2 Piping, Inner slope stability Height of the berm Hberm m 0-3 Inner slope stability Width of the berm Wberm m 0-20 Piping, Inner slope stability
Summarizing, through the developed automated procedure, a wide range of geometries is generated. Following the Monte Carlo simulation method, the fragility curves for overflowing and for piping are constructed for each cross-section, while the fragility curve of inner slope stability is constructed using the software DGeoStability. Having all the fragility curves, the combined fragility curve is found using the Equation 14 Finally, the overall probability of failure for each cross-section is calculated through Equation 5, using the combined fragility curve and assigning a Gumbel I distribution to the water level.
Moreover, having the fragility curves of all the failure mechanisms, the probability of failure of each one of them can be calculated. Consequently, the relative contribution of every failure mechanism to the overall failure probability can be found.
3. APPLICATION OF THE METHOD TO A REPRESENTATIVE DUTCH CASE
3.1 Example
An example of the results that are produced by the described method is given. First, the stochastic and the deterministic parameters are defined in Table 3. The dike and the berm are constructed by weak-strength soil. The upper subsoil in the area of the dike is highly impermeable, forming an increased leakage length and hindering the phenomenon of piping. Based on the defined data, the developed Matlab scripts simulate a number of cross-sections, which depends on the ‘step’ that the design variables change. Table 3: Stochastic and deterministic variables for the Case Study
Variable Symbol unit Distribution Mean value Standard deviation
Water level hw m Gumbel I* 2.124 0.1949 Pore water pressure uw kN/m2 Lognormal - 0.5 Permeability coefficient k m/s Lognormal 10-4 10-4 70% value of the sand grain distribution
d70 m Lognormal 200*10-6 30*10-6

8
Bedding angle θ degrees Lognormal 0.07 3 Sand friction angle φsand degrees Lognormal 32 7 Soft Clay friction angle φclay degrees Lognormal 17 3.7 Soft Clay drained cohesion cclay kN/m2 Lognormal 5 1.1 Berm material friction angle φberm degrees Lognormal 21 4.6 Berm material drained cohesion
cberm kN/m2 Lognormal 5 1.1
Unit weight sand above phreatic level
γρ kN/m3 Deterministic 17
Unit weight of sand below phreatic level
γs kN/m3 Deterministic 20
Unit weight of soft clay above phreatic level
γsc1 kN/m3 Deterministic 14
Unit weight of soft clay below phreatic level
γsc2 kN/m3 Deterministic 14
Unit weight of berm material above phreatic level
γb1 kN/m3 Deterministic 14
Unit weight of berm material below phreatic level
γb2 kN/m3 Deterministic 14
Water density ρw kg/m3 Deterministic 1000 Gravitational acceleration g m/s2 Deterministic 9.81 Kinematical viscosity u m/s Deterministic 1.33*10-6 Hydraulic drag factor n - Deterministic 0.25 * The Gumbel I distribution is described by 4 parameters; the first two are mentioned in the table, while the 3rd and the 4th are the location parameter (α) and the scale parameter (β).
In Table 4, the boundary values and the step followed by the design variables is given. These produce 1989 river dike cross-sections that are simulated. The estimation of the total calculation time is also given.
Table 4: Design variables and estimated calculation time Symbol Description Unit Minimum Value Maximum Value Step
Hdike Height of the dike m 3.4 5 0.1 θinner Gradient of the inner slope angle degrees 1:5 1:2 0.025 Hberm Height of the berm m 1 3 1 Wberm Width of the berm m 2 6 2
Total cross-sections: 1989 Estimated time for Macro stability calculations=4h Estimated time for Matlab algorithm=15mins
3.2 Fragility Curves And Water Level Distribution
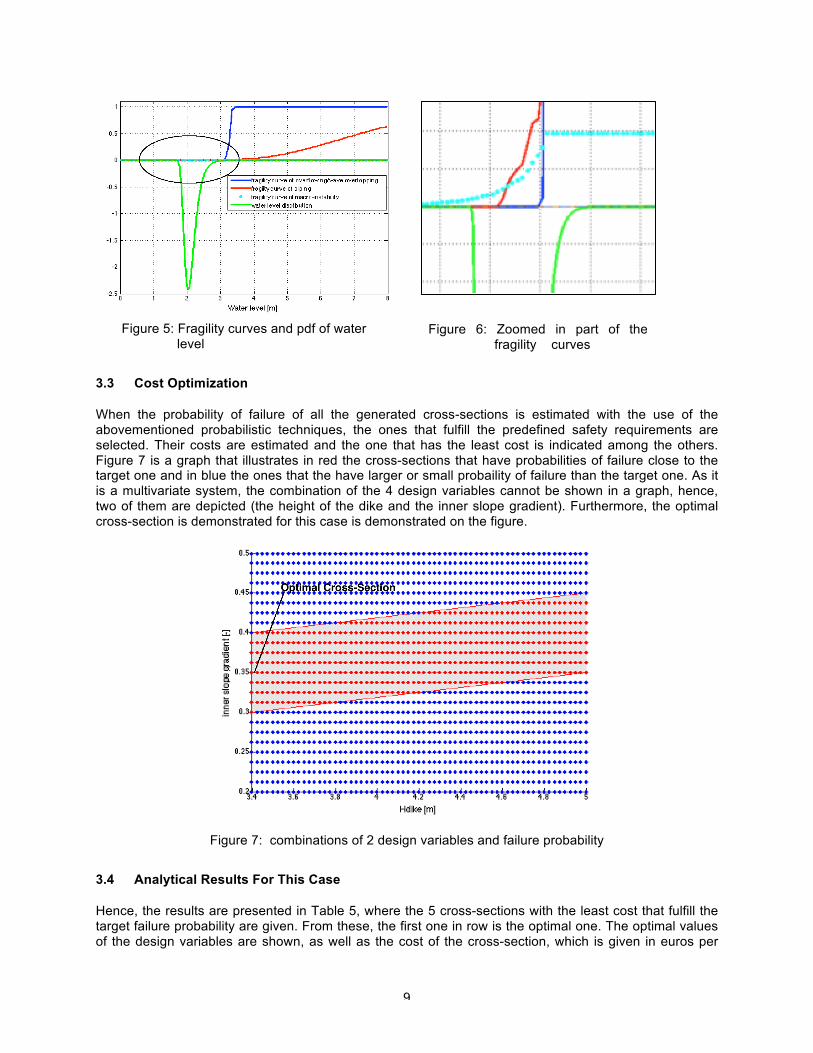
As mentioned before, the fragility curves of each cross-section are produced, see Figure 5 for an illustration. This shows an example of the fragility curves of all the failure mechanisms combined with the probability density function(pdf) of the waterl level for a cross-section. In blue, it is the fragility curve of overflowing, in red the one of piping and in light blue the one of inner slope stability. The probability density function of the water level (Gumbel I) is given in green. In order to estimate the failure probability of the cross-section, the numerical integration method, as described before, has to be followed. The part of the curves that the results are highly affected is where the probability density function of the water level is denser. This part is presented in more detail in Figure 6. This clarifies that especially piping and inner slope stability will contribute to the failure probability in this case, as the highest probability of density of the water level coincides with the failure domain for these mechanisms. .
9
Figure 5: Fragility curves and pdf of water level
3.3 Cost Optimization
When the probability of failure of all the generated cross-sections is estimated with the use of the abovementioned probabilistic techniques, the ones that fulfill the predefined safety requirements are selected. Their costs are estimated and the one that has the least cost is indicated among the others. Figure 7 is a graph that illustrates in red the cross-sections that have probabilities of failure close to the target one and in blue the ones that the have larger or small probaility of failure than the target one. As it is a multivariate system, the combination of the 4 design variables cannot be shown in a graph, hence, two of them are depicted (the height of the dike and the inner slope gradient). Furthermore, the optimal cross-section is demonstrated for this case is demonstrated on the figure.
Figure 7: combinations of 2 design variables and failure probability
3.4 Analytical Results For This Case
Hence, the results are presented in Table 5, where the 5 cross-sections with the least cost that fulfill the target failure probability are given. From these, the first one in row is the optimal one. The optimal values of the design variables are shown, as well as the cost of the cross-section, which is given in euros per
Figure 6: Zoomed in part of the fragility curves

10
meter of length. Finally the relative contribution to the overall probability of failure of each failure mechanism is presented. It is shown that – for this case – it is cost efficient to allocate about two thirds of the target failure probability to the overtopping mechanism. Table 5: Lowest cost cross-sections that fulfill the safety requirements
UNIT CROSS-SECTIONS OPTIMAL
Hdike m 3.405 3.405 3.395 3.4 3.405 Gradient of inner slope - 0.35 0.35 0.4 0.4 0.4
Wdike m 24.73 24.73 23.49 23.5 23.47 Wberm m 2 2 4 4 4 Hberm m 1 2 1 1 1
Total cost [*103] €/m length 3.79 3.83 3.861 3.864 3.867 Percentage of overflowing/overtopping [%] - 66.3 66.4 74.34 73.3 72.39
Percentage of piping [%] - 32.1 33.1 25.2 25.89 26.9 Percentage of macro instability [%] - 1.6 0.4 0.4 0.81 0.9
3.5 Sensitivity For Boundary Conditions
As it is expected, the optimal designs that come from the method are affected by many parameters such as the location of the dike, the soil and subsoil characteristics and the material that the dike is constructed. Summarizing, the optimal dike cross-section changes when the boundary conditions alter. Moreover, the relative contribution of the failure mechanisms for the optimal cross-section is not stable, too. This is demonstrated with the Table 6 and the following chart, which show the optimal dike cross-sections for three different scenarios. Overflowing is represented in blue, piping in red and inner slope stability in green.
From the charts below several conclusions can be drawn. For example, in the second case, it is found that in piping sensitive areas, it is optimal to allocate a large portion of the available failure probability (e.g. more than 90%) to this mechanism. Allowing a small contribution of piping (e.g. 10%) would result in dike widening. This would be achieved by smoother slopes or by wider berms, which would increase the cost significantly. In this case, reducing the probability of overflowing is much cheaper than reducing the probability of piping by the same factor. This apporach is contrary to the principles in the current guidelines in the Netherlands, where the available space of the failure probability of geotechnical failures is relatively small.
Table 6: Optimal cross-sections for 3 cases and the distribution pies of their failure mechanisms Hdike 3.5 m 3.75 m 3.405 m θinner 0.425 m 0.225 m 0.35 m Hberm 2 m 1 m 1 m Wberm 4 m 16 m 2 m
44.5%
4%
51.5%
7.9%
92..1%
66.4%
32.1%
1.5%

11
3.6 Probabilistic versus semi-probabilistic design
Although the research that is being done about the probabilistic design is increasing, it has not been fully incorporated in the dike design, yet. An interesting comparison is to see the differences by designing a cross-section with semi-probabilistic and probabilistic approach. A simple case, where the local conditions enable the occurrence of piping but hinder the inner slope stability, is selected. Hence, quite a wide dike is expected. The semi-probabilistic design that is done is based on the reports of (TAW, 2004), (TAW, 1998) and (TAW, 1999).
Table 7: Comparison between the results of the semi-probabilstic and the probabilistic approach
UNIT Optimal cross-‐section from probabilistic approach
Cross-‐section derived by semi-‐probabilistic approach
Hdike m 4 3.92 Gradient of inner slope -‐ 0.14 0.09
Wdike m 43.57 49.58 Wberm m 6 6 Hberm m 1 1
Leakage length m 49.57 55.58 Total cost [*103] €/m length 7.15 7.96
The results are pointed out in the previous table and they show, that the semi-probabilistic approach is more conservative, and thus it results in higher costs. Hence, in this case, a gain in construction cost of 15% was obtained. The main reason is that the approach from this study allows more flexibility in finding the optimal design and distribution of probabilities over mechanisms than the current guidelines.
4. CONCLUSIONS
This study develops a generic framework that can be used for the assessment and for the design of the river dikes following probabilistic design methodology. The procedure is highly automated with relatively short calculation time, consequently, it can become a useful tool for the design of new dikes and for the assessment and improvement of the existing dikes, starting from a predefined target probability of failure and resulting in the optimal dimensions of a river dike cross-section. Moreover, it has made an innovative approach to the estimation of the inner slope stability probability of failure, as many cross-sections may be evaluated through the combination of the DGeoStability software with the developed Matlab scripts. Except for indicating the optimal cross-section, the method shows the relative contribution of the considered failure mechanisms to the overall probability of failure. Finally, the method shows that the use of probabilistic optimization gives more cost-efficient designs that the traditional partial safety factor designs. In future work the method could be extended with other failure mechanisms and could be applied to dike ring systems instead to cross-sections. Also, the optimization procedure could be extended from reliability based to risk-based by incorporating the economic and societal consequences of failure.
5. ACKNOWLEDGEMENTS
This research is the last part of the MSc studies that were completed by the author in the Technical University of Delft, in the Netherlands and it has been financed by Deltares in Delft. This contribution is gratefully acknowledged.

12
6. REFERENCES
Bischiniotis, K., 2014: Cost optimal river dike design using probabilistic methods. Delft University of Technology, Hydraulic Engineering. Delft: TU Delft.
CUR190, 1997: Probabilities in civil engineering,Part 1: Probabilistic design in theory. Gouda: CUR-publicatie 190.
de Boer, E., 2007: Comparison of reliability methods for flood defence systems. Delft: Delft University of Technology.
Jonkman, S., Jongeian, R., & Maaskant, B., 2011: The Use of Individual and Societal Risk Criteria Within the Dutch Flood Safety Policy. Risk Analysis , 282-300.
Möllmann, A., & Vermeer, P., 2010: Reliability analysis of a dike failure. Stuttgart: University of Stuttgart.
Schweckendiek, T., Vrouwenvelder, T., Calle, E., & Kanning, W., 2012: Target Reliabilities and Partial Factors for Flood Defenses in the Netherlands .
Sellmeijer., 1988: On the mechanism of piping under impervious structures. TU Delft. Delft: TU Delft.
Smolders, L., 2010: Feasibility study of a climate dike. Delft: Delft University of Technology.
TAW, 1989: Leidraad voor het ontwerpen van rivierdiken-Deel 2-Benedenrivierengebied. Technische Adviecommissie voor de Waterkeringen.
TAW, 1998: Technical Report on Soil Structures. Rijkswaterstaat.
TAW, 1999: Technical Report on Sand Boils (Piping): The Netherlands: Technical Advisory Committee on Flood Defences.
TAW, 2004: Technisch Rapport Waterspanningen bij dijken. The Netherlands: Technische Adviescommissie voor de Waterkeringen.
van der Meer, J., ter Horst, W., & van Velzen, E., 2009: Calculation of fragility curves for flood defences. In P. Samuels, S. Jingtington, W. Allsop, & J. Harrop, Flood Risk Management-Research and Practice pp. 567-573. London: Taylor & Francis Group.
Voortman, H., 2003: Risk-based design of large-scale flood defence systems. Delft: Delft University of Technology.