warehouse simulation: quick and effective -...
TRANSCRIPT

10/22/2012
1
Warehouse Simulation:Quick and EffectiveAlain de Norman et d’AudenhoveRob Bateman
About the Authors
• Rob Bateman, Ph.D.A i t P f @ A i U i it f Sh j h– Associate Professor @ American University of Sharjah
– Director of Graduate and Executive Programs– Previously VP-Technical Services at ProModel Corp.– Consulted or taught simulation courses in 60+ countries

10/22/2012
2
About the Authors
• Alain de Norman et d’Audenhove– Mechanical Engineer from USP-University of Sao Paulo – Post graduated at ULB-University of Brussels/Belgium– 28 years of professional experience on planning and I.T. at
Mercedes-Benz and Siemens. Founder and CEO at BELGE– Coordinated the implementation of logistics computer
simulation at: VW, Fiat, GM, Delphi, Honda, Eaton, Scania, Michelin, Ryder, Arcelor Mittal, Siemens, Ericsson, Bosch, Dell, ThyssenKrupp, ABInBev, Coca-Cola, Danone, Nestle, Stihl, Basf, Repsol, Petrobras, Guardian, P&G, Unilever, Colgate, Avon, …
Agenda
Discrete Event Simulation (DES)( )Warehouses & DESCase UnileverCase Coca-ColaConclusions N t d / t lNew trends / toolsQuestions

10/22/2012
3
Discrete Event Simulation (DES)
In DES, the operation of a system is represented as a chronological sequence of events.Each event occurs at a point in time and changes the state of the system.In contrast to optimization, DES allows incorporation of stochastic processesFrom ‘what-if’ scenarios to optimization: simulation with optimization (incorporates genetic algorithms)p ( p g g )Common commercial applications: manufacturing and logistics (warehouses, ports, transports…)
Distribution Centers (DCs) and Warehouses
Warehouse´s basic flow
Racks / Block
Picking
Docks Reception
Racks / Block Stacking
Docks
Parking Area

10/22/2012
4
Static Analysis vs DES - ‘Simultaneity’
• How could a static spreadsheet (MS Excel) consider the fact that a forklift cannot do several things at oncethe fact that a forklift cannot do several things at once if it does not simulate the operation over time?
Static Analysis vs DES – ‘Variability’
• How long does it take to unload a pallet from a rack?p
• Spreadsheets consider average time
• Simulation allows us to consider lift time variability due to different numbers of levels per rack.

10/22/2012
5
Static Analysis vs DESStatic Analysis Dynamic Analysis
Operations sequencing Does not consider Considered
Simultaneous request of Does not consider Consideredthe same resource
Variability in operationaltimes, speeds, demandsand breakdowns
Does not consider Considered
Productivity indexes (e.g., pallets/hour, qty in picking and load assembly
It is an input, which can cause error. It is a mistake to use these values as a premise since it is
It is an output of themodel. The result of all its restrictions, randomness, cycles demandspremise, since it is
influenced by several factors such as: resource qty, processing times, arrivals and departure sequence, etc.
cycles, demands, resources, among others.
Productivity Index (PI)Static Analaysis: PI
is input dataStatic Analaysis: PI
is input dataDynamic analysis: PI
is output dataDynamic analysis: PI
is output data
The previousproductivity index
The previousproductivity index
Eg.: New pickingsystem
productivity indexwas X boxes/hour
Assumes that withthe new method, theproductivity will be
increased to Y boxes/hour
productivity indexwas X boxes/hour
According to the new times, resources quantity and the new method, the productivity index will be
Y boxes/hour
Scales the numberof operators and
equipments with theassumed
productivity
Evaluates the productivity (meets or not) according
on the amount of resources and process
times

10/22/2012
6
Simulation applied to Warehouses or DCs• Warehouse environments include:
– Complexityi h l l f– High level of
processes interdependency
– Variability
When to simulate?When to simulate?
Warehouse Management Systems (WMS) vs Warehouse Simulation
• WMS:E ll t f i ti b t t it bl f– Excellent for managing operations, but not as suitable for planning
– No ability to test layouts, experiment with different process alternatives, determine the right number of transport and human resources or forecast the impact of different demand levels.
WMS = operattions managementWMS = operattions management SIMULATION = planningSIMULATION = planning

10/22/2012
7
Case: Unilever• Objective:
– Audit 3 different logistics operation proposals and help Unilever to decide which 3PL would operate their new (and biggest) DC in South America
– Joint Warehouse (Foods and HPC / SP) – almost 60% of Unilever Revenue (Brazil) comes from this DC
Expansion - DHL Greenfield - DHL Greenfield - Mclane
Case: Unilever• Interactive analysis to define the
number of required resources:I b d d tb d lt X• Inbound and outbound results Xtargets
Eliminating bottlenecks and reducing
Outbound target: 5800 t
Inbound target: 4000 t
reducing resourceidleness

10/22/2012
8
Case: Unilever
Case: Unilever• Results:
– Defined the minimum number of necessary resources (we detected
Winner Layout
oversizing and undersizing)– Costs were reduced by US$ 130,000 /
month (reducing operators and forklifts)
– Identified and eliminated bottlenecks. Otherwise the DC would have a backlog of almost 35% on peak days
– Guarantee ability to attain the level of service required. Start-up operations ran very well

10/22/2012
9
Case: Coca-Cola (Bottlers)
Case: Coca-Cola
• Objective: – Optimize the layout, flows andOptimize the layout, flows and
storage of the new DC area in Taguatinga do Sul city (BRASAL).
– Consider the storage area expansion and verify operational restrictions in the system. Example: Idleness level of each resource in each shift.
10/22/2012
10
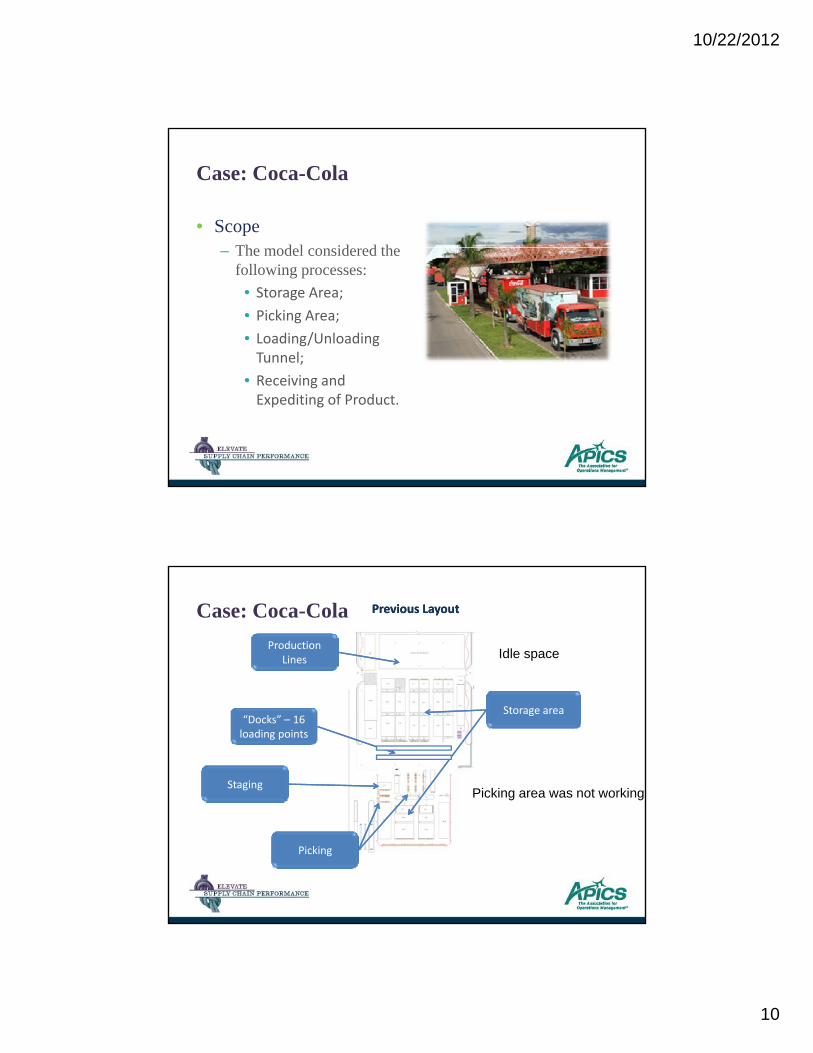
Case: Coca-Cola
• Scope Th d l id d th– The model considered the following processes:
• Storage Area;• Picking Area; • Loading/Unloading Tunnel;
• Receiving and Expediting of Product.
Case: Coca-Cola Previous LayoutPrevious Layout
ProductionLines Idle space
Storage area“Docks” – 16 loading points
StagingPicking area was not working
Picking

10/22/2012
11
Case: Coca-Cola New Proposed LayoutNew Proposed Layout
Storage area
ProductionLines
Staging area(new concept)
Loading points (8)
PickingReplenishment
Picking
( p )
Case: Coca-Cola6 a.m.: all trucks must be loaded
L tStaging arearequired
Baseline: several trucks
Layout proposed
required
several trucks loaded after the deadline

10/22/2012
12
Case: Coca-Cola
Picking: Baseline Picking: New Layout1 2
D f 1 5
New product positions3
Decrease of 1.5 min/pallet
Case: Coca-Cola
Example: Loading Time – Vehicle “Mercado” BaselineMean time 1.6 HR
Reduction: 12.5%
Layout ProposedMean time 1.4 HR
10/22/2012
13
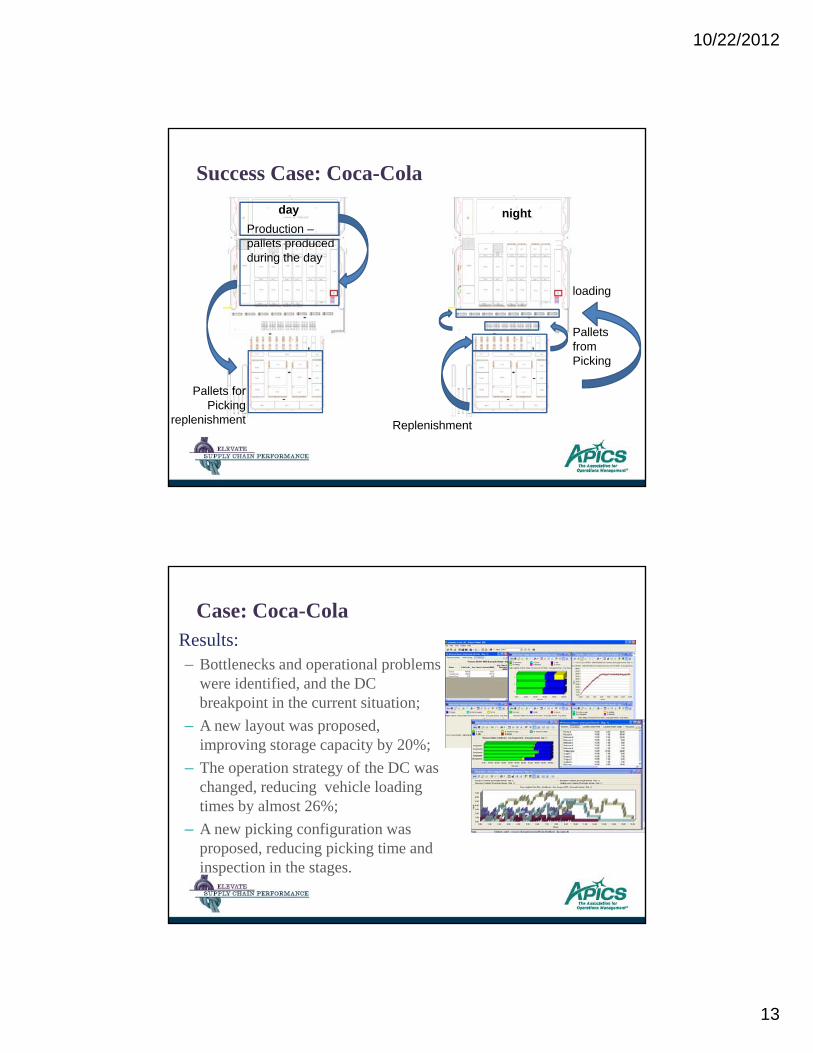
Success Case: Coca-Cola
Production –pallets produced
day night
p pduring the day
Pallets from Picking
loading
Pallets for Picking
replenishment Replenishment
Case: Coca-ColaResults: – Bottlenecks and operational problems
were identified and the DCwere identified, and the DC breakpoint in the current situation;
– A new layout was proposed, improving storage capacity by 20%;
– The operation strategy of the DC was changed, reducing vehicle loading times by almost 26%;times by almost 26%;
– A new picking configuration was proposed, reducing picking time and inspection in the stages.

10/22/2012
14
Case: Coca-Cola
Objetivos ResultadosObjectives Results
Optmize flows and movements
Increase the storage area utilization by 8.9%
Space optimizationDecrease of 18% in vehicles service times
Determine the number of resources required for out years
Correct quantity of requiredresources
Define the best layouts for future scenarios
Required Investment reduced byUSD 9 million
Define the best operationstrategy
Best ‘summer plan’ of Coke/Vonpar in history
Set the best growthstrategy High precision and quality
Assis Brasil
Case: Coca-Cola
Objectives ResultsSet the best layout for future andincreasing demands
Obtained the optimized layout for the DC
Set the best operation strategyCharging system dramaticallymodified
Set the best layout for increasingvolumes
20% increase in availability in warehouse areaTruck loading time reduced by
ANC
Define the picking and stagin areaTruck loading time reduced by40%
Improvement in the picking areaDefinition of a new layout for picking area

10/22/2012
15
Case: Coca-Cola
Define the best layout for aDC
Defined warehouse area, restaurant, ki t
Objectives Results
new DC parking area, etcIdentify investments required in future years Investment plan per yearDefine the number ofresources
Mininum number of human resources and equipment defined
Define the best layout for a new DC
Increase of 45% in warehousingcapacity when compared with theoriginal proposed layoutnew DC original proposed layout
Flow optimization
Defined the picking method, type ofstorage structures, staging areas andset the best regions for each SKU
Size the number of resouces Defined the minumun qty of resouces
Wrap-up• Simulation is helping several companies to avoid
typical sizing errors (compared to simple MSExcel usage)usage)

10/22/2012
16
Wrap-up
• Observing the usage of DES at DCs, we can point to some significant improvements, such as:– Up to 40% increase in outbound capacity, made possible
through the identification and modification of system bottlenecks
– Minimized start-up errors in new and modified DCs– Up to a 30% reduction in human resource requirements
during peak daysg p y– Operational cost reductions of up to 35%
New trends: Specific Warehouse Simulators
• FROM Generic simulation software (AutoMod, ProModel)– Flexible to model any logistics, manufacturing or service industry– Requires extensive programming effort for DC complexities
• TO Warehouse or DC (Distribution Center) Simulators:– Specialized: Proprietary resource analysis. Example: Yale
warehouse simulator www.yale-warehousing.eu/productivity/warehouse-simulator/
– General DC planning: DCSim templateGeneral DC planning: DCSim template http://www.belge.com.br/dcsim.php

10/22/2012
17
Trends: More use of simulation
• Dynamic analysis– Resource planning
• Variability– Demand, supply
• Visualization– Globalization
• Flexibilityy– Scenarios– Experimentation
Questions ???
ContactsAlain de Norman Dr. Rob [email protected] [email protected]:+55 11 5561-5353 ext.110 +971 55 338 3313 or
+1 801 983 4978