wahyudi-income inequality in east java-267
DESCRIPTION
income inequalityTRANSCRIPT

1 | P a g e
INCOME INEQUALITY IN EAST JAVA: A Test of the Kuznets Inverted U
Hypothesis
Setyo Tri Wahyudi
Department of Economics-Faculty of Economics and Business
Brawijaya University, Malang East Java
Corresponding: [email protected]; [email protected]
Abstract
East Java is one of the provinces in Indonesia with the highest economic growth
relative to the average national economic growth in recent years. The sectors having the
largest contribution to economic growth of East Java are: (i) trading, hotel, and restaurant, (ii)
manufacturing, and (iii) agriculture. However, such high economic growth does not spread
evenly in the entire regency as some regions are developed while there others not developing
yet. This indicates that the problem of imbalance development in East Java has not yet been
solved.
This study aims to identify income inequality, analyze factors that contribute to the
inequality as well as prove whether Kuznets hypothesis about inverted U curve are evident
for the case of East Java province. The data used are secondary data on city-level in East Java
in a period of 2008 – 2011. The analysis method conducted includes: (i) disparity analysis
using Williamson index, (ii) estimation of panel regression model, (iii) a test of Kuznets
hypothesis.
The study results show that most cities in East Java have value of Williamson index in
intermediate category (0.3<IW<0.7), showing a tendency to decline along the period of
study. In addition, variables of PDRB per capita and labor show significant influence on the
income inequality while these two variables have negative correlation. This means that the
increases in PDRB per capita or sum of labor will reduce the level of income inequality in
East Java, whereas IPM has no significant influence on income inequality. Furthermore, the
test of the Kuznets inverted U hypothesis shows that the relationship between income
inequality and economic growth in East Java is in a shape of inverted U curve. This is in
accordance with Kuznets hypothesis stating that in early stage of development, income
inequality will increase and will decline in a long term. Therefore, the Kuznets hypothesis
does apply to the province of East Java.
Keywords: Income inequality, Kuznets inverted U hypothesis, East Java.
1. BACKGROUND
The purpose of economic development is to create more prosperous, wealthy, and just
society. To reach such society requires potential and resources management possessed by
each region. To create prosperity, a collaboration between government, society, and private

2 | P a g e
sector continues being done by every region in effort to manage potential and resources in
order to create job market as well as to stimulate the development of economic activities
(Arsyad, 1999). Although development policy has been directed to attain high economic
growth by taking advantage of potential and resources possessed, the success of development
is not even and there is an interregional inequality, especially income inequality. Alisjahbana
(2005) proposes that one of main problems of inequality in Indonesia is interregional
inequality as a consequence of the centralization of economic activities in the islands of Java
and Bali.
One of measurements frequently employed to evaluate the development performance
is GDP growth. An economy is said to be growing if the rate of economic activities is higher
than that of the previous period (Sadono, 1996). High and continuous economic growth is the
main condition for the sustainability of economic growth. Thus, every region always has to
set a target for high growth rate in the plan and goal of development. Although the GDP
measurement is frequently used to evaluate economic performance as well as represent
income rate per capita, its usage only views things on one perspective and thereby unable to
show how income is evenly distributed among people in reality. The rise in income per capita
does not mean that most people feel better about themselves. To get a clear picture, therefore,
the distribution of income needs to be measured.
East Java as one of provinces in Indonesia is frequently called the barometer of
national economy because the economic performance of East Java always represents the
highest growth performance relative to the average national economic growth. According to
the statistics of East Java (BPS, 2014), within the period of 2005 – 2013, East Java marked
higher economic growth compared to the national average. In 2013, the economic
performance of East Java reached 6.55%, weaker than that in 2012 at 7.22% but still higher
than that of national economy at only 5.78%. The major contributors to economic growth of
East Java are still dominated by 3 sectors, they are: trading, hotel and restaurant sector with a
contribution of 31.33%, followed by manufacturing sector and agriculture sector, each with a
contribution of 26.6% and 14.91%.

3 | P a g e
Source: BPS East Java, 2014
Figure 1. Economic Growth of East Java and Indonesia, 2005-2013
Although various data and publications always place East Java as a region that is able
to have a higher economic growth rate than the national average, it does not necessarily mean
that the problems faced by East Java province have also ended. On the contrary, the issues of
poverty, unemployment as well as income inequality are still the classical problems that have
to be solved. Based on the data from BPS-Statistics Indonesia, the amount and percentage of
poor citizens in East Java during the period of 2008 to 2013 tended to decrease but still in a
large number, as poor rural become the main contributors to poverty in East Java. This
indicates that there is an uneven distribution of income among citizens living in urban and
rural areas. Therefore, it is natural if an urbanization act keeps on happening.
Table 1. Poverty in East Java, 2008-2013
Year
Total of Poor Citizens (in thousands)
Percentage of Poor Citizens
Poverty Line (IDR/Capita/Month)
Urban Rural Urban Rural Urban Rural
2008 2.438 4.581 13,15 23,64 183.408 155.432
2009 2.148 3.874 12,17 21 202.624 174.628
2010 1.873 3.655 10,58 19,74 213.383 185.879
2011 1.734 3.492 9,66 17,66 242.403 214.166
2012 1.605 3.354 8,9 16,88 253.947 234.556
2013 1.622 3.243 8,9 16,23 278.653 269.294
Source: BPS East Java, 2014
Based on these facts, the attainment of economic growth rate of East Java still leaves
some problems, especially the uneven distribution of income. This indicates that the usage of
5.84 5.86.11 6.16
5.01
6.687.22 7.27
6.55
5.69 5.5
6.356.01
4.63
6.226.49 6.23
5.78
0
1
2
3
4
5
6
7
8
2005 2006 2007 2008 2009 2010 2011 2012 2013
Jawa Timur NasionalEast Java Indonesia

4 | P a g e
development performance measurement that is only focused on the improvement of
economic growth is not sufficient. What is more important, however, is how high economic
growth is able to play a role in improving the society’s prosperity as a whole. Economic
growth is supposedly able to reduce the disparity among citizens either in urban or rural areas
through the efforts to improve level of welfare, especially for those still below the poverty
line. Moreover, equal distribution of income as a whole shown by rate of increase in income
of the poor is greater than that of the rich. The purposes of this study are to (i) analyze
income inequality between regions in East Java, (ii) prove whether Kuznets hypothesis about
the trade-off between growth and equitable distribution or known as “inverted U curve”
hypothesis applies to East Java, and (iii) analyze factors that contribute to income inequality
in East Java.
2. INCOME DISTRIBUTION AND KUZNETS HYPOTHESIS
The main problem of income distribution is the income inequality among society groups in a
region. The disparity of income distribution is a classical problem faced by every country, not
only by developing but also by developed country. The difference lies in the proportion of
disparity rate as well as the way to solve it. The difference in ownership of resources and
production factors becomes one of the causes of disparity. According to neoclassical theory,
inequitable distribution of income caused by production factor ownership can be reduced
through an automatic adjustment process, that is the process of trickling down and spreading
so that new balance arises.
Hirschman (in Arsyad, 1997) proposes that economic development is seen imbalance
geographically, or uneven to all regions. In the beginning, economic growth is centered in
some regions as opposed to some other regions. In the next process of growth, these
differences will widen as there are various factors that cause difficulties for poor regions to
develop. Thus the role of government is needed. If a region is developing, the development
will bring influence on other regions. According to Hirschman, regions in a country can be
distinguished into poor regions and wealthy regions. If the distinction between the two is
narrowing, then there is a trickling down effect. On the other hand, if the distinction is
widening, then there is a polarization effect (Arsyad, 1997).
5 | P a g e
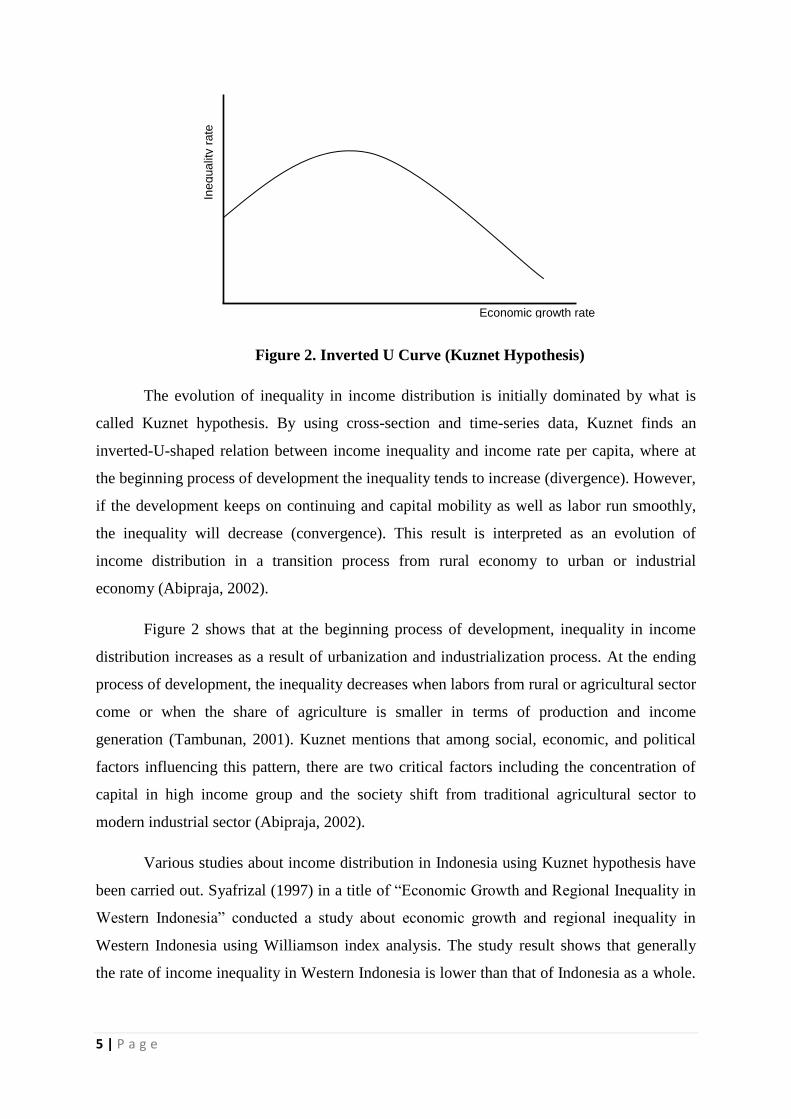
Figure 2. Inverted U Curve (Kuznet Hypothesis)
The evolution of inequality in income distribution is initially dominated by what is
called Kuznet hypothesis. By using cross-section and time-series data, Kuznet finds an
inverted-U-shaped relation between income inequality and income rate per capita, where at
the beginning process of development the inequality tends to increase (divergence). However,
if the development keeps on continuing and capital mobility as well as labor run smoothly,
the inequality will decrease (convergence). This result is interpreted as an evolution of
income distribution in a transition process from rural economy to urban or industrial
economy (Abipraja, 2002).
Figure 2 shows that at the beginning process of development, inequality in income
distribution increases as a result of urbanization and industrialization process. At the ending
process of development, the inequality decreases when labors from rural or agricultural sector
come or when the share of agriculture is smaller in terms of production and income
generation (Tambunan, 2001). Kuznet mentions that among social, economic, and political
factors influencing this pattern, there are two critical factors including the concentration of
capital in high income group and the society shift from traditional agricultural sector to
modern industrial sector (Abipraja, 2002).
Various studies about income distribution in Indonesia using Kuznet hypothesis have
been carried out. Syafrizal (1997) in a title of “Economic Growth and Regional Inequality in
Western Indonesia” conducted a study about economic growth and regional inequality in
Western Indonesia using Williamson index analysis. The study result shows that generally
the rate of income inequality in Western Indonesia is lower than that of Indonesia as a whole.
Economic growth rate
Ine
qua
lity r
ate
6 | P a g e
This indicates that equitable development between regions in Western Indonesia is relatively
better than the average condition in the entire Indonesia.
Prapti (2006) conducts a study on the correlation between economic growth and
income distribution in rural and urban areas of Central Java in a period of 2000 – 2005. The
study results show that although the rate of income inequality of population in 35 regions of
Central Java is relatively low, there is a linkage that the increasing economic growth will be
followed by the increasing rate of income inequality in major regions of Central Java.
Hartono (2008) analyzes the inequality in economic development in Central Java using
Williamson index with a conclusion that during the period of 1981 – 2005, development
inequality tends to increase. Variables of private investment per capita, labor rate, and
allocation of development funds per capita significantly contribute to the income inequality.
3. METHODS
This study employs secondary data covering 38 regions in East Java province in a period of
2010 – 2013. The data consist of regional GDP, inflation, investment, and employment data
obtained from BPS-Statistics Indonesia. The testing stages of this study are as follows:
1. Analysis of the level of inequality
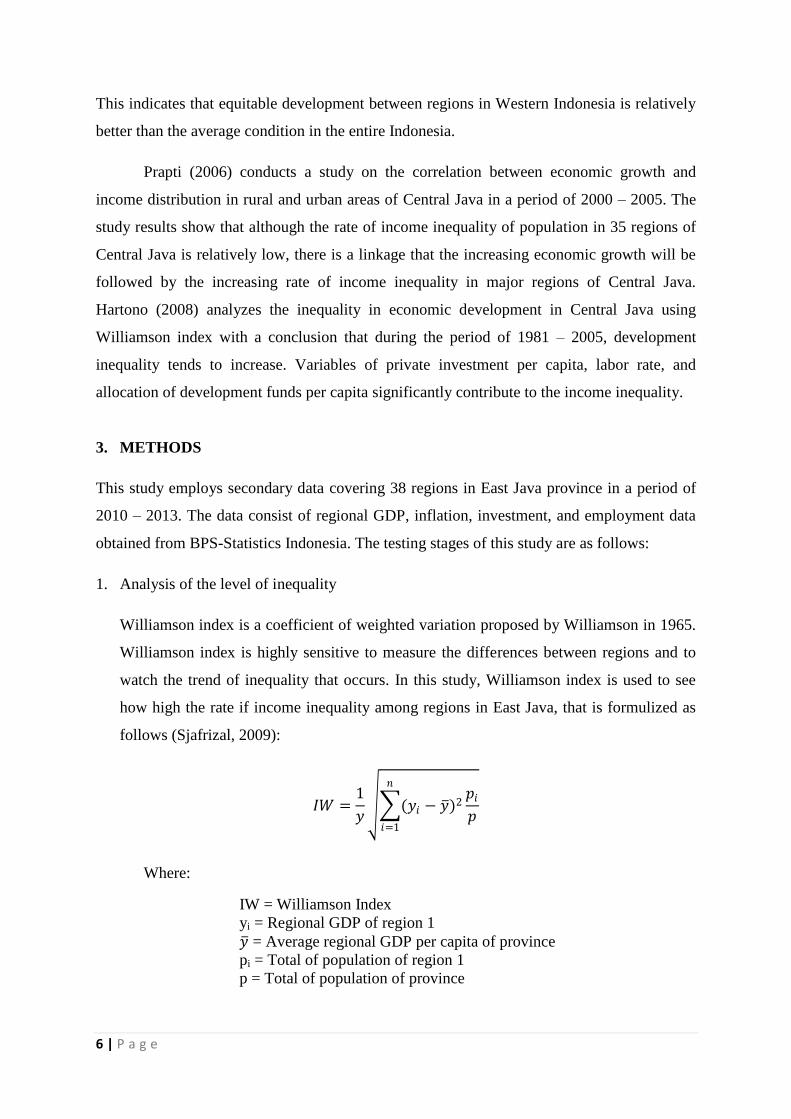
Williamson index is a coefficient of weighted variation proposed by Williamson in 1965.
Williamson index is highly sensitive to measure the differences between regions and to
watch the trend of inequality that occurs. In this study, Williamson index is used to see
how high the rate if income inequality among regions in East Java, that is formulized as
follows (Sjafrizal, 2009):
𝐼𝑊 =1
𝑦 (𝑦𝑖 − 𝑦 )2
𝑝𝑖𝑝
𝑛
𝑖=1
Where:
IW = Williamson Index
yi = Regional GDP of region 1
𝑦 = Average regional GDP per capita of province
pi = Total of population of region 1
p = Total of population of province

7 | P a g e
Williamson index has a value of between 0 and 1 (0 < IW <1). If the index value is
nearing 0, then the income inequality is smaller and if the index value is nearing 1, then
the inequality is bigger. Furthermore, based on the calculation results of Williamson
index as well as referring to the research by Bappenas (2013), this study will group
regions based on the level of income inequality, they are low level of inequality (IW <
0.3), intermediate level of inequality (0.3 ≤ IW ≤ 0.7), and high level of inequality (IW >
0.7). The purpose of grouping is to select several samples of region in each group for
further test to determine factors that influence the inequality in East Java. The
representation of regions on each level is expected to represent the real situation of
income inequality.
2. Analysis of panel regression model
The analysis of panel regression model is used to determine factors that influence the
level of income inequality in regions of East Java. The general model that will be
estimated is as follows:
IWit = β0 + β1PDRBit + β2IPMit + β3TKit + еit
Where:
IW : Williamson index
PDRB : Regional GDP
IPM : Human development index
TK : Total of labor aged above 15
3. Test of Kuznet hypothesis
Kuznet, who pioneered the analysis of historical growth patterns in developed countries,
proposes that in the early stages of growth, the distribution of income shows a tendency to
worsen, but will improve in the later stages. If the observation result is shown in a curve,
it will form an inverted U curve as shown in Figure 2. It is what is known as Kuznets
inverted U hypothesis. Referring to Kuznets hypothesis, this study will prove whether the
distribution of income in regions of East Java also shows a tendency as proposed by
Kuznet.

8 | P a g e
4. RESULTS AND DISCUSSION
4.1 Overview of Economy of East Java
One of macroeconomics indicators that is mostly used to evaluate performance on
development is regional GDP or PDRB. Regional GDP is a total of added value of all goods
and services generated by all business units within a year. According to the report by BPS-
Statistics East Java, regional GDP of East Java in 2013 cumulatively grows by 6.55%
compared to 2012, exceeding national growth that is only 5.78% and other regions such as
Jakarta that grows by only 6.11%, West Java by 6.06%, and Central Java by 5.81%.
Meanwhile, the rate source of economic growth based on employment during 2013 shows
that all of the sectors experience positive growth, with the highest growth in communication
and transportation sector by10.43%. Furthermore, buildings sector grows by 9.08%, hotel and
restaurant sector grows by 8.61%, financial reserve and service grows by 7.68%,
manufacturing industry grows by 5.59%, and the lowest in agricultural sector that grows by
only 1.59%.
Source: BPS-Statistics East Java, processed. 2014
Figure 3. Comparison of Economic Growth of East Java and Indonesia
Although the data about economic development of East Java during the year of 2013
shows good results, high economic growth is still highly susceptible to inflation fluctuation.
The occurring price fluctuation will influence consumers buying power; high inflation rate
will increase prices that consequently reduce consumers buying power. The monthly inflation
in East Java during a period of 2008 – 2013 is shown in Figure 4. In 2013, inflation in East
5.19 5.67 5.744.77
6.14 6.35 6.3
5.86.11 5.94
5.01
6.687.22 7.27
0
2
4
6
8
10
12
14
16
2006 2007 2008 2009 2010 2011 2012
Jawa Timur Indonesia
9 | P a g e
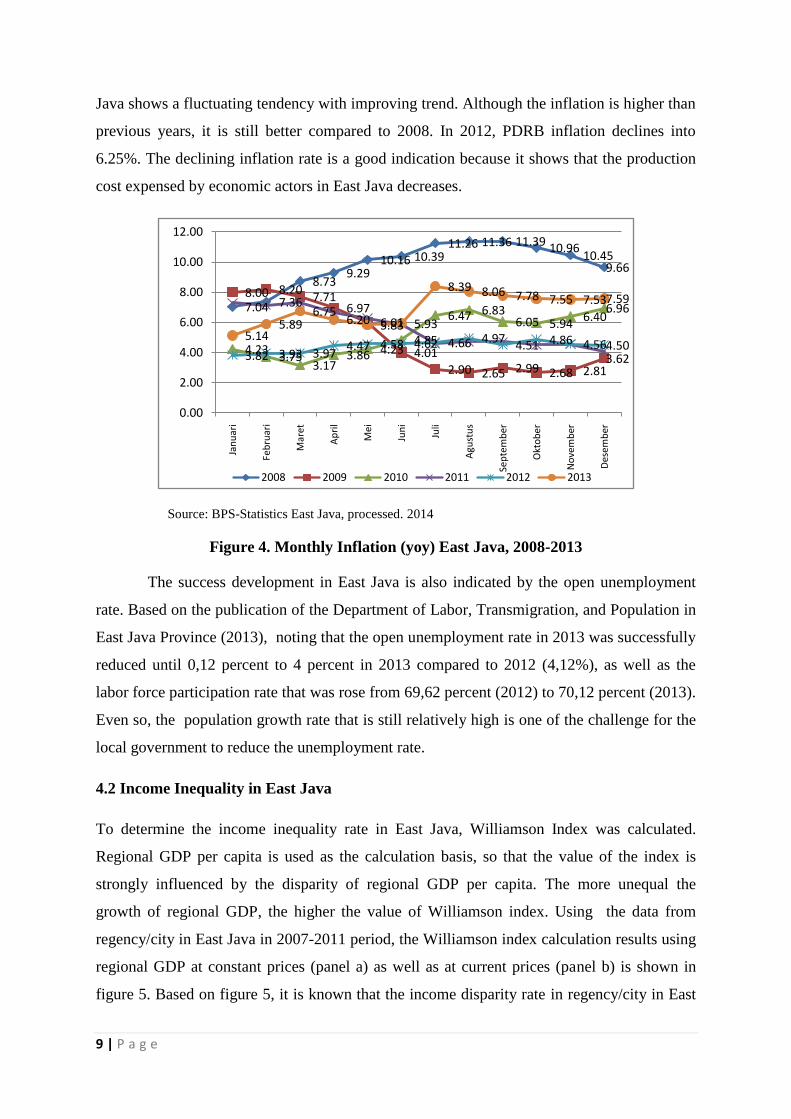
Java shows a fluctuating tendency with improving trend. Although the inflation is higher than
previous years, it is still better compared to 2008. In 2012, PDRB inflation declines into
6.25%. The declining inflation rate is a good indication because it shows that the production
cost expensed by economic actors in East Java decreases.
Source: BPS-Statistics East Java, processed. 2014
Figure 4. Monthly Inflation (yoy) East Java, 2008-2013
The success development in East Java is also indicated by the open unemployment
rate. Based on the publication of the Department of Labor, Transmigration, and Population in
East Java Province (2013), noting that the open unemployment rate in 2013 was successfully
reduced until 0,12 percent to 4 percent in 2013 compared to 2012 (4,12%), as well as the
labor force participation rate that was rose from 69,62 percent (2012) to 70,12 percent (2013).
Even so, the population growth rate that is still relatively high is one of the challenge for the
local government to reduce the unemployment rate.
4.2 Income Inequality in East Java
To determine the income inequality rate in East Java, Williamson Index was calculated.
Regional GDP per capita is used as the calculation basis, so that the value of the index is
strongly influenced by the disparity of regional GDP per capita. The more unequal the
growth of regional GDP, the higher the value of Williamson index. Using the data from
regency/city in East Java in 2007-2011 period, the Williamson index calculation results using
regional GDP at constant prices (panel a) as well as at current prices (panel b) is shown in
figure 5. Based on figure 5, it is known that the income disparity rate in regency/city in East
7.04 7.36
8.739.29
10.16 10.3911.26 11.36 11.39 10.96
10.459.66
8.00 8.207.71
6.976.01
4.01
2.90 2.65 2.99 2.68 2.813.62
4.233.75
3.173.86 4.23
4.85
6.47 6.836.05 5.94
6.406.96
3.82 3.93 3.974.47 4.58 4.62 4.66 4.97
4.51 4.86 4.564.505.14
5.896.75
6.20 5.83 5.93
8.39 8.06 7.78 7.55 7.537.59
0.00
2.00
4.00
6.00
8.00
10.00
12.00Ja
nu
ari
Feb
ruar
i
Mar
et
Ap
ril
Mei
Jun
i
Juli
Agu
stu
s
Sep
tem
ber
Okt
ob
er
No
vem
ber
Des
emb
er
2008 2009 2010 2011 2012 2013

10 | P a g e
Java during the period of 2007-2011 is still high where most of the regency/city Williamson
index value greater than 0,5. Based onn that calculation, the city of Kediri and Surabaya were
excluded because the regional GDP value in both cities far exceeds the other regions.
(a) (b)
Figure 5. Williamson Index in Regency/City in East Java based on regional GDP
at Constant Prices (panel a) and at Current Prices (panel b)
0.000 0.500 1.000 1.500 2.000
Pacitan
Ponorogo
Trenggalek
Tulungagung
Blitar
Kediri
Malang
Lumajang
Jember
Banyuwangi
Bondowoso
Situbondo
Probolinggo
Pasuruan
Sidoarjo
Mojokerjo
Jombang
Nganjuk
Madiun
Magetan
Ngawi
Bojonegoro
Tuban
Lamongan
Gresik
Bangkalan
Sampang
Pamekasan
Sumenep
Kota Blitar
Kota Malang
Kota Probolinggo
Kota Pasuruan
Kota Mojokerto
Kota Madiun
Kota Batu
JAWA TIMUR
2010 2009 2008 2007

11 | P a g e
The high difference between regional GDP per capita in regency/city, shown by
Williamson index in regency/city that is high, also caused Williamson index in East Java to
show a high number (IW is greater than 1). Meanwhile, if two cities in East Java (city of
Kediri and Surabaya) excluded from the calculation, Williamson index number in East Java
decreased significantly, IW number in East Java in intermediate category (0.3<IW<0.7).
When examined, Williamson index number in East Java during the periods of 2007-2011
showed a tendency to be fluctuate with a declining trend. This means that there was a slight
decline in economic disparities between regency/city in East Java, in the other words
indicating an increase in equity between regions in East Java province (table 2).
Table 2. Williamson Index in East Java
Year
IW in East Java
IW (at
Constant)
IW (at
Constant)*
IW (at
Current)
IW (at
Current)*
2007 1.040 0.711 1.537 0.563
2008 1.027 0.693 1.503 0.549
2009 1.027 0.694 1.481 0.546
2010 1.014 0.687 1.472 0.542
2011 1.027 0.696 1.498 0.550
Source : BPS-Statistics East Java Province, precessed. 2014
Exp. *) without the city of Kediri and Surabaya
Based on the calculation of Williamson index for all of the regency/city in East Java,
then a grouping between regency/city based on categories, those are low (WI < 0.3),
intermediate (0.3 < WI < 0.7), and high category (WI > 0.7) was done. Based on the
categorization, if the city of Kediri and Surabaya was included in calculation analysis, then
the Williamson index number was in the high category (WI > 0.7), meanwhile, if those two
cities was excluded in calculation analysis, then the Williamson index number was in the
intermediate category (0.3 < WI <0.7) (see table 2). Further, referring to the categorization
results, if using regional GDP at constant prices, there were 7 regencies with low level of
disparity, 8 regencies with intermediate level of disparity, and 21 regencies with high level of
disparity. Meanwhile, when using regional GDP at current prices, there were 8 regencies with
low level of disparity, 21 regencies with intermediate level of disparity, and 7 regencies with
high level of disparity (see Table 3).

12 | P a g e
Tabel 3. Categorization of Williamson Index Based on Categories
Williamson Index
Categoris
Regency/City
At Constant Prices At Current Prices
High
(WI>0.7)
Pacitan, Ponorogo, Trenggalek, Blitar,
Kediri, Malang, Jember, Bondowoso,
Pasuruan, Sidoarjo, Jombang,
Nganjuk, Ngawi, Bojonegoro,
Lamongan, Gresik, Bangkalan,
Sampang, Pamekasan, Sumenep, City
of Malang
Kediri, Malang, Jember,
Pasuruan, Sidoarjo, Gresik,
City of Malang
Intermediate
(0.3 <WI<0.7)
Lumajang, Situbondo, Probolinggo,
Madiun, Magetan, Tuban,
Banyuwangi, Mojokerto
Ponorogo, Trenggalek,
Blitar, Pacitan, Lamongan,
Banyuwangi, Probolinggo
Lumajang,Tulungagung,
Jombang, Nganjuk, Ngawi,
Bondowoso, Situbondo,
Madiun, Magetan,
Bangkalan, Sampang,
Pamekasan, Sumenep,
Bojonegoro
Low
(WI<0.3)
Tulungagung, City of Blitar, City of
Probolinggo, City of Pasuruan, City of
Mojokerto, City of Madiun, City of
Batu
Mojokerto, Tuban, City of
Blitar, City of Probolinggo,
City of Pasuruan, City of
Mojokerto, City of Madiun,
City of Batu
Source: BPS-Statistics East Java Province, processed. 2014
An increase in disparity between regencies should be watched out because it could threat the
sustainability of the development. According to Sjafrizal (2008) the emergence of disparity
between regencies was caused by first, differences in natural resource, that is regency with
low disparity index tend to have limited resources with barren lands and agriculture became
the mainstay. This situation makes the growth rate low and lags behind the other regencies.
Second, differences in demographic codition, that is demographic area with mountains,
separated by the forest, sea, and hill become a barrier in investment activities. Transportation
expense for the production result become expensive so that become isolated. Third, the less
fluent the mobility of goods and services caused by the minimum fund to repair/construct will
make the production result of one region difficult to be marketed and does not develop.
Fourth, the concentration of economic activities on a region that is close to the source of the
raw materials, cheap human resources, and affordable transportation that makes the other
regions neglected. Finally, the allocation of development funds between regions that are less

13 | P a g e
fair makes producing region less developed. Provision of infrastructure and public services
become limited and trigger a sense of dissatisfaction.
Model Estimation Result
The main focus that is analyzed in this research is how much the influence of regional GDP
per capita, human development index (IPM), and labor force variables toward income
inequality in regency/city in East Java province based on the calculation analysis of
Williamson index result. Based on Table 3, using purposive random sampling method, five
regency/city were selected for each category as a study sample. For the high WI category,
Kediri, Malang, Jember, Pasuruan, and Sidoarjo were selected; the intermediate WI category,
Pacitan, Ponorogo, Trenggalek, Blitar, and Lamongan were selected; whereas the low WI
category, Mojokerto, Tuban, City of Blitar, City of Probolinggo, and City of Pasuruan were
selected. The selection of regional representatives were expected to represent the income
disparity in regency/city in East Java.
Further, analysis of the factors that influence the level of income inequity between
regency/city in East Java Province were estimated using data panel method. Panel method
used because this model could show heterogenity for each cross section unit that became
sample in this study. In order that heterogenity could be displayed in model, so fixed effect
approaches or random effect aproach became the main options. So that Chow test was not
used in this study because if using pooled least square approach, heterogenity in each cross
section unit can not be estimated. Statistic basic to decide whether using fixed effect or
random effect approach was using Hausman test that is if the probability of Hausman test was
less than real level of 5 percent, so the model used was fixed effect model.
To perform the Hausman test, the hypothesis used were:
H0 = Random Effect Method
H1 = Fixed Effect Method
If P-Value Cross-section random < α significance, H0 rejected and H1 accepted or fixed effect
method used. Based on the estimation result, data obtained as follows:

14 | P a g e
Table 4. Hausman Test Result
Correlated Random Effects - Hausman Test
Pool: East Java
Test cross-section random effects
Test Summary
Chi-Sq.
Statistic Chi-Sq. d.f. Prob.
Cross-section random 46.417472 3 0.0000
Source: Processed data, 2014
Table 4 showed Hausman test result to choose fixed and random model. Based on
probability value, known that hausman test probability < real level of 5 percent means model
chosen was fixed effect model. Fixed model test result displayed in table 5. Based on table 5,
known that PDRB and labor force variable showed significant influence on income disparity
level (Williamson index), while IPM variable did not significantly influence on disparity
level.
Table 5. Fixed Effect Model Test Results
Dependent Variable: IW?
Method: Pooled Least Squares
Sample: 2008 2011
Included observations: 4
Cross-sections included: 15
Total pool (balanced) observations: 60
White cross-section standard errors & covariance (d.f. corrected)
Variable Coefficient Std. Error t-Statistic Prob.
C 0.455946 0.474336 0.961230 0.3419
PDRB? -0.008250 0.002598 -3.175749 0.0028
IPM? 0.011910 0.007610 1.565057 0.1251
TK? -1.17E-06 1.82E-07 -6.438010 0.0000
Fixed Effects (Cross)
PACITAN--C -0.383693
PONOROGO--C -0.054257
TRENGGALEK--C -0.288124
BLITAR--C 0.033645
LAMONGAN--C 0.177367
KEDIRI--C 0.356204
MALANG--C 1.045279
JEMBER--C 1.129032
PASURUAN--C 0.445173
SIDOARJO--C 1.025996
MOJOKERTO--C -0.322197

15 | P a g e
TUBAN--C -0.150178
City of BLITAR--C -1.031902
City of PROBOLINGGO--C -1.051883
City of PASURUAN--C -0.930461
Effects Specification
Cross-section fixed (dummy variables)
R-squared 0.981722 Mean dependent var 0.539583
Adjusted R-squared 0.974323 S.D. dependent var 0.305300
S.E. of regression 0.048921 Akaike info criterion -2.953887
Sum squared resid 0.100518 Schwarz criterion -2.325583
Log likelihood 106.6166 Hannan-Quinn criter. -2.708123
F-statistic 132.6938 Durbin-Watson stat 1.647351
Prob(F-statistic) 0.000000
Source: Processed data, 2014.
Based on the table 5 above, the regresion model can be written in the form:
WI = 0.455 – 0.008 PDRB + 0.011 IPM - 0.0000016 TK + ϵt
In accordance with the study findings, the three variables (PDRB, IPM, TK) could
explain the income disparity with a high value (R-square = 0.98), that is 98 percent. Variable
PDRB per capita and sum of the labor had probabilities that is smaller than 0.05 means
significantly influencing income disparity level, while variable IPM did not significantly
influence.
Based on estimation results, PDRB per capita significantly influence income disparity
and the relationship was negative. The relationship between PDRB per capita with the region
income disparity that was negative was in line with the theory that an increase in PDRB per
capita will decrease the income disparity, vice versa. PDRB per capita is an indicator to see
economic growth in a region, the higher PDRB per capita in a region, so the economic
growth in a region could be considered high. The high economic growth is one form of
success in economic development, which in turns could decrease the region development
inequity.
Further, the labor force variable showed a sognificant influence with negative and
small coefficient (0.0000016). This means that the increase of the labor force would
contribute on the decrease of income disparity level. The more the number of people that
work and have access to get a job the lower the rates of unemployment, and the higher
production activity that would reduce the income disparity between the people.
16 | P a g e
Meanwhile, human development index (IPM) that is expected to influence the
decrease of income disparity indicates the opposite result, that is IPM did not significantly
influence income disparity. This could be caused by high IPM indicator showing that the
quality of the people increased. The better quality was shown by the indicator of the decrease
of the unemployment (which means an increase in employment). Therefore, even though IPM
was not significant, it was implicitly described by the influence of the labor force that was
significant.
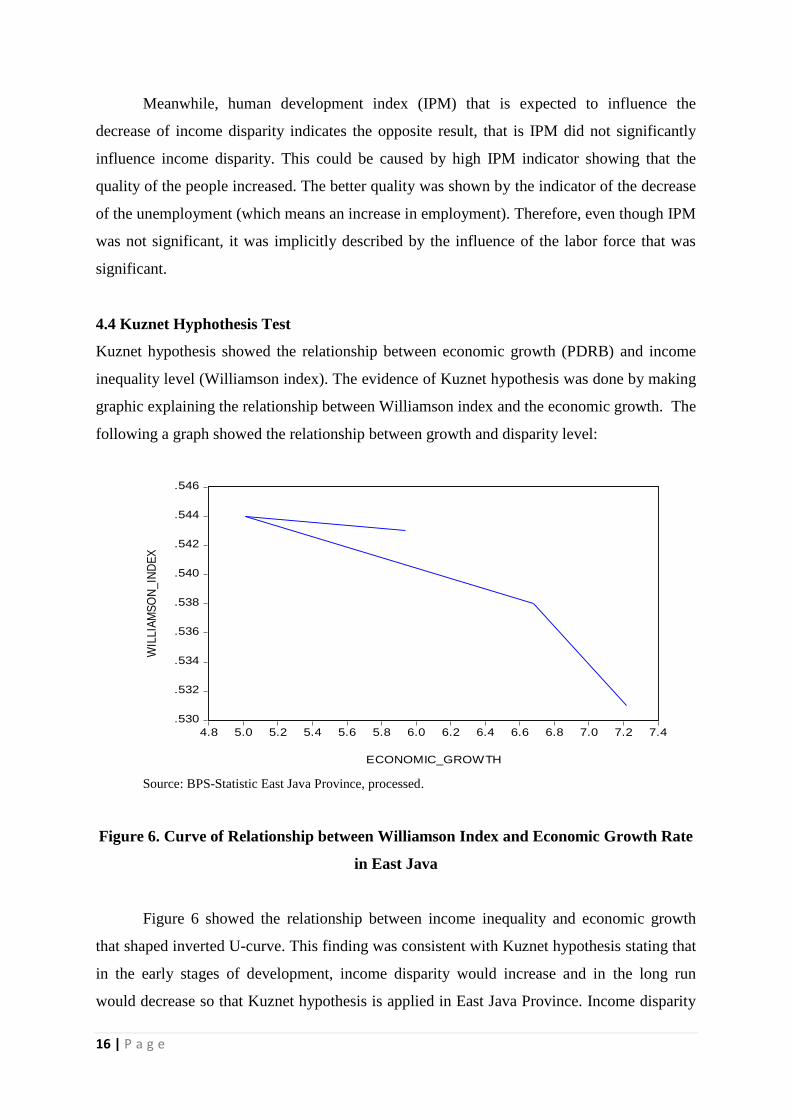
4.4 Kuznet Hyphothesis Test
Kuznet hypothesis showed the relationship between economic growth (PDRB) and income
inequality level (Williamson index). The evidence of Kuznet hypothesis was done by making
graphic explaining the relationship between Williamson index and the economic growth. The
following a graph showed the relationship between growth and disparity level:
Source: BPS-Statistic East Java Province, processed.
Figure 6. Curve of Relationship between Williamson Index and Economic Growth Rate
in East Java
Figure 6 showed the relationship between income inequality and economic growth
that shaped inverted U-curve. This finding was consistent with Kuznet hypothesis stating that
in the early stages of development, income disparity would increase and in the long run
would decrease so that Kuznet hypothesis is applied in East Java Province. Income disparity
.530
.532
.534
.536
.538
.540
.542
.544
.546
4.8 5.0 5.2 5.4 5.6 5.8 6.0 6.2 6.4 6.6 6.8 7.0 7.2 7.4
ECONOMIC_GROWTH
WIL
LIA
MS
ON
_IN
DE
X
17 | P a g e
in one region increased in certain period then decreased when the growth continued to
increase and it becomes a repeating process.
5. CONCLUSION
Income inequality in regency/city in East Java Province measured by Williamson index from
2008-2011 showed that income disparity level in East Java measured using PDRB at current
prices showed that most of the regency/city in East Java were classified as disparity in
intermediate level - 8 regions with low level of disparity, 21 regions with intermediate level
of disparity, and 7 region with high level of disparity. Eventhough they were included in
intermediate level of disparity, most of the regions had Williamson index more than 0.5 even
close to the limit of high disparity that is 0.7. This showed that inequality reduction program
in East Java had not been optimal to reduce the Williamson index number so that inclusive
growth has not been reached.
The estimation result to know factors influencing the disparity level using variables of
PDRB per capita, human development index, and labor force by using five regencies in each
category as the samples showed that PDRB and labor force variable gave significant
influence on the occurence of disparity in East Java while IPM variable did not. Then, the
result of Kuznet hypothesis on inverted U-curve was proved in East Java province. In the
early development stages disparity tends to increase but in the later stages disparity would
decrease along with the growth. This process occured repeatedly so that in the long run the
relationship between economic growth and income inequality is negative. The government
should continue to encourage the economic growth so the equality would be realized soon.
REFERENCES
Alisjahbana, Armida. S. (2005). Kesenjangan Regional di Indonesia. Jakarta : Lembaga
Penelitian SMERU
Arsyad, Lincolin. (1999). Pengantar Perencanaan Pembangunan Ekonomi Daerah.
Yogyakarta: Bagian Penerbitan Sekolah Tinggi Ilmu Ekonomi YKPN
Badan Perencanaan Pembangunan Nasional (Bappenas). (2013). Analisis kesenjangan
antarwilayah 2013. Jakarta
Badan Pusat Statistik. PDRB Atas Dasar Harga Konstan 2000 Provinsi Jawa Timur
Berbagai Tahun Terbitan. Surabaya: BPS
Badan Pusat Statistik. PDRB Atas Dasar Harga Berlaku Provinsi Jawa Timur Berbagai
Tahun Terbitan. Surabaya: BPS

18 | P a g e
Badan Pusat Statistik. PDRB Per kapita Atas Dasar Harga Konstan 2000 Menurut
Kabupaten/Kota di Provinsi Jawa Timur Berbagai Tahun Terbitan. Surabaya: BPS
Badan Pusat Statistik. PDRB Per kapita Atas Dasar Harga Berlaku Menurut Kabupaten/Kota
di Provinsi Jawa Timur Berbagai Tahun Terbitan. Surabaya: BPS
Brata, Aloysius Gunadi. (2002), Pembangunan manusia dan kinerja ekonomi regional di
Indonesia. Jurnal Ekonomi Pembangunan, Vol.7, (No.2) : 113-122.
Prapti, Lulus. (2006). Keterkaitan antara pertumbuhan ekonomi dan disparitas pendapatan:
studi kasus 35 kabupaten/kota di Jawa Tengah 2000-2004. Thesis Program Magister
Ilmu Ekonomi dan Studi Pembangunan. Universitas Diponegoro. Semarang
Sjafrizal. (2008). Ekonomi Regional : Teori dan Aplikasi. Padang : Baduose Media.
Syafrizal. (1997). Pertumbuhan Ekonomi dan Ketimpangan Regional Wilayah Indonesia
Bagian Barat. Jakarta : Prisma Vo.3 Maret 1997.
Tambunan. (2001). Perekonomian Indonesia, Jakarta : Gahlia Indonesia.