wages, economic growth and labour demand in south sumatera
TRANSCRIPT
IJER © Serials Publications13(4), 2016: 1777-1792
ISSN: 0972-9380
WAGES, ECONOMIC GROWTH AND LABOURDEMAND IN SOUTH SUMATERA PROVINCEINDONESIA
Abstract: The objective of this study is to investigate the effect of the Wages and EconomicGrowth on Labor demand in South Sumatra Province during the period of 2008 - 2013. Thedata used in this study is secondary data in the form of panel data (the combination of timeseries and cross section data). The time series data used are the annual data from the periodof 2008 - 2013, whereas the cross section data used covering nine sectors of the economy.The sources of the data are the publications of the Central Bureau of Statistics and theDepartment of Manpower and Transmigration of South Sumatra Province. The method ofdata analysis is the panel data regression which has previously been tested by means ofclassical assumptions. The statistical tests used in this study are the determinant coefficienttest (R2), F test, and t test. The results of this study indicate that the wage has a positive butnot significant effect on labor demand, whereas the economic growth has a significant andpositive effect on labor demand in the Province of South Sumatra.
Keywords: Wages, Economic Growth, Labor Demand
INTRODUCTION
Background
The labor issue is an issue that is very complex and large. Complex because the problemaffects all at once is influenced by many factors interacting with patterns that are notalways easy to understand. Great because it concerns millions of souls. To illustratethe problem of manpower in the future is not easy because of addition to basing onnumber of labor in the past, must also be known in future production prospects (Sholeh,2007: 62).
Demand for labor by companies is a derived demand derived from the request ofthe community against the goods and services produced by these companies. Thehigher the demand for the goods and services against the community then the demandfor labor will also increase and vice versa. This is because, employers hire someone toimprove production of goods and services their organization (Simanjuntak, 1985: 74).
* Faculty of Economics- Sriwijaya University, South Sumatera
1778 Bambang Bemby Soebyakto and Yunisvita and Romi Akbar
Demand for labor is influenced by the level of wages. Awarding wage given byentrepreneurs considered the price of power that was sacrificed for the sake ofproduction workers. Wages will affect the high to the low cost of production. Basedon theory, high wage will make production costs increase, resulting in increasedproduct prices. An increase in the price of the product an item lowers the demand forsuch goods. This condition is forcing manufacturers to reduce the amount of theresulting product, hereinafter can also reduce the demand for labor (Sumarsono, 2003:106).
In addition to wages, labor demand was also influenced by economic growth.Every sector of the economy or changes in economic growth as a result of changes inproduction activity will affect the amount of labor used in the production process inthe sector (Setiabudi, 2005: 2).
The economic growth of a region continues to experience increased, but on theother hand this increase is thus unable to absorb much manpower. So also with therising minimum wage rate which is set above the level of wages of the average workerearned, are likely to cause employers reduce the use of labor so that the growth oflabor absorption is reduced.
Based on the background that has been a staple of the problem, then describe theadaptation was “how is the influence of wages and economic growth on labor demandin South Sumatra Province”?. As for the purpose of this research was doneuntukmengetahui how wages and economic growth effect on labor demand in SouthSumatra Province.
II. LITERATURE REVIEW
The theory of the labor demand
The request is a relationship between price and quantity. With respect to manpower,the demand is the relationship between the level of wages (the price of labor) andquantity (number of) labor desired by manufacturers who use such labour to beemployed in a given period (Bellante and Jackson, 1990:25). This contrasts withconsumer demand towards goods and services. People buy because it gives satisfaction(utility) to the buyer. While employers hire someone because it helps produce thegoods for sale to the public (consumers). Therefore, the increase in the demand ofemployers against labor, depending on the increase in the demand for the goods thatit manufactures the community will. Demand for labor as it is called derived demand(Simanjuntak, 1985:74).
The theory of Productivity says that production is the end result of the process oreconomic activity by making use of some of the input or input (Nicholson, 2003:50).While the productivity associated with the use of input in order to generateoutputdalam production systems. If more output is generated by low-input, then it iscalled an increase in productivity. Further, Productivity theory is a theory that describes

Wages, Economic Growth and Labour Demand in South Sumatera Province Indonesia 1779
the change in demand for labor caused by changes in the price of goods (Tarmizi,2012:46). For example, the price of the final product is high while the capital wasassumed to remain then the marginal revenue product of labor is also high and thiswill result in the number of the employed workforce was increased.
However, the demand for labor is not caused entirely by changes in prices of goods,but due to changes or improvements in technology. If there is a repair tech, assumingfixed capital is likely to occur, then there is a rise in total production is twice as much.As a result, the MRP will increase and the demand for labor will be shifted to theright. Otherwise, if produtivitas decreased then the demand for labor curve will shiftto the left.
The labor demand curve with wage and labor W0 L0 (point a). Then wages wentdown from W0 to W1, output effects occur (changes number of manpower as a resultof changes in the wage rate) so that the labor force increased to L1 (point b) (Figure 1).
Figure 1: Labour Demand Curve
Source: Simanjuntak (1985: 75)
With regard to the addition of labor, employers will compare MR or the VMPPLand costs an extra wage for worker. These costs are the wages (W) or marginal cost(marginal cost). When the additional marginal acceptance (MR) or the VMPPL is greaterthan wages (W), then hiring an extra person is going to add to the advantage ofemployers. In other words in order to increase profits, businessmen always willcontinue to increase the number of workforce during the MR is greater than W.
Wages based on legislation (law) No. 13/2003 mentioned that the wages ofworkers/labourers are received and expressed in the form of money as a reward fromthe employer or employers to workers/workers who set up and paid out according to

1780 Bambang Bemby Soebyakto and Yunisvita and Romi Akbar
an agreement, agreement, or other regulations, including allowances for workers/labourers and their families for a job and/or services that has been or will be carriedout. Every worker/laborer has the right to earn a decent livelihood that satisfies forhumanity (article 88 paragraph 1 No. 13/2003). Government policies on waging thatprotect workers/laborers include the minimum wage as that minimum wage is thelowest monthly wage which consists of the principal wage including allowancesremains, apply to workers who have a working period of less than one year (article 13paragraph 2 Kepmenakertrans No. 226/Men/2000).
The relationship of Wages with the absorption of the workforce the workforce isone of the factors of production employed in carrying out the production process. Inthe process of production labor earn income as retribution from the effort he has donei.e. wages. With respect to manpower, the demand is the relationship between thelevel of wages (the price of labor) and quantity (number of) labor desired bymanufacturers who use such labour to be employed in a given period (Bellante andJackson, 1990:25).
Ehrenberg (1998) also state when there is a rise in average wage rates, it will befollowed by a decline in the amount of labor required. Instead, with the fall in theaverage wage level will be followed by increasing the amount of manpower required,so that it can be said that the demand for labor has a negative relationship with thelevel of wages.
Relationship between wage and labo demand
Labor is one of the factors of production used in carrying out the production process.In the process of production labor remuneration to revenues from businesses thathave been done that is wages. With respect to labor, the demand is the relationshipbetween the level of wages (price of labor) and quantity (amount) of workers desiredby producers who use the manpower to be employed within a certain period (Bellanteand Jackson, 1990: 25). According Sumarsono (2003: 105), the wage is defined as theamount of funds spent employers to pay workers for doing a job that is producingproduct. Wages continue to rise directly would bring a significant impact on thedemand for labor, because with the increased level of wage employers will seek toimprove or increase the number of its business units so that with the addition of abusiness unit, the employer will increase the number of its workforce.
Wage labor is the production costs incurred by the manufacturer. In the event ofchanges in wages, companies will respond by reducing or increasing the number ofworkers that will be used by the company. If labor costs go up, it will cause productioncost will increase as well and will decrease the profit of the producer side. This willcause the manufacturer to the various alternatives that reduce the amount of labordemanded that employment will decrease (Tarmizi, 2012: 40). Ehrenberg (1998) inZamrowi (2007) also states if there is a rise in the average wage level, it will be followedby a decrease in the number of labor demanded. Conversely, with the decrease in the
Wages, Economic Growth and Labour Demand in South Sumatera Province Indonesia 1781
average wage will be followed by a growing number of labor demands, so it can besaid that the demand for labor has a negative correlation with the level of wages.
A similar opinion was also expressed by Kuncoro (2001), where the quantity oflabor demanded will decline as a result of wage increases. If the wage rate rises, whileprices of other inputs fixed, meaning the price of labor is relatively more expensivethan other inputs. The situation is encouraging employers to reduce the use of relativelyexpensive labor with other inputs are cheaper relative prices in order to maintainmaximum profit.
Sumarsono (2003: 106) also explains that wage levels will affect the cost ofproduction. The rise in the wage rate will increase the cost of production which inturn increases the price per unit of goods produced. Usually, consumers will respondquickly when there is an increase in prices, which is to reduce consumption or evenno longer buy goods. As a result a lot of unsold goods and forced manufacturers cutoutput. The fall in production targets result in reduced labor needed. The fall in totaldemand for labor due to lower production scale is called the effect of production scaleor scale effect. If wages rise (assuming the price of other capital goods does not change),the employers prefer to use capital-intensive technology for the production process,thus replacing the need for labor with capital goods such as machinery and others.The fall in the number of labor requirements for the replacement or addition ofmachines called the substitution effect of labor.
Relationshiop between economic growth and labor demand
Economic growth means an increase for goods and services produced by the economyin which the activity requires labor. According Simanjuntak (1985: 74), the increase indemand for goods and services by the community to make the demand for labor bybusiness unit or enterprise is increasing, in this case there was an increase inemployment and provide new employment opportunities. Therefore, the increase inemployer demand for labor depends on the increase in public demand for goods inproduction.
Expansion of employment opportunities through economic growth can occur.Boediono (1999) in Pardi (2007: 2) points out, economic growth is the increase in outputper capita is constant in the long term. The increase in output was the result of anincrease in overall production activity. Increased production activity is part of thesupply side. The expansion of employment will occur when the demand is alsoincreasing. In other words, employment opportunities will be created when there isan increase in aggregate supply and demand side. To expand production capacity,one of the inputs needed is manpower.
Labor has a very important role in the activities of producing goods and services.Therefore, the rise and fall is determined by the productivity of workers. Economicdevelopment will take place and if coupled with economic growth due to the economicgrowth could stimulate the population to take part in economic activities. According

1782 Bambang Bemby Soebyakto and Yunisvita and Romi Akbar
Feriyanto (2014: 86) that the good economic growth in a country can encouragemanufacturers to increase their production capacity by holding a plant expansion, theexpansion of the plant will be able to encourage employment is greater.
Ferdinand (2011: 11) states that the increased economic growth requires additionallabor as a factor of production to meet the increased aggregate demand. Conditionssuch as these will mainly occur in the structure of the economy that have labor-intensivepattern. If the structure of the economy of a region is capital intensive, the economicgrowth will only increase capital requirements and will not absorb a lot of labor. Asimilar opinion was also expressed by Sianipar (2012: 2) where high economic growthwill increase the capacity of a country/region to produce goods and services. Byincreasing the production capacity, the demand for factors of production such as laborwill increase as well and create new employment opportunities. Creation of newemployment opportunities will be able to absorb the labor force.
The above statement is also supported by research Stiabudi (2005: 2) which statesthat there is a positive relationship between economic growth and employment.Any change in the economic sector or the economy as a result of changes inproduction activity will affect the amount of labor used in the production process inthe sector.
III. RESEARCH METHODS
This study analyzes the influence of the sectors wage and gross regional domesticproduct (GDP) against the sector labor absorption. Data are used in this research issecondary data in the form of the data panel. The data panel is a combination of datacross section and time series. Time series data used is the annual data from the years2008-2013, while the data of cross section 9 covers the sectors of the economy. Datasource derived from the publication of BPS and Regional labor Office of South SumatraProvince.
Analysis used in this research are descriptive in qualitative and quantitativetechniques. A descriptive qualitative analysis with technology applies a variety ofserving table and video is required, as well as with the hypothesis testing theory andanalysis of the appropriate explanation to solve existing problems by using regressionanalysis of the panel data.
Model in this research:
LDit = � + �
1Wage
it + �
2GDPit + �
it(3.1)
where :
LAit
= Labor Demand, � = Constant, �i( i = 1, 2) = Partial Regression coefficient,
Wageit = Minimum sectoral wage, GDPit = GDP in constant price,
I = row of economic sector, t = time period (year), and �it = error component in unit
observation of unit observation to-i and period of time to-t
Wages, Economic Growth and Labour Demand in South Sumatera Province Indonesia 1783
Parameter estimation model performed with data panel, where there are sometechniques that are offered using some approaches as: Common Effect Approach/OLS; Fixed Effect and Random Effect. Further, exmining the panel data estimation isusing Chow test and Hausman test. Next step, it will examine the statistics testcoefficient determination (R2); t test and F test are used.
IV. RESULTS AND DISCUSSION
Research result
Labor Demand
Total population aged 15 years and over who worked in South Sumatra province in2013 increased compared to 2008. In 2008 the working population as many as 3,191,355people, while in 2013 increased to 3,464,620 million people, an increase positvely withan increase of 8.56 percentage percent. In the period 2008 - 2013 decreased labor demandin the primary sector, resulting in people working in the sector fell from 60.33 percentto 56.20 percent. Despite the decline, but the primary sector is still the largest contributorwho is able to absorb the labor force with the percentage as much as 56.20 percent.
The primary sector, especially agriculture is still the choice of jobs people in thisregion with the percentage of 54.69 percent. This means that more than half thepopulation of South Sumatra province to work in agriculture. This is because theagricultural sector is flexible and does not require high skills and the specificrequirements of the other, and also South Sumatra Province is still classified as anagricultural area, where the South Sumatra province have local farms and plantationswere quite extensive, such as the Muba, OKI , OKU Selatan, Lahat, and Pagar Alam.In contrast to the primary sector has decreased, the secondary and tertiary sectoractually increased employment. In the secondary sector increased employmentpercentage from 8.74 percent in 2008 to 8.92 percent in 2013. Likewise, the tertiarysector who participate experience an increase in the percentage of employment of30.94 per cent in 2008 increased to 34.88 percent in 2013.
Trend employment in South Sumatra province in 2008 - 2011 there was an increase,but in the year 2012 - 2013 employment showed a downward trend. The decrease in2013 is due to the increase of fuel oil from Rp4,500/liter rose to Rp6,500/liter. For thebusiness world, the increase in fuel prices provides a significant impact on the cost ofproduction of goods and services. Raw material costs will also raise, soaring freightcharges, coupled with employee demands for wage increases, which in turn makesthe company’s profit decline. In the end, a lot of companies that lay off employees toreduce input costs were higher as a result of the increase in the price of fuel oil.
Wage
The minimum wage is the lowest monthly wage consists of basic salary includingfixed allowances. This wage applies to those who are single and have work experience
1784 Bambang Bemby Soebyakto and Yunisvita and Romi Akbar
of 0-1 years, serves as a safety net, established by decision of the Governor on therecommendation of the Board Remuneration and is valid for 1 year running.
Wage labor is the production costs incurred by the manufacturer. In the event ofchanges in wages, companies will respond by reducing or increasing the number ofworkers that will be used by the company. If labor costs go up, it will cause productioncost will increase as well and will decrease the profit of the producer side. This willcause the manufacturer to the various alternatives that reduce the amount of labordemanded that employment will decrease (Tarmizi, 2012: 40).
The development of sector minimum wages in the province of South Sumatra,which continued to increase from 2008 to 2013, the percentage increased positivelywith an average increase of 10.71 percent per year. The wage increase occurred becausethe cost of living worthy of increased prices due to economic needs have increased.
South Sumatra provincial government decision continue to enhance the sectorsminimum wage are not separated by the rising prices of the annual cost of which iscalculated on the basis of the determination of the minimum wage. In addition, thegovernment should also take into account the increase in order not to complicate thebusinesses that will have an impact on productivity because it is difficult to pay itsworkers, so the government must be fair in setting decision.
Employment and minimum wage provinces showed the same trend. This meansthat there is a relationship between the provincial minimum wage and labor demandin the province of South Sumatra. However, in 2013 the provincial minimum wageincrease but labor demands decrease. The increase in the provincial minimum wagethat occurred in 2012 and 2013 decrease the employment of 3,532,932 people in 2012decreased to 3.46462 million people in 2013, down -1.93 percent. The decline inemployment in 2013 was attributed to the increase of fuel oil from Rp4,500 / liter roseto Rp6,500 / liter.
For the business, the increase in fuel prices provides a significant impact on thecost of production of goods and services. Raw material costs will also raise, soaringfreight charges, coupled with employee demands for wage increases so as to makethe company’s profit decline. In the end, a lot of companies that lay off employees toreduce input costs were higher as a result of the increase in the price of fuel oil.
Proposed minimum wage submitted by wage boards is the result of a survey ofthe needs of life; single workers are regulated separately in the regulation of the ministerof labor component, single workers living needs. In the latest provisions worker needsa single set in the Ministerial Manlabor Regulation number 13/2012 regarding thecomponents and staging needs for decent living. Under this rule, the government seta Group 7 and 60 components workers need that became the basis for the price surveyand determine the amount of the value of the minimum wage. Review of the magnitudeof the Provincial Minimum Wage held once a year or in other words the minimumwage valid for one year.

Wages, Economic Growth and Labour Demand in South Sumatera Province Indonesia 1785
Economic growth
There are nine economic sectors which can make up the value of GDP, namelyagriculture, mining, manufacturing, electricity, gas and water supply, building orconstruction, trade, transport and communications, finance leasing and businessservices, and services. The economic structure of South Sumatra province in the period2008 to 2013 is still dominated by primary sector or economic structure that is basedon natural resources. This indicates that the contribution of the primary sectorconsisting of agriculture and mining and quarrying sector in the economy of SouthSumatra province.
GDP donations for every sector of South Sumatra Province is used as one measurein the regional economy of South Sumatra province. If the contribution is relativelylarge so if there is little interference in this sector will lead to problems in the economyof South Sumatra province as a whole. Nevertheless, the sector with a smallcontribution cannot be ignored. Because there is the possibility of the sector have thepotential to be developed and will be the mainstay of the region in the future. Anotherthing that is taken into consideration in determining the pattern of this economy is thefact the stages of economic growth in the course of an area (from the primary sector tothe secondary sector and the tertiary sector).
The primary sector during the period 2008 - 2013 as the main base of the economy ofSouth Sumatra Province donated the largest contribution with an average of 39.03%,while the secondary sector accounted for only 29.34% per year. While the tertiary sectoraccounted for 31.63% per year. If viewed as a time span from 2008 to 2013 shows thatthe economic structure in South Sumatra has not happened yet significant shift in theeconomic structure. Until the year 2013 the economic structure of South Sumatra Provinceis still dominated by primary sector comprising agricultural and mining sectors.
DISCUSSION OF RESULTS
Panel Data Regression Analysis
Panel data regression analysis was performed to identify the effect of wages andeconomic growth on labor demand in the province of South Sumatra.
Before further analyzing the influence of wages and economic growth onemployment in the province of South Sumatra, test is conducted prior to theassumptions of regression models. After all the regression model assumptions aremet, next steps is continued testing of our model to obtain the best estimation model.
Selection of Panel Data Estimation Model
Selection of panel data estimation model type is best used in the analysis was basedon two trials, the Chow test and Hausman test. Chow test is used to decide whether touse common effect or fixed effect, while the decision to use a fixed effect or randomeffect is determined by the Hausman test.
1786 Bambang Bemby Soebyakto and Yunisvita and Romi Akbar
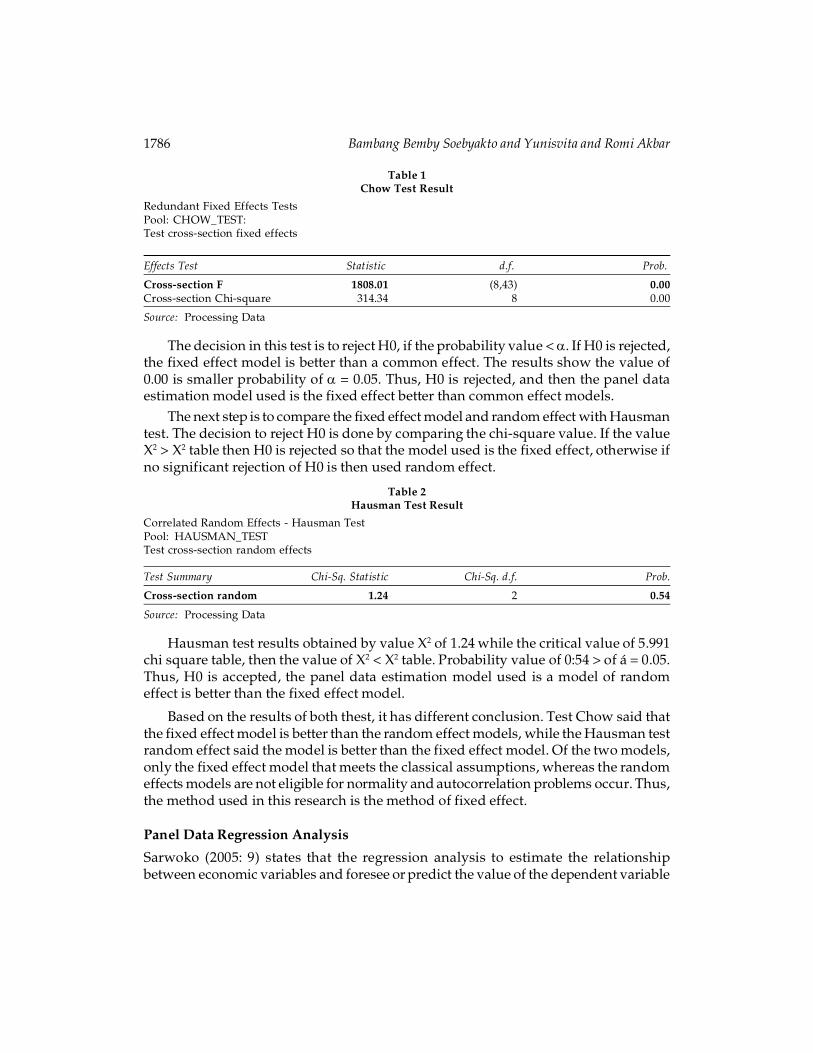
Table 1Chow Test Result
Redundant Fixed Effects TestsPool: CHOW_TEST:Test cross-section fixed effects
Effects Test Statistic d.f. Prob.
Cross-section F 1808.01 (8,43) 0.00Cross-section Chi-square 314.34 8 0.00
Source: Processing Data
The decision in this test is to reject H0, if the probability value < �. If H0 is rejected,the fixed effect model is better than a common effect. The results show the value of0.00 is smaller probability of � = 0.05. Thus, H0 is rejected, and then the panel dataestimation model used is the fixed effect better than common effect models.
The next step is to compare the fixed effect model and random effect with Hausmantest. The decision to reject H0 is done by comparing the chi-square value. If the valueX2 > X2 table then H0 is rejected so that the model used is the fixed effect, otherwise ifno significant rejection of H0 is then used random effect.
Table 2Hausman Test Result
Correlated Random Effects - Hausman TestPool: HAUSMAN_TESTTest cross-section random effects
Test Summary Chi-Sq. Statistic Chi-Sq. d.f. Prob.
Cross-section random 1.24 2 0.54
Source: Processing Data
Hausman test results obtained by value X2 of 1.24 while the critical value of 5.991chi square table, then the value of X2 < X2 table. Probability value of 0:54 > of á = 0.05.Thus, H0 is accepted, the panel data estimation model used is a model of randomeffect is better than the fixed effect model.
Based on the results of both thest, it has different conclusion. Test Chow said thatthe fixed effect model is better than the random effect models, while the Hausman testrandom effect said the model is better than the fixed effect model. Of the two models,only the fixed effect model that meets the classical assumptions, whereas the randomeffects models are not eligible for normality and autocorrelation problems occur. Thus,the method used in this research is the method of fixed effect.
Panel Data Regression Analysis
Sarwoko (2005: 9) states that the regression analysis to estimate the relationshipbetween economic variables and foresee or predict the value of the dependent variable
Wages, Economic Growth and Labour Demand in South Sumatera Province Indonesia 1787
(Y) based on the value of the independent variable (X). Analysis using regressiontechniques not only to determine how much influence the independent variable onthe dependent variable and the working relationship (prediction) between variablescan be known.
To find out how much influence wages and economic growth on employment inSouth Sumatra Province, then the analysis tools used in this study panel data regressionanalysis to provide more accurate results and shorten the time in the calculation.
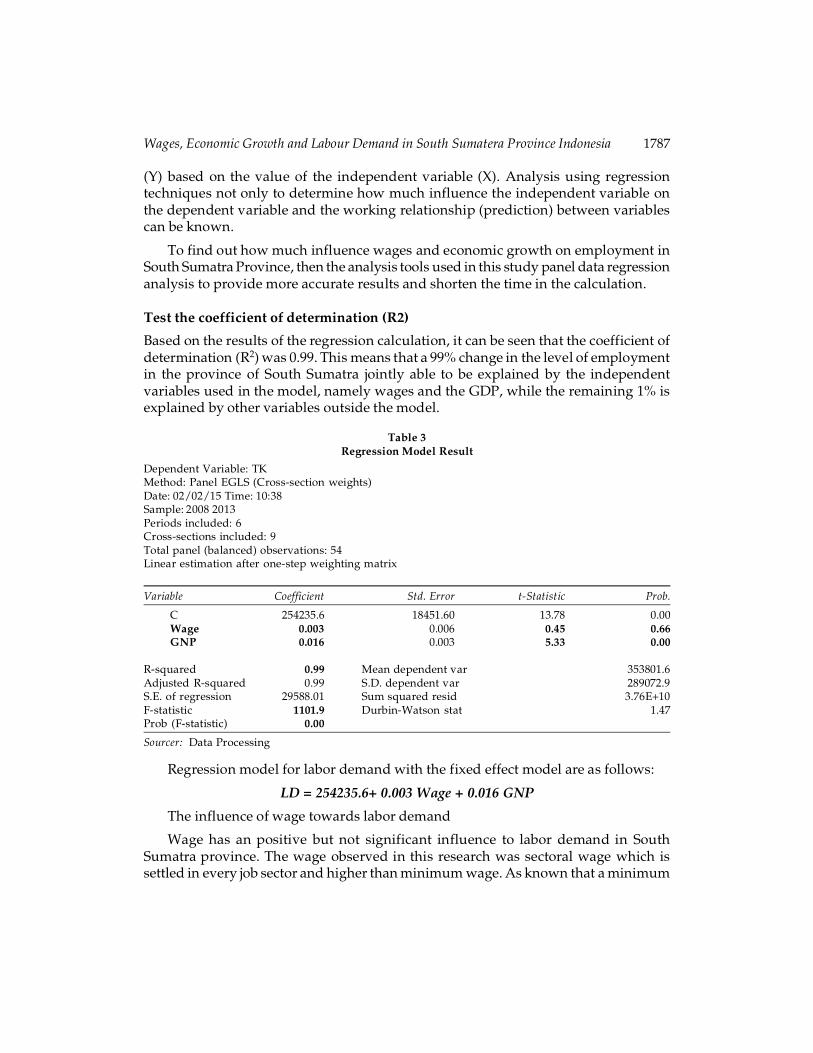
Test the coefficient of determination (R2)
Based on the results of the regression calculation, it can be seen that the coefficient ofdetermination (R2) was 0.99. This means that a 99% change in the level of employmentin the province of South Sumatra jointly able to be explained by the independentvariables used in the model, namely wages and the GDP, while the remaining 1% isexplained by other variables outside the model.
Table 3Regression Model Result
Dependent Variable: TKMethod: Panel EGLS (Cross-section weights)Date: 02/02/15 Time: 10:38Sample: 2008 2013Periods included: 6Cross-sections included: 9Total panel (balanced) observations: 54Linear estimation after one-step weighting matrix
Variable Coefficient Std. Error t-Statistic Prob.
C 254235.6 18451.60 13.78 0.00Wage 0.003 0.006 0.45 0.66GNP 0.016 0.003 5.33 0.00
R-squared 0.99 Mean dependent var 353801.6Adjusted R-squared 0.99 S.D. dependent var 289072.9S.E. of regression 29588.01 Sum squared resid 3.76E+10F-statistic 1101.9 Durbin-Watson stat 1.47Prob (F-statistic) 0.00
Sourcer: Data Processing
Regression model for labor demand with the fixed effect model are as follows:
LD = 254235.6+ 0.003 Wage + 0.016 GNP
The influence of wage towards labor demand
Wage has an positive but not significant influence to labor demand in SouthSumatra province. The wage observed in this research was sectoral wage which issettled in every job sector and higher than minimum wage. As known that a minimum

1788 Bambang Bemby Soebyakto and Yunisvita and Romi Akbar
wage was only valid to single worker who works as minimum one year. The coefficientof regression value was 0.003 meant increasing of one of wage would increase labordemand as 0.003 by assuming other factors were ceteris paribus, although this findingwas opposite to research hypotheses. Positive relation between sectoral wage andlabor demand was appropriated to Lewis theory. The highest wage offered in modernurban sectors the more recruited labor from traditional rural areas.
The results of the study it appears that wage variable regression coefficient ispositive which means that the wage increase will increase the number of employment.This fact contradicts the theories and hypotheses of the study. The test results are inline with research Wicaksono (2009) and Fridhowati (2011) which indicates that wagespositive effect on the employment sector. Increased revenue from the wage increasewill increase the consumption of the labor force, thereby increasing aggregate demand.In the end, require additional labor as a factor of production to meet the increasedaggregate demand.
A positive relationship between minimum wages and employment areaccordanceing to the development model of Lewis. By Lewis model, the economyconsists of two sectors, namely the traditional rural sector and the industrial sector inurban areas. The industrial sector has a high productivity level so that a degree ofshelter workers who are transferred bit by bit from the traditional sector. The modelemphasizes the transition process of labor, output growth and employment growthin the modern sector (Todaro and Smith, 2000). With the level of wages in the modernurban sector is higher, and then the employment providers can recruit more manpowerthan the traditional rural sector. In addition, it has positive correlation between sectorminimum wages and labor demand. This can happen if the demand for labor in theaggregate have increased. Data show that in 2008 and 2013, labor demand has rise inthe mining, power, construction, finance, and services. Based on these facts can bepresumed that the increase in labor demand as a result of sector minimum wageincreases due to the large increase in demand for labor in 5 (five) sectors.
The Influence of GNP to labor demand
GNP has a positive and significant influence to labor demand. it means that the higherof GNP would have an positive and sgnificant influence on labor demand in SouhSumatra province. The regression’s coefficient of economic growth as 0.02 meant onein increasing of GNP would enlarge the labor demand as 0.02 where other factors areceteris paribus.
The increase in the GDP will increase economic growth. Increased economic growthhas implication of the increased purchasing power of society. This course willincreasingly lead the undertaking to increase its productivity to meet increased demandfor goods and services. Ultimately making the demand for labor by business unit orenterprise field is increasing, in this case there was an increase in labor demand andprovide new employment opportunities.
Wages, Economic Growth and Labour Demand in South Sumatera Province Indonesia 1789
Most of economic sectors in the province of South Sumatra majority stilldominated by labor-intensive sector, the one of the company’s efforts to improve itsproductivity is to increase the amount of labor. This is certainly going to get a positiveresponse from the labor market thus increasing the number of labor force that isabsorbed in the jobs available. This condition can eventually reduce theunemployment rate.
The results of this study are consistent with the theory that shows the GDP risewill lead to increased employment. The results of this study are supported by a previousstudy conducted by Stiabudi (2005) and Cahyono (2012) which states that there is apositive correlation between the GDP with employment. Any change in the economicsector or the economy as a result of changes in production activity will affect theamount of labor used in the production process in the sector. In other words, if theoutput is produced rises, the number of people employed also rose. An increase inoutput can only be achieved if the input (labor) upgrade.
F test
The F-statistic is a test used to see independent variables consist of wages and theGDP collectively have significant affect on the dependent variable.
A probability value test results is smaller than á = 0.05. Thus, statistically we rejectH0 and accept H1. It means jointly wages and economic growth can be explained by asignificant level of employment in South Sumatra. Thus, in forcasting of the labordemand, factors of provincial minimum wage has been set for all regions in Indonesiaand the rate of economic growth should be a concern, because these two factors willdetermine level of labor demand.
V. CONCLUSION AND REMARKS
Conclusion
Based on the results of research and discussion has been done, the research has severalthe following conclusions as:
a) The wage has a positive influence and insignificant against the labor demandin South Sumatra Province is indicated by the value of the regressioncoefficients of 0.007 and the value t calculate t < table (0.445 < 2,353). Thisshows that every increase of 1% on the wages of labor demand then will beincreased by 0.007.
b) Economic growth has a positive and significant influence against theabsorption of labor in South Sumatra Province is indicated by the value of theregression coefficients of 0.016 and t calculate > t table (5.328 > 2,353). Thisshows that every 1 increase in economic growth so the absorption ofmanpower will be increased by 0.016.

1790 Bambang Bemby Soebyakto and Yunisvita and Romi Akbar
c) In addition, based on the testing coefficients of a determinant (R2) and F-teststatistics, to see that the relationship of the variables of economic growth andwage a direct and tangible effect against the absorption of labor as thedependent variable, it is indicated by the value of the determinant of thecoefficient (R2) of 0.99 and F calculate > F table or (1,101 > 3,18). Determinantof the coefficients (R2) of 0.99 explains that variations wages and economicgrowth capable of explaining the variation of the absorption of the workforceamounting to 99 percent, and the remaining 1% are influenced by variablesother than the model.
Suggestion
Based on the conclusions of the results of the above research, then the advice that canbe given are as follows:
a) Determination of sectoral minimum wage standards by the Government ofSouth Sumatra Province to be done precisely to limit certain wage levels sothat the company does not feel aggrieved parties in the paid workforce. In thiscontext, appropriate wage is not a wage guarantee workers is able to meet theneeds of his life, but rather the proper wage based on labour productivity.Government as the last of the policy expected to provide protection toworkers in order to get a reward in accordance with productivity.
b) The Government of South Sumatra Province should stimulate the potentialform of agriculture sector because this sector is capable of absorbing a lot oflabor. Policy measures that need to be done to support these potential sector isincreasing and improving the quality of human resources through educationand training to create a qualified workforce. In addition, sectors with smallcontributions can not be ignored. Because there is a possibility the sector hadthe potential to be developed and will be a mainstay of the region in the future.
c) For further research, is expected to also discuss the labor demand throughoutthe district and town in the province of South Sumatra, and should also includeother variables such as investments that can affect the absorption of labour.
References
Ajija, R. Shochrul. (2011), Cara Cerdas Menguasai EViews. Jakarta: Salemba Empat.
Asngari, Imam, (2011), Modul Praktikum Ekonometrika Program EVIEWS dan SPSS.Palembang:FE Universitas Sriwijaya.
Arsyad, Lincolin. (1999), Ekonomi Pembangunan. Edisi Keempat. Yogyakarta: STIE YKPN.
Arsyad, Lincolin. (2010), Ekonomi Pembangunan. Yogyakarta: Unit Penerbit dan PercetakanSTIM YKPN Yogyakarta.
Aryanti, Novika. (2007), Pengaruh Investasi (PMDN dan PMA) dan PDRB Terhadap PenyerapanTenaga Kerja di Provinsi Sumatera Selatan (Study Kasus pada Sektor Petanian). FakultasEkonomi Universitas Sriwijaya (tidak dipublikasi).
Wages, Economic Growth and Labour Demand in South Sumatera Province Indonesia 1791
Badan Pusat Statistik. (2008–2013), Sumatera Selatan Dalam Angka2011. Palembang: BPS.
Badan Pusat Statistik. (2008–2013), Produk Domestik Regional Bruto Sumatera Selatan 2008–2013.Palembang: BPS.
____. (2014), Situasi Ketenagakerjaan Provinsi Sumatera Selatan 2014. Palembang: BPS.
Bashier, Al-Abdulrazag & Wahban, Ameerah (2013), “The Determinants of Employment inJordan: A Time Series Analysis”. Journal Business and Economics Management. Vol. 2.Desember, pp. 927-936. University Jordan.
Bellante, Don dan Jackson, Mark. (1990), Ekonomi Ketenagakerjaan.Jakarta:LP FE UI.
Boediono. (1999), Teori Pertumbuhan Ekonomi. Yogyakarta: BPFE.
Cahyadi, Luh D. (2013), Analisis Faktor-Faktor yang Mempengaruhi Penyerapan Tenaga KerjaIndustri Kreatif Kota Denpasar. Tesis. Universitas Udayana, Denpasar(tidak dipublikasi).
Cahyono, Hendry. (2012), Penyerapan Tenaga Kerja Sektoral di Kabupaten Sidoarjo. JurnalEkonomi Pembangunan Media Trend,Vol. 7 No. 2 Oktober 2012, Hal 141-154. UniversitasNegeri Surabaya.
Devanto dan Putu. (2011), Kebijakan Upah Minimum Untuk Perekonomian yang Berkeadilan:Tinjauan UUD 1945. Journal of Indonesian Applied Economics,Vol. 5 No. 2, Hal: 269-284.Universitas Brawijaya, Malang.
Dimas & Woyanti, Nenik. (2009), Penyerapan Tenaga Kerja di Dki Jakarta.Jurnal Ekonomi danBisnis,Vol. 16, No.1, Hal: 32–41.Fakultas Ekonomi Universitas Diponegoro, Semarang.
Ehrenberg, Ronald G., dan Smith, Robert S. (1982), Modern Labor Economics: Theory and PublicPolicy. Eight Edition. Pearson Education, Inc. New York City.
Ferdinan, Hery. (2011), Pengaruh Pengeluaran Pemerintah, PDRB, dan Upah Rill TerhadapPenyerapan Tenaga Kerja di Sumatera Barat. Fakultas Ekonomi dan Manajemen, InstitutPertanian Bogor (tidak dipublikasi).
Feriyanto, Nur. (2014), Ekonomi Sumber Daya Manusia (Dalam Perspektif Indonesia). Yogyakarta:Penerbit UPP STIM YKPN.
Fridhowati, Nila. (2011), Analisis Faktor-Faktor yang Memengruhi Penyerapan Tenaga Kerja PadaSektor Industri di Pulau Jawa Tahun 2003-2010. Fakultas Ekonomi dan Manajemen, InstitutPertanian Bogor (tidak dipublikasi).
Gujarati, Damodar. (2006), Ekonomitrika Dasar. Jakarta: Erlangga. Terjemahan Dr. GunawanSumodiningrat, BPFE UGM, Yogyakarta.
Javed, Khalid & Awan, Rehmat Ullah (2011), “Foreign Direct Investment, Economic Growthand Employment: Evidence from Pakistan”. Journal Business and Economics, Vol. 3. Juli, pp:1399-1409.University Sargodha, Pakistan.
Kuncoro, Haryo, (2001), “Sistem Bagi Hasil dan Stabilitas Penyerapan Pekerja”, Jurnal MediaEkonomi, Volume 7, Nomor 2 hal 165-168.Universitas Gajah Madah, Yogyakarta.
Mulyadi, Subri. (2003), Ekonomi Sumber Daya Manusia. Jakarta: PT Raja Grafindo Persada.
Nicholson, Walter. (2003), Teori Mikro Ekonomi: Prinsip Dasar dan Perluasan. [Edisi ke-5]Daniel Wirajaya [penerjemah]. Binarupa Aksara, Jakarta.
Pardi, Subhan. (2007), Faktor-Faktor yang Mempengaruhi Penyerapan Tenaga Kerja di SumateraSelatan. Tesis. PPS Fakultas Ekonomi, Universitas Sriwijaya (tidak dipublikasi).

1792 Bambang Bemby Soebyakto and Yunisvita and Romi Akbar
Pyndick, Robert S danRubinfeld, Daniel L. (2009), Mikroekonomi.Jilid 1 (Edisi BahasaIndonesia). Jakarta: PT Macanan Jaya Cemerlang.
Prihartanti, Eva D. (2007), Analisis Faktor-Faktor yang Mempengaruhi Penyerapan Tenaga KerjaSektor Industri Di Kota Bogor. Fakultas Ekonomi dan Manajemen, Institut Pertanian Bogor(tidak dipublikasi).
Sarwoko. (2005), Dasar-Dasar Ekonometrika. Yogyakarta: Andi Offset.
Sholeh, Maimun. (2007), “Permintaan dan Penawaran Tenaga Kerja Serta Upah: Teori SertaBeberapa Potretnya di Indonesia”. Jurnal Ekonomi dan Pendidikan, Vol. 4 No. 1, Hal: 62-75.Universitas Negeri Yogyakarta.
Sianipar, Herlina Hotmadinar. (2012), Analisis Pengaruh Pertumbuhan Ekonomi TerhadapPenyerapan Tenaga Kerja dan Tingkat Kemiskinan di Provinsi Sumatera Utara. FakultasEkonomi, Universitas Sumatera Utara (tidak dipublikasi).
Sidik, Fajar. (2012), Analisis Dampak Kebijakan Upah Minimum Terhadap Penyerapan Tenaga KerjaSektor Industri dan Perdagangan, Hotel dan Restoran di Pulau Jawa Pada Era Otonomi Daerah..Fakultas Ekonomi dan Manajemen, Institut Pertanian Bogor (tidak dipublikasi).
Simanjuntak, Payaman J. (1985), Pengantar Ekonomi Sumber Daya Manusia. Lembaga PenerbitFakultas Ekonomi Universitas Indonesia, Jakarta.
Stiabudi, Heru. (2005), Pengaruh Pertumbuhan PDRB Terhadap Elastisitas Kesempatan Kerja diProvinsi Sumatera Selatan.Tesis. PPS Fakultas Ekonomi, Universitas Sriwijaya (tidakdipublikasi).
Sudarsono. 1988. Ekonomi Sumber Daya Manusia. Yogyakarta: BP.STIE YKPN.
Sukirno, Sadono. (2012), TeoriPengantarMakro Ekonomi.Edisi Ketiga. Jakarta: PT Raja GrafindoPersaja.
Sukirno, Sadono. (2011), TeoriPengantar Mikro Ekonomi.Edisi Ketiga. Jakarta: PT Raja GrafindoPersaja.
Sumarsono, Sonny. (2003), Ekonomi Manajemen dan Sumber Daya Manusia. Jakarta: LDFE-UI.
Sulistiawati, Rini. (2012), “Pengaruh Upah Minimum Terhadap Penyerapan Tenaga Kerja danKesejahteraan Masyarakat di Provinsi di Indonesia”. Jurnal Ekonomi Pembangunan,Vol. 8,No. 3, Hal: 195–211. Fakultas Ekonomi Universitas Tanjungpura, Pontianak.
Tarmizi, Nurlina. (2012), Ekonomi Ketenagakerjaan. Edisi Kedua.Palembang: UniversitasSriwijaya Press.
Todaro, Michael P. (2000), Pembangunan Ekonomi di Dunia Ketiga. Edisi Ketujuh. Jakarta:Erlangga.
Wicaksono, Rezal. (2009), Analisis Pengaruh PDB Sektor Industri, Upah Riil, Suku Bunga Riil, danJumlah Unit Usaha Terhadap Penyerapan Tenaga Kerja pada Industri Pengolahan Sedang danBesar di Indonesia Tahun 1990- 2008. Semarang: Universitas Diponegoro.
Widarjono, Agus. (2013), Ekonometrika Pengantar dan Aplikasinya. Edisi Keempat. Yogyakarta:UPP STIM YKPM.
Wijaya, Farah M. (2013), Analisis Leading Sector Terhadap Penyerapan Tenaga Kerja di KalimantanTimur dan Faktor-Faktor yang Memengaruhinya. Fakultas Ekonomi dan Manajemen, InstitutPertanian Bogor (tidak dipublikasi).
Zamrowi, M. Taufik. (2007), Analisis Penyerapan Tenaga Kerja pada Industri Kecil (Studi diIndustri Kecil Mebel di Kota Semarang). Tesis. Program Pasca Sarjana UniversitasDiponegoro, Semarang(tidak dipublikasi).