vuosikertomus 2008annual report 20082007 2008 276 303 622 638 935 996 1272 1357 11,5 16,4 19,9 13,7...
TRANSCRIPT

Vuosikertomus 2008Annual Report 2008

SiSältö
Atria-konsernin vuosi 2008Taloudellinen yhteenvetoLiiketoiminta-alueet ja tuotemerkit ................................. 1Keskeiset tapahtumat ....................................................... 2Toimitusjohtajan katsaus .................................................. 4Strategia ............................................................................ 6Strategiset toimenpiteet ................................................... 8
toimintakatsauksetAtrian liiketoimintaympäristö ......................................... 12Atria Suomi ..................................................................... 14Atria Skandinavia ............................................................ 18Atria Venäjä ..................................................................... 22Atria Baltia ...................................................................... 26
YritysvastuuPeriaatteet ...................................................................... 30Ympäristövastuu ............................................................. 32Atrian laatu-ja ympäristöjärjestelmät ............................ 33Sosiaalinen vastuu .......................................................... 36Tuotekehitys ja markkinointi .......................................... 41
tilinpäätös ja toimintakertomus ............................ 44
Hallinnointi ja ohjausHallinnointiperiaatteet .................................................. 104Atria Oyj:n hallinto ........................................................ 106Atria-konsernin organisaatio ja johtoryhmä ................ 108Sijoittajasuhteet ja analyytikot ...................................... 110Yhteystiedot ................................................................... 112
Atria kasvaa ja kansainvälistyy Atria Oyj on voimakkaasti kasvava ja kansainvälistyvä, suomalainen elintarvikealan yritys. Liikevaihdoltaan Atria-konserni on suurin lihanjalostaja Suomessa ja yksi johtavista ruoka-alan yrityksistä Pohjoismaissa, Venäjällä ja Baltian alueella.
Atrian1) liikevaihto vuonna 2008 oli 1 356,9 miljoonaa euroa ja sen palveluksessa oli keskimäärin 6 135 henkilöä. Konserni jakaantuu neljään liiketoiminta-alueeseen. Ne ovat Atria Suomi, Atria Skandinavia, Atria Venäjä ja Atria Baltia.
Atrian asiakasryhmiä ovat päivittäistavarakauppa, Food Service –asiakkaat ja alan teollisuus. Lisäksi sillä on omiin tuotemerkkeihin perustuvaa Fast Food -konseptiliiketoimintaa.
Atrian juuret ulottuvat vuoteen 1903, jolloin perustettiin sen vanhin omistajaosuuskunta.
Atria Oyj:n osakkeet listataan Nasdaq OMX Helsinki Oy:ssä.
1) ”Atria”-ilmaisulla tarkoitetaan tässä vuosikertomuksessa koko Atria-
konsernia. Konsernin emoyhtiö on Atria Oyj.
Atria is growing and becoming more international
Atria Plc is a powerfully growing and internationalis-ing Finnish food-industry company. Atria is the largest meat processor in Finland in the terms of sales and one of the leading food industry companies in the Nordic countries, Russia and the Baltic region.
Atria’s1) net sales in 2008 was EUR 1,356.9 mil-lion and it employed an average of 6,135 persons. The Group is divided into four business areas: Atria Finland, Atria Scandinavia, Atria Russia and Atria Baltic.
Atria’s customer groups are retail trade, Food Service sector and industry. In addition it has a Fast Food concept business based on its own brands. Atria’s roots go back to 1903, when its oldest owner co-operative was founded. Atria Plc’s shares are listed on the Nasdaq OMX Helsinki Ltd.
1) “Atria” refers to the entire Atria Group in this annual report.
The Group’s parent company is Atria Plc.
tAble of contentS
Atria Group’s financial year 2008
Financial summaryBusiness areas and brands .............................................. 1Key events ......................................................................... 2CEO’s review ..................................................................... 4Atria’s strategy .................................................................. 6Strategic operations ......................................................... 8
Review of operationsAtria’s business environment ......................................... 12Atria Finland ................................................................... 14Atria Scandinavia ............................................................ 18Atria Russia ..................................................................... 22Atria Baltic ...................................................................... 26
corporate responsibilityPrinciples ........................................................................ 30Environment responsibility ............................................. 32Atria’s quality and environment systems ...................... 33Social responsibility ........................................................ 36Product development and marketing ............................. 45
financial statement and annual report ................ 44
corporate GovernanceCorporate Governance Principles ................................ 104Atria Plc’s administration ............................................. 106Atria Group’s organisation and management team ..... 108Investor relations and analysts .................................... 110Contact details .............................................................. 112

liikevaihto
liikevoitto
bruttoinvestoinnit
tA l o U D e l l i n e n Y H t e e n V e t o
Atria-konsernin avainluvut 2008
2008 2007
Liikevaihto, milj. euroa 1356,9 1 272,2
Liikevoitto, milj. euroa 38,4 94,5
Operatiivinen liikevoitto*), milj. euroa 39,9 61,4
Operatiivinen liikevoitto, % 2,9 4,8
Voitto ennen veroja, milj. euroa 16,7 80,6
Osakekohtainen tulos, euroa 0,42 2,56
Omavaraisuusaste, % 38,4 47,6
Bruttoinvestoinnit, milj. euroa 152,6 284,1
Bruttoinvestoinnit liikevaihdosta, % 11,2 22,3
Henkilöstö keskimäärin 6135 5 947
*) Operatiivinen liikevoitto = liiketoiminnasta muodostuva liikevoitto ilman merkittäviä kertaluonteisia eriä.
Varsinainen yhtiökokousAtria Oyj:n varsinainen yhtiökokous pidetään 29.4.2009 Helsingissä, Finlandia-talossa.
taloudelliset raportit vuonna 2009Atria Oyj julkaisee tulostietoja vuonna 2009 seuraavasti:Tilinpäätöstiedote vuodelta 2008 ............25.2.2009Vuosikertomus vuodelta 2008................ viikolla 16Osavuosikatsaus Q1 (3 kk) ......................28.4.2009Osavuosikatsaus Q2 (6 kk) ..................... 30.7.2009Osavuosikatsaus Q3 (9 kk) .................... 27.10.2009
Atrian taloudellinen informaatio julkaistaan ajantasaisesti yhtiön internetsivuilla osoitteessa www.atria.fi/konserni.
liikevaihto
liikevoitto
bruttoinvestoinnit
Annual General MeetingAtria Plc’s Annual General Meeting will be held on 29 April 2009 in Helsinki at the Finlandia Hall.
financial reporting in 2009Atria Plc will publish financial results in 2009 as follows:2008 Financial statement .......................25.2.20092008 Annual report ................................... week 16Interim report Q1 (3 months) ..................28.4.2009Interim report Q2 (6 months) ................. 30.7.2009Interim report Q3 (9 months) ................ 27.10.2009
Atria’s financial information will be published in real time on the company website at www.atria.fi/konserni.
f i n A n c i A l S U M M A R Y
*) Operative EBIT = operating profit excluding significant non-recurring items
Atria Group key indicators 2008
2008 2007
Net sales, EUR million 1,356.9 1,272.2
EBIT, EUR million 38.4 94.5
Operative EBIT*), EUR million 39.9 61.4
Operative EBIT % 2.9 4.8
Profit before tax, EUR million 16.7 80.6
Earnings per share, EUR 0.42 2.56
Equity ratio, % 38.4 47.6
Gross investments, EUR million 152.6 284.1
Gross investments of turnover, % 11.2 22.3
Average personnel 6,135 5,947

2004 2005 2006 2007 2008
2004 2005 2006 2007 2008
2004 2005 2006 2007 2008
2004 2005 2006 2007 2008
2004 2005 2006 2007 2008
net sales net sales by business area
ebit operative ebit
Gross investments Average personnel
Atria Finland ...............58%Atria Sweden ...............35%Atria Russia .................. 5%Atria Baltic ................... 2%
Total EUR 1,356.9 million
1,500
1,200
900
600
300
0
100
80
60
40
20
0
300
240
180
120
60
0
100
80
60
40
20
0
7,000
6,000
5,000
4,000
3,000
0
EUR mill. persons
EUR mill.
EUR mill. EUR mill.

A t r i A ' s b u s i n e s s A r e A s A n d b r A n d s
AtriA's business AreAs And production plAnts
Atria FinlandNurmo (1), Karkkila (2), Kuopio (3), Kauhajoki (4), Forssa (5)
Atria scandinavia Sköllersta (6), Malmö/Fosie (7), Stockholm, 3 units (8), Tranås (9), Halmstad (10), Kinna (11), Moheda (12), Norrboda/Nässjö (13), Borås (14), Norrköping (15), Göteborg (16), Falköping (17), Horsens (18)
Atria russiaSt. Petersburg (Sinyavino, Gorelovo) (19), Moscow (20)
Atria balticValga (21), Ahja (22), Vastse-Kuuste (23)
sweden: 9.0 million inhabitants
Finland: 5.3 million inhabitants
estonia: 1.3 million inhabitants
Moscow region:17.0 million inhabitants
st. petersburg region:6.0 million inhabitants
denmark: 5.4 million inhabitants In Atria’s market area, in the Baltic Sea region and in European parts of Russia, there are approximately 50 million consumers.
AtriA's brAnds 2008
Atria Finland Atria scandinavia Atria russia Atria baltic
latvia: 2.3 million inhabitants
lithuania: 3.6 million inhabitants
1

• Netsalesdecreaseby3percentfromthecomparative period, which included EUR38millionofnetsalesfromtheSwedishcompanySvenskSnabbmatförStorkökAB.
• OperativeEBITis32percentlowerthantheyearbefore.
• Theriseinrawmaterialpricescontinues.• AtriaacquirestheSwedishABRidderheims
Delikatesser,aproducerofdelicatessenproducts.Thecompanypostednetsalesofapproximately EUR 50 million.
» See page 19.• AtriaacquirestheEstonianmeatprocessing
companies AS Wõro Kommerts and AS Vastse-Kuuste Lihatööstus. Their combined net sales are nearly EUR 20 million.
» See page 26. • AtriaRussiareportsthatthecompletionofthe
new meat processing plant in Gorelovo, St. Petersburg will be postponed to 2009.
» See page 23.
• Netsalesincreasebyabout10percent• OperativeEBITis41percentlowerthanin
the comparative period. • Theupwardtrendinrawmaterialprices
weakens profitability dramatically in the Atria Finland and Atria Russia business areas.
• AtriaFinlandlaunchesanextensiveefficiencyimprovementprogramme,whichis expected to generate annual cost savings ofapproximatelyEUR4million.
» See page 14.
K e y e v e n t s i n 2 0 0 8Q
4 O
ctob
er–D
ecem
ber
Q1 January–March
Q2 April–June
Q3 July–September
•Netsalesincreasebysomesevenpercent,butprofitabilityisveryunsatisfactory.Atria Scandinavia, Atria Russia and Atria Baltic post negative results. Atria Finland succeeds well in its sales, and operative EBITisuponthepreviousyear.AtriaFinland’sEBITpercentageis5.7.
•AtriaRussia’snewlogisticscentreinGorelovo, St. Petersburg region is opened and the three warehouses located in downtown St. Petersburg are closed.
» See page 23. •AtriaEstoniaconcentratesitsslaughtering
and meat cutting operations at the Valga plant.
» See page 27.
• Netsalesgrowbynearly15percent• OperativeEBITis8.5percentlowerthan
in the previous year. • Profitabilityisimprovedconsiderably
in the Atria Finland and Atria Russia businessareascomparedtothefirsthalfoftheyear.
• AtriaacquirestheRussianmeatprocessingcompanyOOOCampomos,whosemainmarketisMoscow.In2007,thecompanyreportednetsalesofaround EUR 75 million.
» See page 23.
2

2007 2008
276 303
622 638
935996
12721357
11,5
16,4
19,9
13,7
3,8
6,8
11,1
18,2
1400
1200
1000
800
400
200
0 2007 2008
EUR mill.
276 303
622 638
935996
1272
Atria Goup's net sales development
25
20
15
10
5
0
EUR mill.
11,5
16,4
19,9
13,7
6,8
11,1
18,2
2007 2008
the development of Atria Group's operative ebit quarterly
2007 2008
250
200
150
100
50
0
EUR mill.
Q3 net sales by business areas
2007 2008
250
200
150
100
50
0
EUR mill.
Q1 net sales by business areas
2007 2008
20
15
10
5
0
-5
EUR mill.
Q1 operative ebit
2007 2008
250
200
150
100
50
0
EUR mill.
Q2 net sales by business areas
2007 2008
20
15
10
5
0
-5
EUR mill.
Q2 operative ebit
2007 2008
20
15
10
5
0
-5
EUR mill.
Q3 operative ebit
2007 2008
15
10
5
0
-5
-10
EUR mill.
Q4 operative ebit
2007 2008
250
200
150
100
50
0
EUR mill.
Q4 net sales by business areas
Atria FinlandAtria ScandinaviaAtria RussiaAtria Baltic
Q1Q2Q3Q4
Q1 January–March
Q2 April–June
OperativeEBIT=operatingprofitexcluding significant non-recurring items
Total MEUR 61.5 Total MEUR 39.9
3

c e o ’ s r e v i e w
A year of strategic growth and changing business environment
The year 2008 was a success for Atria in terms of growth. We grew in line with our strategy both organically and through acquisitions.
Profitability, however, fell short of our expectations. Our ability to make profit was reduced by the strong changes in our business environment. The most significant of these were the steep rise in the price of meat raw material and the dramatic weakening of key currencies. The escalated price of meat raw material in the first half of the year, mainly due to an increase in corn and feed prices, eroded our profitability in all of our business areas. The weakening of the Russian rouble and Swedish krona in the last quarter increased costs considerably in the Atria Russia and Atria Scandinavia busi-ness areas, where our production is mainly based on im- ported raw material. In addition to cost pressures in the business environment, Atria Russia’s performance was weighed down by the loss-making operations of one of our acquired companies, Campomos.
The global economic recession had a less dramatic im-pact on Atria – and the entire food industry – than on most other industry sectors. Nevertheless, the impact was signifi-cant both in terms of net sales and profitability. The recession reduced general consumer demand for fast-moving consum-er goods and shifted purchasing towards more inexpensive products in the food products represented by us.
strategic acquisitions support international growthIn 2008 Atria made four acquisitions that complement its strat- egy. They all support the growth of our international operations and our goal of becoming the market leader or the second largest market player in all four of our business areas. We used some EUR 110 million on acquisitions. Furthermore, industrial investments totalled EUR 63 million, less than last year’s level.
“Atria has supported its growth through strategic acquisitions, making heavy investments over the past two years. In 2009, we will focus on improving our profitability by success-fully merging the acquired companies with Atria and by fully capitalising on synergies. Particular attention will be paid to enhancing the performance of Atria Russia. We see the changes in consumer demand resulting from the recession as a challenge, but also as an opportunity for increasing profitable growth.”
Matti TikkakoskiPresident and CEO, Atria Plc
4

Strategically speaking, the most significant acquisition was made in Russia. Through the Campomos acqui-sition, we established a firm foothold in Moscow, the single largest market in Russia, and also strengthened our position in St. Petersburg. Due to our new subsidiary, our production capacity increased substantially, our brand portfolio was expanded by strong brands and we also obtained our own primary production. Hav-ing our own raw material supply en- hances our competitiveness in Rus-sia. The Campomos acquisition lifted Atria’s net sales in Russia consider- ably and made it the country’s leading international meat processor.
In Sweden, we acquired Ridder-heims Delikatesser, which supports Atria Scandinavia’s growth strategy in product groups with a high degree of processing. Ridderheims’s operations were merged with the Falbygdens Ost company, after which a new business area, Atria Deli, was established. We believe that this business area, which specialises in fresh delicatessen prod-ucts, has excellent opportunities for growth in export markets as well. Delicatessen products form a nar-row speciality segment in consumer goods retail trade which according to our studies will experience significant growth over the long run.
In Estonia, we have been a too small player. As a result of acquiring Wõro Kommerts and Vastse-Kuuste Lihatööstus, we are now the coun-try’s second largest meat industry company. Our new position gives us an opportunity to influence the de-velopment of the industry in Estonia and provides a solid foundation for growth in Estonia and elsewhere in the Baltic region.
profitable growth driven by Atria Finland Atria Group’s operative EBIT de-creased by EUR 20 million to EUR 40 million, which accounts for some three percent of our net sales. This was an unsatisfactory result con-
sidering our five percent target for op-erative EBIT margin.
Significant share of our revenues were generated in the Atria Finland business area. In the early part of the year, Atria Finland streamlined and adjusted its operations to meet the cost pressures, and due to increased sales and strengthened margins, its performance in the second half of the year was even better than the year be-fore. The strong Atria brand boosted the growth of our sales in Finland substantially.
In the Atria Scandinavia business area, the trend was just the reverse. The good performance in the first half of the year declined dramatically towards the end of the year. We were not able to pass on the increased raw material costs to end product prices swiftly enough. The weak profitabil-ity of the salad and sandwich oper- ations, the non-recurring items of the efficiency improvement programme as well as the rapid weakening of the Swedish krona eroded our perform-ance. However, market shares devel-oped positively particularly in Sweden.
The sales and market shares of Pit-Product grew in the intense com-petitive situation in the St. Petersburg region. However, the considerable losses of the meat processing com- pany Campomos, which we acquired in the summer, undermined substan-tially not only Atria Russia’s but the entire Atria Group’s performance to-wards the end of the year.
In the Atria Baltic business area, our profitability targets were not achieved. In addition to a challeng-ing business environment, earnings improvement was slowed by the loss-making Valga Lihatööstus. Towards the end of the year, earnings develop-ment took a more positive turn thanks to new acquisitions.
2009 a year of stabilisation Over the past two years, Atria has invested over EUR 300 million in acquisitions supporting its growth. Last year, our equity ratio fell to 38
percent, which is slightly below our minimum target level of 40 percent. In 2009, we intend to reduce investments compared to 2008. This year we will concentrate on improving our oper- ational profitability.
Enhancing the performance of Atria Russia will play a pivotal role in improving our profitability. Our aim is to take the Campomos company from red to black during 2010 by increas-ing the cost-efficiency of Campomos, improving its sales and maximising the synergies between Campomos and Pit-Product. The earnings of Pit- Product continue to develop favourably.
The successful integration of the acquired companies into Atria will also be the key to enhancing our prof- itability in the Baltic and Scandinavia business areas. The new subsidiaries in Estonia make it possible to develop operations and raise profitability to an entirely new level. In Sweden, we will concentrate on the integration but also on streamlining our cost structure considerably. In Finland, profitability improvement measures will be ap-plied to the entire Atria food chain. This is the only way to strike a bal-ance between costs and sales prices.
The decline in consumer demand and changes in purchasing habits re-sulting from the recession are a chal-lenge for Atria, but also an opportu-nity. Our cost-efficiency is among the best in the industry. We also have a broad product selection for various consumer segments, and we are well-placed to respond to changes in de-mand. I can confidently say that even in these economic conditions, Atria has extremely successful products.
I would like to thank all Atria employ-ees and our partners for the past year and excellent cooperation, which bene- fits our customers, our shareholders and our company.
Nurmo, February 2009
Matti TikkakoskiPresident and CEO, Atria Plc
5

Striving for leadership in fresh foods
Atria’s strategic goal is to be the first choice for consumers and customers in fresh foods in the Baltic Sea region and European parts of Russia.
Atria implements its vision through its strategy of profitable growth. In line with this strategy, Atria seeks growth in the traditional meat processing market and also more extensively in the entire food sector, particularly in the fresh products segment.
Atria aims to grow mainly organic- ally, but complementary acquisitions are also possible.
core strenGths supportinG GrowthAtria’s growth in international food markets is supported, in particular, by the following core strengths, which it utilises and develops actively:
Strong market positionAtria is the market leader in Finland with a supplier share of approximate-ly 30 percent. In Sweden, the com- pany is the second largest market player whose position was strengthened con-siderably through the acquisitions of Sardus in 2007 and Ridderheims in 2008. These acquisitions also rein-forced Atria’s position in Denmark. In Russia, Atria is the market leader in the quickly growing, modern daily consumer goods retail trade in the St. Petersburg area. In the Moscow re-gion, Atria established itself through the Campomos acquisition completed in 2008.
Strong brandsAtria has strong and well-known brands, and it invests consistently in their development. Thanks to its strong brands, Atria is well-placed to continue launching products with a higher degree of processing and bet-ter profitability.
Good consumer experience and management of customer relationsKnowing consumers’ purchasing and eating habits is the main challenge in the food industry. Atria manages this task well.
Atria cooperates with the leading players in consumer goods retail trade in all of its business areas. The Group strengthens its strategic customer partnerships by developing new and profitable cooperation models separ- ately with each consumer goods retail chain.
Efficient production structure and good management of change processes and the delivery chainAtria has met the challenges for change presented by the consumer goods retail trade and the entire busi-ness environment through extensive investments that make its production structures more efficient. Experience with increasing production efficiency and good control over change pro- cesses and the delivery chain are Atria’s core strengths in all of its business areas.
FinAnciAl tArGets Atria has defined the following five fi-nancial targets for its operations:
Share of international operationsAtria’s goal is to grow into a company in which international operations ac-count for at least 50 percent of net sales.
ProfitabilityAtria aims at even earnings develop-ment; the target for operative EBIT margin is at least 5 percent of net sales.
Return on equityAtria’s ROE target is 12 percent.
Equity ratioAtria aims at an equity ratio of at least 40 percent.
Distribution of dividendsAtria’s aim is to pay out some 50 per-cent of the profit for the period as dividends.
A t r i A ' s s t r A t e G y
6

Vision 2012Atria is the first choice for consumers and customers in fresh food in the baltic sea region and in european parts of russia. • We are the market leader or number two in all of our business
areas. This way we are the best creator of sustainable shareholder value.
• Our brands are among the two best-known brands in the existing food category, developing markets of meat products and in emerging markets in the meat categories.
• We are our customers’ most preferred partner in the existing food category, developing markets of meat products and in emerging markets in the meat categories.
• We are the most efficient and streamlined company in the industry. • We are the best employer; our tools are good management and
systematic development of skills based on our strategy.Values
profitability and forerunner in our business • Consumer and customer focus• Individual and co-operative initiative• Networking – teamworking• Cost-efficiency
Atria’s growth strategy is adapted to strong changes in the business environment. The international business environment is controlled by the following dynamics in particular• Global increasing demand of food• Internationalization of the food industry and industrial processes• Internationalization of retailing and the food service industry• Raw materials migration across borders• Increasing pressure on environmental and ethical issues• More complex consumer behaviours• Operating models based in networking and partnership
chAnGinG business environMent
MissionGood food - better mood.
7

Atria’s primary goal, in line with its strategy, is organic growth, which is supported by complementary acquisi-tions.
In 2008, Atria made four acquisi-tions, which increased its international operations substantially. As a result of the acquisitions, the share of inter- national operations in the Group’s net sales is 42 percent. The strategic goal is for international operations to account for at least 50 percent of net sales.
Atria invested some EUR 110 mil-lion in the acquisitions. Their value halved compared to the previous year.
campomos acquisition: expansion into Moscow Atria doubled its operations in Rus-sia by acquiring the meat processing company OOO Campomos. In 2007, the company posted net sales of ap-proximately EUR 75 million and em-ployed about 1,000 people. The main products of Campomos are meat products and pizzas.
The main market of Campomos is Moscow, where more than 50 per-cent of the company’s products are sold. Roughly 20 percent are sold in the St. Petersburg area and just under 30 percent in other major cities. The company’s production plant and logis-tics centre are located in Moscow and distribution centre in St. Petersburg. Deliveries to principal customers are mainly made using the company’s own fleet. Campomos is also involved in primary production. It owns agri-cultural land and a new pork breeding facility of 2,500 sows whose output is
on a par with Western facilities.Through the acquisition, Atria es-
tablished a firm foothold in the mod-ern consumer goods retail trade in Moscow and strengthened its market leadership in St. Petersburg. Campo-mos has invested in marketing with a long-term view, and its main brand, CampoMos, is well-known in Rus-sia. The company’s product selection complements Atria Russia’s offering and makes it more diverse.
The profitability of Campomos has been poor in recent years. To make the business profitable, a programme was launched within the company in which the key element is synergies to be achieved with Pit-Product in areas such as purchasing, logistics and marketing.
Established in 1989, OOO Campo-mos was the first international meat-industry company in Russia. Atria ac-quired Campomos from the Spanish Campofrio Alimentacion S.A., a pub-licly quoted company that owned 100 percent of its stock. The enterprise value of the deal was EUR 72 million.
Campomos was consolidated into Atria as of 15 October 2008.
ridderheims acquisition: more products with higher added value In the summer, Atria acquired the Swedish AB Ridderheims Delikatesser, which specialises in premium delica-tessen products. In its last financial year, the company recorded net sales of slightly over EUR 50 million and employed 110 staff.
The Ridderheims acquisition will increase the share of products with higher added value in Atria’s portfo-lio. The company’s operations were
merged with Falbygdens Ost, a busi-ness unit of Atria Scandinavia, after which a new business unit, Atria Deli, was established. The selection of fresh delicatessen products offered by the unit is the broadest in the Nordic countries, and the unit’s opportunities for growth are excellent in the export markets as well. Fresh delicatessen products form one of the fastest grow-ing segments in the consumer goods retail trade.
Ridderheims was founded in 1987, and the brand is known for its innov- ation. Its products include beer saus- ages, premium cheese and hams, and marinated products, such as sun-dried tomatoes, olives and garlic. Instead of individual products, Ridderheims al-ways offers a complete product con-cept for its customers. Roughly one-third of the selection is produced by the company, while the rest comes from contract manufacturers or for-eign suppliers. Ridderheims is head-quartered in Gothenburg. In 2008, al-most 40 percent of its products were exported to other Nordic countries as well as the Benelux countries, among others.
The company was consolidated into Atria as of 1 July 2008.
Growth in baltic countries boosted by two acquisitions in estoniaTo boost its growth in Estonia and the other Baltic countries, Atria acquired two Estonian meat processing com-panies, AS Wõro Kommerts and AS Vastse-Kuuste Lihatööstus. In 2007, Wõro Kommerts and Vastse-Kuuste Lihatööstus posted net sales of EUR 10 and 9 million and employed 170
Significant international growth through acquisitions
s t r A t e G i c o p e r A t i o n s i n 2 0 0 8
8

MEUR
2005Acquisition of OOO Pit-• Product, which mainly operates in the St. Petersburg marketAcquisition of the Estonian • AS Valga Lihatööstus
2006Merging of the operations • of Atria’s Lithuanian subsidiary UAB Vilniaus Mesa and the Estonian Valga Lihatööstus Atria Baltic business area • is created
2007Acquisition of the Swedish • AB SardusAcquisition of the Finnish • Liha-Pouttu OySale of the Swedish • subsidiary Svensk Snabbmat för Storkök ABProduction operations in • Lithuania discontinued
2008Acquisition of OOO • Campomos, which mainly operates in the Moscow marketAcquisition of the • Swedish AB Ridderheims DelikatesserAcquisition of the Estonian • AS Wõro Kommerts and AS Vastse-Kuuste Lihatööstus
Net sales: MEUR 975
Atria Finland ................64 % Atria Scandinavia .........32 %Atria Russia1) ..................1 %Atria Baltic .....................3 %
1) As of 1 October 2005
Net sales: MEUR 1,100
Atria Finland ................60 %Atria Scandinavia .........30 %Atria Russia ....................7 %Atria Baltic ....................3 %
Net sales: MEUR 1,270
Atria Finland ................58 %Atria Scandinavia .........35 %Atria Russia ....................5 %Atria Baltic .....................2 %
Net sales: MEUR 1,357
Atria Finland ............... 58 %Atria Scandinavia .........33 %Atria Russia ....................7 %Atria Baltic .....................2 %
2005 2006 2007 2008
1400
1300
1 200
1100
1000
0
Atria’s strategic measures and development of net sales 2005–2008
and 140 people, respectively. The main products of both companies – various meat products and consumer-packed meat – complement and ex-pand Atria’s range of retail products. As a result of the acquisitions, Atria became the second largest industry player in Estonia.
The product portfolio of Wõro Kommerts, established in 1993, in-cludes smoked sausages, meat prod-ucts, raw sausages and frankfurters. In recent years, the company has invested
actively in product quality and brand development. Its 13 percent share of the market, measured in value, made it the second largest meat processor in Estonia 1). The company has a modern production plant in Ahja, close to Tartu, and a distribution terminal in Tartu.
The main products of Vastse- Kuuste Lihatööstus include a range of cold cuts, sausages and consumer-packed meat. In terms of value, its market share was 6 percent. Over the past few years, Vastse-Kuuste has
invested particularly in the modern- isation and capacity improvement of its production plant. The production plant of the company, founded in 1993, is located in southern Estonia, in Vastse-Kuuste.
The companies were consolidated into Atria as of 1 August 2008.
1) Source: AC Nielsen, 2008, unless otherwise
indicated
At r i A s G r o w t h A n d i n t e r n At i o n A l i Z At i o n
9

10 good food
MEGATRENDS
10
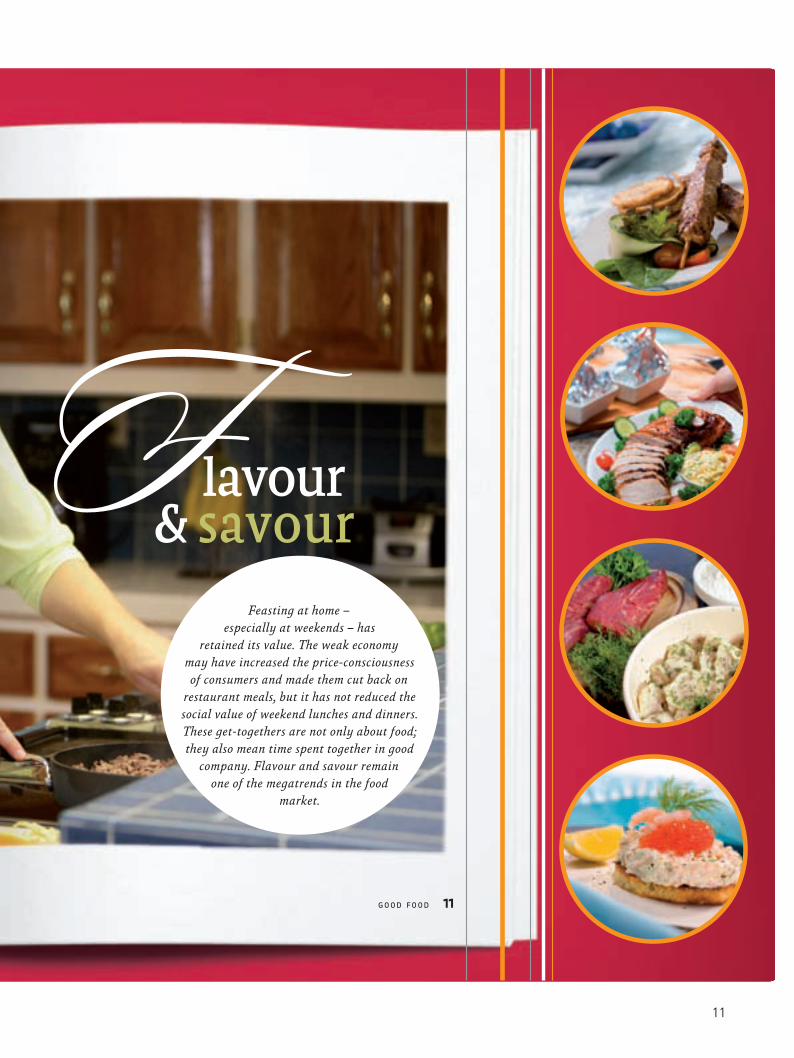
F lavour & savour
good food 11
Feasting at home – especially at weekends – has
retained its value. The weak economy may have increased the price-consciousness of consumers and made them cut back on
restaurant meals, but it has not reduced the social value of weekend lunches and dinners. These get-togethers are not only about food; they also mean time spent together in good
company. Flavour and savour remain one of the megatrends in the food
market.
11

Major differences in growth and concentration between business areas
AtriA FinlAnd AtriA scAndinAviA AtriA russiA AtriA bAltic
1)Consumergoodsretailtrademarket2)TotalgrowthoftheproductgroupsrepresentedbyAtriainconsumergoodsretailtrade3)TotalmarketoffoodproductsrepresentedbyAtria
•Quantitativegrowthofthemarket1) approx. 2% •Growthintermsofvalue2) approx. 8% •Sizeofthemarket3) approx. EUR 2 bn•Shareoffoodincitizens’consumptionexpenditure12%•Finlandisanetexporterofmeat;themainexportispork• Theproductionofbeefisnotsufficienttocoverconsumption;88%ofthebeefconsumedisFinnish
•Chickenproductionandconsumptionareinbalance
Sweden•Quantitativegrowthofthemarket1) 1% •Growthintermsofvalue2) approx. 5% •Sizeofthemarket3) approx. EUR 2.7 bn•Shareoffoodincitizens’consumptionexpenditure11.5%•Swedenisanetimporterofmeat;nearly50%ofbeef,approx.25%ofporkandover40%ofpoultryareimported
Denmark• Denmarkisamajornetexporterofmeatglobally;themain
export is pork
•Consumergoodsretailtradeishighlyconcentrated;thesector is dominated by the S-Group and K-Group.
•ThecombinedmarketshareoftheS-GroupandK-Groupin Finnish consumer goods retail trade is approx. 75%. The shareofTradeka(SuomenLähikauppaOy)issubstantiallysmaller4).
•Theshareofprivatelabelsintotalretailsalesgrewslightlyin 2008. Their shares in products groups represented by Atriarangedfrom5%to15%.
•ConsumergoodsretailtradeishighlyconcentratedinSweden;byfarthemostsignificantplayerisICA,theleading retail company in the Nordic countries with a marketshareofapprox.46%.
•CoopandAxfoodbothhavemarketsharesofapprox.20%inSweden.
• InDenmark,consumergoodsretailtradeisdominatedbyDanskeSupermarked,CoopandSuperGros;togethertheyhas a market share 86%.
•TheshareofprivatelabelsinSwedenandDenmarkwas18%and21%oftotalsales,respectively.
• Therearesome300meatprocessingplantsandslaughterhousesinFinland,ofwhichthe20largestproduceover90%ofthegrossvalueofproduction4).
•ByfarthelargestmarketplayersareAtriaFinlandLtdaswellasHKRuokataloOy.
•AtriaFinlandisthelargestslaughterhouseindustryplayerinFinlandwithitsmarketshareofover40%inporkprocessing.
•Othersignificant,mid-sizedplayersaretheprivatelyownedSaarioinenOy,OySnellmanAbandPouttuOy.
•MorethanhalfoftheSwedishmeatprocessingmarketisdominatedbysmallcompanieswithannualnetsalesofless than EUR 50 million.
•ThelargestmarketplayerisScanAB,AtriaScandinaviaisthe second largest player.
•Theindustryisgoingthroughconsolidation;theSwedishMeatsacquisitionmadebyHKScanin2006andtheSardusacquisitionmadebyAtriain2007arethebiggestM&Aarrangements in the industry in Sweden. Denmark
• InDenmark,theclearleaderinthemeatprocessingmarketisDanishCrown,Europe’slargestcompanyinthissector and the world’s largest meat export company.1)Overalldemandformeatproducts
2)TotalgrowthoftheproductgroupsrepresentedbyAtriainconsumergoodsretailtrade3)TotalmarketoffoodproductsrepresentedbyAtria4)Source:FinnishFoodandDrinkIndustries’Federation,ETL,2008
overview overview
business environment business environment
competitive environment competitive environment
A t r i A ’ s b u s i n e s s e n v i r o n M e n t
In Atria’s business areas of Finland and in Scandinavia the quantitative growth in meat consumption is low and consumer goods retail trade is concentrated. In Russia and the Baltic countries, overall demand for meat products
and Atria’s other food product groups is expected to grow considerably over the long term, and the consolidation of consumer goods retail trade is only just beginning.
12

AtriA FinlAnd AtriA scAndinAviA AtriA russiA AtriA bAltic
1)Overalldemandformeatproductsinmodernconsumergoodsretailtrade2)TotalmarketoffoodproductsrepresentedbyAtria
• TheEstonianconsumergoodsretailtradehasbeenrapidlymodernisedafterthecountryjoinedtheEUin2004
• Theemergenceofchainstoresintheconsumergoodsretail trade has been rapid throughout Estonia.
•Nordicchainshaveaprominentpositioninthecountry,themostimportantonesbeingRimiBaltic,ownedbyICA,andPrisma, owned by the S-Group. Selver and VP Market are the main local players.
•Estonia’slargestmeatindustrycompanyisRakvereLihakombinaat,Atria’sacquisitionshavemadeitthesecondlargestindustryplayerinEstoniawithamarketshareofmore than 20%.
•ThenumberofmeatprocessingcompanieshasdecreasedslightlyinEstonia,andsmallcompanieswhichoftenoperatelocallyaremorefocusedonimprovingtheiroperationalefficiencythanexpansion.
1)Overalldemandformeatproductsinmodernconsumergoodsretailtrade2) TotalmarketoffoodproductsrepresentedbyAtria
St. Petersburg Growthintermsofvalue1) approx. 7% Sizeofthemarket2) approx. EUR 0.9 bn
Moscow•Growthoffoodproductsintermsofvalueapprox.7%•Sizeofthemarket2) approx. EUR 2 bn
• Shareoffoodincitizens’consumptionexpenditureinRussia32%•Russiaistheworld’smostsignificantnetimporterofmeat;thecountry’sownmeatproductioncannotsatisfythegrowingdemandeitherintermsofquantityorquality
Estonia•Growthintermsofvalue1) approx. 7% •Sizeofthemarket2) approx. EUR 200 m (the entire Baltic
region)•Shareoffoodincitizens’consumptionexpenditurein
Estonia 25% •Estonia’sownmeatproductionismostlysufficienttocovertheincreaseddemand;someporkisimported
• Theshareofmodernconsumergoodsretailtradeis growing rapidly in Russia, although traditional marketplaces and market halls continue to dominate with a shareofover45%.
•Consumergoodsretailtradeishighlyfragmented,butthegrowthofchainsisrapid.
• Thecombinedmarketshareofthefivelargestretailchainsisapprox.12%oftheRussianfoodmarket.Thelargestchains are X5, Metro, Tander and Auchan.
•TheconsolidationofthemeatprocessingindustryisjustbeginninginRussiaandtherearefewinternationalplayers;theCampomosacquisitionmadeAtriathelargestinternational player in Russia.
•ThebiggestmeatprocessingcompaniesinRussiaaresmallcompared to European businesses. The biggest players areProdo,Cherkizovo,Mikoyain,Ostankino,TsaritsynoandAtria.
overview overview
business environment business environment
competitive environment competitive environment
•ThefoodindustryisthelargestindustryintheEUandmeat processing is its largest sub-sector.
•Thefoodindustryanditsmostimportantcustomersegment, consumer goods retail trade, are in the process of becoming more international and concentrated.
•Despitetheincreasinglyinternationalnatureoftheindustry,eating habits are still largely national and culture-specific.
•Theaveragemarginsofmeatindustryproductsarelowerthan in many other industries, and the price levels of products will be harmonised globally in the long run.
•Thefoodindustryislesssensitivetobusinesscyclesthanmost other industries.
13

A t r i A F i n l A n d
14

15
1) Contrary to the previous practice, the market data presented is based on information and reports provided
by Atria and its partners. This is because data collection practices in the consumer goods retail trade have
changed. Atria is responsible for the accuracy of the information.
Atria Finland’s sales volumes increased steadily, and the company was able to strengthen its market leadership. However, operational profitability was down due to a sharp rise in the prices of raw materials, supplies and energy, and the targeted EBIT was not achieved.
In the Finnish consumer goods re-tail trade, the sales of product groups represented by Atria, measured in value, grew slightly more than the year before. Total growth was in the region 8 percent. The growth of Atria’s own brands far exceeded the total growth, standing at about 14 percent1).
Atria’s share of the supply market decreased slightly over the previous year as Atria did not engage in ag-gressive price competition between private labels. Nevertheless, Atria re-mained the clear market leader in food product groups.
Increased sales especially in the first half of the year and the improve-ment of prices since the spring boost-ed Atria Finland’s net sales by 6.4 per-cent to EUR 798 million. The growth of net sales was nearly at the previous year’s level.
Due to weak first half year op-erational profitability fell short of the target. Operative EBIT decreased to EUR 34.4 million, or 4.3 percent of net sales. Profitability was reduced by the dramatic rise in meat raw material prices in particular, but the costs of other key factors of production also increased more steeply and quickly than expected. The sales price in-creases were not enough to compen-sate the rise in the costs.
Sales directed at Food Service en-terprises remained at the previous year’s level. Late in the year, economic uncertainty reduced demand particu-larly in the hotel and restaurant sector.
Atria’s export volumes and profita-bility developed in pace with the global meat market trends. In early 2008, operational profitability was poor due
to a large oversupply of pork. In the summer, the markets recovered some-what and boosted export prices, which improved profitability considerably in the latter half of the year. Atria’s top export countries were Sweden and Russia. At the end of the year, export prices began to fall.
efficiency improvedTo enhance its cost-efficiency, Atria Finland launched an efficiency im-provement programme at the begin-ning of the year. The aim is for the programme to generate annual cost savings of EUR 4 million.
Atria discontinued its operations at the rented Kannus production plant, whose bovine and pig slaughtering were transferred to Atria in conjunc-tion with the acquisition of Liha- Pouttu Oy the previous year. The com-pany’s bovine slaughtering and cutting were transferred to the Kauhajoki and Kuopio production plants and pig slaughtering and cutting to the Nurmo production plant. Liha-Pouttu’s meat procurement operations were merged with A-Farmers Ltd’s operations.
The logistics and meat product manufacturing operations of Atria’s For-ssa production plants were moved to Nurmo. Atria will continue convenience food and meal production in Forssa.
The efficiency improvement pro-gramme will result in a reduction of 170 persons.
Growth fuelled by Atria brandAtria Finland’s sales were driven by products bearing the Atria brand, whose sales grew by 14 percent. The growth of private labels manufactured by Atria and of the Forssa brand did not quite meet expectations. Competi-tion between private labels was fierce due to intense price competition.
Sales of cold cuts, which is a core product group at the Group level, grew by nearly 12 percent, outstrip-ping by far the average market growth
Atria’s growth clearly above market growth
y e A r 2 0 0 8
• Net sales grew by 6.4 per cent to EUR 798 million
• Comparable operative EBIT decreased by 20.4 percent to EUR 34.4 million
• An extensive operational efficiency improvement programme was implemented
At r i A F i n l A n d K e y co M pA n i e s
A t r i a F i n l a n d l t d• Develops, manufactures and
markets Finnish fresh food products and related services
• Production plants in Nurmo, Forssa, Kuopio, Kauhajoki and Karkkila
A - F a r m e r s l t d• Company focused on meat
procurement
A - r e h u o y• Company focused on the feed
business• Production plants in Koskenkorva
and Varkaus
At r i A F i n l A n do p e r At i o n s
• Meat operations• Meat product operations• Convenience food operations• Poultry operations
15

“Atria Finland is well-placed to continue to grow more rapidly than the market as a whole. The lowering of VAT on food in the autumn of 2009 will increase demand for food products represented by Atria, and our entire operating chain is ready to meet this demand. Cost pressures represent a major challenge, though, and we will improve our cost-efficiency further to increase profitability and to prepare for a possible recession in the food industry, too.”
Juha GröhnDeputy CEOExecutive Vice President, Atria Finland and BalticDirector, Primary Production
of just under 7 percent. The 8 percent growth of sausages was also markedly better than the market growth of just under 5 percent.
In the market for consumer-packed meat, the sales of products sold under the Atria brand grew vigorously, but the sales of private labels manufactured by Atria fell short of expectations.
In the convenience food market, Atria’s growth of slightly over 10 percent was nearly on a par with average mar-ket growth. Meanwhile, sales growth in consumer-packed poultry products was far below the market growth of approxi- mately 10 percent.
poultry more popular than beef The consumption of poultry products exceeded that of beef for the first time in Finland. Poultry consumption per capita was 18.5 kilos and beef con-sumption 18.2 kilos. Beef demand was restrained by the dramatic rise in retail prices. The price level increased par-
ticularly as a result of reduced supply due to EU import restrictions and the higher costs of primary production.
Pork consumption per capita grew by 1.8 percent to 35.6 kilos. The growth of Atria’s pork processing vol-ume far exceeded total growth, com-ing in at approximately 15 percent. The processing volume amounted to 95 million kilos. The volume was boosted by the acquisition of Liha-Pouttu Oy’s operations in particular. Atria Finland strengthened its position as the coun-try’s leading pork producer with a mar-ket share of about 44 percent.
successful seasonal salesSales and profitability developed posi-tively during the barbecue season, which is important for Atria’s growth.
During the barbecue season, Atria strengthened its market leadership, and the market share of all of its prod-uct groups was around 27 percent be-tween May and July.
Especially during the high season, Atria’s growth was driven by success-ful, consumer-oriented productisation as well as enhanced marketing. Ex-cellent management of Atria’s order-delivery process created a major com-petitive advantage during the busy season as well.
exceeding market growthIn line with its strategy, Atria Finland’s goal for 2009 is to exceed average market growth. The main challenge in terms of profitability is reaching a bal-ance between production costs and the sales prices.
Atria Finland is well-placed op-erationally for profitable growth. Its production and delivery capacity have increased considerably through investments, and operational cost-efficiency was enhanced further as a result of the efficiency improvement programme implemented in 2008.
A t r i A F i n l A n d
16

100
80
60
40
20
0
250
200
150
100
50
0
65 68 74 83 95
33 33 34 364529 30 30 3430
1 000
800
600
400
200
02005 2006 2007 2008 2004 2005 2006 2007 2008
2004 2005 2006 2007 2008 2004 2005 2006 2007 2008
260240220200180160140120100
750
600
450
300
150
02004 2005 2006 2007 2008
33,8 33,5 34,3 34,9 35,6
19,0 18,6 18,5 18,7 18,2
15,9 16,1 15,7 17,6 18,5
At r i A F i n l A n d
share in Group net sales
Key figures 2008
Atria Finland ....... 58 %Rest of Group ...... 42 %
Meat consumption in Finland per capita, 2004-2008
Meat volumes processedby Atria in Finland
kg
Mill. kg
net sales
EUR mill.
Poultry
Poultry
Beef
Beef
Pork
Pork
Source: TNS Gallup, 2008Source: Ministry of agriculture and forestry, 2008
2008 2007
Net sales, EUR million 797.9 749.6
EBIT, EUR million 33.9 43.2
Operative EBIT, EUR million 34.4 43.2
Operative EBIT, % 4.3 5,8
Personnel, average 2,378 2,394
BeefPorkPoultry
producer prices of beef, pork and poultry in Finland
overall production and consumption of meat in Finland
ProductionConsumption
Source: TNS Gallup, 2008
Mill. kgEUR 100 kg
17

A t r i A s c A n d i n A v i A
18

Atria Scandinavia’s profitability fluctu-ated widely over the course of 2008. In the first half of the year, earnings devel-oped better than the previous year, but towards the end of the year, profitabil-ity declined rapidly and the results fell far short of the year before. The growth of sales also weakened in late 2008.
Due to the falling value of the Swedish krona, Atria Scandinavia’s net sales in euros decreased by 0.6 per-cent to EUR 455 million. Net sales in krona increased by 3.9 percent over the previous year. Net sales were up due to the organic growth of Atria brands and the acquisition of the Swedish Ridderheims Delikatesser. The company was merged into Atria in early July1).
Atria Scandinavia’s operative EBIT decreased by EUR 5.1 million to EUR 15.4 million. The results were weighed down particularly by the sharp rise in raw material costs, the weakening of the Swedish krona and the loss-making salad and sandwich operations.
total market growth slowedThe steady growth of Swedish con- sumer goods retail trade, which had con-tinued for years, declined to zero. The growth of demand in the Foodservice-sector also slowed to an annual growth rate of approximately two percent.
Atria Scandinavia uses a consider-able amount of imported raw mater- ials in production. In Sweden, the rise in international raw material prices was boosted by the weakening of the krona particularly towards the end of the year. Together, these resulted in an increase of over EUR 20 million in Atria Scan-dinavia’s costs. A substantial proportion of this rise could be compensated by in-creasing sales prices and implementing an operational efficiency improvement
Strengthened market share, profitability weakened
y e A r 2 0 0 8
• Net sales decreased by 0.6 percent to EUR 455 million
• Operative EBIT fell by 24.9 percent to EUR 15.4 million
• Atria acquired Ridderheims Delikatesser AB
• The integration of Sardus AB was completed
• Salad and sandwich operations were rationalised
• Investments into strategic product groups and brands were increased
At r i A s c A n d i n A v i A K e y c o M pA n i e s
A t r i a r e t a i l A b• consumer packed meat, meat
products and convenience foodA t r i a F o o d s e r v i c e A b• meat products and convenience food
for foodservice sectorA t r i a c o n c e p t A b• Sibylla fast food concept Falbygdens ostnederlag Ab• premium cheeseridderheims delikatesser Ab• fresh delicatessen products3 - s t j e r n e t A/s , d e n m a r k• cold cuts
At r i A s c A n d i n A v i A’ s o p e r At i o n s b y c u s t o M e r G r o u p
• Retail customers (cold cuts, meat products, pastries and convenience food for consumer goods retail trade)
• Foodservice customers (meat products and convenience foods for the HoReCa sector)
• Concept customers (Sibylla fast food concept for franchise entrepreneurs)
• Deli customers (delicatessen products, e.g., beer sausages, special cuts, canned foods and premium cheese for consumer goods retail trade and the foodservice market
• Denmark customers (cold cuts for consumer goods retail trade particularly in Denmark)
programme, but this was not enough to achieve the targeted results.
The sales of Atria Scandinavia’s product groups were up, although the economic downturn began to have some effect on sales volumes in the lat-ter half of the year. The effect was most pronounced in the category of delica-tessen products, whose sales declined. The rise in raw material costs could be best compensated at Atria Denmark, whose sales were growing strongly at the end of the second half of the year.
Market position strengthenedAtria Scandinavia’s market position has strengthened considerably in recent years. As a result of the acquisitions of Sardus in 2007 and Ridderheims De-likatesser in 2008, Atria is the market leader or the second largest player in its strategic product groups.
In cold cuts, Atria ranks second in both Sweden and Denmark. In con-venience foods, Atria is the market leader in several sub-categories, such as ready-made sandwiches and salads. The position of the convenience foods product category is reinforced by the Sibylla brand particularly in Sweden. In delicatessen products, Atria’s po-sition was strengthened due to the Ridderheims acquisition, and it is the largest player in this product group in Sweden. Atria is Sweden’s second largest player in sausages, and it has a solid position as a supplier of private label products.
Atria Scandinavia stepped up its brand investments. The packaging overhauls of pastries and cold cuts, among others, were a success. Among individual brands, the strongest were Falbygdens Ost, Arboga, Lönneberga and Sibylla. Innovation, which plays a key role in the company’s growth strategy, was also stimulated in a range of value-added products.
1) A presentation of the company can be found on page 8.
19

“A strong market position will enable the growth and development of Atria Scandinavia even in a challenging economic climate. With our broad selection of brands and product groups, we can target consumer demand in our sector, where economic trends play a much smaller role than in many other industries. In 2009, Atria Scandinavia will focus on increasing cost-efficiency. We seek profitable growth through the success of significant launches. If we also manage to constantly deepen our customer and consumer relationships, our vision of being the most interesting food industry company in Scandinavia will become a reality.”
Christer ÅbergExecutive Vice President, Atria Scandinavia
Director, Concept & Deli
significant reorganisations The acquisition of Ridderheims De-likatesser supports Atria Scandinavia’s strategic growth target in product groups with a high degree of process-ing. Following this acquisition, Atria reorganised its fresh delicatessen product groups with the aim of cre-ating the most extensive and versa-tile selection in the Nordic countries. Delicatessen products form one of the fastest growing segments in consumer goods retail trade.
Atria Scandinavia also restructured its other operations, an example of which is the integration of two distinct food service operations into one en-tity. Atria Scandinavia’s operations are now organised into five businesses
supported by shared administration and purchasing units.
The reorganisations were partly connected to the Sardus acquisition completed in 2007, as the ensuing in-tegration process was now brought to an end.
Atria Scandinavia targeted the most significant efficiency improve-ment measures to the salad and sand-wich operations. The Halmstad plant that manufactured these products was closed, and all production was con-centrated in the Norrköping plant.
investments in efficiency and brandsIn 2009, Atria Scandinavia will con-tinue its efficiency improvement pro-
grammes aimed at restoring profitabil-ity to the targeted level. The measures will be applied to all of the company’s operations. As a result of these meas-ures, the number of the company’s production sites will decrease further. The company also carried out major rationalisation measures in several of its production units in 2008.
To secure growth, Atria Scandina-via will concentrate investments in its brands and new product concepts. The company will, for example, continue to launch new cold cuts and bring to the market a new product concept bearing the Ridderheims brand.
A t r i A s c A n d i n A v i A
20

500
400
300
200
100
0
21
2005 2006 2007 2008
750
600
450
300
150
02005 2006 2007 2008
At r i A s c A n d i n A v i A
share in Group net sales
Atria Scandinavia .... 33 %Rest of Group .......... 67 %
net sales
EUR mill.
Key figures 2008
2008 2007
Net sales, EUR million 455.2 457.8
EBIT, EUR million 14.4 54.9
Operative EBIT, EUR million 15.4 20.5
Operative EBIT, % 3.4 4.5
Personnel, average 1,691 1,768
Atria scandinavia's core product groups 2008
volumeAnnual market
growthMarkets share
(incl. private labels)Market position
Cold cuts, Sweden -2 % +4 % 15 % 2
Liver pâtés, Sweden -2 % +3 % 65 % 1
Cold cuts, Denmark +/- 0 % +2 % 13 % 2
Convenience food +4 % +10 % 10 % 2
Delicacies (premium cheese) -2 % +1 % 30 % 1
Fast food/Sibylla +7 % 11 % 3
Consumer packed meat +17 % +17 % 10 % 2
Sausages +/-0 % +5 % 20 % 2
Sources: Nielsen 2008, GFK 2008, HUI 2008, Delfi 2008
overall production and consumption of meat in sweden
ProductionConsumption
Source: TNS Gallup, 2008
Mill. kg

A t r i A r u s s i A
22

Atria Russia experienced significant growth in 2008, boosted primarily by the acquisition of the Russian meat processing company OOO Campo-mos. The profitability of the oper- ations was unsatisfactory, however, and since the acquired company was loss-making, Atria Russia’s overall result also showed a loss.
Atria Russia’s sales developed fa-vourably, with net sales increasing by 43 percent to EUR 94 million. Of this, approximately one-fifth was gener- ated by Campomos, which was merged into Atria in late 2008. The sales of Atria’s Russian subsidiary Pit-Product even exceeded expectations. Its sales grew vigorously particularly in the lat-ter half of the year. This, along with improved prices, increased net sales.
Pit-Product strengthened the mar-ket leadership of its product groups in St. Petersburg’s modern consumer goods retail trade. In terms of value, the market share of the Pit-Product brand climbed as much as 31 per-cent. At the end of the previous year, the share had declined to 21 percent due to unhealthy price competition. The greatest improvement took place in the market share of cold cuts as a result of heavy investments made by the company in the product develop-ment and marketing of this strategic product group. The Campomos brand achieved a market share of 7 percent in St. Petersburg1).
The earnings of Pit-Product were in the black, but profitability remained lower than expected due to a signifi-cant increase in meat raw material prices. Raw material prices rose more quickly and sharply than the sales prices of end products. The com-pany acquired nearly all of its meat raw material from the global markets. The sudden weakening of the rouble
and higher import duties undermined further the company’s profit-making ability.
The profitability of Campomos, which was consolidated into Atria in the last quarter was poor, and the company was loss-making. In the company’s main market Moscow, the market share of the Campomos brand, measured in value, remained at the previous year’s level.
enhanced logistics in st. petersburgAtria Russia continued its investment programme of approximately EUR 70 million to build a new meat product plant and logistics centre in Gorelovo, St. Petersburg region. The logistics centre was opened in October, and all deliveries from warehouses located in downtown St. Petersburg were trans-ferred to the new centre. Significant improvements were achieved in the efficiency of delivery and other logis-tics operations in the St. Petersburg area.
The opening of the meat product plant next to the logistics centre was postponed to 2009 due to delayed completion of the water and drain connection. This delay weakened Atria Russia’s growth prospects in the St. Petersburg area.
The capacity and cost-efficiency of the plant located in Sinyavino, Lenin-grad oblast rose as planned as a result of an investment programme launched in the previous year. Additional invest-ments were made at the plant towards the end of the year to increase dried sausage capacity.
integration set in motion Immediately after the Campomos acquisition, Atria Russia initiated a programme aimed at maximising syn-ergies between Campomos and Pit-
Growth picked up, profitability weaky e A r 2 0 0 8
• Net sales grew significantly to EUR 93.8 million
• The company posted a loss as a result of the Campomos acquisition
• Due to the acquisition, Atria Russia gained a firm foothold in the Moscow area as well and in other major cities in European parts of Russia
• The integration of Pit-Product and Campomos was initiated
• A new logistics centre was opened in St. Petersburg
AtriA russiA coMpAnies
o o o p i t - p r o d u c t• Headquartered in St. Petersburg• The company develops,
manufactures and markets mainly meat products, particularly sausages and cold cuts
• The company’s meat processing plant is located in Sinyavino, Leningrad oblast. The new production plant (as of 2009) and the adjacent logistics centre are located in Gorelovo, Leningrad oblast
o o o c a m p o m o s• Headquartered in Moscow• The company develops,
manufactures and markets mainly meat products, cold cuts and pizzas
• The company’s production plant and logistics centre are located in Moscow, the distribution terminal in St. Petersburg. The company’s primary production (pork breeding facility) is situated in the Moscow region.
More detailed presentation of OOO Campomos can be found on page 8.
1) Source: AC Nielsen, 2007/2008, unless otherwise indicated
23

“Our operations in Russia have expanded considerably as a result of the Campomos acquisition. In 2009, our net sales will increase clearly. To enhance our profitability, we will focus on improving the cost-efficiency of Campomos and exploiting rapidly the synergies between Campomos and Pit-Product. Our strengthened position in the Moscow and St. Petersburg areas will create good conditions for profitable growth.”
Juha RuoholaExecutive Vice President, Atria Russia
Director, Procurement and Investments
A t r i A r u s s i A
Product as well as improving the prof-itability of Campomos. The integration of the organisations began by merging their purchasing and financial admin-istration operations.
The aim of Atria Russia is to im-prove the profitability of Campomos and take the company from the red to the black during 2010. This means that the company’s position in the consumer goods retail trade must be strengthened in Moscow and St. Pe-tersburg and other major cities in the European part of Russia. Other means to enhance profitability include in-creasing cost-efficiency, reducing costs and rationalising primary production.
slower growth in demandThe growth of consumer spending slowed in Russia, which also affected the overall demand for products represented by Atria. Annual growth measured in value dropped from over 10 percent to around 7 percent.
The slowing of growth tightened competition between meat processing companies and increased the negoti-ating power of consumer goods retail-ers. In meat product retailing, a slight change occurred towards more af-fordable meat products. Overall in the food market, the western trend was further strengthened in purchasing and consuming habits, emphasising the ease and convenience of eating.
No major integration took place in the industry apart from the acquisition made by Atria. The consolidation of Russian meat processing companies is still in its early stages. However, the inte- rest of international players towards the Russian market increased.
More capacity, major synergiesIn 2009, Atria Russia’s growth will be driven by the newly acquired Campo-mos as well as Pit-Product’s rapidly increasing production capacity. The new Gorelovo plant will more than
double Pit-Product’s capacity to pro-duce meat products. The investments made in the Sinyavino plant will also lift production volumes.
The improvement of Atria Rus-sia’s profit level is based on enhanc-ing the profitability of Campomos and succeeding in the integration of Campomos and Pit-Product. The syn-ergies created by the integration are substantial. Initially, the greatest ben-efits will come from logistics oper- ations, purchasing, administrative and raw material acquisition related op-erations, as well as marketing oper- ations. Long-term benefits have to do with the distribution channel and indi-vidual accounts in particular. Campo-farm's primary production will be in full swing as of the beginning of 2009, which will improve competitiveness and risk management in raw material procurement as well as create oppor-tunities for marketing fresh meat.
24

100
80
60
40
20
0
25
20
15
10
5
0
50
40
30
20
10
02007 2008* 2009* 2010*
25
2005 2006 2007 2008
At r i A r u s s i A
net sales share in Group net sales
Atria Russia ........... 7 %Rest of Group ...... 93 %
EUR mill.
2008 2007
Net sales, EUR million 93.8 65.6
EBIT, EUR million -3.4 4.3
Operative EBIT, EUR million -3.4 4.3
Operative EBIT, % -3.6 6.5
Personnel, average 1,525 1,278
Key figures 2008
consumption of meat in russia 2007
kg/person
Source: RosCom Stat, 2008
development of consumption of meat products (sausages)
St. PetersburgMoscow
* prognosis
Source: RosCom Stat, 2008
kg/person
Russia
BeefPorkPoultry

A t r i A b A l t i c
Atria made two acquisitions in the Baltic business area, which strength-ened its position in the Estonian mar-ket considerably. The acquisitions of the meat processing companies AS Wõro Kommerts and AS Vastse-Kuuste Lihatööstus, completed in the sum-mer, increased Atria’s share of the meat products market in particular. As a result of these deals, Atria Baltic be-came the second largest player in the Estonian meat processing market.
Following the acquisitions, Atria Baltic’s net sales rose by 21.0 percent to EUR 32.3 million. The growth in the sales of both the new companies and AS Valga Lihatööstus was close to ex-pectations, and all of the three com-
Atria becomes the second largest player in the market
panies reinforced their market shares. The aggregate market share of the product groups represented by these companies, measured in value, was 22 percent in Estonia. In individual prod-uct groups, the share was even higher. In cold cuts, the market share was 23 percent and in sausages as high as 31 percent1).
Unlike the sales, Atria Baltic’s prof-itability did not develop as expected. The companys operative result posted a loss of EUR -3.8 million. Particu-larly in the first part of the year, per-formance was weakened by the poor profitability of Valga Lihatööstus. The company is engaged in significant pri-mary production, whose costs rose
sharply due to increased feed prices. The profitability of the acquired com-panies was better than that of Valga, though not satisfactory.
The retail prices of the product groups represented by Atria Baltic rose by 5 to 10 percent in the Esto-nian consumer goods retail trade. The price increases were, however, not enough to compensate the rise in the costs of primary production and meat processing operations. The weaken-ing outlook for the Estonian economy reduced consumer demand slightly towards the end of the year.
1) Source: AC Nielsen, 2007/2008, unless otherwise indicated
26

50
40
30
20
10
02005 2006 2007 2008
At r i A b A lt i c
At r i A b A lt i c co M pA n i e s
A s va l g a l i h a t ö ö s t u s• The company’s main products are
meat, sausages and cold cuts • A meat processing plant in Valga in
South-West Estonia and six farms mainly in Central Estonia
A s wõ r o K o m m e r t s• The company’s main products are
sausages and meat products • A production plant in Ahja, close to
Tartu, and a distribution centre in Tartu
A s va s t s e - K u u s t e l i h a t ö ö s t u s• The company’s main products are
cold cuts, sausages and consumer-packed meat
• A production plant in Vastse-Kuuste in southern Estonia
More detailed presentations of Wõro Kommerts and Vastse-Kuuste Lihatööstus can be found on page 8.
net sales share in Group net sales
Atria Baltic ............ 2 %Rest of Group ...... 98 %
2008 2007
Net sales, EUR million 32.3 26.7
EBIT, EUR million -3.8 -4.4
Operative EBIT, EUR million -3.8 -3.1
Operative EBIT, % -11.8 -11.6
Average personnel 541 507
Key figures 2008
EUR mill.
y e A r 2 0 0 8
• As a result the completed acquisi-tions, net sales grew substantially to EUR 32.2 million
• The company posted a loss of EUR -3.8 million
• The integration of the new compa-nies into Atria was initiated
• Investments in primary production continued
increased efficiency The integration of the acquired com-panies into Atria Baltic progressed as planned. The Estonian management was reorganised and the streamlining of operations began with the transfer of the slaughtering and meat cutting op-erations of Vastse-Kuuste to Atria’s Valga plant. The slaughterhouse in Valga was modernised completely in 2002.
Atria Baltic continued its approxi-mately EUR 8 million investment pro-gramme launched during the previous year. The majority of the investments were directed at ensuring raw material procurement and quality in primary production. Another aim was to in-crease the capacity and cost-efficiency of the Valga plant.
improved conditions for growthThe completed acquisitions create good conditions for Atria Baltic’s
profitable growth in Estonia and more widely in the Baltic region in 2009. The company’s own meat production and slaughtering operations also se-cure competitiveness when the meat market is unstable. Atria’s production capacity has increased markedly. The cost-efficiency of production and all operations can be improved by, for example, specifying the distribution of work between plants and harmon- ising logistic systems. The integra-tion of operations will lead to cost savings of approximately EUR 2 mil-lion in 2009.
The acquisitions also enhanced the opportunities of Atria Baltic’s product development and marketing consider-ably. Atria is now able to offer a wide range of well-known brands for retail-ers. In product group and brand de-velopment, Atria Baltic makes use of Atria’s Group-level brand expertise.
27

28 good food
MEGATRENDS
28

good food 29
E ase &convenience
Consumers value ease and convenience, especially on weekdays. Individuality is increasingly common
in family dining, with meals consisting of many different dishes depending on the likes of eaters. This poses a challenge to the food
industry: the demand for small raw material packages will increase and the purchasing
threshold for economic package sizes will become lower.
29

c o r p o r A t e r e s p o n s i b i l i t y p r i n c i p l e s
Atria’s corporate responsibilityCorporate responsibility is an integral part of Atria’s corpo-rate culture, and the company recognises its responsibility towards all of its stakeholders. Atria integrates corporate re-sponsibility into all levels of its operations: targets, values, business strategies, management and everyday work.
Atria secures its current and future operating condi-tions through responsible operations. In accordance with the principles of sustainable development, Atria takes into account economic, social and environmental aspects in all of its business areas. Atria sees the satisfaction and trust of consumers and customers as the key precondi-tions for its business and success. Also the profitability
and competitiveness of its business operations, responsi-ble management, the competence, commitment and avail-ability of personnel as well as the continuous improve-ment of operations in all level are the key preconditions for its sustainable business.
Atria’s corporate responsibility is encapsulated in its mission “Good food – better mood”. For Atria, the concept of good food covers the entire food chain from primary production to the table of consumers. Atria’s good food is produced in a responsible and ethical manner; it is of high quality and safe. Good food leads to a better mood, safety and added value to all of Atria’s stakeholders.
scope of principlesGeneral principles for Atria’s corporate responsibility cover all of the Group companies in the various business areas. The Atria Group Management Team has approved and con-firmed these principles in its meeting on 22.1.2009.
In applying the general principles for corporate respon-sibility in its various business areas, Atria complies with good practice while respecting the different views of its stakeholders on responsibility and ethical operations. These cannot, however, be in conflict with local or international legislation, Group management principles or Atria’s values or ethical principles.
Management of corporate responsibilityAtria’s corporate responsibility team which has members from every business area (Atria’s CR-team) is responsible for monitoring and developing Atria’s corporate responsibility. The Group is led by the Vice President of the Group’s en-vironmental and quality affairs, who reports to the Group Management Team on the objectives and results of Atria’s corporate responsibility.
responsible communication Transparency and openness of operations are an integral part of Atria’s corporate responsibility. Accordingly, Atria communicates on its corporate responsibility to its internal and external stakeholders in an open, comprehensive and
systematic manner. Corporate Communications coordinates and is responsible for the communication.
In order to ensure the provision of essential and com-prehensive information to its stakeholders, Atria develops and diversifies its reporting on the principles, objectives and results of its corporate responsibility. As the basis for the reporting, Atria uses the international Global Reporting Initiative (GRI) guidelines, in which corporate responsibil-ity is viewed from the angles of economic, social and envi-ronmental responsibility according to a three-pillar model. The report is published annually in a condensed form as part of the Annual Report and as a separate electronic publication.
Atria and stakeholdersAtria’s corporate responsibility is embodied in its day-to-day work with stakeholders. Atria defines its key stakeholder groups on the basis of its business strategy.
Atria's main stakeholders areconsumers•customers•personnel•subcontractractors and partners•shareholders and investors•authorities•local communities and educational institutes•media•
30

AtriA’s FinAnciAl responsibility
Byfinancialresponsibility,Atriarefersto meeting its financial targets in such a way that it can generate long-term financial added value to its owners and other stakeholders and increase the wellbeingofthesurroundingcommu-nitiesandsociety.Inordertoreachitsfinancial targets, Atria’s operations are requiredtobesufficientlyprofitable,competitiveandefficient.Theymustalso have a business risk manage-ment system in place.
At Atria, financial responsibility also means complying with healthy and responsible business practices. Corporateresponsibilityissubjecttonationallegislation,theInternationalFinancial Reporting Standards as well astheCorporateGovernancerecom-mendationsforlistedcompanies.
Sufficientprofitabilityandefficiencycreatethepreconditionsforbearingsocial and environmental responsibil-ity. Atria’s view is that social and en-vironmental responsibility also works intheotherdirection,i.e.,asfactorsstrengthening financial responsibility.
AtriA’s sociAl responsibility
ThecompetenceandwellbeingofpersonnelformthemostcentraldimensionofAtria’ssocialrespon-sibility.Onthemrestthequalityofallofthecompany’soperationsandproducts.Thewellbeingofperson-nelisalsoakeyfactorwithregardtoAtria'ssustainablegrowth.Onlysatisfied personnel create a working atmosphere and employer image that make it possible to recruit competent and motivated personnel.
At Atria, social responsibility also covers complying with and, where possible, exceeding, national and international regulations concerning productsafetyandresponsibilityaswell as consumer protection, such as product markings and marketing com-munications.
Atriausesitspositioninthefoodchaininaresponsiblemanner.Itonlydeals with such primary producers and subcontractors, customers and other business partners that are known to be trustworthy and honest. Atriafavourspartnersthat,inadditiontopriceandqualityarguments,areable to demonstrate that they operate in accordance with ethically acceptable practices.
AtriA’s environMentAl responsibility
Atria’s environmental responsibil-ityconsistsofthreemainelements:taking the ecologic environment into account at all operational levels, recognising indirect environmental impactsinthedifferentstagesoftheoperating chain and reducing direct environmental impacts in everyday work.Byfocussingonthebalancedcontrolandmanagementoftheseelements, Atria generates substantial added value to its business operations as well as to its stakeholders and the environment.
At its most extensive, Atria views its environmental responsibility as cover-ingtheentirefoodchain.Itreachesthroughouttheoperatingchain,fromprimaryproductionandacquisitionofrawmaterialstothemanufacture,consumption,recyclinganddisposalofproducts.Inadditiontoenvironmentalprotection, emphasis is also on pre-ventingenvironmentalandhealthhaz-ards and paying attention to consumer andpersonnelsafety.Toacertainextent, environmental responsibility also includes the operating practices ofthesuppliersofrawmaterialsandother subcontractors as well as the wellbeingofanimalsatfarmsandduring transport.
Inreducingdirectenvironmentalimpacts, Atria’s key considerations are the pollution load on water systems, raw material and product wastage, the environmentalpropertiesofpack- aging,theenvironmentalimpactoftransport as well as energy and water consumption.
Atria's corporate responsibility perspectives
31

c o r p o r A t e r e s p o n s i b i l i t y e n v i r o n M e n t
The well-being of the environment is essential to Atria’s and the entire food industry’s operations. One of the key elements of Atria’s environmental responsibility is taking into consid-eration the natural environment at all levels of operations. What this means in practice is identifying all of the in-direct environmental impacts of the operating chain and controlling and reducing the direct environmental im-pacts of operations.
The role of Atria’s environmental responsibility, as well as its adminis-tration and management practices re-lated to environmental matters, vary depending on the business area. Ow-
ing to the numerous acquisitions car-ried out in recent years, practices also differ between units and companies belonging to the same business area. The most uniform administration and management practices are those of Atria Finland, which has made envi-ronmental responsibility a part of its comprehensive quality, environment and product safety management. Atria Finland’s environmental management is based on an environmental system that complies with ISO 14001. In other business areas the company strives to achieve a corresponding level, taking into consideration national regulations and procedures.
Atria audits its material and service suppliers also in terms of environmen-tal issues. Among other things, suppli-ers are expected to have identified and recorded any significant environ-mental aspects, and the measurement results required by environmental per-mit regulations must be available for verification during auditing. Suppliers are also expected to do waste sorting and recycling and to properly handle hazardous waste.
Comprehensive quality, environment and product safety management
environMentAl MAnAGeMent throuGh networKinGAccording to its environmental vision, Atria is an efficient expert in environ-mental matters, with environmental management supporting business and sustainable development. Atria’s en-vironmental management strategy is based on networking, in line with the company’s values. By networking with other players Atria can develop the best environmental management practices to support continuous improvement. Management is based on an environ-mental system certified in compliance with the ISO 14001 standard.
Atria’s environmental management is handled by a steering group, which works under the management team and is in charge of planning and mo-nitoring environmental management. The steering group has representati-ves from procurement, production, product development, packaging
design and energy production. The composition of the group ensures that management encompasses all of the areas in which Atria can control envi-ronmental impacts. The group distri-butes its annual work in the following way: at the first meeting it analyses the results achieved in the previous year, at the following meeting it plans the required investments and at the end of the year it sets the targets for the following period.
hArMonisAtion oF product sAFety proceduresThe safety and microbiological quality of Atria’s products are based on self-monitoring plans that are approved by the authorities and cover raw materi-als, production processes and delivery chains. The plans are based on risk management according to the HACCP (Hazard Analysis and Critical Control Point) system. Through authority ap-
proval and regular audits, Atria en-sures that the plans correspond to the latest legislation and product safety standards in the industry, as well as to the requirements of international trade.
The Group has an extensive Safe Atria Quality programme, which cov-ers product safety, health, ease of use and environmental impact throughout the life cycle of products. With the programme Atria aims to harmonise its product safety procedures in all business areas. A concrete goal is to develop product safety guidelines that apply to all of Atria’s business areas and with which each unit can further develop its own safety procedures that follow national regulations and standards.
Atria’s goal is to become one of the leading companies in its sector as regards product safety competence and quality development.
32

1) Written GOST R-sertificate is a guarantee for that the product fulfills Russian security standards.
AtriA's QuAlity And environMent systeMs
business area Quality environment production plant
AtriA FiNLAND
ISO/IEC 17025:2005 (Laboratory accreditation) Nurmo, Kuopio, Kauhajoki
SFS-EN ISO 9001:2000 Nurmo, Forssa, Kuopio, Kauhajoki, Karkkila
SFS-EN ISO 14001:2004 Nurmo, Kuopio, Kauhajoki, Karkkila
USDA - approval for pork meat export to USA Nurmo
Air quality control, Finland's environmental administration: Seinäjoki and Kuopio area quality control, bio-indicator research
Seinäjoki, Kuopio
AtriA BALtic
ISO 22000:2005 Wõro Kommerts
ISO 9001:2000 Valga
ISO/IEC 17025:2005 (Laboratory accreditation) Valga
AtriA ruSSiA
ISO 9001:2000 Campomos
GOST R 51705.1-2001 and Regulation (EC) Nr. 852/2004 of the European parliament and the council of 29 April 2004 on the hygiene of foodstuffs.1)
Pit-Product
AtriA ScANDiNAviA
ISO 14001:2004 Sköllersta
BRC Global Standard - Food (Issue4:January 2005) Grade A
Stockholm, Tranås, Kinna, Moheda, Borås, Sköllersta, Malmö, Göteborg
Organic Production according to Council Regulation (EEC) 2092/91
Tranås, Moheda, Borås, Kinna, Falköping, Göteborg
The IKEA Way on Purchasing Food (IWAY) Borås, Falköping
BRC Global Standard - Food (Issue4:January 2005) Grade B Halmstad
BRC Global Standard for Food Safety (Issue5:January 2008) Grade A Falköping, Horsens, Norrköping
DS/EN ISO 9001:2000 Horsens, Denmark
33

c o r p o r A t e r e s p o n s i b i l i t y e n v i r o n M e n t
Good results in the proGrAMMe period Atria has identified the environmental impact and aspects caused by its op-erations, products and services. These vary depending on the business area. The key issues in all areas are energy consumption, water consumption, ox-ygen consumption caused by waste-water, as well as municipal waste. Key environmental indicators include en-ergy and water consumption, as well as the amount of landfill waste and packaging material per product tonne produced.
Atria Finland’s three-year pro-gramme period concluded in 2008. It had six environmental targets:
to reduce the consumption of •energy and natural resourcesto reduce the amount of waste and •the load caused by wastewater, to improve waste sorting and to explore new waste utilisation methodsto ensure the safety of •environmentally harmful substances during useto increase the environmental •awareness of employees and partnersto understand the environmental •impacts of primary productionto recognise the environmental •impacts of deliveries.Numerical environmental targets
for the three-year period included re-ducing water and energy consumption, as well as landfill waste, by two per-cent. The use of thermal energy was to be enhanced by two percent and heat recovery by ten percent. One of the target indicators was the BOD
7 fig-
ure, which indicates the organic load of wastewater. Its value was to comply with the environmental permit.
Atria Finland met its key environ-mental targets very well, as shown by the graphs on the facing page.
Pollution load on water systemBiological oxygen demand indicates the rate at which wastewater uses up oxygen in a body of water. The quality of wastewater was kept under good control and the levels of oxygen consumption remained clearly under target limits.
Amount of municipal wasteMunicipal waste is unsorted landfill waste. The amount of municipal waste exceeded target limits due to stricter quality requirements for waste used in waste-to-energy processes. The volumes of plastic waste taken to the landfill in-creased because the material was not sufficiently pure for energy production.
Electricity consumptionThe relative consumption of electri-cal energy has been reduced by some five percent over the past three years. This positive development has been achieved by efficient production con-trol and higher utilisation of capacity.
Water consumptionWater is used abundantly, for example, in the cooling and washing of cooking sausages. The processes remained un-der the target limits, and the efficiency of water use has been improved by some 15 percent in three years.
Heat recoveryHeat recovery takes place in conjunc-tion with the cooling process and during heat-generating production processes. The target limit was not achieved, because new recovery ele-ments could not be introduced.
Heat energy consumptionThe use of heat energy has been en-hanced by more than 12 percent in the programme period. The main fac-tor contributing to this is the enhanced energy efficiency in pig slaughtering achieved through a higher capacity utilisation rate.
AtriA FinlAnd’s environMentAl orientAtion 2009 –2011
Control of energy consumption•Control of water consumption•Control of wastewater values•Control of municipal waste•Control of the amount of •packaging materials
AtriA FinlAnd’s environMentAl tArGets 2009 –2011
Control of energy consumption: •reduction in accordance with the energy efficiency agreement (-9% by 2016)Control of water consumption: •reduction of consumption (-1% by 2011)Control of wastewater values in •compliance with environmental permit regulationsControl of municipal waste; •systematic increase in the share of energy waste through enchanced sorting at the point of originControl of the amount of •packaging materials means making the assessment of environmental impacts an inherent part of innovations and next-generation product development projects
34

2004 2005 2006 2007 2008 2004 2005 2006 2007 2008
2004 2005 2006 2007 20082004 2005 2006 2007 2008
2004 2005 2006 2007 2008
The graphic descriptors and chart data on this page only apply to Atria Finland Ltd’s production plants. Atria Group’s environmental aspects are presented in the financial statements on page 50.
2 0 0 7
electricity consumption
MWh / product tonne
water consumption
m3/product tonne
Municipal solid waste
kg / product tonne
packaging materials
tonnes / product tonne
wastewater load bhK, kg
kg / product tonne
RealisedObjective
RealisedObjective
RealisedObjective
Realised
RealisedThe objective varies accord-ing to the environmental permit regulations for the locations
Environmental indicators in relation to turnover 2008 2007 2006 2005 2004
Electricity consumption, MWh/EUR 1,000 0.18 0.18 0.23 0.24 0.24
Water consumption, m3/ EUR 1,000 2.04 2.03 2.90 3.09 2.90
Landfill waste, kg/EUR 1,000 3.73 3.65 3.98 4.10 3.97
Packaging materials, tonne/EUR 1,000 0.017 0.016 0.014 0.012 0.011
Wastewater load BHK7 kg/EUR 1,000 1.54 1.81 2.14 2.45 3.23
ecoefficiency
0.5
0.4
0.3
0.2
0.1
0
5.0
4.0
3.0
2.0
1.0
0
15
12
9
6
3
0
0.020
0.016
0.012
0.008
0.004
0
5.0
4.0
3.0
2.0
1.0
0
e n v i r o n M e n t
Atria Finland
35

c o r p o r A t e r e s p o n s i b i l i t y s o c i A l r e s p o n s i b i l i t y
The execution of Atria’s growth strat-egy is supported by efficient person-nel planning, well-designed and timely recruitment, systematic talent develop-ment and a successful performance management system. Atria's Group-level HR strategy ensures a common objective for HR management and uni-form methods to reach this objective in the various business areas. Atria's aim is to be the industry’s employer of choice.
During the autumn 2008, local HR strategies were drawn up for all busi-
Group HR strategy implemented locally
performance evaluation*
Bal
tic
Scan
dina
via
Finl
and
Rus
sia**
%/employee100
80
60
40
20
0
*Only office employees are included in regular performance evaluaations.** Only Pit-Product office employees
ness areas based on their own business strategies and the Group HR strategy. They define concrete operating mod-els for putting business objectives into practice. In addition, clear operational indicators were specified for each coun-try to regularly monitor the success of HR activities. At the Group level, the success of the HR strategy is monitored through business achievements as well as an extensive personnel survey and individual performance reviews.
In 2008, there were two clear fo-cuses in HR activities: supporting the integration of operations and tal-ent development. Significant mergers of ope-rations occurred in nearly all business areas, accompanied by major changes in organisational and person-nel structures.
personnel structure And turnoverThe majority of Atria employees are based in Finland, and Scandinavia and Russia have nearly the same number of employees. Atria Baltic employs roughly eight percent of all the em-ployees within the Group. In 2008, the Group recruited over 4,100 per-sons, and nearly 4,500 employees left
Atria. Turnover is high particularly in Finland and Scandinavia due to the seasonal nature of the operations. Among permanent and clerical em-ployees, turnover is at the target level. In the recruitment of clerical employ-ees, the focus was on key competen-cies required by the company. Internal turnover increased substantially.
tAlent MAnAGeMentThe time frame for talent development was extended and new country-spe-cific projects were launched. Through development programmes, talent recruitment and annual succession planning, Atria strives to ensure su-perior industry expertise in the future as well. The members of the Group’s Management Team participated in sev-eral development programmes aimed at strengthening their strategic man-agement skills. The Group’s top man-agement, Board of Directors and a group of managers attended a course on Russian business practices tailored for Atria. Systematic exit interviews were adopted in 2008. The confiden-tial feedback received can be used to improve the operations further and in-crease employee engagement.
36

20072008
100
80
60
40
20
0
2500
2000
1500
1000
500
0
25
20
15
10
5
0
1200
1000
800
600
400
200
0
2 500
2 000
1 500
1 000
500
0
Men & womenAtria Group's
average number of personnel 6,135
Atria Finland
Atria Finland
Atria Scandinavia
Atria Scandinavia
Not FTE, based on Dec 31, 2008
Atria Russia
Atria Russia / Year 2008 figures includes both Pit-Product and Campomos.
Atria Baltic
Atria Baltic / Year 2008 figures includes Walga, Wõro and Vastse-Kuuste.
Average people
persons
persons
persons
WomenMen
Bal
tic
Bal
tic
Scan
dina
via
Scan
dina
via
Finl
and
Finl
and
Rus
sia
Rus
sia
Atria Finland ............ 39 %Atria Scandinavia ..... 28 %Atria Russia .............. 25 %Atria Baltic .................8 %
Age structure in Atria Group*
service structure
*situation on Dec 31, 2008
*situation on Dec 31, 2008
p e r s o n n e l
unde
r 20
20-2
4
25-2
9
30-3
4
35-3
9
40-4
4
45-4
9
50-5
4
55-5
9
60-6
4
over
65
unde
r 1
year
1–5
year
6–10
yea
r
11–1
5 ye
ar
16–2
0 ye
ar
21–2
5 ye
ar
26–3
0 ye
ar
31–3
5 ye
ar
36–4
0 ye
ar
over
40
year
%
%
Bal
tic
Scan
dina
via
Finl
and
Rus
sia
recruitment
PermanentFixed-team
sickness rate
% of regular working hours
Bal
tic**
Scan
dina
via
Finl
and
Rus
sia*
25
20
15
10
5
0
* Sickness rate 2008 includes Pit-Product & Campomos. 2007 only Pit-Product. ** Sickness rate 2008 inlcudes Valga, Wõroand VK, 2007 figures include also Lithuania.
20072008
37

Atria Finland Atria Finland’s shared competen-cies, management competencies and strategic professional competencies were identified for directors, supervi-sors and experts. All of Atria Finland’s clerical employees filled in a form aimed at assessing their competencies and had a performance review with their supervisor. A talent development system forms the foundation for long-term, business-driven development of the entire company and its personnel. The training offering was improved systematically. Supervisory training designed for foremen and line manag-ers was launched in the autumn.
Atria ScandinaviaPersonnel training focused on system-atic management training related to the working environment and qual-ity. The topics covered in the training, which was mainly organised internal-ly, included hygiene, fire safety, han-dling of chemicals and environmental issues.
Atria RussiaThe most important personnel train-ing projects were the organisation of supervisor training, quality train-ing, cultural training and orientation training for all new employees. The
training days, based on dec 31, 2008 personnel amount information
Management Office Factory Total
2008 2007 2008 2007 2008 2007 2008 2007
Finland) 2,800 3,110 9,680 15,590 12,771
Scandinavia2) 16 40 221 16 800 1,209 1,021 1,265
russia3) 126 161 576 347 308 99 1,010 607
Baltic4) 112 16 234 48 527 29 873 93
1) Year 2007 information not available2) Scandinavia training days for Management include only Top Management team training. Training for other managers is in "Office" 3) Russia training information 2007 includes only Pit-Product information. 4) Baltic training information 2007 includes Lithuania, 2008 information is combined with VK, Wõro and Valga.
Average training days
days/employee
Bal
tic
Scan
dina
via
Finl
and
Rus
sia
6
5
4
3
2
1
0
20072008
performance review process was ex-panded further, and now most of the clerical employees have an annual performance and development review with their supervisor.
Atria BalticPersonnel training focused on per-formance review training for supervi-sors, hygiene training for all employ-ees and the improvement of health and safety at work. The amount of personnel training quadrupled from the previous year.
personnel survey And ActionsAtria conducted a personnel survey for all Group employees in the spring. The purpose of the survey was to
study employees’ views on the or-ganisation's strengths and areas for improvement, how communication works and job satisfaction. More than 4,500 Atria employees responded, and
38

the response rate was 73 percent. The responses reveal that Atria employ-ees regard the company’s goals as important and worth pursuing. They are motivated and engaged. The areas most in need of improvement were working conditions, internal commu-nication and leadership.
Atria FinlandThe results of the personnel survey were discussed with employees, and more than 80 percent of the agreed im-provement actions were implemented in 2008. Key areas for improvement in Atria Finland’s organisation are the development of leadership, long-term strengthening of basic industry skills and rewarding. Leadership is devel-oped by organising annual supervisory training for supervisors as well as a supervisor briefing event four times a year. The training needs of employees have been specified and meeting prac-tices improved.
Atria ScandinaviaThe results of the personnel survey were discussed with all employees. The most important areas for im-provement in Atria Scandinavia were internal communications, leadership and inter-departmental cooperation. To improve these, Atria Scandinavia
will increase internal communications by implementing a special communi-cation plan for employees and launch-ing systematic manager training.
Atria RussiaThe results of the personnel survey were presented to the entire organi-sation at events targeted at employee groups as well as in Atria Russia’s personnel magazine. Based on the re-sults, the heads of departments have created an action plan. The following were identified as areas for improve-ment: Atria Russia’s employer image, inter-departmental cooperation and internal communications.
Atria BalticThe most important areas for im-provement were the working environ-ment, training, inter-departmental co-operation, communication as well as recognition and rewarding. Particular attention was paid to internal com-munications, and monthly department meetings were launched in produc-tion plants.
well-beinG And sAFety At worKSafety at work was given a more prominent role, and a full-time oc-cupational safety manager started at Atria Finland at the beginning of the
year. Atria Russia and Estonia already had full-time occupational safety man-agers. In Atria Scandinavia, sickness absences of employees decreased considerably. In Finland the absences somewhat increased while in other business areas they remained at the previous year’s level.
Systematic orientation training for new employees was initiated in all business areas. The amount of training on well-being and safety at work was increased, and it was also included in orientation. Atria Finland and Baltic invested in the assessment of risks and the gathering of information on close calls defined in occupational safety ac-tion plans. A development project for occupational instruction and guidance was set in motion in Atria Finland.
pArticipAtion And coMMitMentsIn Atria Finland and Scandinavia, all employees – with the exception of top management – are covered by collec-tive labour agreements. In Atria Rus-sia, a collective agreement applies to some 4.5 percent of the employees. Atria Baltic has no collective agree-ment system in place. The minimum notification periods in the event of reorganisations, i.e. redundancies or layoffs, vary from two weeks to two months in the countries where Atria Group operates.
20072008
39

c o r p o r A t e r e s p o n s i b i l i t y s o c i A l r e s p o n s i b i l i t y
these profiles were taken from Our Atrium, the Group's personnel magazine published three times a year in Finnish, Swedish, Danish, russian and Estonian.
GoAls For 2009 Atria Plc and Atria Finland•personnelplanningwiththeaim
of supporting optimal personnel structure
•thedevelopmentofleadershipskills; launch of Atria’s international manager training programme and increasing the knowledge of Rus-sian business practises
•thestrategy-driventraininganddevelopment activities based on competency assessments
•thedevelopmentofmanagementand information systems supporting supervisory work
•healthandsafetyactivitiesandemployee well-being
Atria Scandinavia•HRactivitiesaimedatsupportingthe
organisation’s operational efficiency•activitiessupportingthemergerof
Atria Deli and Atria Foodservice operations
•streamliningmeasuresattheSköllersta plant
•developmentofjointlogisticsaswell as financial and HR adminis-tration operations
•improvementofperformancereview culture and performance reviews
•communicationsandthedevelop-ment of rewards
Atria Russia•HRactivitiesaimedatsupporting
the integration of Pit-Product and Campomos
•improvingtheengagementofproduction and logistics centre employees
•employeeorientationandqualitytraining
•planningtheopeningoftheGore-lovo production plant
•promotingactionsidentifiedinthepersonnel survey
Atria Baltic•HRactivitiesstrengtheningnew
companies and operations integra-tion
•implementingHRstrategyinallproduction plants
•improvingworkingconditions•knowledgetransferandtheadop-
tion of best practices will be developed through job rotation and increasing international assignments
•developmentofrewards,healthandsafety at work and communications
•implementationofperformancereviews and internal personnel training
40

10
8
6
4
2
0
1,0
0,8
0,6
0,4
0,2
0,0
Atria’s product development and mar-keting are guided by insights into con-sumer needs gained from research on consumer behaviour. Product devel-opment and marketing are not sepa-rate functions at Atria. Instead, they form an integrated function on both a strategic and operational level.
In 2008, Atria put more emphasis on research into consumer behaviour. The Group’s research and development costs amounted to EUR 9.9 million.
Atria launched 280 new products. The figure, which also includes new packages and new products related to product support, rose considerably from the previous year’s 153 novelties.
Knowing consumers’ purchasing and eating habits is one of the main challenges in the food industry. It is also one of Atria’s core strengths. In addition to consumer research, Atria participated in applied research in fields such as nutritional science and product packaging technology in 2008. Atria carries out basic research through its co-operation network, which includes research institutes, schools and universities.
Atria’s research and product devel-opment operations aim at consumer-oriented and successful commerciali-sation of products and concepts. At the Group level, Atria is developing a joint R&D process and joint operat-ing models between the business ar-eas. Each business area has its own operative product development unit because operations are mainly local.
Atria has developed a three-layer research hierarchy. The first level con-sists of identifying and interpreting eating trends at the macro level, that is, how the food markets are devel-oping internationally and within in-
dividual business areas. On the sec-ond level, research focuses on market development, consumers’ purchasing and consumption habits, as well as their expectations and wishes con-cerning product groups and product segments within different groups. The third level consists of product-level research, that is, how the product fea-tures correspond to consumers’ wish-es and needs.
Megatrends direct product developmentThe international food markets are in-fluenced by three megatrends: wellbe-ing & health, ease & convenience, and taste & deliciousness. Atria’s product development and marketing aim to respond to the challenges set by these trends equally in all business areas.
The recession that began in 2008 has had a slight effect on consumers’ purchasing behaviour and eating hab-its. Consumers became more price-conscious and some began to favour products in lower price categories. There was also a small drop in eating out. This, in turn, made eating meals at home more common.
Good resources also in economic downturnIn 2009, Atria will continue its system-atic inputs in product development and marketing. At the same time it will also enhance the cost-effectiveness of its operations through co-operation at the Group level. Atria is well po-sitioned to deal with recession-driven changes in demand at the level of both product groups and product seg-ments. The Group will launch many important new products in all busi-ness areas.
Insight into consumer needs guides product development and marketing
Atria’s research and development
EUR million %
2006 2007 2008
% of net sales
c o r p o r A t e r e s p o n s i b i l i t y p r o d u c t d e v e l o p M e n t A n d M A r K e t i n G
41

Health &well-being
43 good food
MEGATRENDS
4242

ealth &
good food 42
Products that boost health and well-being interest
consumers, as long as they do not compromise flavour and taste. For example, individually packed snacks, such as salads,
are an essential part of the notion of a healthy diet. The ‘health and well-being’ megatrend is closely linked to confidence and awareness of the origin of food. The expressions ‘natural
food’ and ‘purity’ describe one of the key ideals related to food.
4343

Financial statements and annual report
Invitation to the Annual General Meeting ....................... 44Report by the Board of Directors .................................... 45Atria Plc's shareholders and shares .............................. 54Group indicators.............................................................. 56Atria Group´s IFRS Financial Statements 2008 ............. 58Notes to the Consolidated Financial Statements ........... 62Parent company balance sheet, income statement and cash flow statement (FAS)...................... 96Notes to the parent company financial statement ......... 98Signatures and audit report .......................................... 103
Annual General Meeting, 29 April 2009
Atria Plc invites its shareholders to the Annual Ge-neral Meeting, which will be held on Wednesday, 29 April 2009 in Helsinki at the Finlandia Hall.
The AGM will address the following matters, among others:
1. Matters to be addressed at the AGM as set out in Article 16 of the Articles of Association.
The invitation to the AGM will be published in national newspapers on 3 April 2009. The AGM docu-ments are available on Atria’s website at www.atria.fi/ konserni.
44

r e p o r t b y t h e b o a r d o F d i r e c t o r s
Report by the Board of Directors for 1 January - 31 December 2008
stable growth in a challenging business environment2008 will go down in history as a challenging year marked by international food and financial crises. For Atria, it was a year of strong growth and international expansion, during which it executed its growth-oriented business strategy systemati-cally. In line with this strategy, Atria aims to grow mainly or-ganically, i.e. expand its current operations. In 2008, growth was sought particularly through acquisitions supporting the strategy. Atria’s goal is to be the first choice for consumers and customers in the food sector – especially in fresh food – in the Baltic Sea region and European parts of Russia. To accomplish this, Atria must be the market leader or second largest player in Atria’s business areas, and its brands must be among the two best-known brands. Due to the acquisitions made during the accounting period, Atria is one step closer to achieving its goal.
Despite the changes in the market conditions and business environment, Atria retained the following financial targets:
• Operatingprofit(EBIT) atleast5%• Equityratio 40%• Shareofinternationaloperations 50%• Returnonequity(ROE) 12%• Dividenddistributionofprofitfortheperiod 50%
The year started on a rough note on the meat market. An unbalance between supply and demand weighed down producer and consumer prices of meat, whereas the prices of feedstuffs used as raw material in meat production rose sharply. The increasing cost of raw materials across the food chain worldwide hampered the Group’s performance in the first half of the year.
In the summer, the meat market took a turn for the bet-ter, and expectations for 2009 were more positive. When the financial crisis which originated in the US housing market spread to Europe in the autumn, the conditions in global meat markets became unclear and more difficult to predict.
At the end of the year, the crisis had begun to affect everyday life and there were reports in the media on the uncertainty of the economy in nearly all industries and service sectors. In such a climate, consumers consider more carefully what to buy and often settle on less expensive products. The change in consumer habits had a slight impact on the demand for Atria’s products, although sales volumes remained good until the end of the year. Atria Group’s profitability was mainly af-fected by the steep rise in raw material prices and the fact that consumer price increases lagged behind this rise. The weakening of the Swedish krona and Russian rouble also re-duced profitability.
Atria strengthened its position and experienced substan-tial growth in Russia, Sweden and Estonia. In the summer, Atria acquired four companies, whose impact on its net sales amountstoapproximatelyEUR150millionannually. In early July, Atria acquired the Swedish AB Ridderheims Delikatesser, a producer of delicatessen products. Ridderheims is a strong, well-known and innovative brand in the industry. Atria’s aim is to build the product selections of Ridderheims and Falby-gdensOstintothelargestrangeofdelicatessenproductsinthe Nordic countries.
In Finland, the investments made in the Atria brand were reflected in the growth of sales and market shares, but the increase in raw material prices and other industrial costs di-minished the profits. Goals were achieved in the operation of industrial processes and respect for the brand; these are at the top of the industry in Finland. The situation was the hardest in meat-producing farms, which saw a rapid rise in production costs and subsidy changes that eroded earnings.
The largest acquisition was made in Russia, where Atria purchasedthemeatprocessingcompanyOOOCampomos,operating in the Moscow and St. Petersburg regions, at the end of July. This made Atria the country’s leading interna-tional meat industry company and one of the biggest meat processing companies in Russia. Campomos has a produc-tion plant and logistics centre in Moscow and a distribution terminal in St. Petersburg. It also runs its own significant pork production operations.
45

In the Atria Baltic business area, two Estonian meat processing companies, AS Wõro Kommerts and AS Vastse-Kuuste Lihatööstus, were merged into the Group. These new companies, together with AS Valga Lihatööstus, make Atria the second largest industry player in Estonia. This position will create new development and growth prospects for Atria not only in Estonia but also in the entire Baltic region.
atria’s sales and market shares at a good level in a challenging business environmentAtria’s net sales in Finland were EUR 797.9 million (EUR749.6million),up6.4percentfromthepreviousyear.Opera-tive EBIT amounted to EUR 34.4 million(EUR43.2million).The investments made in the Atria brand were reflected in the growth of sales and market shares, but the increase in raw material prices and other industrial costs reduced profit-ability. The company’s strengths include production and de-livery reliability, which play a major role in the successful delivery of fresh meat and poultry products and performance during the seasons. To enhance cost-efficiency, Atria Finland launched an operational efficiency improvement programme in the spring, aimed at annual cost savings of EUR 4 million. Atria discontinued its operations in Kannus, and the logistics and meat product manufacturing operations of the Forssa production plants were moved to Nurmo. In addition, Liha-Pouttu’s meat procurement operations were merged with A-Farmers Ltd’s operations.
Atria ScandinaviapostednetsalesofEUR455.2million(EUR457.8 million). Due to the weakened exchange rate of theSwedish krona, net sales in euros decreased by 0.6 percent, whilenetsalesinkronorroseby3.9percent.OperativeEBITcametoEUR15.4million(EUR20.5million).Theyear2008was one of stable growth for Atria Scandinavia. However, profitability did not develop as expected. The company’s profits were reduced by raw material costs that remained high particularly in the latter half of the year and the weak performance of the Lätta Måltider unit. The weakened krona increased the prices of imported raw materials further to-
wards the end of the year. In summer 2008, Atria acquired the Swedish AB Ridder-
heims Delikatesser, a producer of delicatessen products. This acquisition strengthened further Atria’s market position in Sweden. Ridderheims was consolidated into Atria as of 1 July 2008.
In the autumn, Atria concentrated the production of the Lätta Måltider unit from Halmstad into Norrköping. As a re-sultofthisarrangement,50oftheHalmstadplant’semploy-ees were made redundant.
Atria RussiapostednetsalesofEUR93.8million(EUR65.6million) and an operative EBIT of EUR -3.4 million (EUR+4.3million).Thegrowthofnetsalesandmarketsharesin2008 met the company’s expectations. The results of the St. Petersburg-based OOO Pit-Product fell short of expec-tations, although the targets for growth and market shares were exceeded. Pit-Product is the market leader in the St. Petersburg region modern trade with a market share of ap-proximately30percent(Source:ACNielsen).Thecompany’sprofitability was slightly below the target, which was mainly due to the sharp rise in raw material prices. Sales prices were increased, but raw material prices rose more quickly than the sales prices of end products.
As a result of an acquisition, Atria Russia became an even stronger player in European Russia. Atria acquired the meatprocessingcompanyOOOCampomos,whichoperatesin the Moscow and St. Petersburg regions. The takeover of Campomoswasinitiatedimmediatelyaftertheconfirmationofthedealon15October2008.TheacquisitionisexpectedtodoubleAtriaRussia’snetsales.Campomosislossmaking,and Atria aims to have the company’s EBIT in the black du-ring 2010. This requires the further strengthening of the company’s market position in Moscow, new product group launches, cost reductions and the rationalisation of primary production, which was started up in 2008.
In the Baltic countries, Atria’s operations are centred in Es-tonia. Two major acquisitions were completed in summer
r e p o r t b y t h e b o a r d o F d i r e c t o r s
46

2008: AS Wõro Kommerts and AS Vastse-Kuuste Lihatööstus. The new companies were consolidated into Atria as of 1 Au-gust2008.AtriaBaltic’snetsaleswereEUR32.3million(EUR26.7million) andoperativeEBIT stoodatEUR -3.8million(EUR-3.1million).
Key indicators (eUr million): 2008 2007 2006
Net sales 1,356.9 1,272.2 1,103.3
EBIT 38.4 94.5 41.5
EBIT, % 2.8 7.4 3.8
Operative EBIT 39.9 61.4 33.5
Operative EBIT, % 2.9 4.8 3.0
Balance sheet, total 1,134.5 1,000.7 731,6
Return on equity, % 2.5 17.2 8.8
Return on investments, % 5.3 15.2 8.7
Equity ratio, % 38.4 47.6 42.8
Gearing, % 94.6 60.1 66.8
earningsConsolidatedEBITamountedtoEUR38.4million(EUR94.5million)andoperativeEBITtoEUR39.9million(EUR61.4million).EBITfor2008includesthefollowingnon-recurringcosts: EUR 1.0 million for the closing of the Halmstad plant in SwedenandEUR0.5millionforthediscontinuingofopera-tions in Kannus, Finland and the closing of a logistics centre in Forssa, Finland.
research and developmentAtria Group’s research and development operations focus on researching consumer behaviour in all of the Group’s busi-ness areas. In addition, Atria participates in applied research in the areas of product and packaging technology, and the science of nutrition.
Besides flavour and savour, consumers value ease and convenience, especially on weekdays when meals must be prepared quickly for the whole family. This is an interesting
challenge for the food industry. Package size, in particular, will become an increasingly important selection criterion for consumers.
Health and well-being will continue to be important. Consumers expect there to be healthier foods available aswell, i.e. products that have a lower fat content, only include a little salt or contain health-promoting ingredients. Health and well-being are closely linked to confidence and aware-nessoftheoriginoffood.Consumerawarenessofenviron-mental sustainability is also increasing.
In 2008, the focus in Atria Group’s product development was on sliced cold cuts. New products were launched in all countries in this segment. In the Baltic countries, particularly the smaller package sizes were a great success. A new enve-lope package for cold cuts was launched in the Swedish and Danish markets.
Many new products were also launched in convenience foods. Productisation focused on ready-to-eat portions, which were launched in Finland in the spring. In Sweden, Atria launched new types of private label microwave meals. In January 2008, Atria Finland revised its package labelling for microwave meals. The upper corner of the package now con-tains clear information on nutritional content for quick and easyviewing.Consumersusuallycheckthedate,buttheyarealsointerestedinhowhealthytheproductis(theamountofenergy,fatandsalt).Intermsofvalue,thenetsalesofAtriaFinland’s microwave meals grew by 23 percent in 2008. The new package labels were introduced in all product groups during 2008.
The launches of a few new products were postponed to 2009 due to the good sales of Atria Russia’s current product selection. Atria brought a total of 280 new products to the marketin2008.Theseaccountedforaround4to5percentof Atria’s total net sales. New products played a pivotal role in the earnings for certain product groups, as they contributed to a significant change in the selection.
The key factor affecting consumption in 2008 and in the near future is the economic recession. It could already be seen in 2008, when consumers became more price-conscious
47

and shifted their purchasing towards less expensive food. Freshness, flavour and speed will be the guiding princi-
ples for 2009 launches. Atria will bring to the market new, reasonably priced concepts and solutions which will make everyday life easier for consumers whether they require speed or enjoy family meals that take slightly more time.
Funds used for Atria Group’s research and development activities in relation to net sales for the period 2006–2008:
2008 2007 2006
Research and development (EUR million) 9.9 8.4 7.4
% of net sales 0.7 0.7 0.7
Financing and liquidityThe financial market crisis progressed during 2008 and re-duced the number of financing options generally available for companies. The liquidity of the bond and commercial pa-per market was very poor, particularly towards the end of the year. Where necessary, Atria financed its maturing com-mercial papers by using its existing credit limits. The avail-ability of traditional bank financing was more uncertain than previously,andloanmarginswereontherise.Ontheotherhand, the steep decline in market interest rates that began in the autumn has reduced financing costs.
Despite the very challenging business environment, Atria wasabletokeepitsfinancingpositionstrong.BetweenOc-toberandDecember,Atriaacquirednewlong-term,5–7yearfinancing in the amount of EUR 69 million, of which the pro-portionofTyEL(EmployeesPensionsAct)premiumlendingwas EUR 39 million. In addition, Atria signed an agreement for two binding credit limits in December, totalling EUR 32 mil-lion. There was a total of EUR 126 million in undrawn binding credit limits at the end of the year.
Atria made four significant acquisitions in 2008. During the third quarter, the acquisition of AB Ridderheims Delikatesser was completed in Sweden and the acquisitions of AS Wõro Kommerts and AS Vastse-Kuuste in Estonia. The acquisition of OOOCampomoswascompletedinRussiainthefourthquar-
ter. The liabilities of the acquired companies were transferred in the transactions, and the remainder of the purchase prices were paid using cash funds and existing credit limits.
OOOCampomoshadapproximatelyEUR66million inforeign-currency-denominated liabilities, the reorganisation of which was commenced after the acquisition. In Novem-ber,Campomosamortiseditseuro-denominatedloansbyap-proximatelyEUR35million.OfCampomos’seuro-dominatedloans at the balance sheet date, EUR 13 million has been paid off in January 2009 and further repayments will be made dur-ingtheearlypartoftheyear.Campomos’sforeign-currency-denominated loans created exchange rate losses of approxi-matelyEUR5millionduetotheweakeningoftherouble.
risk management in atriaIn its operations, Atria is faced with a variety of external and internal risks, whose effects on the results may be negative or positive. The purpose of Atria’s proactive risk management activities, implemented consistently across the Group, is to support the execution of Atria’s strategy and the achieve-ment of targets, as well as to secure business continuity if the risks are realised. In reporting, Atria’s risks are divided into four categories: business risks, operational risks, financial risks and accident risks.
In 2008, Atria Group’s Board of Directors approved a new Risk Management Policy and operation models for common risk assessment and risk reporting. A risk assessment in ac-cordance with the policy was implemented in all business areas and Group operations. The most significant risks ob-served were prioritised throughout the Group and reported to the Board of Directors. The Management Teams of the busi-ness areas and the Group Management Team are responsible for implementing the required risk management actions in their own responsibility areas. Financial risk management is centralised in the Group’s Treasury unit. The following key risks and their controls have been taken into account in the control of Atria Group’s business operations:
r e p o r t b y t h e b o a r d o F d i r e c t o r s
48

Business risks The profitability of Atria’s operations is greatly affected by the risk associated with changes in the international mar-ket price of meat raw material. Atria aims to protect itself against unfavourable price movements by adjusting produc-tion, where necessary, and by trying to anticipate changes through the pricing of end products. Products sold under the AtriabrandaremanufacturedusingonlyFinnishmeat.Con-sequently, changes in the production volumes and availability of Finnish meat raw material may affect Atria Finland’s profit-ability. In Atria Russia’s operations, a special characteristic of the market is changing restrictions and import duties related totheimportofmeat.TheMoscow-basedOOOCampomos,which was merged into Atria Group in 2008, has invested heavily in the development of primary production.
Retail trade in the food industry is highly consolidated in all of Atria’s key markets, which creates opportunities for buildingmanyformsofcooperationoverthelongterm.Onthe other hand, this may increase dependence on individual customers. Atria’s market position and strong brands improve the company’s negotiating position.
Operational risksDuring the past year, Atria made significant acquisitions in Swe-den, Russia and Estonia. Each acquisition was preceded by due diligence. The integration of the operations of each new com-pany is the responsibility of a specially appointed integration team, the role of which is to ensure that the process goes ac-cording to plan.
Being a food manufacturing company, it is of primary impor-tance for Atria to see to the high quality and safety of raw materials and products throughout the production chain. Atria has modern methods in place for ensuring the safety of production processes and for eliminating various microbiological, chemical and physical hazards. An animal disease discovered at a critical point in Atria´s primary production chain can interrupt production in the unit concerned and disturb the entire chain´s operations. Through internal monitoring involving multiple stages, Atria aims to detect potential hazards as early as possible.
Financial risksThe food industry’s dependence on economic cycles is be-low the average, and Atria’s annual sales volumes are fairly stable. The main areas that may be affected by the financial crisis are financing and risk for credit losses.
The economic downturn increases the risk of weakening liquidity among Atria’s customers and the occurrence of credit losses particularly in industries that are sensitive to business cycles, such as the hotel and restaurant sector and the shoe and leather industry.
A significant proportion of Atria’s trade receivables in Finland are related to feed and animal trading in primary production. The profitability of agricultural production has been reduced particularly by the sharp changes in the prices of feedstuffs, fertilizers and other factors of production. At the same time, obtaining financing has become more difficult due to the general economic conditions, which may result in financial difficulties for some farms.
Significant changes in energy costs, e.g. electricity and gas prices, may affect Atria’s profitability. Atria aims to hedge against unfavourable changes using derivatives. The company also has initiated projects aimed at cutting energy costs.
Atria Group’s interest rate and currency risks as well as liquidity and refinancing risk are described in the Notes to the Financial Statements on page 88.
Accident risksLow temperatures and repetitive movements are characteris-tic of work performed within the food industry. The work is often physical and requires the use of cutting machines and tools, for instance. Atria aims to prevent occupational acci-dent and disease risks and related costs by investing in safety at work and the continuous improvement of work methods and tools.
Atria has more than 20 production plants in Finland, Swe-den,Denmark,theBalticCountriesandRussia.Alloftheseare insured against material damage and business interrup-tions.
49

changes in administration and operative organisationIn its organisation meeting following the Annual General Meeting, Atria Plc’s Supervisory Board re-elected retiring members Matti Tikkakoski and Martti Selin. Ari Pirkola was appointedChairmanoftheSupervisoryBoard,andChairmanof the Board, Martti Selin, was reappointed.
Atria Plc’s Board of Directors now has the following membership: Chairman Martti Selin; Vice-Chairman TimoKomulainen; members Tuomo Heikkilä, Runar Lillandt, Matti Tikkakoski and Ilkka Yliluoma.
Atria Plc’s administration is described in more detail un-dertheheadingCorporateGovernancePrinciples.
auditorsIn 2008, Atria Plc´s Annual General Meeting elected Author-ized Public Accountants Pekka Loikkanen and Eero Suomela as the company´s regular auditors.
personnel, average 2008 2007 2006
Atria Finland 2,378 2,394 2,325Atria Scandinavia 1,691 1,768 1,206Atria Russia 1,525 1,278 1,528Atria Baltic 541 507 681
Atria Group total 6,135 5,947 5,740Salaries and benefits for the period, Group total (EUR million) 181.0 169.9 144.8
Key persons’ share-based incentive programme Atria Plc’s Board of Directors has decided to adopt a share-based incentive programme for Atria Group’s key personnel. The programme will comprise three one-year accrual peri-ods, i.e. calendar years 2007, 2008 and 2009. Payments will be made in 2008, 2009 and 2010, partly in the form of the company’s Series A shares and partly as cash payments. The cash payments will cover any taxes or similar costs caused by the incentives. The shares may not be transferred for a period of two years from the end of the accrual period. Any profit from the programme for the accrual period 2008 will be
r e p o r t b y t h e b o a r d o F d i r e c t o r s
based on the Group’s EBIT percentage and return on capital employed(ROCE).Theshareincentivestobepaidfor2008would have amounted to no more than 100,100 of Atria Plc’s Series A shares. Share incentives will not be paid for 2008. For 2007 share incentives were paid for some 40 company’s key persons.
A total of 35,260 SeriesA treasury shares held by theCompanyweretransferredfreeofchargetokeypersonsbe-longing to the incentive programme for the accrual period 2007. The date of the share transfer was 19 December 2008.
environmental responsibilityAtria Group’s environmental responsibility is built around three main elements: • Takingaccountoftheenvironmentatalloperationallev-
els • Identifyingindirectenvironmentalimpactsatvariousstag-
es of the operating chain • Reducingthedirectenvironmentalimpactsofpracticalop-
erationsBy focusing on the balanced control and management of
these elements, Atria generates substantial added value for its business operations, as well as for its stakeholders and the en-vironment.
At its widest, Atria views its environmental responsibil-ity as covering the entire food chain. It applies to the entire operating chain from primary production and acquisition of raw materials to the manufacture, consumption, recy-cling and disposal of products. In addition to environmental protection, this perspective emphasises the prevention of environmental and health hazards and the consideration of consumer and personnel safety. To a certain extent, this per-spective also covers the operating practices of the suppliers of raw materials and other subcontractors, as well as the well-being of animals at farms and during transport.
Environmental impacts have been identified and organ-ised based on their significance. Atria’s main environmental concerns are energy use, water use, wastewater load and the generation of municipal waste.
50

Indirect concerns are transport and primary production. Atria is aware of their effects; in transport, it monitors fuel consumption and in primary production, the share of farms committed to the conditions of environmental subsidies.
The operations of the Group’s production plants are in compliance with environmental legislation, licenses and obli-gations monitored by the authorities. The environmental sys-temsarecertifiedinaccordancewiththeISO14001standardat Atria Finland Ltd’s Nurmo, Kauhajoki and Kuopio produc-tion plants. The same level of attention is given to environ-mental matters at other units.
outlook for 2009 Market conditions will remain challenging in 2009. It will be difficult to anticipate the global price movements of meat raw material. In Russia and Sweden, Atria also uses import-ed meat, whose price is strongly affected by exchange rate fluctuations. Potential changes in Russia’s import duties and regulations will also be reflected in the prices of imported meat. The economic recession will have some effect on sales volumes and the demand for certain product groups. The de-mand for more expensive products is expected to decline, while inexpensive products will be in stronger demand.
We expect Atria Finland to further reinforce its market position. Particularly the retail sales of the Atria brand will in-crease. At the beginning of 2009, Atria Scandinavia launched an extensive programme to improve its profitability. In addi-tion to the streamlining of operations, it will involve price increases in order to compensate the rise in costs caused by the weakening of the krona. Unprofitable operations will be rationalised and discontinued. Atria Scandinavia will invest in the development of new, innovative products and the growth of the concept business.
Atria Russia’s key objective for 2009 is the completion and commissioning of the meat product plant in Gorelovo, St Petersburg. Particularly in the first half of the year, resources will be concentrated on the takeover of the new subsidiary, Campomos,theimprovementofitsprofitabilityandtheutili-sation of synergies. Investments will also be made in increas-
atria GroupWater consumption
1 ,000 m3
3,000
2,500
2,000
1,500
1,000
500
02006 2007 2008
atria GroupMunicipal solid waste
1, 000 kg8,0007,0006,0005,0004,0003,0002,0001,000
02006 2007 2008
atria Groupbiological oxygen demand
1, 000 kg1,600
1,200
800
400
02006 2007 2008
atria Groupheat recovery
MWh40,000
30,000
20,000
10,000
02006 2007 2008
atria Groupelectricity consumption
MWh400,000
300,000
200,000
100,000
02006 2007 2008
51

ing the efficiency and capacity of primary production, as well as in streamlining production and logistics operations.
The integration of the operations of Atria Baltic’s new subsidiaries will be continued in 2009. The aim is to enhance profitability through the streamlining of production and lo-gistics.
atria plc’s share capitalThe breakdown of the parent company share capital is as follows:SeriesAshares (1vote/share) 19,063,747SeriesKIIshares (10votes/share) 9,203,981
The Series A shares have preferential claim to a dividend of 10 percent on the nominal value of the share, after which a dividend of 10 percent of the nominal value shall be paid on Series KII shares. After this, if dividends remain to be paid, Series A and Series KII shares entitle their holders to an equal right to a dividend.
If a Series KII share is transferred to a party outside the company or a Series KII share is transferred to a shareholder within the company who has not previously owned Series KII shares, the transferee must inform the Board of Directors without delay and a Series KII shareholder has the right to pre-emptively purchase the share under certain conditions. The acquisition of Series KII shares by means of transfer re-quires approval by the company. Series A shares have no such limitations.
Information on shareholding distribution, shareholders and management holdings can be found under the heading Shares and shareholders.
board of directors’ share issue authorisationThe General Meeting held on 29 April 2008 resolved to au-thorise the Board of Directors to decide, on one or several oc-casions, on a share issue involving a maximum of 10,000,000 new Series A shares at the nominal value of EUR 1.70 per share. The authorisation is valid until the closing of the next Annual General Meeting, or until 30 June 2009, whichever
occurs first. The General Meeting has previously authorised the Board of Directors to decide on one or several reserve increases, which may increase the company’s share capital byamaximumofEUR850,000.Theauthorisationisvalidfora maximum of five years from the date of the General Meet-ing’s decision.
purchase and transfer of treasury sharesThe General Meeting held on 29 April 2008 authorised the Board of Directors to decide on the purchase of up to 2,800,000 A shares of the company with the company’s unre-stricted equity. The maximum amount of the Series A shares to be acquired is less than 10 percent of all of the company’s shares. The authorisation is valid until the closing of the next Annual General Meeting, or until 30 June 2009, whichever occurs first.
The General Meeting held on 29 April 2008 authorised the Board of Directors to decide on the transfer of treasury shares held by the company in one or more batches, so that a maximum total of 2,800,000 Series A shares are subject to the authorisation. The authorisation is valid until the closing of the next Annual General Meeting, or until 30 June 2009, whichever occurs first.
Based on the authorisation of the General Meeting, Atria Plc’s Board of Directors decided to purchase up to 300,000 A shares of the company. In accordance with the authorisa-tion, the shares to be purchased are intended to be used as consideration in any company acquisitions or other arrange-ments relating to the company’s business, for the financing of investments, for the implementation of the company’s incen-tive programme, for improvement of the company’s capital structure, or to be kept by the company, otherwise assigned or cancelled. The acquisition of treasury shares began on 29 September 2008 and will end no later than 30 June 2009.
A total of 35,260 treasury SeriesA shares held by thecompany were transferred free of charge to key persons be-longing to the incentive programme for the accrual period 2007. The date of the share transfer was 19 December 2008. Asof31December2008,thecompanyheldatotalof47,157
r e p o r t b y t h e b o a r d o F d i r e c t o r s
52

treasury shares which represents 0.17 percent of the shares and 0.04 percent of the voting rights conferred by the shares. The aqcuisition of the company´s own shares did not have significant influence on distribution of ownership and voting rights.
board of directors’ proposal for use of profitThe parent company’s distributable profit amounts to EUR74,531,673, ofwhichprofit for theperiod totals EUR23,292,962.
The Board of Directors will propose to the AGM that the distributable profits be used as follows:
• adividendofEUR0.20/ shareispaidtotalling EUR5,653,546• addedtoshareholders’equity EUR 68,878,127 EUR74,531,673
No significant changes have occurred in the company’s financial position since the end of the accounting period. The company’s liquidity is good and, according to the Board of Directors, the proposed dividend does not compromise the company’s solvency.
53

BREAKDOWN OF SHARE OWNERSHIP
Shareholders according to the number of shares owned, 31 Dec 2008 Shareholders Shares
Number of shares no. % 1,000 %
1-100 4,432 44.91 216 0.76101-1,000 4,581 46.42 1,663 5.88
1,001-10,000 769 7.79 1,971 6.9710,001-100,000 66 0.67 1,864 6.60
100,001-1,000,000 16 0.16 4,673 16.531,000,001-999,999,999,999 4 0.04 17,881 63.26
Total 9,868 100.00 28,268 100.00
Shareholder by business sector, 31 Dec 2008 Shareholders SharesBusiness sector no. % 1,000 %
Companies 465 4.71 16,421 58.09Financial and insurance institutions 56 0.57 1,761 6.23Public corporations 21 0.21 912 3.23Non-profit associations 143 1.45 836 2.96Households 9,152 92.74 3,439 12.17Foreign owners 31 0.31 2,535 8.97Total 9,868 100.00 25,904 91.64
Nominee-registered, total 11 2,364 8.37
INFORMATION ON SHAREHOLDERS
Major shareholders 31 Dec 2008 K II A Total %
Itikka Co-operative 4,914,281 2,457,801 7,372,082 26.08Lihakunta 4,020,200 3,351,797 7,371,997 26.08Odin Norden 1,687,300 1,687,300 5.97Skandinaviska Enskilda Banken 1,449,436 1,449,436 5.13Nordea Bank Finland Plc 754,733 754,733 2.67Pohjanmaan Liha Co-operative 269,500 480,038 749,538 2.65Odin Finland 695,214 695,214 2.46OP-Suomi Arvo 404,922 404,922 1.43Public pension insurance company Veritas 309,000 309,000 1.09Nordea Life Assurance Finland Ltd 225,000 225,000 0.80
Largest shareholders in terms of voting rights, 31 Dec 2008 K,II A Total %
Itikka Co-operative 49,142,810 2,457,801 51,600,611 46.44Lihakunta 40,202,000 3,351,797 43,553,797 39.20Pohjanmaan Liha Co-operative 2,695,000 480,038 3,175,038 2.86Odin Norden 1,687,300 1,687,300 1.52Skandinaviska Enskilda Banken 1,449,436 1,449,436 1.30Nordea Bank Finland Plc 754,733 754,733 0.68Odin Finland 695,214 695,214 0.63OP-Suomi Arvo 404,922 404,922 0.36Public pension insurance company Veritas 309,000 309,000 0.28Nordea Life Assurance Finland Ltd 225,000 225,000 0.20
a t r i a p l c ´ s s h a r e h o l d e r s a n d s h a r e s
54

EUR
30
27
24
21
18
15
12
9
6
3
0 12/08
9/08
6/08
3/08
12/07
9/07
6/07
3/07
12/06
9/06
6/06
3/06
12/05
9/05
6/05
3/05
12/04
9/04
6/04
3/04
MANAGEMENT'S SHAREHOLDING
The members and deputy members of the Board of Directors and Supervisory Board, and the CEO and deputy CEO owned a total of 41,661 A series shares on 31 Dec 2008, which corresponds to 0.15 % of shares and 0.04% of voting rights.
MONTHLY TRADING VOLUME OF A SERIES SHARES IN 2008
MonthNet sales,
euroNet sales,
sharesMonthly
lowestMonthlyhighest
January 7,178,687 443,343 14.00 18.29February 3,115,659 198,719 15.08 16.89March 1,918,243 124,978 14.93 16.00April 12,785,774 835,101 13.90 18.09May 4,891,815 347,306 13.30 14.85June 2,274,875 156,317 13.45 15.05July 2,678,557 203,183 12.38 14.19August 8,903,810 652,547 11.52 14.50September 2,426,919 182,493 11.65 14.60October 2,923,154 247,036 10.73 13.32November 2,901,305 236,989 11.15 13.25December 4,942,232 448,913 10.51 11.70Total 56,941,030 4,076,925
TREND IN THE PRICE OF THE A SERIES SHARE, 2004-2008 (average price)
55

FINANCIAL INDICATORS
IFRS IFRS IFRS IFRS IFRS31 Dec 2008 31 Dec 2007 31 Dec 2006 31 Dec 2005 31 Dec 2004
Net sales, mill. EUR 1,356.9 1,272.2 1,103.3 976.9 833.7EBIT, mill. EUR 38.4 94.5 41.5 40.2 49.3
% of net sales 2.8 7.4 3.8 4.1 5.9Financial income and expenses, mill. EUR -22.3 -14.3 -7.3 -3.2 -5.2
% of net sales 1.6 1.1 0.6 0.3 0.6Profit before tax 16.7 80.6 34.6 37.8 44.6
% of net sales 1.2 6.3 3.1 3.9 5.3Return on equity (ROE), % 2.5 17.2 8.8 10.0 13.9Return on investment (ROI), % 5.3 15.2 8.7 10.3 13.9Equity ratio, % 38.4 47.6 42.8 43.0 50.9Interest-bearing liabilities 448.4 321.9 244.2 206.9 116.1Gearing 103.1 67.6 78.1 75.2 44.6Net gearing, % 94.6 60.1 66.8 68.9 39.7Gross investments to fixed assets, mill. EUR 152.6 284.1 89.0 107.3 37.3
% of net sales 11.2 22.3 8.1 11.0 4.5Average FTE 6,135 5,947 5,740 4,433 3,638Research and development costs, mill. EUR 9.9 8.4 7.4 6.7 7.0
% of net sales* 0.7 0.7 0.7 0.7 0.8Volume of orders** - - - - -
*Booked in total as expenditure for the financial year**Not a significant indicator as orders are generally delivered on the day following the order being placed.
G r o U p i n d i c a t o r s
calculation of indicators:
Return on equity (%) =Profit/loss for the period
x 100Shareholders' equity (average for the period)
Return on invetments (%) =Profit before tax + interest and other financial expences
x 100Shareholders' equity + interest-bearing financial liabilities (average)
Equity ratio (%) =Shareholders' equity
x 100Balance sheet total - advance payments received
Gearing (%) =Interest-bearing financial liabilities
x 100Equity
Net gearing (%) =Interest-bearing financial liabilities - cash and cash equivalents
x 100Equity
Basic earnings / share =Profit for the period
Average share issue-adjusted number of shares for the period
Equity / share =Equity belonging to the owners of the parent company
Undiluted number of shares on 31 Dec
56

SHARE-ISSUE ADJUSTED PER-SHARE INDICATORS
IFRS IFRS IFRS IFRS IFRS31 Dec 2008 31 Dec 2007 31 Dec 2006 31 Dec 2005 31 Dec 2004
Earnings per share (EPS), EUR 0.42 2.56 1.15 1.24 1.58Shareholders’ equity per share, EUR 15.34 16.77 13.28 12.08 11.58Dividend/share, EUR* 0.20 0.70 0.595 0.595 0.595Dividend/profit, %* 48.1 27.4 51.7 48.0 37.7Effective dividend yield* 1.7 4.0 3.3 3.3 5.3Price/earnings (P/E) 27.9 6.8 15.9 14.5 7.2Market capitalisation, mill. EUR 327.9 490.4 422.4 379.5 238.3Share turnover/1,000 shares A 4,077 7,933 3,899 5,704 3,800Share turnover, % A 21.4 41.6 28.1 48.0 32.0Number of shares, million, total 28.3 28.3 23.1 21.1 21.1Number of shares A 19.1 19.1 13.9 11.9 11.9
K II 9.2 9.2 9.2 9.2 9.2Share issue-adjusted averagenumber of shares 28.3 26.1 21.8 21.1 21.1Share issue-adjusted numberof shares on 31 December 28.3 28.3 23.1 21.1 21.1
SHARE PRICE DEVELOPMENT
Lowest of period A 10.51 16.90 15.00 11.50 8.55Highest of period A 18.29 28.77 21.50 18.18 11.75At end of period A 11.60 17.35 18.29 17.99 11.30Average price during period A 14.04 22.18 18.31 15.33 9.42
*Proposal from the Board of Directors
Dividend per share =Dividend distribution in period
Undiluted number of shares on 31 Dec
Dividend / profit (%) =Dividend / share
x 100Earnings / share (EPS)
Effective dividend yield (%) =Dividend / share
x 100Closing price at the end of the period
Price / earnings (P/E) =Closing price at the end of the period
Earnings / share
Average price =Overall share turnover in euro
Undiluted average number of shares traded in the period
Market capitalisation = Number of shares at the end of the period * closing price on 31 Dec
Share turnover (%) =Number of shares traded in the period
x 100Undiluted average number of shares
57

a t r i a G r o U p ´ s i F r s F i n a n c i a l s t a t e M e n t s 2 0 0 8
CONSOLIDATED BALANCE SHEET, EUR 1,000
Assets Notes 31 Dec 2008 31 Dec 2007
Non-current assetsProperty, plant and equipment 1, 32 493,562 455,624Goodwill 2 151,054 151,810Other intangible assets 2 70,499 64,247Investments in joint ventures and associates 3 6,137 5,728Other financial assets 4, 28 2,111 2,959Loan assets and other receivables 5, 28 15,461 12,090Deferred tax assets 6 2,194 625Total 741,018 693,083
Current assetsInventories 7, 32 113,265 87,313Trade and other receivables 8, 28 231,821 184,750Cash and cash equivalents 9, 28 37,138 35,592Total 382,224 307,655
Non-current assets held for sale 1 11,257
Total assets 14, 15, 16 1,134,499 1,000,738
Equity and liabilities Notes 31 Dec 2008 31 Dec 2007
Equity belonging to the shareholders of the parent companyShare capital 48,055 48,055Share premium 138,502 138,502Own shares -542Fair value fund 81 1,890Invested untied equity fund 110,336 110,489Translation differences -33,424 -3,304Retained earnings 170,499 178,521Total 10, 11 433,507 474,153
Minority interest 1,363 1,872
Equity, total 434,870 476,025
Non-current liabilitiesDeferred tax liabilities 6 42,400 42,766Other liabilities 13 154 252Interest-bearing financial liabilities 12,28 320,812 194,081Total 363,366 237,099
Current liabilitiesTrade and other payables 11,13,28 207,878 157,252Current tax liabilities 796 2,573Interest-bearing financial liabilities 12,28 127,588 127,789Total 336,263 287,614
Total liabilities 699,629 524,713
Equity and liabilities, total 14,15,16 1,134,499 1,000,738
58

CONSOLIDATED INCOME STATEMENT, EUR 1,000
Notes1 Jan-31 Dec
2008 1 Jan-31 Dec
2007
Net sales 14, 15, 16, 17 1,356,936 1,272,187
Other operating income 16,18 3,685 38,068Change in the inventory of finished and unfinished goods 10,109 7,511
Use of materials and supplies 19 -861,875 -768,637Employee benefits 13, 20 -240,583 -227,480Depreciation and amortisation expense and impairments 14, 21 -47,535 -44,529Other operating expenses 22, 23, 24 -182,320 -182,574
EBIT 14 38,417 94,546
Financial income 25 44,361 8,312Financial expenses 25 -66,678 -22,637Share of the results of joint ventures and associates 3 573 384
Profit before tax 16,673 80,605
Income taxes 26 -7,971 -14,243Deferred tax 6, 26 2,711 1,283
Profit for the period 11,413 67,645
Profit distribution for the accounting period:
To parent company's shareholders 11,765 66,695To the minority -352 950Total 11,413 67,645
Earnings per share calculated from the profit for the period belonging to the parent company's owners:
Basic earnings/share and earnings/share adjusted for dilutive effect, euros 27 0.42 2.56
59

a t r i a G r o U p ´ s i F r s F i n a n c i a l s t a t e M e n t s 2 0 0 8
STATEMENT OF CHANGES IN CONSOLIDATED EQUITY, EUR 1,000
Equity belonging to the owners of the parent companyMinority interest
Equity, total
Share capital
Share
premium
Own
shares
Fair value
fund
Invested untied equity
fund
Translation differences
Retained earnings
Total
Shareholders' equity 1 Jan, 2007 39 258 138 502 808 128 080 306 648 5 828 312 476
Translation differences -4 112 -4 112 -198 -4 310Other changes 1 890 262 2 152 -4 708 -2 556Profit for the period 66 695 66 695 950 67 645Distribution of dividends -13 740 -13 740 -13 740Equity issue 8 797 110 227 -2 514 116 510 116 510
Shareholders' equity 31 Dec, 2007 48 055 138 502 0 1 890 110 489 -3 304 178 521 474 153 1 872 476 025
Translation differences -30 120 -30 120 -157 -30 277Other changes -542 -1 809 -153 -2 504 -2 504Profit for the period 11 765 11 765 -352 11 413Distribution of dividends -19 787 -19 787 -19 787
Shareholders' equity 31 Dec, 2008 48 055 138 502 -542 81 110 336 -33 424 170 499 433 507 1 363 434 870
60

CONSOLIDATED CASH FLOW STATEMENT, EUR 1,000
Notes 1 Jan-31 Dec 2008
1 Jan-31 Dec 2007
Cash flow from operating activitiesSales income 1,347,986 1,260,453Payments received from other operating revenue 3,685 3,392Payments on operating expenses -1,281,823 -1,172,415Interest paid and payments on other operating financial expenses -65,009 -21,634Dividends received 26 68Interest payments received and other financial yields 42,525 7,851Direct taxes paid -9,828 -14,684
Cash flow from operating activities 37,562 63,031
Cash flow from investmentsAcquisition of subsidiaries, less cash acquired 15 -41,261 -124,631Disposal of subsidiaries, less cash at date of disposal 16 39,117Investments in tangible and intangible assets -65,433 -92,202Investments 3,623 -459
Cash flow from investments -103,071 -178,175
Cash flow from financingPayments received from equity issues 116,511Draw down of long-term loans 171,691 304,125Repayment of long-term loans -86,067 -292,074Dividends paid -19,787 -13,740Own shares -967
Cash flow from financing 64,870 114,822
Change in cash and cash equivalents -639 -322Cash and cash equivalents at the start of the accounting period 35,592 35,427Effect of changes in exchange rates 2,185 487Cash and cash equivalents at end of the accounting period 37,138 35,592
61

n o t e s t o t h e c o n s o l i d a t e d F i n a n c i a l s t a t e M e n t s
Basic corporate information
The parent company of the Atria Group, Atria Plc, is a Finnish public company formed in accordance with Finnish law and domiciled in Kuopio, Finland. The company has been listed onNasdaqOMXHelsinkiOysince1991.Copiesofthecon-solidated financial statements are available online at www.atria.fi or from the parent company’s head office at Atrian- tie1,Nurmo;postaladdress:P.O.Box900,FI-60060ATRIA.
Atria Plc and its subsidiaries manufacture and market food products, especially meat products, poultry products, meals and food concepts. Atria has defined Finland, Sweden, Denmark, European parts of Russia and the Baltic countries as its market area. Atria’s subsidiaries are also located in this area. The Group’s operations are divided into four business areas: Atria Finland, Atria Scandinavia, Atria Russia and Atria Baltic.
The financial statements were approved by the Board of Directors for publication on 25 February 2009.AccordingtotheFinnishCompaniesAct,theshareholdersareentitledto approve or reject the financial statements in the AGM to be held after the publication of the financial statements. The AGM can also make a decision to revise the financial state-ments.
Accounting policies
basis of preparationThe consolidated financial statements have been prepared in accordance with the International Financial Reporting Standards (IFRS) approved for use in the EU. IAS and IFRSstandards valid on 31 December 2008 have been followed, aswellasSICandIFRICinterpretations.TheInternationalFi-nancial Reporting Standards refer to standards approved to be applied in the EU, in accordance with the proceedings stipulated in Finnish accounting legislation and regulations basedonitinEUdecree(EC)1606/2002andinterpretationsissued thereof. The notes to the consolidated financial state-ments are in accordance with Finnish accounting and corpo-rate legislation.
The financial statement data are presented as 1,000 euro and are based on original cost, unless indicated otherwise in the accounting policies.
Interpretations adopted in 2008:• IAS39(amendment)andIFRS7(amendment),Reclassifi-
cation of Financial assets. The amendment enables certain financial assets to be reclassified out of the held-for-trading or available-for-sale categories under limited circumstances. In such cases, additional information must be disclosed in the financial statements. The amendment has been effective since 1 July 2008.
OwingtothenatureoftheGroup’sbusinessandtrans-actions, these interpretations have not affected the consoli-dated financial statements:
The preparation of IFRS-compliant financial statements requires the Group management to make certain estima-tions and judgments when applying the Group’s accounting policies. Information on judgments that the management has made when applying the policies and that have the most sig-nificant effect on the figures presented in the financial state-ments are presented under “Accounting policies calling for judgments by the management and key sources of estimation uncertainty”.
Accounting policies for the consolidated financial statements
subsidiariesThe consolidated financial statements include the parent company Atria Plc and all of its subsidiaries. Subsidiaries are companiesoverwhichtheGrouphascontrol.Controlisgen-erated when the Group owns over half of the voting rights, or itotherwisehascontroloverthecompany.Controlreferstothe right to decide on the company’s financial and operating principles in order to reap benefit from its operations. The acquired subsidiaries are consolidated from the moment the Group has gained control of the company until said control ends.
Inter-group shareholding has been eliminated using the purchase method. All internal Group business transactions, receivables, liabilities and profits, as well as internal profit distribution, are eliminated when preparing the consolidated financial statements. Unrealised losses are not eliminated if the loss results from impairment. Profit distribution for the accounting period to parent company owners and minority interest is presented in the income statement, and the minor-ity’s share of equity is presented as a separate item in the bal-ance sheet under equity. The minority share of accumulated losses is recognised in the consolidated financial statements up to an amount not greater than the value of the invest-ment.
62

business combinations between companies under common control Business combinations between companies under common control have been accounted for based on historical cost, as these acquisitions do not come under the scope of IFRS 3 Business combinations. For minority share acquisitions, the difference between acquisition cost and acquired equity is recognised as goodwill.
associatesAssociates are companies in which the Group has consider-ableinfluence.ConsiderableinfluencematerialiseswhentheGroup owns more than 20 per cent of the company’s voting rights, or when the Group otherwise has considerable influ-ence but not control over the company. The associates have been consolidated using the equity method. If the Group’s share in the associates’ losses exceeds the investment’s book value, the investment will be entered at zero value in the balance sheet and the losses exceeding the book value will not be recognised unless the Group is committed to fulfill-ing the associates’ obligations. Investments in associates in-clude investments at the time of acquisition and changes in the associates’ equity after the time of acquisition. Income for the accounting period from associates, corresponding to the Group’s holding in them, has been entered as a separate item after EBIT.
Joint venturesJoint ventures are companies in which the Group and other parties exercise joint control based on an agreement. Within the Group, joint ventures are consolidated using the equity method.
Foreign currency translationThe profit and financial position of Group units are measured using the currency of the main operating region of the unit in question(“functionalcurrency”).Theconsolidatedfinancialstatements are presented in euro, which is the functional and presentation currency of the parent company.
Foreign currency business transactions:Foreign currency business transactions have been translated at the exchange rate on the date of transaction. In practice, this often means using an exchange rate that is close to the rate on the transaction date. Foreign currency monetary items have been translated into the functional currency at
the exchange rates on the closing date. Foreign currency non-monetary items, which have been measured at fair value, have been translated at the exchange rates on the measure-ment date. In other respects, non-monetary items have been measured using the exchange rate on the transaction date.
Profits and losses arising from foreign currency transac-tions and the translation of monetary items are recognised in the income statement, except when dealing with items that meet the criteria for net investment in a foreign operation, in which case they are recognised in equity. Exchange gains and losses from operations are included in the appropriate item before EBIT. Exchange gains and losses from foreign curren-cy-denominated loans are included in financial income and expenses. Translation differences from qualifying net invest-ments in foreign operations are recognised as translation dif-ferences in equity.
Translating the financial statements of foreign Group companies:The income statements of the Group’s foreign companies have been translated into euros at the average exchange rate for the accounting period, and the balance sheets at the rate on the closing date. Translating the profit for the accounting period with different exchange rates in the income state-ment and balance sheet causes an exchange rate difference, which is recognised in equity. Exchange differences arising from the elimination of foreign subsidiary acquisition costs and the translation of equity items and net investments ac-cumulated after the acquisition are recognised as translation differencesinequity.Ondisposalofasubsidiaryorpartofit,the accumulated translation differences are recognised in the income statement as a sales gain or loss.
Goodwill generated from the acquisition of foreign units, and the fair value adjustments made to the book values of the assets and liabilities of the said units in conjunction with the acquisition, are treated as assets and liabilities of the said foreign units and converted to euro using the exchange rates on the closing date.
property, plant and equipmentProperty, plant and equipment are recognised at original cost, less accumulated depreciation and any impairment.
If the tangible fixed asset consists of several parts with different useful lives, each part is treated as a separate asset. In this case, the costs connected to renewing the part are ac-tivated.Otherwise,latercostsareincludedinthebookvalue
63

n o t e s t o t h e c o n s o l i d a t e d F i n a n c i a l s t a t e M e n t s
of the property, plant and equipment only if it is probable that the future benefit connected to the asset will benefit the Group, and the acquisition cost of the asset can be reliably determined.Otherrepairandmaintenancecostsarebookedso that they affect earnings after they have materialised.
Depreciation is calculated as straight-line depreciation according to the estimated useful life as follows:
Buildings 25–40yearsMachineryandequipment 5–10years
No depreciation is made on land and water.The residual value and the useful life of assets are checked
in every financial statement and, if necessary, adjusted so that the book value equals, at most, the recoverable amount.
The depreciation of property, plant and equipment stops when the tangible fixed asset is classified as available for sale inaccordancewithIFRS5 Non-current Assets Held for Sale and Discontinued Operations.
Sales gains and losses accumulated from the disposal or transfer of tangible fixed assets are included in other operat-ing income or expenses.
Borrowing costs:Borrowing costs are booked as costs for the accounting pe-riod in which they occur. An amendment to IAS 23 requires that, as of the beginning of 2009, the borrowing costs that are directly attributable to the acquisition, construction or production of a qualifying asset be capitalised as part of the acquisition cost of the asset.
Government grants:Government grants, such as grants received for the acquisi-tion of property, plant and equipment, are recognised as a deduction in the book value of property, plant and equip-ment when it is reasonably certain that the grant will be re-ceived and that the Group company fulfils the prerequisites for receiving the grant. Grants are recognised as income in the form of lower depreciation during the useful life of the asset. Grants received as compensation for expenses are rec-ognised in the income statement, while expenses connected with the grant are entered as costs. Such grants are entered under other operating income.
Leases – Group as lessee:Leases concerning tangible assets where the Group has a
considerable share of the risks and rewards related to own-ership are classified as finance leases. Finance leases are en-tered in the balance sheet at the fair value of the leased as-set on the day the lease period begins, or at a lower value that corresponds to the current value of the minimum lease payments. The depreciation of assets acquired with finance leases are made during the useful life of assets or a shorter leasing period. Lease payments are apportioned between a finance charge and debt reduction over the lease period, so that a constant interest rate is formed for the outstanding liability in each accounting period. Lease obligations are in-cluded in interest-bearing debts.
Leases where the risks and rewards incident to owner-ship remain with the lessor are handled as other leases. Rents paid on the basis of other leases are recognised as costs in the profit and loss account, based on the straight-line method during the lease period.
intangible assets
Goodwill:Goodwill corresponds to the share of the acquisition cost that exceeds the Group’s share of the fair value of the ac-quired company’s net assets, liabilities and conditional liabili-ties at the time of acquisition. The Group has applied the IFRS 3 standard to all mergers of business activities that have oc-curred since September 2003. In these, goodwill corresponds to the share of the acquisition cost that exceeds the Group’s share of the fair value of the acquired company’s net assets at the time of acquisition. Goodwill generated in business combinations prior to this corresponds to the book value in accordance with previous accounting standards.
Goodwill is tested annually for impairment. For this purpose, goodwill is allocated to cash-generating units. The Group’s cash-generating units are classified by business seg-ment based on the operations and location of subsidiaries. In 2008 these were Atria Finland, Atria Scandinavia, Atria Russia and Atria Estonia. Goodwill is measured at original cost less impairment.
Research and development costs:Research costs are recognised as an expense in the balance sheet. Development costs related to individual projects are activated in the balance sheet when there is enough certain-ty that the asset in question can be technically implemented and will probably generate a future financial benefit. Acti-
64

vated development costs are recognised as project-specific costs during the useful life of the asset. The asset is amortised from the time it is ready for use.
Other intangible assets:Intangible assets are only entered in the balance sheet if the acquisition cost of the asset can be reliably determined and if it is probable that the expected economic benefit from the asset will flow to the company.
Intangible assets with a limited useful life are recognised as expenses based on straight-line depreciation in the income statement during their known or estimated useful life. Intan-gible assets with indefinite useful lives are not amortised, but instead tested annually for impairment.
Depreciation periods:Customerrelationships 3–8yearsTrademarks 5–10yearsOtherintangibleassets 5–10years
impairmentOneachbalancesheetdate,theGrouptestsintangibleandtangible assets to see whether they show indications of impairment. If there are such indications, the recoverable amount from the said asset is estimated. The recoverable amount is estimated annually for goodwill and intangible as-sets with indefinite useful lives. The need for impairment is reviewed at the level of cash-generating units, that is, the low-est unit level that is largely independent of other units, and whose cash flow can be separated from other cash flows. The recoverable amount is the fair value of the asset less costs to sell or, if higher, the asset’s value in use. Value in use is the esti-mated future net cash flow from the asset or cash-generating unit, which cash flow is discounted to its present value. The discount rate used is the pre-tax rate, which describes the market’s view of the time value of money and the particular risks associated with the asset.
Impairment losses are recognised when the book value of the asset is higher than the recoverable amount. Impairment losses are recognised immediately in the income statement. If the impairment loss is allocated to a cash-generating unit, it is first allocated to reduce the goodwill of the cash-generating unit and then to reduce the other assets of the unit pro rata. The useful life of the amortised asset is re-evaluated in con-junction with the recognition of an impairment loss. An im-pairment loss recognised for an asset other than goodwill is
reversed if there has been a change in the estimates used to determine the recoverable amount from the said asset. How-ever, the impairment loss may not be reversed in excess of what the asset’s book value would be without the recogni-tion of the impairment loss. An impairment loss recognised for goodwill is never reversed.
inventoriesInventories are valued at the direct acquisition cost, or at probable net realisation value below this. The direct acquisi-tioncostisdeterminedusingtheFIFOmethod.Theacquisi-tion cost for finished and unfinished products consists of raw materials, direct labour costs, other direct costs, and the ap-propriate share of manufacturing-related overhead and fixed overhead at a normal level of operations. The net realisation value is the estimated selling price in the ordinary course of business, less the estimated costs for completing the prod-uct and costs related to sales. Biological assets included in in-ventories are valued at fair value, less estimated sales-related costs.
biological assets The Group’s biological assets are live animals and growing crops. Biological assets are valued at fair value, less estimated sales-related costs. Productive animals are included in other tangible assets and other biological assets are included in in-ventories.
Financial assets and liabilities
Financial assets:The Group divides its financial assets into the following groups: financial assets recognised at fair value through profit or loss, loans and other receivables, and as financial assets available for sale. The classification is made on the basis of the purpose of the acquisition, and the assets are classified in connection with the original acquisition.
Financial assets recognised at fair value through profit or lossA financial asset belongs to this group if it has been acquired for trading purposes or if it has been initially recognised at fair value through profit or loss. Financial assets held for trad-ing are acquired mainly to generate profit from changes in short-term market prices. Since the derivatives used by the company do not fulfil the hedge accounting conditions in IAS
65

n o t e s t o t h e c o n s o l i d a t e d F i n a n c i a l s t a t e M e n t s
39, they have been classified as held for trading. Unrealised and realised profits and losses due to changes in fair value are recognised in the income statement in the accounting period in which they occur.
Loans and other receivables Loans and other receivables are non-derivative assets which involve payments that are fixed or determinable, which are not noted on active markets and which the company does not hold for trading. This group contains the Group’s financial assets generated by handing over cash, articles or services to debtors. They are measured at amortised cost and included in current and non-current financial assets; in the latter if they mature after more than 12 months.
Financial assets available for saleAvailable-for-sale financial assets are non-derivative assets, which have been prescribed to this group or which have not been prescribed to any other group. They are included in non-current assets unless they are intended to be kept for less than 12 months from the balance sheet day, in which case they are included in current assets. Financial assets available for sale may consist of equity and interest-bearing investments. They are measured at fair value or, when the fair value cannot be reliably determined, at acquisition cost. Changes in the fairvalue of available-for-sale financial assets are entered in equity in the value adjustment reserve, taking into consideration the taxeffect.Changes in fairvalueare transferred fromequityto the profit and loss account when the investment is sold or its value has decreased so that an impairment loss must be recognised for the investment.
Cash and cash equivalents:Cashandcashequivalentsconsistofcash,bankdepositsthatcan be withdrawn on demand and other short-term highly liq-uid investments. Items classified as cash and cash equivalents have a maximum maturity of three months from acquisition. Available credit limits are included in current interest-bearing liabilities.
Financial assets are derecognised when the Group has lost its agreement-based right to the cash flow or it has transferred a significant share of the risks and income outside the Group.
Financial liabilities:Financial liabilities are initially recognised at fair value. They are later measured at amortised cost using the effective inter-
est method. Financial liabilities are included in current and non-current liabilities.
Impairment of financial assets:On each balance sheet date, the Group estimates whetherthere is objective proof of impairment of an individual finan-cial asset or a financial asset group.
An impairment loss is recognised for accounts receivable when the receivable is estimated to have been lost. If the im-pairment loss decreases in a later accounting period, and the reduction can be objectively linked to a transaction that has taken place after the recognition of the impairment loss, the recognised loss is reversed through profit or loss.
derivative financial instruments Derivative instruments are initially recognised at fair value on the day the Group becomes a contracting party and they continue to be recognised at fair value later on. The account-ing treatment of gains and losses resulting from fair value recognition depends on the purpose of use of the derivative instrument.
The Group has not applied hedge accounting in accord-ance with IAS 39.
revenue recognitionNet sales include profits from the sale of products and serv-ices, as well as raw materials and equipment, adjusted by indi-rect taxes, discounts and exchange rate differences in foreign currency denominated sales.
Goods and services:Revenue from the sale of articles is recognised when the risks and rewards of owning the article have been transferred to the buyer. Revenue from services is recognised when the service has been completed.
Interest and dividends:Interest rates are recognised based on the passing of time, taking into account the effective income from the asset. Divi-dend income is recognised when the shareholders’ right to payment is established.
employee benefits
Pension obligations:Pension arrangements are classified as either defined benefit
66

or defined contribution plans. In defined contribution plans, the Group makes fixed payments into a separate unit. The Group has no legal or constructive obligation to make addi-tional payments, if the recipient of the payments cannot pay the pension benefits in question. All plans that do not fulfil these conditions are defined benefit pension plans. Payments made into defined contribution plans are recognised in the income statement in the accounting period to which they apply. The Group’s pension plans are mainly defined contri-bution plans.
Share-based payments:The Group has an incentive programme for the management where the payments are made in part as company shares, and in part as money. The benefits granted under the programme are measured at fair value at the time of payment and recog-nised in the income statement as an expense from employee benefits evenly throughout the earnings and engagement period. The amount of money paid in the arrangement is remeasured using the share price at the balance sheet date and recognised in the income statement as an expense from employee benefits evenly from the day of granting until the money is transferred to the recipient.
ebitIAS 1 Presentation of Financial Statements does not define the concept of EBIT. The Group has defined it as follows: EBIT is a net total, which can be calculated by adding other op-erating income to net sales, subtracting purchase expenses adjusted by the change in the stock of finished and unfinished products as well as expenses caused by production for own use, subtracting expenses from employee benefits, deprecia-tion and potential impairment losses, as well as other operat-ing expenses. All but the above-mentioned income statement items are entered below EBIT.
income taxesThe tax expense in the income statement consists of current tax, tax adjustments from previous accounting periods, and deferred tax. The tax expense is recognised in the income statement, except for items recognised directly in equity, in which case the tax effect is correspondingly recognised in equity.Currenttaxiscalculatedfromtaxableprofitbasedonthe valid tax rate of each country. The tax is adjusted by pos-sible taxes related to previous periods.
Deferred tax is calculated from all temporary differences
between the book value and tax base. The biggest temporary differences arise from the depreciation of tangible fixed as-sets and fair value measurement in connection with acquisi-tions. No deferred tax is recognised for non-deductible good-will impairment, and no deferred tax is recognised for the undistributed profits of subsidiaries if the difference is not likely to dissolve in the foreseeable future.
Deferred tax is calculated using the tax rates provided on the balance sheet date. Deferred tax assets are recognised to the amount for which it is likely that taxable profit will be generated in the future against which the temporary differ-ence can be utilised.
accounting policies calling for judgments by the management and key sources of estimation uncertaintyWhen preparing the financial statements, the management must make assessments and assumptions concerning the fu-ture, whose outcome may deviate considerably from the orig-inal assessments and assumptions. In addition, deliberation must be used in applying the accounting policies. The assess-ments are based on the management’s view at the balance sheet date. Any changes in the assessments and assumptions are entered in the accounting period in which the assessment or assumption is adjusted and in all subsequent accounting periods.
The key assumptions concerning the future and key sources of estimation uncertainty on the balance sheet date that constitute a significant risk of causing changes to the book values of assets and liabilities in the following account-ing period include the following:
Measurement of the fair value of assets acquired in business combinations:In significant business combinations, the Group has used an external advisor when measuring the fair value of tangible and intangible assets. In the case of tangible assets, compari-sons have been made with the market price of corresponding assets, and the assets have been tested for impairment caused by their age, wear and other similar factors. The fair value of intangible assets is determined based on assessments of as-set cash flows. The management believes that the assessments and assumptions are sufficiently detailed to be used as the basis for fair value measurement.
Impairment testing:The Group conducts annual impairment tests on goodwill and
67

n o t e s t o t h e c o n s o l i d a t e d F i n a n c i a l s t a t e M e n t s
intangible assets with indefinite useful lives. It also assesses any indication of impairment in accordance with the above-mentioned accounting policies. The recoverable amounts of cash-generating units are defined on the basis of value-in-use calculations. These calculations require the use of estimates.
Emission rights:Emission rights are intangible assets that are measured at ac-quisition cost. The book value of gratuitous transfers of emis-sion rights is zero. In order to cover the return obligation of emission rights, a loan is recorded if the free emission rights donotcovertheobligationsarisingfromactualemissions.Onthe balance sheet date, the loan is estimated at probable value at the time the obligation is realised. The difference between obligations from actual emissions and the value of emission rights received, as well as changes in the probable value of the loan, are included in EBIT.
application of new or revised iFrs standards and iFric interpretationsThe following new or revised standards and interpretations, published by the IASB, have not yet taken effect and have not been adopted by the Group. The Group will adopt each stand-ard and interpretation as of the effective date or, should the effective date not be the first date of an accounting period, as of the beginning of the following accounting period.
In 2009 the group will adopt the following standards pub-lished by the IASB:• IAS23BorrowingCosts(amendedin2007andeffectiveas
of1January2009). The amended standard requires that the borrowing costs related to qualifying assets are capitalised as part of the acquisition cost of the assets. These costs can no longer be recognised as expenses. As was previously allowed, the Group has recognised borrowing costs as an expense in the accounting period in which they arise.
• IAS 1 Presentation of Financial Statements (amendedin2007andeffectiveasof1January2009). The aim of the re-vision is to improve the ability of users to analyse and com-pare the data provided in financial statements by separat-ing changes in equity related to transactions with company owners from other changes in equity. The revision will also lead to comprehensive modifications to the terminology used in other standards and to changes in the titles of some financial statements.
• IFRS 8, Operating Segments (effective as of 1 January
2009). The standard replaces IAS 14. It requires segment information to be presented using the “management ap-proach”, which means that data is presented in the same way as in internal reporting. The new standard will not af-fect significantly the information provided on segments, since the segment information previously published by the Group was based on internal reporting.
• IFRIC 13, Customer Loyalty Programmes (effective inaccounting periods beginning on or after 1 July 2008). The interpretation defines business transactions in which products and services are sold in a way that encourages customer loyalty as sales agreements that contain separa-ble parts. Customer payments are allocated to the differ-ent components of the sales agreement based on their fairvalue.TheIFRIC13interpretationhasnoeffectontheGroup’s financial statements as the Group companies have no loyal customer programmes.
• AmendmenttoIFRS2Share-Based Payment –VestingCon-ditionsandCancellations(effectiveasof1January2009).The revision requires that all non-vesting conditions be tak-en into consideration when determining the fair value of equity instruments. The amendment also clarifies the guide-lines for cancellations. The interpretation does not have a material impact on the consolidated financial statements.
• Amendments to IAS 1 Presentation of Financial State-ments and IAS 32 Financial Instruments: Presentation – Puttable Financial Instruments and ObligationsArisingonLiquidation(effectiveasof1January2009).Theamend-ments require qualifying puttable instruments to be pre-sented as equity instead of being classified as liabilities, as has been the case to date. The implementation of the re-vised standards is not expected to have an impact on the Group’s future financial statements.
• Improvements to IFRSs (Annual Improvements 2007)(mostlyeffectiveinperiodsbeginningonorafter1January2009).IntheAnnualImprovementsprocess,minorandlessurgent amendments to standards are compiled and imple-mented once a year. The process includes amendments to a total of 34 standards. The impact of the amendments vary depending on the standard, but the Group does not expect the changes to have a material impact on the consolidated financial statements.
• AmendmentstoIFRS1First-time Adoption of Internation-al Financial Reporting Standards and IAS 27 Consolidat-ed and Separate Financial Statements–CostofanInvest-mentinaSubsidiary,JointlyControlledEntityorAssociate
68

(effectiveinperiodsbeginningonorafter1January2009).Since the amendments apply to first-time adopters, they will not have an impact on future consolidated financial statements.
• IFRIC11,IFRS2:GroupandTreasuryShareTransactions. The interpretation clarifies the handling of own shares or operations related to Group companies in the financial statements of parent companies and Group companies by issuing guidelines for their classification into equity-settled or cash-settled share-based transactions. The interpretation does not have a material impact on the consolidated finan-cial statements.
• IFRIC14,IAS19–TheLimitonaDefinedBenefitAsset,Minimum Funding Requirements and their Interaction. The interpretation is applied to post-employment defined benefit plans and certain long-term defined benefit plans in compliance with IAS 19 when the plan involves minimum funding requirements. The interpretation also clarifies the recognition requirements of economic benefits available in the form of refunds from the plan or reductions in future contributions to the plan. The implementation is not ex-pected to have a material impact on future consolidated financial statements.
• IFRIC15AgreementsfortheConstructionofRealEstate(effectiveinperiodsbeginningonorafter1January2009).The interpretation provides guidance on how to determine what standard to apply when recognising revenue from real estate construction and when revenue from a construction project can be recognised. The interpretation will not affect future consolidated financial statements, since the Group is not active in the construction business.
• IFRIC16Hedges of a Net Investment in a Foreign Opera-tion(effectiveinperiodsbeginningonorafter1October2008).The interpretationclarifies the treatmentofhedgeaccounting of a net investment. According to it, hedge ac-counting can be applied to currency risks that arise from differences between the functional currencies of a foreign operation and the parent company but not to risks arising from differences between presentation currencies. Moreo-ver, the hedging instrument may be held by any entity in the group. The provisions of IAS 21 TheEffectsofChangesinForeignExchangeRatesapply to the hedged item. The GroupadoptedIFRIC16on1January2009.Theinterpre-tation is not expected to affect the consolidated financial statements.
In 2010 the group will adopt the following standards pub-lished by the IASB:• IFRS3BusinessCombinations(amendedin2008andef-
fectiveinperiodsbeginningonorafter1July2009). The re-vised standard still requires the use of the purchase method when accounting for business combinations but with some considerable changes. For example, all payments related to company acquisitions must be recognised at fair value at the time of acquisition and certain contingent considera-tions are measured at fair value through profit or loss after acquisition. Goodwill can be calculated based on the par-ent company’s share of net assets or it can include goodwill allocated to the minority interest. All transaction costs are entered as expenses. According to the transition require-ments, business combinations with an acquisition date pri-or to the date of obligatory adoption of the standard need not be restated.
• IAS27ConsolidatedandSeparateFinancialStatements(amendedin2008andeffectiveinperiodsbeginningonorafter1July2009). The amended standard requires that all minority transactions are recognised in equity if control is not transferred. Thus, minority transactions no longer lead to recognition of goodwill or a loss or profit affecting earn-ings. The standard also defines the treatment of transactions when control is lost. The possible remaining share in the acquisition object is measured at fair value and the result-ing profit or loss is recognised through profit or loss. This accountingmethodwill alsoapply toassociates (IAS28)andjointventures(IAS31).Asaresultoftheamendment,the losses of a subsidiary can be allocated to a minority even if they exceed the amount of minority interest.
• AmendmenttoIAS39Financial Instruments; Recognition and Measurement–EligibleHedgedItems(effectiveinpe-riodsbeginningonorafter1July2009).Theamendmentsconcern hedge accounting. Since the Group does not use hedge accounting, the amendment will not affect its future consolidated financial statements.
• IFRIC 12, Service Concession Arrangements. The inter-pretation applies to arrangements where a private party is involved in the development, funding, implementation or infrastructure maintenance of public services. The inter-pretation will not affect future consolidated financial state-ments.
69

n o t e s t o t h e F i n a n c i a l s t a t e M e n t s
1. TANGIBLE ASSETS, EUR 1,000
Land and water
Buildings and structure
Machinery and equipment
Other tangibleassets
Unfinishedacquisitions Total
Acquisition cost, 1 Jan 2008 7,766 368,385 440,469 3,490 44,978 865,088Business combinations 29 38,660 33,809 5,601 3,750 81,849Increases 44 24,048 45,167 2,683 25,262 97,204Decreases -10,803 -16,149 -947 -23,088 -50,987Exchange difference -444 -6,887 -25,259 -59 -4,842 -37,491Acquisition cost, 31 Dec 2008 7,395 413,403 478,037 10,768 46,060 955,663
Accumulated depreciation andimpairment, 1 Jan 2008 -139,450 -268,811 -1,203 -409,464Business combinations -7,424 -22,773 -3,655 -33,852Decreases 2,431 4,435 55 6,921Depreciation -10,970 -33,624 -671 -45,265Impairment -400 -400Exchange difference 3,233 16,667 59 19,959Accumulated depreciation andimpairment, 31 Dec 2008 -152,580 -304,106 -5,415 -462,101
Book value, 1 Jan 2008 7,766 228,935 171,658 2,287 44,978 455,624Book value, 31 Dec 2008 7,395 260,823 173,931 5,353 46,060 493,562
Land and water
Buildings and structure
Machinery and equipment
Other tangibleassets
Unfinishedacquisitions Total
Acquisition cost, 1 Jan 2007 5,778 296,265 325,155 3,148 39,815 670,161Business combinations 2,028 42,035 78,559 863 123,485Increases 61 31,288 52,601 844 50,252 135,046Decreases -7 -573 -13,418 -491 -45,764 -60,253Exchange difference -94 -630 -2,428 -11 -188 -3,351Acquisition cost, 31 Dec 2007 7,766 368,385 440,469 3,490 44,978 865,088
Accumulated depreciation andimpairment, 1 Jan 2007 -111,506 -194,742 -1,143 -307,391Business combinations -18,668 -51,561 -70,229Decreases 112 6,765 159 7,036Depreciation -9,615 -30,592 -224 -40,431Exchange difference 227 1,319 5 1,551Accumulated depreciation andimpairment, 31 Dec 2007 -139,450 -268,811 -1,203 -409,464
Book value 1 Jan, 2007 5,778 184,759 130,413 2,005 39,815 362,770Book value 31 Dec, 2007 7,766 228,935 171,658 2,287 44,978 455,624
Assets acquired with finance lease contracts are included in machinery and equipment; book value of assets was EUR 3.4 million (EUR 11.9 million).
Non-current assets held for sale 2008 2007
Buildings 10 687Machinery and equipment 570Totalt 11 257
70

Continues on next page »
2. GOODWILL AND OTHER INTANGIBLE ASSETS, EUR 1,000
Intangible assets GoodwillTrade-marks
Otherintangible
assets Total
Acquisition cost, 1 Jan 2008 168,829 60,241 17,809 246,879Business combinations 18,386 12,164 2,320 32,870Increases 1,778 1,778Decreases -5,560 -5,560Exchange difference -20,924 -4,882 -177 -25,983Acquisition cost, 31 Dec 2008 166,291 67,523 16,170 249,984
Accumulated depreciation and impairment, 1 Jan 2008 -17,019 -2,356 -11,447 -30,822Business combinations -1,066 -1,066Depreciation on decreases 3,843 3,843Depreciation -531 -2,177 -2,708Exchange difference 1,782 366 174 2,322Accumulated depreciation, 31 Dec 2008 -15,237 -2,521 -10,673 -28,431
Book value, 1 Jan 2008 151,810 57,885 6,362 216,057Book value, 31 Dec 2008 151,054 65,002 5,497 221,553
Intangible assets GoodwillTrade-marks
Otherintangible
assets Total
Acquisition cost, 1 Jan 2007 74,918 31,860 13,210 119,988Business combinations 95,071 49,142 2,998 147,211Increases 5 1,696 1,701Decreases -19,669 -93 -19,762Exchange difference -1,160 -1,097 -2 -2,259Acquisition cost, 31 Dec 2007 168,829 60,241 17,809 246,879
Accumulated depreciation and impairment, 1 Jan 2007 -17,265 -5,046 -6,707 -29,018Business combinations -2,516 -2,516Depreciation on decreases 3,570 50 3,620Depreciation -997 -2,274 -3,271Exchange difference 246 117 363Accumulated depreciation, 31 Dec 2007 -17,019 -2,356 -11,447 -30,822
Book value 1 Jan, 2007 57,653 26,814 6,503 90,970Book value 31 Dec, 2007 151,810 57,885 6,362 216,057
Targeting of goodwill
Targeting of goodwill and trademarks, whose Goodwill Trademarksuseful life is estimated to be unlimited 2008 2007 2008 2007
Atria Finland 3,722 3,722Atria Scandinavia 124,524 130,134 48,666 47,874Atria Russia 10,746 12,054 5,188 5,952Atria Estonia 12,062 5,900 3,935 2,857Total 151,054 151,810 57,789 56,683
71

n o t e s t o t h e F i n a n c i a l s t a t e M e n t s
» Continued from previous page
Impairment testing
The recoverable amounts of units that generate cash flow are based on useable value calculations. Future cash flow in these calculations is based on financial plans approved by Group management, which extend over a five-year period. Key variables used in the useable value calculations are earnings from sales, material margin and EBIT, which are defined based on the realised figures from previous years and the five-year plan.
The discount rate used, defined before taxes, is 6.0% (5.6%) in Finland, 6.1% (5.6%) in Scandinavia, 10.8% (9.9%) in Russia and 8.1% (5.6%) in Baltic.
The discount rate before taxes is defined with the help of the weighted average cost of capital (WACC). Cash flow after the forecast period approved by the management was extrapolated using a growth factor of 5% in Russia and 1% elsewhere. The growth factor used does not exceed the long-term realised growth in the industry.
Based on impairment testing, there was no need for any impairment.
On the basis of the sensitivity analyses of impairment testing, significant future impairment losses are not foreseen.
3. INVESTMENTS IN JOINT VENTURES AND ASSOCIATES, EUR 1,000
Investments in joint ventures and associates 2008 2007
In joint ventures:At the beginning of the period 746 524Share of earnings for the period 143 -105Increases 354Dividends received -27At the end of the period 889 746
In associates:At the beginning of the period 4,982 4,472Share of earnings for the period 430 488Other changes -95 120Dividends received -69 -98At the end of the period 5,248 4,982
Total 6,137 5,728
Joint ventures andassociates Domicile Assets Liabilities Net sales
Profit/Loss
Ownershipinterest (%)
2008
Best-In Oy Kuopio 1,693 925 4,778 64 50.0Findest Protein Oy Kaustinen 3,862 2,343 4,470 63 16.6Finnpig Oy Group Seinäjoki 2,467 2,001 2,771 142 50.0Foodwest Oy Seinäjoki 996 278 1,783 15 33.5Honkajoki Oy Group Honkajoki 12,944 9,233 18,298 428 47.8OÜ LKT Invest Valga Estonia 11 3 26.0LTK Co-operative Hämeenlinna 9,648 2,077 23,735 505 40.7Länsi-Kalkkuna Oy Säkylä 3,647 3,148 27,039 79 50.0Tuoretie Oy Helsinki 6,454 5,526 48,367 23 33.3
2007
Best-In Oy Kuopio 1,083 378 4,610 143 50.0Findest Protein Oy Kaustinen 4,201 2,913 3,775 112 40.6Finnpig Oy -konserni Seinäjoki 2,854 1,909 2,033 -371 50.0Foodwest Oy Seinäjoki 891 187 1,625 27 33.5Honkajoki Oy Honkajoki 10,248 7,586 16,204 190 47.8OÜ LKT Invest Valga Estonia 11 3 26.0LTK osuuskunta Hämeenlinna 9,225 1,982 22,149 834 40.7Länsi-Kalkkuna Oy Säkylä 3,406 2,986 22,952 9 50.0Tuoretie Oy Helsinki 6,646 5,741 45,111 1 33.3
72

Continues on next page »
4. OTHER FINANCIAL ASSETS, EUR 1,000
2008 2007
Investments available for sale 2,111 2,959
Includes unquoted and quoted shares in euro.
A sales gain of EUR 1.7 million from available-for-sale financial assets was recognised in financial income.Changes in fair value are presented in the consolidated statement of changes in equity.
5. LOAN ASSETS AND OTHER NON-CURRENT RECEIVABLES, EUR 1,000
Balance sheet values
2008
Balance sheet values
2007
Loan assets 9,302 11,744Other receivables 6,157 346Accrued credits and deferred charges 2Total 15,461 12,090
Long-term receivables were divided into currencies as follows:
EUR 9,345 11,787SEK 527 303RUR 5,589Total 15,461 12,090
Fair values do not deviate significantly from balance sheet values.
6. DEFERRED TAx ASSETS AND LIABILITIES, EUR 1,000
Changes to deferredtaxes in 2008 1 Jan 2008
Booked in the income
statementExchange difference
Acquired/Sold
subsidiaries 31 Dec 2008
Deferred tax assets:Internal margin of inventories 213 -213 0Confirmed losses 386 386Benefit-based pension obligations 65 -32 33Depreciation differences and voluntary provisions 347 939 -45 1,241Other items 443 18 73 534Total 1,068 1,098 -45 73 2,194
Deferred tax liabilities:Valuation of tangible and intangible assetsat fair value upon acquisition -14,949 1,293 1,536 -4,364 -16,484Depreciation differences and voluntary provisions -27,817 -73 1,777 -120 -26,233Other items 393 45 -121 317Total -42,766 1,613 3,358 -4,605 -42,400
Changes to deferredtaxes in 2007 1 Jan 2007
Booked in the income
statementExchange difference
Acquired/Sold subsidiaries 31 Dec 2007
Deferred tax assets:Internal balance of inventories 31 182 213
73

n o t e s t o t h e F i n a n c i a l s t a t e M e n t s
» Continued from previous page
Changes to deferredtaxes in 2007 1 Jan 2007
Booked in the income
statementExchange difference
Acquired/Sold subsidiaries 31 Dec 2007
Benefit-based pension obligations 88 -23 65Depreciation differences and voluntary provisions 3 346 -2 347Changes in fair value 377 -380 3 0Other items -1,018 28 1,433 443Total 499 -893 29 1,433 1,068
Deferred tax liabilities:Valuation of tangible and intangible assetsat fair value upon acquisition -6,938 76 68 -8,155 -14,949Depreciation differences and provisions -19,968 2,100 -10 -9,939 -27,817Total -26,906 2,176 58 -18,094 -42,766
7. INVENTORIES, EUR 1,000
2008 2007
Materials and supplies 37,203 27,491Biological assets 6,156 2,872Unfinished products 17,988 14,560Finished products 48,871 41,894Other inventories 3,047 496Total 113,265 87,313
8. TRADE AND OTHER CURRENT RECEIVABLES, EUR 1,000
2008 2007
Trade receivables 186,734 166,358Loan assets 386 4,496Deferred tax assets 443Other receivables 21,085 4,722Accrued credits and deferred charges 16,961 6,487Total 225,166 182,506
Financial assets at fair value through profit or lossDerivative instruments - not in hedge accounting 6,655 2,244
Total 231,821 184,750
Trade receivables include EUR 45 million of feed and animal trading receivables from animal payments. Other trade receivables are mainly from retail chains and do not involve considerable credit risk accumulation. Material items in accrued credits and deferred charges consist of prepaid expenses of purchase invoices, lease receivables and tax amortisations.
Breakdown of trade receivables and items booked as credit losses: 2008 Credit losses Net 2008
Not due 158,810 158,810Overdue
Less than 30 days 21,073 -1,097 19,97630 - 60 days 2,478 -179 2,29961 - 90 days 1,157 -32 1,125
More than 90 days 6,347 -1,823 4,524
Total 189,865 -3,131 186,734
74

Continues on next page »
Breakdown of trade receivables and items booked as credit losses: 2007 Credit losses Net 2007
Not due 139,722 139,722Overdue
Less than 30 days 18,881 18,88130–60 days 1,991 -5 1,98661–90 days 1,376 -196 1,180
More than 90 days 5,307 -718 4,589
Total 167,277 -919 166,358
Current receivables were divided into currencies as follows: 2008 2007
EUR 132,743 112,437SEK 50,023 51,072RUR 37,035 10,191DKK 5,860 4,605PLN 687 2,968EEK 3,986 2,393USD 1,389 1,068Other 98 16
Total 231,821 184,750
9. CASH AND CASH EQUIVALENTS, EUR 1,000
2008 2007
Cash in hand and at banks 37,138 35,592
10. SHAREHOLDERS' EQUITY, EUR 1,000
Shares and share capital
Shares are divided into A and KII series, which differ in terms of voting rights. The A series shares have one vote per share and the KII series shares have ten votes per share. The A series shares have preference to a 10 per cent dividend on the nominal value of the share, after which the KII series shares are paid a dividend of up to 10 per cent of the nominal value. If there is still more dividend available for distribution, A and KII series shares have the same entitlement to the dividend. The nominal value of the shares is EUR 1.70 per share. All issued shares have been paid in full.
The number of shares outstanding is (1,000) A series KII series Total
1.1.2007 13,889 9,204 23,093Share issue, 18 May 2007 and 30 May 2007 5,175 5,17531.12.2007 19,064 9,204 28,268
31.12.2008 19,064 9,204 28,268
Reserves included in shareholders’ equity:
Share premium:The portion of share subscription payments recognised in share premium in compliance with the conditions of plans prior to the new Companies Act (21.7.2006/624) taking effect.
Treasury shares:The treasury shares reserve contains the acquisition cost of own shares held by the Group.In 2008, the Group’s parent company, Atria Plc, acquired 82,417 shares on the stock exchange for an acquisition cost of EUR 0.9 million. Of the acquired shares, 35,260 were transferred to key persons as a part of the Group’s share incentive plan.
75

n o t e s t o t h e F i n a n c i a l s t a t e M e n t s
» Continued from previous page
11. SHARE-BASED PAYMENTS, EUR 1,000
On 27 June 2007, Atria Group Plc's Board of Directors decided to introduce a share-based bonus system as part of the incentive plan for the Company's and its subsidiaries' key persons. The purpose is to combine the shareholders' and key persons' goals to increase the Company's value and to commit the key persons to the Company by offering them a competitive bonus plan based on the ownership of the Company's shares. The plan consists of three 12-month accrual periods that begin on 1 January 2007, 1 January 2008 and 1 January 2009, all ending on 31 December in the respective years. The amount of the bonus for the accrual period is determined on the basis of the goals achieved after the accrual period by the end of April. For the entire plan, a maximum of 300,300 shares and the amount in money needed to cover the taxes and tax-like payments incurred by the shares at the date of the share issue are issued. The Board of Directors will decide on the plan's accrual criteria and on the goals to be set annually and separately for each ac-crual period. The shares earned on the basis of the plan may not be transferred or otherwise used for a period of two years from the end of the accrual period (period of commitment). Key persons must return to the Company without delay the shares paid out gratuitously as a reward if their employment with a company belonging to the Group ends during the period of commitment.
Earnings periods 2008 2007
Grant date 14 Feb 2008 27 Jun 2007Earnings period begins 1 Jan 2008 1 Jan 2007Earnings period ends 31 Dec 2008 31 Dec 2007Maximum number of shares granted as remuneration 100,100 100,100Share release 31 Dec 2010 31 Dec 2009Number of people 42 36Earnings criteria: - Operative EBIT % 50% 50% - ROCE 50% 50%Achievement of earnings criteria, % 0% 43%
Number of share incentives granted 0 35,260Share price at grant date, € 15.30 25.22Share price at balance sheet date, € 11.60 17.35
Fair value reserve:Changes in the fair value of available-for-sale financial assets are recognised in the fair value reserve.
Invested unrestricted equity fund:This reserve contains other equity investments and the share subscription price to the extent that it is not recognised in share capital according to a separate decision, as well as the value of shares earned on the basis of the share incentive plan, calculated at the rate of the grant date.
Translation differences:This reserve contains the translation differences from the translation of the financial statements of foreign subsidiaries, as well as the translation of fair value adjustments of goodwill, assets and liabilities arising in conjunction with the acquisition of the said companies.
Parent company’s distributable shareholders’ equity 2008 2007
Retained earnings 51,781 46,488Own shares -542Profit for the period 23,293 25,080Total 74,532 71,568
Dividend per share paid for the period 2008 2007
Dividend/share, EUR 0.70 0.595Dividend distributed by the parent company 19,787 13,740
The Board of Directors proposes to the Annual General Meeting, which will be held in 29 April 2009, that the Company pay EUR 0.20 per share in divi-dend, total of EUR 5,653,546.
76

Continues on next page »
Impact of share incentive plan on the results for the period 2008 2007
Impact of the scheme on the profit for the period 272 903Liabilities from the cash payments of the share-based scheme 221 642
12. INTEREST-BEARING FINANCIAL LIABILITIES, EUR 1,000
2008 2007Balance sheet values Balance sheet values
Non-current financial liabilities valued at amortised cost
Bonds 80,000 90,000Loans from financial institutions 195,614 82,160Pension funds loans 40,107 4,582Other liabilities 3,000 6,954Finance lease obligations 2,091 10,385Total 320,812 194,081
Current financial liabilities valued at amortised cost
Bonds 10,000 10,000Loans from financial institutions 45,434 77,165Commercial papers 64,800 30,000Pension fund loans 2,857 21Other liabilities 3,349 7,859Finance lease obligations 1,148 2,744Total 127,588 127,789
Total interest-bearing liabilities 448,400 321,870
With fixed interest rates 24.6 % 17.5 %With variable interest rates 75.4 % 82.5 %Average interest rate 4.86% 4.52%
Non-current liabilities mature as follows: 2008 2007
2009 28,3512010 30,698 20,5562011 30,800 8,0502012 124,752 6,2472013 77,933 75,1502014 44,498Later 12,131 55,727Total 320,812 194,081
Interest-bearing liabilities are divided into currencies as follows: 2008 2007
EUR 229,675 106,073SEK 156,066 149,957DKK 25,169 25,649RUB 2,626 15,198EEK 30,730 20,902USD 2,155 4,091LTL 1,979Total 448,400 321,870
The 2007 comparative information on EUR, SEK and EEK has been adjusted to comply with the 2008 calculation method, which indicates the amount of interest-bearing liabilities by currency, taking into account currency swap agreements.
77

n o t e s t o t h e F i n a n c i a l s t a t e M e n t s
» Continued from previous page
Finance lease obligations - total amount of minimum lease payments 2008 2007
In less than a year 1,080 3,221Between one and five years 2,346 8,532After five years 3,249Total 3,426 15,002
Finance lease obligations - present value of minimum lease payments 2008 2007
In less than a year 1,148 2,744Between one and five years 2,091 7,321After five years 3,064Total 3,239 13,129
Future interest accumulation 187 1,873Total 3,426 15,002
13. TRADE AND OTHER PAYABLES, EUR 1,000
2008 2007
Non-current financial liabilities measured at amortised costPension obligations 129 252Other liabilities 25Total 154 252
Current financial liabilities valued at amortised costTrade payables 117,103 79,315Advances received 955 510Other liabilities 39,435 24,878Accrued liabilities 49,738 52,448
Current financial liabilities at fair value through profit or lossDerivative instruments - not in hedge accounting 648 101
Total 207,879 157,252
Significant items in accrued liabilities consist of personnel costs and the amortisation of debt interests.
Non-current liabilities consist of the following currencies: 2008 2007
EUR 129 252EEK 25Total 154 252
Current liabilities were divided into currencies as follows: 2008 2007
EUR 102,956 86,719SEK 57,050 51,327RUR 19,932 7,276EEK 6,122 3,988DKK 5,922 3,623LTL 16 1,596PLN 259 1,516USD 15,565 1,205GBP 7 2Total 207,829 157,252
78

Continues on next page »
14. SEGMENT INFORMATION, EUR 1,000
The Group’s primary segment reporting uses geographical segments defined on the basis of the Group’s internal organisation structure and internal financial reporting. The Group has four recognisable geographical segments that differ essentially from one another in terms of the functioning of the markets. They are Atria Finland, Atria Scandinavia, Atria Russia and Atria Baltics. In addition, Group costs are reported separately in unallocated items. Group costs mainly consist of personnel and administration costs as well as costs arising from the share-based payment plan. A segment’s assets and liabilities are items that can be directly attributed or reasonably allocated to the segment. Since Atria’s withdrawal from wholesale trade in Sweden in 2007 the Group has had only one business segment: the meat industry. Inter-segment transactions are carried out at market price.
Accounting period that ended on 31 Dec 2008 Geographical segments Finland Scandinavia Russia Baltics Unallocated Eliminations Group
Net salesExternal 781,873 448,933 93,849 32,281 1,356,936Internal 16,017 6,269 -22,286 0Total net sales 797,890 455,202 93,849 32,281 -22,286 1,356,936
EBIT 33,870 14,403 -3,374 -3,815 -2,667 38,417Financial income and expenses -22,317Income from joint ventures and associates 573 573Income taxes -5,260Profit for the period 11,413
AssetsSegment assets 527,448 368,478 187,185 68,556 -23,305 1,128,362Investments in joint ventures and associates 6,135 2 6,137Total assets 533,583 368,478 187,185 68,558 -23,305 1,134,499
Liabilities 263,706 268,252 144,091 44,309 -20,729 699,629
Investments 23,856 41,783 68,587 18,411 152,637Depreciation 29,353 11,706 3,246 2,761 47,066Impairment 400 55 14 469
Accounting period that ended on 31 Dec 2007 Geographical segments Finland Scandinavia Russia Baltics Unallocated Eliminations Group
Net salesExternal 731,644 448,263 65,566 26,714 1,272,187Internal 17,927 9,561 17 -27,505 0Total net sales 749,571 457,824 65,566 26,731 -27,505 1,272,187
EBIT 43,128 54,941 4,319 -4,353 -3,489 94,546Financial income and expenses -14,325Income from joint ventures andassociates 384 384Income taxes -12,960Profit for the period 67,645
79

n o t e s t o t h e F i n a n c i a l s t a t e M e n t s
» Continued from previous page
15. ACQUIRED OPERATIONS
2008 Acquisition dateOwnership
share, % Domicile
AB Ridderheim & Grönvall 1 Jul 2008 100 SwedenSubsidiaries: Ridderheims Delikatesser AB 100 Sweden Smakfabriken i Göteborg AB 100 Sweden KB Joddlaren 100 SwedenRidderheims Delikatesser i Norge AS 1 Jul 2008 100 Norway
Atria Scandinavia's strategy is to focus on products with a higher degree of processing. The acquisition of Ridderheims supports this strategy.The acquisition strengthens Atria's position in the fresh delicatessen products market, which is currently one of the fastest growing segments in the con-sumer goods retail trade.
Established in 1987, AB Ridderheims Delikatesser's product selection includes beer sausages, hams, cheese, canned foods and tapas ingredients.Ridderheims is a strong, well-known and innovative brand in the industry. The company operates in Gothenburg and employs a staff of 110.
The aim is to merge the product selections of Ridderheims and Falbygdens Ost into Atria Deli. The merger will create the finest and most comprehensive range of fresh delicatessen products in the Nordic countries and improve the position of both companies in export markets. Ridderheims currently exports its products to eleven countries. The merger will allow it to further increase its sales in Sweden and step up its exports, as Atria has a strong position and network of distributors in Finland, Denmark, the Baltic countries and Russia. At the same time, Ridderheims’ distribution network will enable Falbygdens Ost to export more of its products.
Furthermore, the acquisition will generate savings, as the manufacture of products which Ridderheims used to buy from subcontractors is transferred to Atria's plants.
Ridderheims' net sales for the previous accounting period were EUR 54.4 million and EBIT EUR 1.9 million.
EUR 1,000Fair values on
acquisitionFair values prior
to acquisition
Property, plant and equipment 5,887 5,887Goodwill 13,918Other intangible assets 8,131Investments 76 76Inventories 2,979 2,979Receivables 5,532 5,720Cash and cash equivalents 2,565 2,565Total assets 39,088 17,227
AssetsSegment assets 504,249 373,356 78,750 48,078 -9,424 995,009Investments in joint ventures and associates 5,726 2 5,728Total assets 509,975 373,356 78,750 48,080 -9,424 1,000,737
Liabilities 186,575 259,780 54,427 34,086 -10,155 524,713
Investments 28,579 213,925 32,965 8,623 284,092Depreciation 27,347 12,171 2,275 2,031 43,824Impairment 705 705
80

Continues on next page »
Deferred tax liabilities 3,670 1,393Interest-bearing financial liabilities 2,691 2,691Other liabilities 7,041 7,041Total liabilities 13,402 11,125
Net assets 25,686 6,102
Purchase price 25,686Cash and cash equivalents of acquired companies 2,565Effect on cash flow 23,121
2008 Acquisition dateOwnership
share, % Domicile
AS Vastse-Kuuste Lihatööstus 31 Jul 2008 100 EstoniaAS Wõro Kommerts 31 Jul 2008 100 Estonia
AS Vastse-Kuuste Lihatööstus manufactures a range of cold cuts, sausages, cured sausages and consumer-packed meat. The company has its own slaughterhouse and cutting plant. Founded in 1994, Vastse-Kuuste reported net sales of EUR 8.8 million in 2007. Its total market share in terms of value is 6% (Source: AC Nielsen 2008), and it employs approximately 140 persons. Over the past few years, Vastse-Kuuste has invested in the modernisation and capacity improvement of its production plant. Its market position has also strengthened due to the new investments.The company has a particularly strong position in cold cuts in the Estonian market.The production plant is located in southern Estonia, in Vastse-Kuuste.
Established in 1993, AS Wõro Kommerts is a company specialising in the production of meat products. Wõro's product selection includes smoked sausages and meat products, raw sausages, grill sausages and frankfurters. The company's total market share in terms of value is 13% (Source: AC Nielsen 2008), which makes it Estonia's second largest meat processing company. In recent years, Wõro has invested actively in the improvement of product quality and brand development. In 2007, it posted net sales of EUR 9.9 million and employed some 170 staff. The company has a production plant in Ahja, near Tartu and a distribution centre in Tartu. Built at the turn of the millennium, the production plant boasts modern production machinery.
Through these acquisitions, Atria will complement and expand its current product selection for retail customers in Estonia. Combined with the operations of Wõro and Vastse-Kuuste, AS Valga Lihatööstus is the second largest player in the Estonian meat processing market, with net sales of approximately EUR 42 million.The merger will generate significant synergies and help establish a firmer foothold in the market.
The companies' net sales for the previous accounting period were EUR 18.7 million and EBIT EUR 0.9 million.
EUR 1,000Fair values on
acquisitionFair values prior
to acquisition
Property, plant and equipment 4,814 4,814Goodwill 6,163Other intangible assets 3,537Inventories 1,134 1,134Receivables 1,965 1,965Cash and cash equivalents 2,630 2,630Total assets 20,243 10,543
Deferred tax liabilities 743Interest-bearing financial liabilities 1,135 1,135Other liabilities 2,873 2,873Total liabilities 4,751 4,008
Net assets 15 492 6 535
Purchase price 15 492Cash and cash equivalents of acquired companies 2 630Effect on cash flow 12 862
81
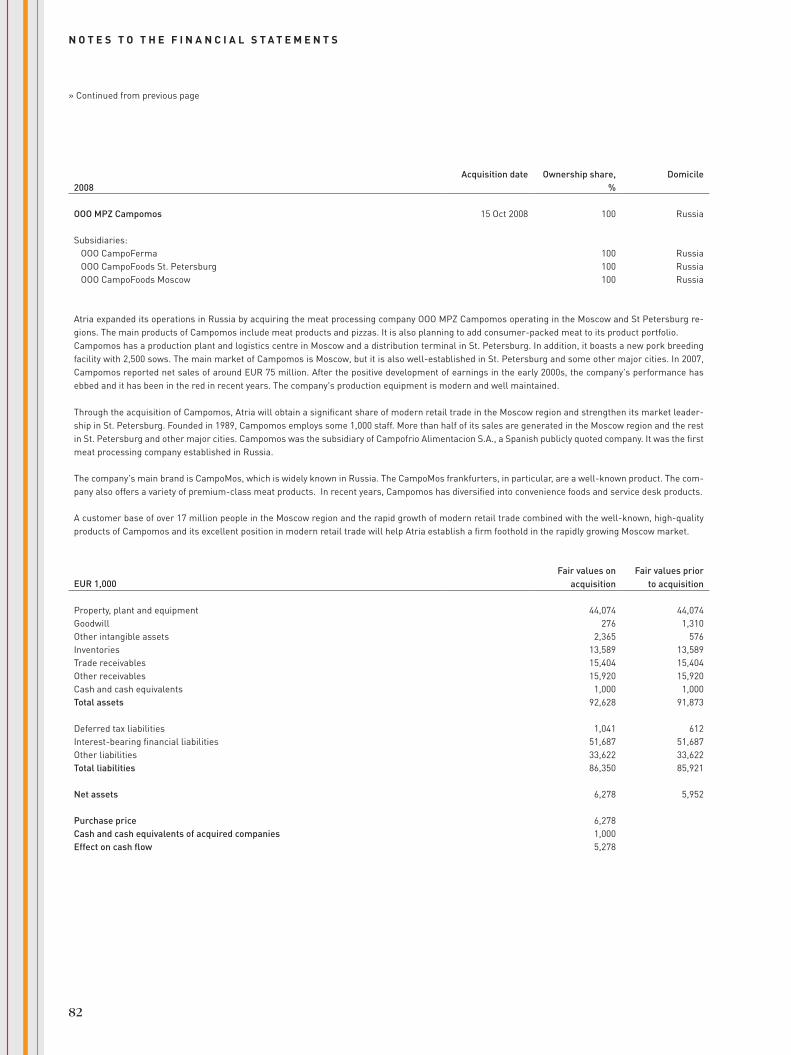
n o t e s t o t h e F i n a n c i a l s t a t e M e n t s
» Continued from previous page
2008Acquisition date Ownership share,
%Domicile
OOO MPZ Campomos 15 Oct 2008 100 Russia
Subsidiaries: OOO CampoFerma 100 Russia OOO CampoFoods St. Petersburg 100 Russia OOO CampoFoods Moscow 100 Russia
Atria expanded its operations in Russia by acquiring the meat processing company OOO MPZ Campomos operating in the Moscow and St Petersburg re-gions. The main products of Campomos include meat products and pizzas. It is also planning to add consumer-packed meat to its product portfolio.Campomos has a production plant and logistics centre in Moscow and a distribution terminal in St. Petersburg. In addition, it boasts a new pork breeding facility with 2,500 sows. The main market of Campomos is Moscow, but it is also well-established in St. Petersburg and some other major cities. In 2007, Campomos reported net sales of around EUR 75 million. After the positive development of earnings in the early 2000s, the company's performance has ebbed and it has been in the red in recent years. The company's production equipment is modern and well maintained.
Through the acquisition of Campomos, Atria will obtain a significant share of modern retail trade in the Moscow region and strengthen its market leader-ship in St. Petersburg. Founded in 1989, Campomos employs some 1,000 staff. More than half of its sales are generated in the Moscow region and the rest in St. Petersburg and other major cities. Campomos was the subsidiary of Campofrio Alimentacion S.A., a Spanish publicly quoted company. It was the first meat processing company established in Russia.
The company's main brand is CampoMos, which is widely known in Russia. The CampoMos frankfurters, in particular, are a well-known product. The com-pany also offers a variety of premium-class meat products. In recent years, Campomos has diversified into convenience foods and service desk products.
A customer base of over 17 million people in the Moscow region and the rapid growth of modern retail trade combined with the well-known, high-quality products of Campomos and its excellent position in modern retail trade will help Atria establish a firm foothold in the rapidly growing Moscow market.
Fair values on acquisition
Fair values prior to acquisitionEUR 1,000
Property, plant and equipment 44,074 44,074Goodwill 276 1,310Other intangible assets 2,365 576Inventories 13,589 13,589Trade receivables 15,404 15,404Other receivables 15,920 15,920Cash and cash equivalents 1,000 1,000Total assets 92,628 91,873
Deferred tax liabilities 1,041 612Interest-bearing financial liabilities 51,687 51,687Other liabilities 33,622 33,622Total liabilities 86,350 85,921
Net assets 6,278 5,952
Purchase price 6,278Cash and cash equivalents of acquired companies 1,000Effect on cash flow 5,278
82

Continues on next page »
Acquisition dateOwnership
share, %2007 Domicile
AB Sardus 1 Apr 2007 100 Sweden
Subsidiaries: 3-Stjernet A/S 100 Denmark Alf Eliassons Kött & Chark AB 100 Sweden
AB Carl A Carlson Charkuterier 100 Sweden
Charkdelikatesser Produktion AB 100 Sweden
Delikatess Skinkor AB 100 Sweden
Falbygdens Ostnederlag AB 100 Sweden
Filos AB 100 Sweden
G A Carlsson AB, Gea´s 100 Sweden
Gourmet Service i Årsta AB 100 Sweden
Moheda Chark AB 100 Sweden
Norrboda Charkuterifabrik AB 100 Sweden
Pastejköket Produktion AB 100 Sweden
Sardus Chark & Deli AB 100 Sweden
Sardus Foodpartner AB 100 Sweden
Sardus Inköp AB 100 Sweden
Sardus International A/S 100 Denmark
Sardus IT AB 100 Sweden
Sardus Lätta Måltider Halmstad AB 100 Sweden
Sardus Lätta Måltider Holding AB 100 Sweden
Sardus Lätta Måltider Stockholm AB 100 Sweden
Sardus Lätta Måltider Östersund AB 100 Sweden
AB Sven Lindbergs Charkuterifabrik 100 Sweden
Atria Meat & Fast Food AB acquired the Swedish AB Sardus on 1 April 2007. The acquisition forms part of Atria’s goal of becoming the leading food indus-try company in the Baltic Sea region. The food industry is currently undergoing a structural change and integration development, and there are a limited number of major operators. Merging Atria and Sardus strengthens the ability of both companies to respond to the new challenges set by the integrat-ing markets. Together, the companies will complement each other and form a stronger operator with a wide selection of strong brands. The merger is expected to produce synergy benefits for product development, purchases, logistics, production and marketing. The wider product range and the synergy benefits will form the main accelerators of growth, and they strengthen the brands and product groups of both companies. Sardus' net sales in 2006 amounted to EUR 230 million, its EBIT was EUR 9 million and it had approximately 1,000 employees.
EUR 1,000Fair
value
Acquiree's current
book value
Property, plant and equipment 53,037 53,037Goodwill 93,659 42,036Other intangible assets 48,329 3,379Investments 906 906Inventories 25,300 25,300Receivables 30,403 30,403Cash and cash equivalents 3,904 3,904
Total assets 255,538 158,965
Deferred tax liabilities 20,402 9,187Interest-bearing liabilities 80,219 79,366Other liabilities 30,401 30,401Total liabilities 131,022 118,954
Net assets 124,516 40,011
Purchase price 124,515Cash and cash equivalents of acquired companies 3,904Effect on cash flow 120,611
83

n o t e s t o t h e F i n a n c i a l s t a t e M e n t s
» Continued from previous page
16. SOLD OPERATIONS, EUR 1,000
2007 Selling date
Ownership share, % Domicile
Svensk Snabbmat för Storkök AB 31 May 2007 57.2 Sweden
Subsidiaries: Hedmans AB Frukt och Matgrossisten i Söderhamn AB Matgrossisten i Skellefteå AB Norrsäljarna AB
Atria sold its share of its Swedish subsidiary Svensk Snabbmat för Storkök AB to Euro Cater A/S. Snabbmat is a local HoReCa wholesale outlet, in which Atria held 57.2 per cent of the shares. Atria recorded a sales gain of nearly EUR 35 million from the deal.
Snabbmat is included in Group figures until 31 May 2007.
Acquisition dateOwnership
share, % Domicile
Stam Sp Z.o.o 30 May 2007 100 PolandLiha-Pouttu Oy 1 Oct 2007 100 Finland
In Sweden, Atria Concept AB acquired the Polish agency office Stam with which Atria has been cooperating for a long time in Poland. Atria Concept AB wants to continue strengthening its position in Poland and its neighbouring countries, the Czech Republic and Slovakia. The aim is to double net sales to EUR 6 million by the end of 2009 through better utilisation of local knowledge.
Atria Finland Ltd acquired the entire stock of Liha-Pouttu Oy. The acquisition target was Liha-Pouttu Oy’s meat procurement, slaughtering and meat cut-ting operations. The Finnish Competition Authority approved the acquisition on 21 September 2007 and the deal was confirmed on 1 October 2007.
Packing of retail-packed meat was not included in the purchase. In connection with the deal, Atria and Pouttu signed a cooperation agreement concern-ing meat deliveries from Atria to Jaloste-Pouttu Oy. Along with the acquisition, Atria adds to its cost-efficiency in meat purchasing and cutting operations as purchasing volumes increase from 140 million kg to approximately 155 million kg. Thanks to the Liha-Pouttu acquisition, the net sales of Atria Finland Ltd is expected to grow by approximately EUR 25 million annually.
Stam and Liha-Pouttu combined:
EUR 1,000
Fair value
Acquiree's current
book value
Tangible assets 219 219Goodwill 1,413Other intangible assets 1,295 26Investments 153 153Inventories 460 460Short-term receivables 5,199 5,199Cash and cash equivalents 201 201Total assets 8,940 6,258
Deferred tax liabilities 330Other liabilities 4,389 4,396Total liabilities 4,719 4,396
Net assets 4,221 1,862
Purchase price 4,221Cash and cash equivalents of acquired companies 201Effect on cash flow 4,020
2007
84

18. OTHER OPERATING INCOME, EUR 1,000
2008 2007
Rental income 176 167Proceeds from sale of fixed assets 35,185Other 3,509 2,716Total 3,685 38,068
19. MATERIALS AND SUPPLIES, EUR 1,000
2008 2007
Materials and supplies 833,786 746,271Changes in stock 2,087 -2,345External services 26,002 24,711Total 861,875 768,637
20. EMPLOYEE BENEFITS, EUR 1,000
Employee benefits 2008 2007
Salaries and wages 181,035 169,866Pension costs - contribution plans 26,263 22,627Pension costs - benefit-based plans -123 -89Other staff-related expenses 33,408 35,076Total 240,583 227,480
Svensk Snabbmat för Storkök AB's earnings 1 Jan - 31 May 2007 1 Jan - 31 Dec 2006
Net sales 85,073 146,879EBIT 1,658 4,562Profit before taxes 1,387 4,547
Assets and liabilities on the selling date: 31 May 2007
Assets 54,028Liabilities 43,465
17. NET SALES, EUR 1, 000
2008 2007
Proceeds from sale of goods 1,341,547 1,257,498Proceeds from services 7,382 6,380Other proceeds 8,007 8,309Total 1,356,936 1,272,187
85

n o t e s t o t h e F i n a n c i a l s t a t e M e n t s
Group personnel on average by segment 2008 2007
Finland 2,378 2,394Scandinavia 1,691 1,768Russia 1,525 1,278Baltic countries 541 507Total 6,135 5,947
21. DEPRECIATION AND IMPAIRMENT, EUR 1,000
Depreciation and impairment by group of assets 2008 2007
Depreciation
Property, plant and equipment Buildings 10,605 9,655 Machinery and equipment 33,137 30,699 Other tangible assets 686 176Total 44,428 40,530
Intangible assets Trademarks 374 1,019 Other intangible assets 2,264 2,275Total 2,638 3,294
Total 47,066 43,824
Impairment Buildings 469 Other tangible assets 129 Inventories 576Total 469 705
Total depreciation and impairment 47,535 44,529
22. OTHER OPERATING ExPENSES, EUR 1,000
2008 2007
Lease payments 8,045 7,741Energy costs 26,682 22,743Transportation costs 17,992 17,951Other 129,601 134,139Total 182,320 182,574
23. FEES PAID TO AUDITORS, EUR 1,000
2008 2007
Fees paid for auditing 491 384Reports and statements 78Tax consulting 21 12Other fees 19 239Total 531 713
86

25. FINANCIAL INCOME AND ExPENSES, EUR 1,000
2008 2007
Financial income:Interest income from loan assets 4,931 4,915Exchange rate profits from loan assets 31,852 845Dividends received from financial assets for sale 25 68Other financial income 898 240Changes in the value of financial assets at fair value through profit or loss - Derivative instruments - not in hedge accounting 6,655 2,244Total 44,361 8,312
Financial expenses:Interest expenses from financial liabilitiesvalued at amortised cost -20,741 -16,508Exchange rate losses from financial liabilities valued at amortised cost -41,149 -4,036Other financial expenses -4,140 -1,992Changes in the value of financial assets at fair value through profit or loss - Derivative instruments - not in hedge accounting -648 -101Total -66,678 -22,637
26. INCOME TAxES, EUR 1,000
Taxes in the income statement 2008 2007
Tax based on the taxable profit for the period 7,890 13,701Retained taxes 81 542Deferred tax -2,711 -1,283Total 5,260 12,960
Balancing of income statement taxes to profit before taxes
Profit before taxes 16,673 80,605
Taxes calculated with the parent company's 26 percent tax rate 4,335 20,957Effect of foreign subsidiaries' deviating tax rates -1,336 504Effect from associates' earnings -149 -100Retained taxes 81 551Effect of tax-free income -125 -12,076Effect of costs that are undeductible in taxation 1,494 337Unrecognised deferred tax assets 960 2,787Total 5,260 12,960
24. RESEARCH AND DEVELOPMENT COSTS, EUR 1,000
2008 2007
The income statement includes R&D costs booked as costs to the amount of 9,905 8,428
87

28. FINANCIAL RISK MANAGEMENT
The financing policy approved by the Board of Directors on 25 June 2008 confirms the general principles of risk management. The Board has delegated the management of financial risks to the Treasury committee, while the practical management of financial risks is centrally handled by the Group’s Treasury unit. The goal of financial risk management is to reduce the effect that price fluctuations on the financial markets and other uncertainty factors have on earnings, the balance sheet and cash flow, as well as to ensure sufficient liquidity. The main risks related to financing are interest rate risk, currency risk, liquidity and refinancing risk and credit risk.
Interest rate riskInterest rate risk is managed by dividing financing into instruments with variable and fixed interest rates and by hedging with interest rate derivatives. The interest rate risk is mainly directed at the Group’s interest-bearing liabilities because the amount of short-term money market investments and the related interest rate risk is low. However, cash at hand is maintained at the level required to maintain good liquidity. The Group’s operational cash flow is mainly independent of fluctuations in market rates. At the time of the balance sheet date, the Group had one interest rate swap of EUR 10 million, where the Group pays 4.42% in fixed interest and receives a 6-month Euribor interest rate of 4.93%. The Group’s interest-bearing debt was EUR 448.4 million on 31 December 2008 (EUR 321.9 million on 31 December 2007), of which EUR 110.3 million (EUR 56.4 million on 31 December 2007) or 24.6 percent (17.5% on 31 December 2007) had fixed interest rates.
Sensitivity analysis for the interest rate risk of financial instruments in accordance with IFRS 7The interest rate risk analysis is based on the following assumptions. The sensitivity analysis is calculated using a 1% change in the interest rate level, which is considered to be reasonable and plausible, and the amount of interest bearing net debt with variable interest rates at the end of the year. Net debt with variable interest rates amounted to EUR 301 million on 31 December 2008 (EUR 230 million on 31 December 2007). At the end of 2008, +/-1% change in the interest rate level would amount to a change of EUR +/- 2,9 million in the Group's annual interest expenses (EUR +/-2,2 million on 31 December 2007).
Currency riskAtria is exposed to both transaction risks and translation difference risks. Transaction risks refer to a potentially negative effect of exchange rate fluctuations on the Group’s earnings, whereas translation difference risks affect the Group’s balance sheet, with a potentially negative effect on the Group’s net assets, i.e. Atria Group’s equity. Transaction risks come, among others, from the euro-denominated meat raw material imports of Atria’s Swedish operations and from the euro- and USD-denominated imports of its Russian companies. The currency flow and risks in Finnish operations are relatively low. Currency risk is hedged with foreign currency loans and derivatives. As a rule, the equity of foreign subsidiaries is not hedged (translation risk). Most of the subsidiaries’ loans are denominated in their home currencies. However, on 31 December 2008 the Russian subsidiaries had a euro-denominated loan of EUR 26.7 million, which has been amortised by EUR 13 million in January and will continue to be amortised in the early part of 2009.
Sensitivity analysis for the currency risks of financial instruments in accordance with IFRS 7The sensitivity analysis for currencies is based on the financial instruments in currencies other than the operating currency of each Group company in the balance sheet at the time of the financial statement and the resulting risks. Currency-denominated items other than financial instruments, such as forecasted probable purchases or sales, are not included in the sensitivity analysis.
31 Dec 2008 31 Dec 2007EUR 1,000 EUR SEK USD EUR SEK USD
Net exposure -44,304 470 185 -25,592 576 -320
Effect of a 5 percent increase inthe exchange rate on profit before taxes -2,215 24 9 -1,280 29 -16
27. EARNINGS PER SHARE, EUR 1,000
2008 2007
Basic earnings per share are calculated by dividing the parent company’s shareholder’s profit for the period by the weighted average number of outstanding shares.
Profit for the period belonging to the owners of the parent company 11,765 66,695Weighted average of shares for the period (1,000) 28,268 26,082Basic earnings per share 0.42 2.56
When calculating the earnings per share adjusted by the dilution effect, the dilution effect from all potential dilutive conversions of ordinary shares is taken into account in the weighted average number of shares. The Group does not have any instruments that would have a dilution effect.
88

Continues on next page »
Liquidity and refinancing riskAtria Plc's Treasury arranges the majority of the Group’s interest-bearing liabilities. Liquidity and refinancing risks are managed with balanced loan ma-turity distribution and by having sufficient committed credit limits and cash funds at hand. Atria also uses commercial paper programmes to manage li-quidity. At the end of the year, there was EUR 126.4 million (EUR 151.6 million in 2007) in unutilised committed credit limits. EUR 135.2 million of the EUR 200 million commercial paper programmes had not been used (in 2007, EUR 90 million of the EUR 120 million commercial paper programmes had not been used). At the time of the financial statement, the average maturity of the Group's loans was 3 years 1 month and the average maturity of committed credit limits was approximately 3 years. The main covenant used in loan agreements is a minimum equity ratio covenant of 30%.
The table below shows the maturity analysis for financial liabilities and derivative instruments (undiscounted figures).
Maturity analysis for financial liabilities
Maturity, 31 Dec 2008< 1 1-5 > 5
EUR 1,000 years years years TotalLoans Instalments 124,241 264,183 53,628 442,052
Interest expenses 15,020 52,549 3,980 71,549Derivative assets and liabilities Capital payments 121,917 121,917
Capital income -128,482 -128,482Interest expenses 442 442
Interest income -500 -500Other liabilities Instalments/Payments 34,510 3,000 37,510
Interest expenses 301 145 446Trade payables Payments 117,103 117,103Accrued liabilities Payments 50,386 50,386Total Total payments 463,920 316,732 60,753 841,405
Total income -128,982 0 0 -128,982Net payments 334,938 316,732 60,753 712,423
Maturity analysis for financial liabilities
Maturity, 31 Dec 2007< 1 1-5 > 5
EUR 1,000 years years years TotalLoans Instalments 119,949 106,489 80,619 307,057
Interest expenses 12,953 33,020 4,078 50,051Derivative assets and liabilities Capital payments 105,270 105,270
Capital income -107,359 -107,359Interest expenses 442 368 810
Interest income -459 -383 -842Other liabilities Instalments/Payments 26,765 2,454 4,500 33,719
Interest expenses 354 1,174 218 1,746Trade payables Payments 79,315 79,315Accrued liabilities Payments 52,448 52,448Total Total payments 397,496 143,505 89,415 630,416
Total income -107,818 -383 0 -108,201Net payments 289,678 143,122 89,415 522,215
The net position of EUR -44.3 million on 31 December 2008 includes EUR 26.7 million in loans and EUR 9.5 million in trade payables and other non-interest-bearing liabilities of the Russian companies (EUR/RUB risk), as well as EUR 7.5 million in euro-denominated trade payables of the Swedish subsidiaries (EUR/SEK risk). The net position of EUR -25.6 million on 31 December 2007 includes an intra-Group loan of some EUR 18 million to OOO Atria Group (EUR/RUB risk). The sensitivity analysis assumes a 5% change in foreign currency exchange rates to be reasonably realistic.
89

n o t e s t o t h e F i n a n c i a l s t a t e M e n t s
» Continued from previous page
Credit riskThe credit risk related to financing, i.e. the counterparty risk, is mainly controlled by selecting only well-established contracting parties with good credit ratings as counterparties. The Group’s liquid assets are only invested in counterparties that meet the above-mentioned criteria. This is also the proce-dure when entering into financing and derivative agreements. The credit risk of the Group’s operative business derives to our customers, of which the main ones are large retail store chain. Receivables from other customers are clearly smaller and more dispersed.
Commodity riskIn the commodity risk area, electricity prices have been hedged by purchasing electricity at a fixed price. Fluctuations in the price of meat raw material affect the Group's profitability in the short term, but the Group aims to pass on the price increases to sales prices as soon as possible.
Capital structure managementIn capital structure management, the Group aims to ensure normal operating conditions under all circumstances and to maintain an optimal capital structure in terms of capital costs. The capital structure is influenced, for example, through the distribution of dividends and share issues and by retain-ing interest-bearing liabilities at such a level that the equity ratio target of 40% can be maintained.
Equity ratio (minimum target 40%)
Realised: 31 Dec 2008 31 Dec 200738.4 % 47.6 %
Values for financial assets and liabilities by category
EUR 1,000
2008 balance sheet item
Financial assets and liabilities
at fair value through profit or loss
Loans and other receivables
Financial assets for sale
Financial liabilities
Balance sheet value in total
Non-current assetsOther financial assets 2,111 2,111Loan assets 7,857 7,857Other receivables 6,159 6,159Current assetsTrade receivables 188,179 188,179Loan assets 386 386Other receivables *) 7,953 7,953Accrued credits and deferred charges *)
17,882 17,882
Derivative instruments 6,655 6,655Cash and cash equivalents 37,138Total financial assets 6,655 228,416 2,111 274,320
Non-current liabilitiesInterest-bearing financial liabilities 320,812 320,812Current liabilitiesInterest-bearing financial liabilities 127,588 127,588Trade payables 117,103 117,103Other liabilities **) 31,169 31,169Accrued liabilities **) 50,386 50,386Derivative instruments 648 648Total financial liabilities 648 647,058 647,706
The fair values of financial assets and liabilities do not deviate significantly from their balance sheet values.
*) Do not include VAT or income tax assets.**) Do not include VAT or income tax liabilities.
90

EUR 1,000
2007 balance sheet item
Financial assets and liabilities
at fair value through profit or loss
Loans and other receivables
Financial assets for sale
Financial liabilities
Balance sheet value in total
Non-current assetsOther financial assets 2,959 2,959Loan assets 11,744 11,744Other receivables 346 346Current assetsTrade receivables 166,358 166,358Loan assets 4,496 4,496Other receivables *) 1,819 1,819Accrued credits and deferred charges *) 6,487 6,487Derivative instruments 2,244 2,244Cash and cash equivalents 35,592Total financial assets 2,244 191,250 2,959 232,045
Non-current liabilitiesInterest-bearing financial liabilities 194,081 194,081Current liabilitiesInterest-bearing financial liabilities 127,789 127,789Trade payables 79,315 79,315Other liabilities **) 18,904 18,904Accrued liabilities **) 52,448 52,448Derivative instruments 101 101Total financial liabilities 101 472,537 472,638
*) Do not include VAT or income tax assets.**) Do not include VAT or income tax liabilities.
29. OTHER LEASES, EUR 1,000
Group as lessor 2008 2007
Minimum lease payments based on non-cancellable leasesWithin one year 4,949 3,445Within more than one year and a maximum of five years 11,408 8,379After more than five years 20,658 17,991Total 37,015 29,815
30. CONTINGENT LIABILITIES, EUR 1,000
Debts with mortgages or other collateral given as security 2008 2007
Loans from financial institutions 9,557 13,521Pension fund loans 3,867 4,603Total 13,424 18,124
Mortgages and other securities given as comprehensive securityReal estate mortgages 6,651 21,957Corporate mortgages 7,884 2,225Total 14,535 24,182
Guarantee engagements not included in the balance sheetGuarantees 886 907
91

n o t e s t o t h e F i n a n c i a l s t a t e M e n t s
31. RELATED PARTY TRANSACTIONS, EUR 1,000
Group companies by business area Domestic Ownership interest (%) Share of votes (%)
Atria Finland:Ab Botnia-Food Oy Finland 100.0 100.0A-Logistics Ltd Finland 100.0 100.0A-Pekoni Nurmo Oy Finland 100.0 100.0A-Pihvi Kauhajoki Oy Finland 100.0 100.0A-Pihvi Kuopio Oy Finland 100.0 100.0A-Rehu Oy Finland 51.0 51.0A-Sikateurastamo Oy Finland 100.0 100.0Atria Concept Oy Finland 100.0 100.0Atria Meat AB Sweden 100.0 100.0Atria Finland Ltd Finland 100.0 100.0Atria Plc FinlandAtria-Chick Oy Finland 100.0 100.0Atria-Lihavalmiste Oy Finland 100.0 100.0Atria-Meetvursti Oy Finland 100.0 100.0Atria-Tekniikka Oy Finland 100.0 100.0Atria-Tuoreliha Oy Finland 100.0 100.0Atria-Valmisruoka Oy Finland 100.0 100.0A-Farmers Ltd Finland 97.9 99.0F-Logistiikka Oy Finland 100.0 100.0Itikka-Lihapolar Oy Finland 100.0 100.0Kiinteistö Oy Tievapolku 3 Finland 100.0 100.0Liha ja Säilyke Oy Finland 100.0 100.0Liha-Pouttu Oy Finland 100.0 100.0Rokes Oy Finland 100.0 100.0Suomen Kalkkuna Oy Finland 100.0 100.0
Atria Scandinavia:3-Stjernet A/S Denmark 100.0 100.0AB Ridderheim & Grönwall Sweden 100.0 100.0AB Sardus Sweden 100.0 100.0Atria Chark & Deli AB Sweden 100.0 100.0Atria Concept AB Sweden 100.0 100.0Atria Concept SP Z.o.o Poland 100.0 100.0Atria Foodservice & Concept AB Sweden 100.0 100.0Atria Foodservice AB Sweden 100.0 100.0Atria Lätta Måltider AB Sweden 100.0 100.0Atria Lätta Måltider Halmstad AB Sweden 100.0 100.0Atria Lätta Måltider Holding AB Sweden 100.0 100.0Atria Lätta Måltider Östersund AB Sweden 100.0 100.0Atria Meat & Fast Food AB Sweden 100.0 100.0Atria Scandinavia AB Sweden 100.0 100.0Falbygdens Ostnederlag AB Sweden 100.0 100.0Gourmet Service i Årsta AB Sweden 100.0 100.0KB Joddlaren Sweden 100.0 100.0Lithells AB Sweden 100.0 100.0Nordic Fastfood AB Sweden 51.0 51.0Nordic Fastfood Etablerings AB Sweden 51.0 51.0Ridderheims Delikatesser AB Sweden 100.0 100.0Ridderheims Delikatesser i Norge AS Norway 100.0 100.0Samfood Fastighet AB Sweden 100.0 100.0Sardus Chark & Deli AB Sweden 100.0 100.0Sardus Foodpartner AB Sweden 100.0 100.0Sardus Inköp AB Sweden 100.0 100.0Sardus International A/S Denmark 100.0 100.0Sardus IT AB Sweden 100.0 100.0Smakfabriken i Göterborg AB Sweden 100.0 100.0
92

Continues on next page »
Atria Russia:Atria-Invest Oy Finland 100.0 100.0OOO Atria Group Russia 100.0 100.0OOO CampoFerma Russia 100.0 100.0OOO CampoFoods Moscow Russia 100.0 100.0OOO CampoFoods St. Petersburg Russia 100.0 100.0OOO MPZ Campomos Russia 100.0 100.0OOO Pit-Product Russia 100.0 100.0
Atria Baltic:AS Alle Estonia 100.0 100.0AS Valga Lihatööstus Estonia 100.0 100.0AS Vastse-Kuuste Lihatööstus Estonia 100.0 100.0AS Wõro Kommerts Estonia 100.0 100.0OÜ Atria Estonia 100.0 100.0OÜ Carmex Invest Estonia 100.0 100.0OÜ Linnamäe Peekon Estonia 100.0 100.0OÜ Puidukaubandus Estonia 100.0 100.0UAB Vilniaus Mesa Lithuania 100.0 100.0
Group joint ventures and associates and other related parties Domestic Ownership interest (%) Share of votes (%)
Group joint ventures: Best-In Oy Finland 50.0 50.0 Länsi-Kalkkuna Oy Finland 50.0 50.0Group associates: Finnpig Oy Finland 49.0 49.0 Findest Protein Oy Finland 40.6 40.6 Foodwest Oy Finland 33.5 33.5 Honkajoki Oy Finland 47.8 47.8 OÜ LKT Invest Estonia 26.0 26.0 Finnish Meat Research Institute, LTK Co-operative Finland 40.7 40.7 Tuoretie Oy Finland 33.3 33.3Other related parties: Members of the Board of Directors and the Supervisory Board Itikka Co-operative Group Lihakunta Pohjanmaan Liha Co-operative Group
93

n o t e s t o t h e F i n a n c i a l s t a t e M e n t s
The following transactions were completed with related parties: 2008 2007
Sale of goods Joint ventures/Associates 772 644 Other related parties 4,669 3,904Total 5,441 4,548
Sale of services Associates 419 350 Other related parties 26Total 445 350
Rental income Joint ventures/Associates 273 264
Purchase of goods Joint ventures/Associates 20,402 17,643 Other related parties 5,029 4,056Total 25,431 21,699
Purchase of services Joint ventures/Associates 32,684 28,497
Rent costs Joint ventures/Associates 2,259 2,096
Trade receivables Joint ventures/Associates 60 47 Other related parties 1,441 1,469Total 1,501 1,516
Trade payables Joint ventures/Associates 3,045 1,881
Debts to related parties Other related parties (debts to owners) 893 10,723
The sale of goods and services to related parties is based on the Group's valid price lists. The majority of services purchased were the logistics services of Tuoretie Oy. Debts to related parties are loans that can be called in immediately; their interest rate is tied to the 6-month Euribor rate.
» Continued from previous page
94

Management employee benefits 2008 2007
Salaries and other short-term employee benefits 3,802 2,934
The retirement age for the CEO and Deputy CEO is 62 years.
Management salaries, benefits and other employee benefits 2008 2007
CEO, Member of the Board Tikkakoski Matti, CEO since 1 Feb 2006 863 616Deputy CEO Gröhn Juha 461 305Members of the Board of Directors Selin Martti, Chairman 57 54 Komulainen Timo, Deputy Chairman 72 71 Heikkilä Tuomo 28 28 Lillandt Runar 35 34 Tikkakoski Matti, CEO Saarinen Leena, member until Oct 2007 23 Yliluoma Ilkka 47 48
Members of the Supervisory Board Pirkola Ari, Deputy Chairman since July 2008 20 Vornanen Ahti-Pekka, Chairman until June 2008 29 46 Kaarto Esa, Deputy Chairman since July 2007 32 18 Panula Heikki, Deputy Chairman until June 2007 15 Other members of the Supervisory Board, total 25 37
32. BIOLOGICAL ASSETS, EUR 1,000
2008 2007
Biological assets are included in the following items:Tangible assets (productive animals) 1,742 807Inventories (other biological assets) 6,156 2,872Total 7,898 3,679
Biological assets:At the beginning of the period 3,679 3,075Business combinations 3,009Change during the period 1,210 604At the end of the period 7,898 3,679
Production:Chicken chicks/1,000 20,008 19,416Young chickens and turkeys/1,000 156Pork/1,000 kg 6,252 4,947Beef/1,000 kg 2,370 1,797Milk/1,000 kg 4,319 2,837
33. EVENTS OCCURRING AFTER THE BALANCE SHEET DATE
The Company management is not aware of any significant events affecting the financial statement.
95

p a r e n t c o M p a n y b a l a n c e s h e e t a n d i n c o M e s t a t e M e n t ( F a s )
BALANCE SHEET, EUR 1,000
A s s e t s Note
31 Dec 2008
31 Dec 2007
FIXED ASSETS
Intangible assets 2.1 Intangible rights 140 186 Other long-term expenditure 4,816 5,302Intangible assets, total 4,956 5,488
Tangible assets 2.1 269,182 262,597
Investments 2.2 Interests in Group companies 181,067 132,662 Interests in associates 2,805 2,805 Other shares and interests 1,983 1,024Investments, total 185,855 136,491TOTAL FIXED ASSETS 459,993 404,576
CURRENT ASSETS
Long-term receivables 2.3 231,393 167,071Short-term receivables 2.3 118,320 88,262Cash in hand and at bank 983 1,461TOTAL CURRENT ASSETS 350,696 256,794
T o t a l a s s e t s 810,689 661,370
L i a b i l i t i e s Note 31 Dec 2008 31 Dec 2007
SHAREHOLDERS' EQUITY 2.4
Share capital 48,055 48,055Share premium 138,502 138,502Own shares -542 0Invested untied equity fund 110,228 110,228Retained earnings 51,781 46,488Profit for the period 23,293 25,080TOTAL SHAREHOLDERS' EQUITY 371,316 368,353
ACCRUED APPROPRIATIONS 2.5Depreciation difference 52,440 52,440
BORROWED CAPITAL
Long-term borrowed capital 2.6 275,492 129,951Short-term borrowed capital 2.7 111,440 110,626TOTAL BORROWED CAPITAL 386,932 240,577
T o t a l l i a b i l i t i e s 810,689 661,370
96

INCOME STATEMENT, EUR 1,000
Note1 Jan - 31 Dec
20081 Jan - 31 Dec
2007
NET SALES 3.1 46,503 40,991Other operating income 3.2 2,398 2,334
Staff expenses 3.3 -2,712 -1,689Depreciation and impair-ment 3.4 Planned depreciation -25,950 -23,396Other operating expenses 3.5 -5,006 -6,204
EBIT 15,233 12,036
Financial income and expenses 3.6 8,342 197
PROFIT BEFORE EXTRAORDINARY ITEMS 23,575 12,233
Extraordinary items 3.7 5,500 19,950
PROFIT BEFORE APPRO-PRIATIONS AND TAXES 29,075 32,183
Income taxes 3.8 -5,782 -7,103
NET PROFIT FOR THE ACCOUNTING PERIOD 23,293 25,080
CASH FLOW STATEMENT, EUR 1,000
1 Jan - 31 Dec 2008
1 Jan - 31 Dec 2007
CASH FLOW FROM OPERATING ACTIVITIESSales income 46,580 40,934Payments on operating expences -8,567 -6,797Cash flow from operating activities before financial items and taxes 38,013 34,137Financial income and expences, net 10,293 -1,851Tax paid -7,590 -6,933
Cash flow from operating activities 40,716 25,353
CASH FLOW FROM INVESTMENTSInvestments in tangible and intangible assets and in investments -85,717 -16,326
Cash flow from investments -85,717 -16,326
CASH FLOW FROM FINANCINGIssue of shares liable to charge 0 119,025Loan payments 59,312 -134,721Dividends paid -19,787 -13,740Own shares -502 0
Group contribution 5,500 19,950Cash flow from financing 44,523 -9,486
CASH FLOW FROM OPERATING ACTIVITIES 40,716 25,353CASH FLOW FROM INVESTMENTS -85,717 -16,326CASH FLOW FROM FINANCING 44,523 -9,486TOTAL -478 -459
Change in cash and equivalentsCash and equivalents 1.1. -1,461 -1,920Cash and equivalents 31.12. 983 1,461Change -478 -459
97

1. PRINCIPLES APPLIED IN PREPARING THE FINANCIAL STATEMENTS
General principlesAtria Plc’s financial statements have been prepared in ac-cordance with Finnish bookkeeping legislation as well as otherapplicablerulesandregulations(FAS).
Group informationThe parent company of Atria Plc Group is Atria Plc, domi-cileKuopio,Finland.Copiesoftheconsolidatedfinancialstatements of Atria Plc are available from the Group parent company’s head office at Atriantie 1, Nurmo, postal address: P.O.Box900,FI-60060ATRIA..
Valuation principlesTangible and intangible assets have been recorded in the bal-ance sheet at their direct acquisition cost, less the deprecia-tions according to plan and impairment bookings. Deprecia-tions are carried out as even depreciations for the time of use. Subsidies received for the acquisition of tangible assets have been booked as depreciations of the acquisition cost. The subsidies received are not relevant in amount. Financial instruments are valued in the balance sheet at the acquisition cost, less the impairment bookings. Derivative instruments are originally booked at fair value and later valued at the fair value. Any gains and losses due to valuation at fair value are treated according to the intended use of the derivative instru-ment in the bookkeeping.
Depreciation times: Buildings Nurmo 40 years otherlocations 25yearsMachinery and equipment Nurmo 10 years other locations 7 yearsComputerprograms 5yearsOtherlong-termassets 10years
Shares of listed companies included in the Group’s fixed as-sets are valuated at acquisition cost. On 31 Dec 2008, thebookkeeping value of such shares was EUR 31,913.66 and the current value EUR 82,907.30.
Foreign currenciesItems in foreign currencies have been noted as Finnish cur-rencyaccordingtotheexchangerateoftheEuropeanCen-tral Bank on the closing date. Realised exchange rate differ-ences from foreign currency denominated loans are included in the financial items.
2 . NOTES TO THE BALANCE SHEET, EUR 1,000
2.1. INTANGIBLE AND TANGIBLE ASSETS 31 Dec 2008 31 Dec 2007
Intangible rightsAcquisition cost 1 Jan 1,443 1,437Increases 1 6Decreases 0 0Acquisition cost 31 Dec 1,444 1,443Accumulated depreciation 1 Jan -1,256 -1,209Depreciation on decreases 0 0Depreciation for the accounting period -48 -47Accumulated depreciation 31 Dec -1,304 -1,256Book value 31 Dec 140 187
Other long-term expenditureAcquisition cost 1 Jan 11,873 10,395Increases 1,396 1,478Decreases 0 0Acquisition cost 31 Dec 13,269 11,873Accumulated depreciation 1 Jan -6,572 -4,698Depreciation on decreases 0 0Depreciation for the accounting period -1,881 -1,874Accumulated depreciation 31 Dec -8,453 -6,572Book value 31 Dec 4,816 5,302
Intangible assets total 4,956 5,488
Tangible assets:Land and waterAcquisition cost 1 Jan 2,182 2,147Increases 0 35Acquisition cost 31 Dec 2,182 2,182
Buildings and constructionsAcquisition cost 1 Jan 264,816 243,758Increases 6,567 21,059Decreases 0 0Acquisition cost 31 Dec 271,383 264,816Accumulated depreciation 1 Jan -102,970 -96,786Depreciation on decreases 0 0Depreciation for the accounting period -6,541 -6,184Accumulated depreciation 31 Dec -109,510 -102,970Book value 31 Dec 161,872 161,846
Machinery and equipmentAcquisition cost 1 Jan 238,942 205,347Increases 25,569 33,595Decreases 0 0Acquisition cost 31 Dec 264,511 238,942Accumulated depreciation 1 Jan -145,524 -130,310Depreciation on decreases 0 0Depreciation for the accounting period -17,403 -15,214Accumulated depreciation 31 Dec -162,927 -145,524Book value 31 Dec 101,584 93,418
n o t e s t o t h e F i n a n c i a l s t a t e M e n t s 1 J a n – 3 1 d e c 2 0 0 8
98

2.3. RECEIVABLES 31 Dec 2008 31 Dec 2007
Long-term receivables
Receivables from group companiesLoan receivables 231,393 167,071
Short-term receivables
Loan receivables 441 441Trade receivables 110 312Other receivables 17 7Accrued credits and deferred charges 9,061 1,826
Receivables from group companiesTrade receivables 407 283Other receivables 106,218 84,088Accrued credits and deferred charges 2,067 1,306
Total short-term receivables 118,321 88,262
Material items included in the accrued credits and deferred charges: - amortised interests 3,492 1,410 - exchange rate difference of forward contracts 6,609 1,557 - amortised taxes 873 0 - other 154 164Total 11,128 3,131
Other tangible assetsAcquisition cost 1 Jan 1,182 1,102Increases 114 80Decreases 0 0Acquisition cost 31 Dec 1,295 1,182Accumulated depreciation 1 Jan -552 -476Depreciation on decreases 0 0Depreciation for the accounting period -77 -76Accumulated depreciation 31 Dec -629 -552Book value 31 Dec 666 630
Advance payments and acquisitions in progressAcquisition cost 1 Jan 4,521 33,540Changes +/- -1,643 -29,019Acquisition cost 31 Dec 2,878 4,521
Tangible assets total 269,182 262,597
Non-depreciated acquisition cost ofmachinery and equipment 101,584 93,418
The share of items other than production machinery and equipment is not significant in amount.
2.2. INVESTMENTS
Ownership %of the parent
company2008
Ownership %of the parent
company2007
Group companies
Ab Botnia-Food Oy, Seinäjoki 100 100A-Farmers Ltd, Seinäjoki 97.9 97.9Atria Concept Oy, Seinäjoki 100 100Atria Meat AB, Tukholma 100 100Atria Finland Ltd, Kuopio 100 100Atria-Invest Oy, Seinäjoki 100 100Itikka-Lihapolar Oy, Seinäjoki 100 100Kiinteistö Oy Tievapolku 3, Helsinki 100 100Liha ja Säilyke Oy, Forssa 63.2 63.2Atria Scandinavia AB, Sköllersta 100 100Rokes Oy, Forssa 100 100Suomen Kalkkuna Oy, Seinäjoki 100 100AS Valga Lihatööstus, Valga 100 100OU Atria, Tallinn 100 100UAB Vilniaus Mesa, Vilnius 100 100
Associates
Best-In Oy, Kuopio 50.0 50.0Foodwest Oy, Seinäjoki 33.5 33.5Honkajoki Oy, Honkajoki 47.8 47.8Finnish Meat Research Institute, LTK co-operative, Hämeenlinna 40.7 40.7Länsi-Kalkkuna Oy, Säkylä 50.0 50.0Tuoretie Oy, Helsinki 33.3 33.3
99

2.4. EQUITY 31 Dec 2008 31 Dec 2007
Share capital 1 Jan 48,055 39,258Share issue 5 June 2007 0 7,650Share issue 11 June 2007 0 1,148Share capital 31 Dec 48,055 48,055
Share premium 1 Jan 138,502 138,502Share premium 31 Dec 138,502 138,502
Treasury shares 1 Jan 0 0Acquisition of own shares -542 0Treasury shares 31 Dec -542 0
Restricted equity total 186,015 186,557
Invested unrestricted equity fund 1 Jan 110,228 0Share issue 5 June 2007 0 95,850Share issue 11 June 2007 0 14,378Invested unrestricted equity fund 31 Dec 110,228 110,228
Retained earnings 1 Jan 71,568 60,229Dividend distribution -19,787 -13,740Retained earnings 31 Dec 51,781 46,489Profit for the period 23,293 25,080Retained earnings 31 Dec 75,074 71,568
Unrestricted equity total 185,301 181,796
Equity total 371,316 368,353
Calculation of funds appropriate for distribution as dividendsRetained earnings 51,781 46,489Profit for the period 23,293 25,080Treasury shares -542 0Total 74,532 71,568
The breakdown of the share capital is as follows:2008 2007
amount EUR amount EURA series shares (1 vote/share) 19,063,747 32,408 19,063,747 32,408KII series shares (10 votes/share) 9,203,981 15,647 9,203,981 15,647Total 28,267,728 48,055 28,267,728 48,055
n o t e s t o t h e F i n a n c i a l s t a t e M e n t s 1 J a n – 3 1 d e c 2 0 0 8
100

2.5. ACCRUED APPROPRIATIONS 31 Dec 2008 31 Dec 2007
Depreciation difference 52,440 52,440
2.6. LONG-TERM BORROWED CAPITAL
Bonds 80,000 90,000Loans from financial institutions 181,146 39,896Pension fund loans 14,300 0Total 275,446 129,896
Debts to group companiesOther long-term liabilities 46 55
Total long-term borrowed capital 275,492 129,951
Loans maturing later than in five yearsBonds 40,000 80,000Loans from financial institutions 7,143 4,286Other long-term liabilities 55 55Total 47,198 84,340
2.7. CURRENT LIABILITIES
Bonds 10,000 10,000Loans from financial institutions 91,355 90,013Advance payments received 51 45Trade payables 2,506 3,428Other payables 1,604 837Accruals and deferred income 5,628 4,136
Liabilities to group companiesTrade payables 0 2Other payables 293 2,163Accruals and deferred income 3 2
Total current liabilities 111,440 110,626
Material items included in accruals and deferred income: - amortisation of salaries and social security payments 682 527 - share incentives 0 105 - personnel fund 5 4 - interest accruals 4,236 2,453 - tax accruals 0 936 - others 707 113Total 5,631 4,138
3. NOTES TO THE INCOME STATEMENT, EUR 1,000
1 Jan - 31 Dec 2008
1 Jan - 31 Dec 2007
3.1. NET SALES 46,503 40,991
The company's rental income is presented as net sales because it cor-responds with the present nature of the company's operations.
3.2. OTHER OPERATING INCOME
Service charges to group companies 2,311 2,252Service charges to others 2 0Others 85 82Total 2,398 2,334
3.3. PERSONNEL EXPENSES
Average number of employeesClerical staff in Finland 10 7
Personnel expensesSalaries:CEO, Executive Vice President and Deputy CEO and members of the Board 910 627Members of the Supervisory Board 95 131Other salaries 891 543Total 1,896 1,300
Pension costs 659 291Other staff-related expenses 156 97Total 815 388
Personnel expenses total 2,712 1,689
Pension commitments of the members of the Board and CEOThe company’s statutory pensions are defined contribution plans and have been arranged through an insurance company. The company has no pension commitments towards the CEO and members of the Board or the Supervisory Board.
3.4. DEPRECIATION AND IMPAIRMENTS
Depreciations of tangible andintangible assets 25,950 23,396
Depreciation specification per balance sheet item is included in Section 2.1.
101

3.5. OTHER OPERATING EXPENSES1 Jan -
31 Dec 20081 Jan -
31 Dec 2007
Other operating expenses 5,006 6,204Including administration, marketing, energy, cleaning, operational and other costs as well as fees paid to auditors.
Fees paid to auditorsAuditing fees 126 102Certificates and statements 0 12Tax consulting 11 12Other remunerations 2 171Total 139 297
3.6. FINANCIAL INCOME AND EXPENSES
Return on long-term investmentsDividend yieldFrom group companies 13,621 6,569From other companies 88 185Total 13,710 6,754
Other interest and financial incomeFrom group companies 16,108 7,327From other companies 40,683 2,821Total 56,791 10,148
Interest expenses and other financial expensesTo group companies 25 152To other companies 55,380 16,552Total 55,405 16,704
Impairment on fixed assets investmentsImpairment on group company shares 6,755 0
Financial income and expenses total 8,341 197
Interest expenses and other financial expenses include exchange rate losses (net) 927 1,160
3.7. EXTRAORDINARY ITEMS
Group contributions received 12,500 20,800Group contributions paid -7,000 -850Total 5,500 19,950
3.8. INCOME TAXES
Income taxes on operations 5,782 7,103
4. OTHER NOTES, EUR 1,000
31 Dec 2008 31 Dec 2007
4.1. SECURITIES GIVEN, CONTINGENT LIABILITIES AND OTHER LIABILITIES
Contingent liabilities and other liabili-ties not included in the balance sheet
GuaranteesFor group companies 72,533 86,931Total 72,533 86,931
Leasing liabilitiesMaturing within the next 12 months 0 1,675Maturing later 0 9,697Total 0 11,373
n o t e s t o t h e F i n a n c i a l s t a t e M e n t s 1 J a n – 3 1 d e c 2 0 0 8
102

signatures to the financial statements and annual report
Seinäjoki, 19 March 2009
Martti Selin Timo KomulainenChairman
Tuomo Heikkilä Runar Lillandt
Ilkka Yliluoma Matti Tikkakoski PresidentandCEO
auditor’s note
A report on the audit performed has been issued today.
Seinäjoki, 19 March 2009
Eero Suomela Pekka Loikkanen
Authorised Public Authorised Public
Accountant Accountant
to the annual General Meeting of atria oyj
We have audited the accounting records, the financial statements,
the report of the Board of Directors and the administration of
Atria Plc for the period 1.1.-31.12.2008. The financial statements
comprise the consolidated balance sheet, income statement,
cash flow statement, statement of changes in equity and notes
to the consolidated financial statements, as well as the parent
company’s balance sheet, income statement, cash flow statement
and notes to the financial statements.
responsibility of the board of directors and the Managing directorThe Board of Directors and the Managing Director are responsi-
ble for the preparation of the financial statements and the report
of the Board of Directors and for the fair presentation of the con-
solidated financial statements in accordance with International
FinancialReporting Standards (IFRS) as adoptedby theEU, as
well as for the fair presentation of the parent company’s financial
statements and the report of the Board of Directors in accord-
ance with laws and regulations governing the preparation of the
financial statements and the report of the Board of Directors in
Finland. The Board of Directors is responsible for the appropri-
ate arrangement of the control of the company’s accounts and
finances, and the Managing Director shall see to it that the ac-
counts of the company are in compliance with the law and that
its financial affairs have been arranged in a reliable manner.
auditor’s responsibilityOur responsibility is to perform an audit in accordance with
good auditing practice in Finland, and to express an opinion on
the parent company’s financial statements, on the consolidated
financial statements and on the report of the Board of Directors
based on our audit. Good auditing practice requires that we com-
ply with ethical requirements and plan and perform the audit
to obtain reasonable assurance whether the financial statements
and the report of the Board of Directors are free from materi-
al misstatement and whether the members of the Supervisory
Board and of the Board of Directors of the parent company as
well as the Managing Director have complied with the Limited
LiabilityCompaniesAct.
An audit involves performing procedures to obtain audit
evidence about the amounts and disclosures in the financial
statements and the report of the Board of Directors. The proce-
dures selected depend on the auditor’s judgment, including the
assessment of the risks of material misstatement of the finan-
cial statements, whether due to fraud or error. In making those
risk assessments, the auditor considers internal control relevant
to the entity’s preparation and fair presentation of the financial
statements in order to design audit procedures that are appropri-
ate in the circumstances. An audit also includes evaluating the
appropriateness of accounting policies used and the reasonable-
ness of accounting estimates made by management, as well as
evaluating the overall presentation of the financial statements
and the report of the Board of Directors.
The audit was performed in accordance with good auditing
practice in Finland. We believe that the audit evidence we have
obtained is sufficient and appropriate to provide a basis for our
audit opinion.
opinion on the consolidated Financial statementsIn our opinion, the consolidated financial statements give a true
and fair view of the financial position, financial performance, and
cash flows of the group in accordance with International Finan-
cialReportingStandards(IFRS)asadoptedbytheEU.
opinion on the company’s Financial statements and the report of the board of directorsIn our opinion, the financial statements and the report of the
Board of Directors give a true and fair view of both the con-
solidated and the parent company’s financial performance and
financial position in accordance with the laws and regulations
governing the preparation of the financial statements and the
report of the Board of Directors in Finland. The information in
the report of the Board of Directors is consistent with the infor-
mation in the financial statements.
Seinäjoki, 19 March 2009
Eero Suomela Pekka Loikkanen
Authorised Public Authorised Public
Accountant Accountant
s i G n a t U r e s a n d a U d i t r e p o r t
103

Atria Plc (“Atria” or the “company”) is a Finnish public company, and the responsibilities and obligations of its governing bodies are determined by Finnish law. The parent company, Atria Plc, and its subsidiaries consti-tute the international Atria Group. The company is domiciled in Kuopio.
Responsibility for the administra-tion and operations of Atria Group lies with the governing bodies of the par-ent, Atria Plc. These are the General Meeting, Supervisory Board, Board of Directors and the President and CEO.
Atria’s decision-making and corpor- ate governance are in compliance with the Finnish Companies Act, regulations applied to publicly quoted companies, Atria Plc’ Articles of Association and Nasdaq OMX Helsinki Ltd’s rules and guidelines. As of 1 January 2009, Atria shall also follow the Finnish Corporate Governance Code issued by the Secur- ities Market Association on 20 October 2008 (“Corporate Governance Code”). The full Corporate Governance Code may be viewed at www.cgfinland.fi. In accordance with the Comply or Explain principle, the company departs from the recommendations of the Code as follows:•ThecompanyhasaSupervisoryBoard•TheBoardofDirectorsisappoint-
ed by the Supervisory Board•ThetermofmembersoftheBoard
of Directors is three years•Thecompanyhasnoauditcommittee
The deviations and the reasons for them are presented in more detail in the relevant sections.
General MeetingThe General Meeting is Atria Plc’s su-preme decision-making body. At the General Meeting, shareholders decide on the approval of the financial statements and the use of the profit shown on the balance sheet; discharging the members of the Board of Directors, of the Super-visory Board and the CEO from liability; the number of members on the Supervis- ory Board, their election and remunera-
tion; and on the election of an auditor and the fees of the auditor.
Share classesThe company’s shares are divided into KII and A series, which differ in terms of the voting rights carried by them. Each Series KII share entitles the hold-er to ten (10) votes at a General Meet-ing and each A share to one (1) vote.
Supervisory BoardAs an exception to the recommenda-tions and in accordance with Atria Plc’s Articles of Association, the com-pany has a Supervisory Board. Share-holders of the company representing more than 50% of the votes have ex-pressed their contentment with the current model based on the Super- visory Board, because it brings a far-reaching aspect to the company’s oper- ation and decision-making.
The Supervisory Board is elected by the General Meeting, and it consists of a minimum of 18 and a maximum of 21 members, who are elected for terms of three years. The Supervisory Board meets three times a year on aver- age. The names and ownership data of the members of the Supervisory Board are available on the Atria web-site at www.atria.fi/Corporate Govern-ance/Supervisory Board.
The duties of the Supervisory Board are specified in the Finnish Companies Act and Atria Plc’s Articles of Association. The key duties of the Supervisory Board are to: •Supervisetheadministrationofthe
company by the Board of Directors and the CEO.
•ElectthemembersoftheBoardofDirectors as well as decide which of the members shall act as the Chairman and Vice Chairman of the Board of Directors and decide on their remuneration.
•IssueinstructionstotheBoardofDirectors on matters that are of far-reaching consequence or important in principle.
•Submititsstatementonthefinan-cial statements and auditors’ report to the Annual General Meeting.
Board of DirectorsIn accordance with the Articles of Asso-ciation, Atria’s Board of Directors shall have a minimum of 5 and a maximum of 7 members. As an exception to the recommendations and in line with the Articles of Association, the Supervisory Board elects the members of the Board of Directors as well as decides which of the members shall act as the Chair-man and Vice Chairman of the Board of Directors and decides on their re-muneration. Shareholders of the com-pany representing more than 50% of the votes have expressed their content with the current practice, complying with the Articles of Association, where-by the Board of Directors is appointed by the Supervisory Board.
The term of office of a member of Atria’s Board of Directors differs from the term of one year specified in the recommendations. As per the Articles of Association, the term of a member of the Board of Directors is three (3) years. Shareholders representing more than 50% of the votes have stated that the term of three (3) years is appropriate for the long-term development of the company and have not seen the need to shorten the term specified in the Ar-ticles of Association. The names and ownership data of the members of the Board of Directors are available on the Atria website at www.atria.fi/Corporate Governance/Board of Directors.
Duties of the Board of DirectorsAtria’s Board of Directors shall ensure the appropriate organisation of the company’s administration, operations, accounting and supervision of asset management.
Atria’s Board of Directors has adopted written rules of procedure for the duties of the Board, the mat-ters to be dealt with, meeting practices and the decision-making procedure.
Corporate Governance Principles
104

C o r p o r a t e G o v e r n a n C e p r i n C i p l e S
According to these rules, the Board of Directors discusses and decides on significant matters related to the company’s strategy, investments, or-ganisation and financing. The rules of procedure lay down the following key duties for the Board of Directors:•Approvethestrategicgoalsand
guidelines for the Group and busi-ness areas
•Approvethebudgetsandbusinessplans for the Group and business areas
•Decideontheinvestmentplanforeach calendar year and approve major investments (exceeding one million euros)
•ApprovemajorM&Asandrestructur-ings
•ApprovetheGroup’soperatingprinciples for important areas of management and supervision
•Discussandadoptinterimreportsand financial statements
•Preparethematterstobedealtwithat General Meetings and ensure that decisions are implemented
•Approvetheauditplanofinternalaudit
•AppointtheCEOanddecideonhis or her remuneration and other benefits
•AttheCEO’sproposal,approvethehiring of his or her direct subor-dinates and the principal terms of their employment contracts
•Approvetheorganisationalstruc-ture and the key principles of incentive programmes
•MonitorandevaluatetheCEO’sperformance
•Decideonothermattersthatareimportant considering the size of the Group and are not part of the day-to-day operations, such as considerable expansion or contraction of business or other material changes in operations, as well as the sale and pledging of fixed assets
•Decideonothermatterswhich,underthe Finnish Companies Act, fall within the remit of the Board of Directors
Board committeesThe committees of Atria’s Board of Directors are the Nomination Commit-tee and the Remuneration Committee. The Nomination Committee consists of the Chairmen of the Board of Di-rectors and the Supervisory Board and one member of the Board of Direc-tors. The purpose of the Nomination Committee is to find new members to the Board of Directors and make pro-posals to the Supervisory Board. The Nomination Committee also makes the preparations for the election of the CEO and Deputy CEO. All members of the Nomination Committee are in-dependent of the company. The Com-mittee met four (4) times in 2008.
The Remuneration Committee has two members. The Remuneration Committee consists of the Chairman and Vice Chairman of the Board of Directors. All members of the Remu-neration Committee are independent of the company. The purpose of the Remuneration Committee is to prepare matters related to the remuneration of management and bonus schemes for employees. The Committee met two (2) times in 2008.
The Board of Directors has no au-dit committee; the duties of such com-mittee are performed by the Board of Directors.
The committees have no autono-mous decision-making power. Decisions are made by the Board of Directors based on the committees’ preparations. The committees report on their work to the Board of Directors.
CeoThe company has a CEO in charge of managing the company’s operations in accordance with the instructions and orders issued by the Board of Di-rectors, as well as informing the Board of Directors of the development of the company’s operations and finan-cial performance. The CEO also sees to the organisation of the company’s day-to-day administration and ensures reliable asset management. The CEO is appointed by the Board of Direc-
tors, which decides on the terms of the President’s employment.
The personal and ownership data of the CEO are available on the Atria website at www.atria.fi/Corporate Gov-ernance/Board of Directors. The CEO’s ownership data can be found in the sec-tion “Insider Register”.
Management team Atria Group has a Management Team chaired by the CEO. The Management Team assists the CEO in planning the operations and in operational man-agement.
The names of the members of the Management Team are available on the Atria website at www.atria.fi/Corpo-rate Governance/Atria Group Manage-ment Team. The ownership data of the members can be found at www.atria.fi/Corporate Governance/Insider Register/Members and Share Ownership.
risk managementThe purpose of risk management is to support the execution of Atria’s strat-egy and the achievement of targets, as well as to secure business conti-nuity. Atria Group’s risk management goals, principles, responsibilities and powers are specified in its Risk Man-agement Policy, the aim of which is to contribute to the identification and understanding of risks and to ensure that management receive relevant and sufficient information in sup-port of business decisions. In com-pliance with the policy, the Group has in place an operating model for risk identification and reporting in all business areas. The model forms an integral part of annual strategic plan-ning. In reporting, Atria’s risks are di-vided into four categories: business risks, operational risks, financial risks and accident risks.
internal audit and controlThe operating principles of internal control are confirmed by the com-pany’s Board of Directors. The Board of Directors is in charge of the publi-cation of interim reports and financial >
105

Supervisory Board sinceChairman of the Supervisory BoardAri Pirkola (born 1956), Farmer 2008Member of the Supervisory Board as from 25 June 2008 2008
Ahti-Pekka Vornanen (born 1959), Farmer, graduate of a commercial institute 1999Until 25 June 2008
Vice Chairman of the Supervisory Board 2007Esa Kaarto (born 1959), Farmer, M.Sc. (Agric.) Member of the Supervisory Board 2002
Members of the Supervisory Board Juha-Matti Alaranta (born 1965), Farmer 2000Mika Asunmaa (born 1970), Farmer 2005 Lassi-Antti Haarala (born 1966), Farmer, Bachelor on Natural Resources 2006Juhani Herrala (born 1956), Farmer 2002Henrik Holm (born 1966), Farmer 2002Pasi Ingalsuo (born 1966), Farmer, Bachelor on Natural Resources 2004Veli Koivisto (born 1952), Farmer 2006Olavi Kuja-Lipasti (born 1957), Farmer, M.Sc. (Agric.) 1997Teuvo Mutanen (born 1965), Farmer 2007Seppo Paavola (born 1962), Farmer 2006Pekka Parikka (born 1951), Farmer 2008Heikki Panula (born 1955), Farmer, M.Sc. (Agric.) 2005Pentti Pirhonen (born 1954), Farmer 1999Jouni Sikanen (born 1962), Farmer 2006Juho Tervonen (born 1950), Farmer 2001Timo Tuhkasaari (born 1965), Farmer 2002Ahti-Pekka Vornanen (born 1959), Farmer 1998graduate of a commercial institute
The following members of the Supervisory Board of Directros are due to resign Henrik Holm, Juha-Matti Alaranta, Esa Kaarto, Juho Tervonen, Pentti Pirhonen, Seppo Paavola and Jouni Sikanen.
Auditors properEero Suomela, Authorised Public AccountantPekka Loikkanen, Authorised Public Accountant
Deputy auditorsPricewaterhouseCoopers Oy, firm of Chartered Public AccountantsMarkku Tynjälä, Authorised Public Accountant
a t r i a p l C ' S a D M i n i S t r a t i o n 3 1 D e C e M B e r 2 0 0 8
statement releases, and the CEO of re-porting to the Board of Directors. The Group’s operations are divided into four independently accountable busi-ness areas, whose accountable execu-tives report to the Group CEO.
The purpose of internal audit is to ensure that all of the company’s busi-ness areas comply with the Group’s rules and guidelines and that the op-erations are managed effectively. The results of internal auditing are docu-mented, and they are discussed with the management of the audited entity before the report and suggestions for improvement are presented to the Group CEO.
The entities to be audited are defined in cooperation with Group management. The audit plan is also based on annual Group-wide risk as-sessment. The company’s Board of Di-rectors approves the annual plan for internal audit.
insider policyAtria complies with Nasdaq OMX Hel-sinki Ltd (Helsinki Stock Exchange) Guidelines for Insiders confirmed on 2 June 2008. Atria’s Board of Directors has approved insider guidelines for the company, which include instructions for permanent and project-specific in-siders. The company’s guidelines have been distributed to all insiders.
auditingIn accordance with the Articles of As-sociation, the company shall have at least one (1) and no more than four (4) regular auditors; the number of deputy auditors shall not exceed this. The auditors and deputy auditors shall be public accountants or firms of inde-pendent public accountants authorised by the Central Chamber of Commerce. The term of office of the auditors shall end at the conclusion of the next An-nual General Meeting following their election.
In 2008, Atria Plc’s Annual General Meeting elected Authorised Public Ac-countants Eero Suomela and Pekka Loikkanen as the company’s regular auditors.
>
106

sinceChairman of the BoardMartti Selin (born 1946), Farmer 2005
Vice Chairman of the Board 1996Timo Komulainen (born 1953), Farmer, Bachelor of Natural Resources Member of the Board of Directors 1993
Board of Directors sinceMembers of the Board of Directors Tuomo Heikkilä (born 1948), Farmer 1996Runar Lillandt (born 1944), Agricultural Counsellor 2003Matti Tikkakoski (born 1953), CEO, B.Sc. (Econ.) 2006Ilkka Yliluoma (born 1946), Agricultural Counsellor 2002
Secretary of the Board of Directors Sirpa Huopalainen (born 1965), Master of Laws 2008
First row CEO Matti Tikkakoski (left), Vice Chairman of the Board Timo Komulainen, Chairman of the Board Martti Selin, Chairman of the Supervisory Board Ari Pirkola and Ilkka Yliluoma.Second row Vice Chairman of the supervisory Board Esa Kaarto (left), Tuomo Heikkilä and Runar Lillandt.
107

1. Matti TikkakoskiPresident and CEOB.Sc. (Econ.), born 1953Employed since 2006
2. Juha GröhnDeputy CEO Executive Vice President, Atria Finland and BalticDirector, Primary ProductionM.Sc. (Food Sc.), born 1963Employed since 1990
3. Juha RuoholaExecutive Vice President, Atria RussiaDirector, Procurement and InvestmentsM.Sc. (Agr. & For.), eMBA, born 1965Employed since 1999
4. Chister ÅbergExecutive Vice President, Atria ScandinaviaDirector, Concept & Deliborn 1966Employed since 2006
5. Tomas BackCFOM.Sc. (Econ.) born 1964Employed since 2007
6. Merja LeinoGroup Vice President, Quality and Product SafetyDirector, Convenience Food and Poultry BusinessPhD. (Phil.) born 1960Employed since 1996
7. Jarmo LindholmGroup Vice President, Product Development and Product Group ManagementM.Sc. (Econ.) born 1973Employed since 2002
8. Pasi LuostarinenGroup Vice President, Brand ManagementDirector, Cold CutsM.Sc. (Econ.) born 1966Employed since 2000
9. Jukka MäntykiviGroup Vice President, Steering, Logistics and ITM.Sc. (Sos. Sc.) born 1961Employed since 2001
10. Seija PietiläGroup Vice President, Human ResourcesM.Sc. (Econ.) born 1973Employed since 2006
GROuP FunCTIOnS
Organisation
Primary Production – Juha Gröhn
Quality and Product Safety | Convenience Food – Merja Leino
Brand Management | Cold Cuts – Pasi Luostarinen
Product Development and Product Group Management – Jarmo Lindholm
Concept & Deli – Christer Åberg
Procurement & Investments – Juha Ruohola
Steering, Logistics and IT – Jukka Mäntykivi
Finance and Administration – Tomas Back
Human Resources – Seija Pietilä
BuSInESS AREAS
PRESIDEnT AnD CEO Matti Tikkakoski
ATRIA RuSSIA
Juha Ruohola
ATRIA FInLAnD
AnD BALTIC
Juha Gröhn
ATRIA SCAnDInAVIA
Christer Åberg
a t r i a G r o U p ’ S o r G a n i S a t i o n a n D t o p M a n a G e M e n t 3 1 D e C e M B e r 2 0 0 8
108

3Juha Ruohola
Jukka Mäntykivi 9
Christer Åberg 4
Jarmo Lindholm 7
Juha Gröhn 2Matti Tikkakoski 1
Merja Leino 6 Pasi Luostarinen 8
Seija Pietilä 10
Tomas Back 5
Management Team 2008
109

27 Feb. Atria Group Plc’s financial statement bulletin 1 January - 31 December 2007
03 Mar. Annual summary of stock exchange releases 2007
31 Mar. Atria to restructure operations in Finland
3 Apr. Invitation to the annual general meeting
15 Apr. Atria Group Plc’s Annual Report 2007 has been published
15 Apr. global meat market situation slows Atria’s profit growth in Finland
29 Apr. Decisions taken by Atria Group Plc’s Annual General Meeting
6 May Situation in global meat market hampered Atria’s performance
26 May Atria’s collective redundancy consultation completed
2 Jun. Atria to acquire Ridderheims - specialist in delicatessen
23 Jun. The Swedish Competition Authorities have approved Atria and AB Ridderheims Delikatesser transaction
25 Jun. Atria Plc election of the Board members and the Chairmen
26 Jun. Atria to expand in Estonia through acquisition of two meat processing companies
21 Jul. The Estonian Competition Board has approved Atria’s Estonian transactions
25 Jul. Delays in the opening of Atria Russia’s new meat product plant
31 Jul. Atria to expand to Moscow and acquire meat processing company OOO Campomos
1 Aug. Atria boosts its growth through acquisitions in Sweden and Estonia, situation in the global meat market hampered performance
18 Sep. Atria Scandinavia to restructure its operations
18 Sep. Atria Plc to purchase company’s own shares
7 Oct. The Russian Competition Authorities have approved Atria and OOO Campomos transaction
24 Oct. Improved meat market situation - satisfactory performance by Atria
18 Dec. Atria Plc’s Interim Reports in 2009 and preliminary report 2008
18 Dec. Atria Plc conveys own shares as reward payment
1 Oct.–31 Dec. 2008 Pohjola Pankki Oyj: Purchase of treasure shares,
48 Company Announcements
StoCk exChanGe releaSe SUBjeCtS 2008
i n v e S t o r r e l a t i o n S a n D a n a l y S t S
Financial reporting
The aim of Atria's investor reporting is to ensure that the market has at all times correct and sufficient informa-tion available to determine the value of Atria's share. In addition the aim is to provide the financial markets with versatile information, based on which those active in the capital markets can form a justified image of Atria as an investment object.
Atria has determined a silent peri- od in its investor relation communica-tion that is three weeks prior to the publication of interim and annual re-ports. During this period Atria gives no statements on its financial status.
inveStor inforMationAtria publishes financial informa-tion in real time on its web pages at www.atria.fi/konserni. Here you can find annual reports, interim reports and press and stock exchange re- leases. The company's largest sharehold- ers and insiders as well as their hold-ings are updated regularly to the web pages.Atria Plc's IR contact person:Hanne KortesojaCommunication and IR managerTel: + 358 6 416 8763Fax +358 6 416 8440E-mail: [email protected]
StoCk exChanGe releaSeSAtria Plc published a total of 72 stock exchange releases in 2008. The re- leases can be found on the Atria Group website at www.atria.fi/Latest news/Corporate Releases/Release Ar-chive 2008.
110

Analysts from at least the following firms of brokers have monitored Atria Group as an investment object during 2008:
FIM CorporationJaakko TyrväinenTel. +358 9 613 46 376E-mail: [email protected]
Carnegie Investment Bank ABTel. +358 9 618 711 E-mail: [email protected]
Evli Pankki Oyj Tuomo KangasahoTel. +358 9 4766 9635E-mail: [email protected] SEB EnskildaJutta RahikainenTel. +358 9 616 287 13E-mail: [email protected]
Pohjola Bank PlcMatias RautionmaaTel. 010 252 4408E-mail: [email protected] Nordea MarketsRauli JuvaTel. +358 9 165 59944E-mail: [email protected] eQ Pankki OyJarkko SoikkeliTel. +358 9 6817 8654E-mail: [email protected]
Handelsbanken Capital MarketsMaria WikströmTel. +358 10 444 2425E-mail: [email protected]
Sofia Pankki OyjMartin SundmanTel. +358 10 241 5166E-mail: [email protected]
Danske Markets EquitiesKalle KarppinenTel. +358 10 236 4794E-mail: [email protected] E. Öhman J:or Fondkommission ABElina PennalaTel. +358 9 8866 6043E-mail: [email protected]
ICECAPITAL Securities Ltd.Robin SantavirtaTel. +358 9 6220 5092E-mail: [email protected]
Analysts
111

atria plCHead office:Atriantie 1, nurmo P.O. Box 900, FI-60060 ATRIA,FInLAnD Tel. +358 20 472 8111 Fax +358 6 416 8440 Atria Group administration:Läkkisepäntie 23FI-006300 Helsinki, FInLAnD Fax +358 9 774 1035
atria finlanD
Telephone number for all of Atria Finland’s offices: +358 20 472 8111.
ATRIA FINLAND LTD.Head office Atriantie 1, nurmoP.O. Box 900, FI-60060 ATRIA, FInLAnDFax +358 6 416 8440
Invoicing address:P.O. Box 1000FI-60061 ATRIA, FInLAnD
Customer Service Center:Varastotie 9, SeinäjokiP.O. Box 900, FI-60060 ATRIA, FInLAnD Fax +358 6 416 8202
Financial Administration:Vaasantie 1, SeinäjokiP.O. Box 900, FI-60060 ATRIA, FInLAnD Fax +358 6 416 8207
Commercial Functions:Läkkisepäntie 23FI-006300 Helsinki, FInLAnD Fax +358 9 774 1035
Other locations:
Yrittäjäntie 60FI-03600 Karkkila, FInLAnD Fax +358 9 387 2732
Rahikkatie 95FI-61850 Kauhajoki, FInLAnDFax +358 6 231 3377
Ankkuritie 2P.O. Box 147, FI-70101 Kuopio, FInLAnD Fax +358 17 262 7776
Pusurinkatu 48FI-30100 Forssa, FInLAnDTel. +358 3 41 541 Fax +358 3 415 4244 A-Logistics LtdAtriantie 1, nurmo P.O. Box 900, FI- 60060 ATRIA, FInLAnDFax +358 6 416 8038
Tesomanvaltatie 24FI-33310 Tampere, FInLAnDFax +358 3 345 1297
Atria-Tekniikka OyAtriantie 1, nurmo P.O. Box 900, FI-60060 ATRIA, FInLAnDFax +358 6 416 8038
atria SCanDinavia
ATRIA SCANDINAVIA ABOffice:Augustendalsvägen 19P.O. Box 1229SE-131 28 nACKA STRAnD, SWEDEnTel. +46 19 300 300Fax +46 19 230 022
SE-697 80 SKÖLLERSTA, SWEDEn Tel. +46 19 300 300Fax +46 19 230 022
Drottninggatan 14SE-252 21 HELSInGBORG, SWEDEnTel. +46 19 300 300Fax +46 42 38 14 61
ATRIA CONCEPT OyOffice:Augustendalsvägen 19P.O. Box 1229SE-131 28 nACKA STRAnD, SWEDEnTel. +46 19 300 300Fax +46 8 556 306 60
ATRIA FOODSERVICE ABDrottninggatan 14SE-252 21 HELSInGBORG SWEDEnTel. +46 19 300 300Fax +46 42 38 14 61 Augustendalsvägen 19 P.O. Box 1229 SE-131 28 nACKA STRAnD SWEDEnTel. +46 19 300 300 Fax +46 8 556 306 60 Vindkraftsvägen 5SE-135 70 STOCKHOLM, SWEDEn Tel. +46 19 300 300Fax +46 8 566 490 99
ATRIA RETAIL ABOffice/production:SE-697 80 SKÖLLERSTA, SWEDEnTel. +46 19 300 300Fax +46 19 230 022 Other locations:Skogholmsgatan 12P.O. Box 446SE-201 24 MALMÖ, SWEDEnTel. +46 19 300 300Fax +46 40 224 273
Grosshandlarvägen 1P.O. Box 42075SE-126 13 STOCKHOLM, SWEDEnTel. +46 19 300 300Fax +46 8 685 4263
Hjälmarydsvägen 2P.O. Box 1018SE-573 28 TRAnÅS, SWEDEnTel. +46 19 300 300Fax +46 140 573 97
Maskingatan 1SE-511 62 SKEnE, SWEDEnTel. +46 19 300 300Fax +46 320 20 58 10
Svetsaregatan 6SE-302 50 HALMSTAD, SWEDEnTel. +46 19 300 300Fax +46 35 17 26 00
Johannelundsgatan 44P.O. Box 44069SE-506 03 BORÅS, SWEDEnTel. +46 19 300 300Fax +46 33 16 95 59
Östanåkravägen 2SE-340 36 MOHEDA, SWEDEnTel. +46 19 300 300Fax +46 472 726 61
Tryckerigatan 12SE-571 34 nÄSSJÖ, SWEDEnTel. +46 19 300 300Fax +46 380 153 75
Prästkragens väg 9P.O. Box 188SE-132 26 SALTSJÖ-BOO, SWEDEnTel. +46 19 300 300
FALByGDENS OST AB Göteborgsvägen 19SE-521 30 FALKÖPInG, SWEDEn Tel. +46 515 77 66 00Fax +46 515 77 66 80 SARDuS LäTTA MÅLTIDER ABHanholmsvägen 25 P.O. Box 6015 SE-600 06 nORRKÖPInG, SWEDEn Tel. +46 19 300 300Fax +46 11 36 67 00
Speditionsvägen 25SE-142 50 SKOGÅSTel. +46 19 300 300Fax +46 8 771 59 89
Hagvägen 5SE-831 48 ÖSTERSunD, SWEDEnTel. +46 19 300 300Fax +46 63 852 31
RIDDERHEIMS DELIkATESSER Södra Långebergsgatan 12 SE-421 32 Västrä Frölunda, SWEDEn Tel. +46 31 722 5500 Fax +46-31-722 5505
3-STJERNET A/SLangmarksvej 1DK-8700 HORSEnS, DEnMARKTel. +45 76 28 25 00Fax +45 76 28 25 01 atria rUSSia
OOO PIT-PRODuCTpr. Obukhovskoy Oborony 70RuS-192029, Saint-Petersburg, RuSSIATel. + 7 812 33-66-888Fax + 7 812 346 [email protected] www.pitproduct.ru
OOO MPZ CAMPOMOS Ryabinovaya street, 32RuS-121471 Moscow, RuSSIATel. +7 495 448 6704Fax +7 495 4448 4503 atria BaltiC
AS VALGA LIHATÖÖSTuSMetsa str.19EE-68206 Valga, ESTOnIATel. +372 76 79 900Fax +372 76 79 [email protected] [email protected] www.atria.ee AS WõRO kOMMERTS Vilja 14b,65605 Võru, ESTOnIA Tel. +372 782 8830Fax +372 782 [email protected]
AS VASTSE-kuuSTE LIHATÖÖSTuSVastse-kuuste valdPölva maakond63601 Vastse-Kuuste, ESTOnIATel. +372 7970 216Fax +372 7970 215 [email protected]@vklt.ee
C o n t a C t D e t a i l S
112

Printed annual reports can be ordered by e-mail at [email protected]
or by phone from +358 6 416 8763.
Atria Plc’s annual report 2008 is published
on the Internet at www.atria.fi/konserni.
Concept and production: Selander & Co. Communication Agency
Design: Vanto Design Oy
Pictures: Studio Sami Helenius (portraits), Atria Plc, iStockphoto
Printing house: Hämeen Kirjapaino Oy, 4/2009

ATRIA PLCP.O. Box 900, FI-60060 ATRIA, FINLANDTel. +358 20 472 8111Fax +358 6 416 8440www.atria.fi