“vulnerability of coastal fishing communities to...
TRANSCRIPT

“Vulnerability of coastal fishing communities
to climate variability and change: implications for fisheries livelihoods and management
in Peru”
DISSERTATION
zur Erlangung des Grades eines
Doktors der Sozialwissenschaften
- Dr. rer. pol. -
Angefertig am
Zentrum für Marine Tropenökologie
dem Fachbereich Geographie
der Universität Bremen
vorgelegt von:
Marie-Caroline Badjeck
Bremen Mai, 2008

Erster Gutachter : Prof. Dr. Hellmuth Lange
ARTEC an der Universität Bremen Zweiter Gutachter : Prof. Dr. Michael Flitner
ARTEC, ZMT an der Universität Bremen Tag des öffentlichen Kolloquiums: Juli 2008

To my parents, Benjamin and Francine, for their constant love and support
- you inspire me each and every day!

i
Acknowledgements This PhD is the result of a three year research financed by the European Union-funded project CENSOR (Climate variability and El Niño Southern Oscillation: Impacts for natural resources and management, contract 511071). Many individuals have provided me with academic and emotional support, guiding me through this life learning experience. I am indebted to all of them and if not named they are certainly not forgotten. I would like to thank Prof. Dr. Hellmuth Lange and Prof. Dr. Michael Flitner for supervising this thesis. I greatly appreciate the support and advice provided during these three years by Prof. Dr. Matthias Wolff within the CENSOR project. In Peru, my supervisor Dr. Jaime Mendo from the Universidad Agraria La Molina (UNALM) in Lima provided invaluable assistance. Without his constant support this PhD would not have been possible, Gracias Profe! I was hosted for nearly two years by the Fisheries Faculty of the UNALM and I am grateful for the help and camaraderie provided by the staff and students. My research in Peru was also made possible by a variety of organizations and individuals within these: Fundacion para el Desarollo Agrario, Universidad Nacional San Luis Gonzaga de Pisco, Universidad Nacional de Piura, the Vice-Ministry of Fisheries regional offices in Piura and Pisco, and the Instituto del Mar de Peru. Additional financial support for the organization of stakeholder meetings and the making of the ‘CENSOR documentary’ from the PASARELAS SSA EU-INCO DEV project is also acknowledged. Moreover participation in conferences and expert meetings throughout these three years, which provided an arena to receive helpful feedback, were made possible thanks to the following organizations: International Human Dimensions Programme on Global Environmental Change, Inter-American Institute for Global Change Research, Global change SysTem for Analysis, Research and Training, Food and Agriculture Organization of the United Nations, University of East Anglia and the WorldFish Center. While many individuals provided support during the fieldwork in Peru I would like to acknowledge by name: Victor Ramos, Jose-Antonio Tapia Verme, Sandra Cordova, Fabian Machiavelo, Gina Manrique, Jorge, Oimer and Gerald: you made surveying under the burning sun an enjoyable experience! Ricardo Gordillo, Ricardo Bandin, Alex Acasiete, Diego de la Cadena Mory and Eduardo “Chiki” del Carpio Willstatter provided not only invaluable insight and contacts into the artisanal fishing industry but also friendship. My deep appreciation goes to the Revoredo family in Lima, especially Diana Revoredo, and to Magaly Arrieta, Tania Mendo, Kelly Ortega and Cecilia Villacorta. My stay in Peru was not only an academic experience but the discovery of a country and a culture that I will forever cherish. The friendship you provided during these sometimes challenging moments will never be forgotten! In Germany I would like to acknowledge the help and friendship from colleagues and fellow students at the Center for Tropical Marine Ecology and within the CENSOR project. In particular my warmest thanks go to: Gesche Krause, Petra Käpnick, Dr. Ursel Selent, Gabriele Boehme and Flora Vadas from the ISATEC master program for her help during the fieldwork. Fellow PhD students Marc Taylor, Jenny Leal-Flórez, Sonja Ruckert, Gertraud Schmidt and Connie Roder provided invaluable moral support (and sometimes a roof!). Muchissimas

ii
gracias to Alejandro Espinoza, Jorge Paramo and Friedemann Keyl for the many enjoyable coffee breaks and making me believe that I was indeed a ‘researcher’. Finally I would like to thank Ricardo Chero and Leyla Knittweis, who endured my constants doubts and made me smile. My stay in Germany would have not been the same without the presence of my flat mates Ingo, Kelly and Tania, who provided coffee and laughter that kept me going. I am also indebted to Nadi, Anna, Laurent, Christelle, An, Anne-Marie and Giulia who despite the distance encouraged me during all those years, listen to me in time of need, visited Germany and Peru, providing solace and laughter. Reynaldo, who has been by my side during this entire PhD, deserves a special mention for his constant friendship and support, for putting up with my long absences and cheering me up when all seemed unattainable. My family has been my backbone during this research. I would like to say a heartfelt thank you to my brother and my mother and father for encouraging and believing in me every step of the way. Maman merci pour toujours être la quand j’ai besoin d’aide, que ferais-je sans toi…Papa, c’est un peu à cause de toi que je me suis lancée dans cette aventure qu’est le doctorat, merci d’être une source d’inspiration! Social sciences are the study of human society and of individual relationships. This PhD is about individuals and their families in Sechura and Pisco who have opened their hearts and invited me into their daily lives. I am forever grateful to all of those who kindly embraced my presence and shared with me their knowledge. They are the soul of this thesis. A particular thought goes to the fishermen in Pisco and their families who have greatly suffered after the August 2007 earthquake.

iii
Abstract
The warm phase of El Niño Southern Oscillation (ENSO) is characterized in Peru by positive
sea surface temperatures and negative sea level pressure anomalies. Biotic responses to this
event range from changes in species composition, abundance and biomass, changes in
reproductive success, larval dispersal and recruitment, as well as changes in food availability,
competition and predation. The thesis characterized fishermen livelihoods and how they
responded to El Niño events in two sites in the North (Sechura) and South (Pisco) of Peru.
Additionally, it explored how institutions enable or constrain fishermen livelihoods and
responses to El Niño. While both sites have different histories of ENSO related impacts, they
share the fact that the artisanal fishing sector plays an important role in the local economy.
Livelihood assets exhibit mixed patterns with Pisco possessing a stronger livelihood platform
in terms of assets but lower incomes than in Sechura. This finding highlights the fact that
income is not an accurate measure of resilient livelihoods and needs to be contextualized.
Seasonal migration is a livelihood option practiced by fishermen in both sites depending on
seasonality, the de facto open access facilitating fishermen mobility. The thesis also identified
that fishermen are largely dependent on marine resources for their livelihoods, occupational
pluralism being low at both sites. Diversification being considered a risk-reduction
mechanism and a building block towards resilient livelihoods, the findings suggest that
fishermen are vulnerable to external shocks due to their high reliance on fishing activities.
Moreover, disturbances do not only include climate variability, but also market changes to
which fishermen must adapt.
El Niño events engender negative livelihood outcomes in the North, where floods have a
significant impact on households and the collapse of the scallop fishery considerably
decreases incomes. Conversely, in Pisco the increase in scallop landings provides an
economic “bonanza” for fishermen. An array of coping strategies can be observed in both
sites, mainly prey-switching and migration. However, in Sechura, exiting the fisheries sector
is also a favored strategy. Additionally, the damages of the devastating floods in the North
poses considerable strain on livelihoods and disaster risk reduction initiatives in these
communities are needed.

iv
Current institutional arrangements in the artisanal fishery, with the de facto open access,
enable migration, an important livelihood option and coping strategy during El Niño in both
communities. With the current chorus of dissatisfaction and trend towards regionalization of
the fishery, changes in this property right regime should be carefully evaluated before being
implemented. Finally, the thesis revealed that formal institutions negatively affect livelihood
outcomes in both sites, the failure of decentralization, hence institutional interplay, hampering
fisheries management. With El Niño being a recurrent phenomenon on the Peruvian shores,
expected to increase in frequency due to global climate change, adaptive management
strategies focusing on diversification of livelihoods, migration and property rights are
imperative. The livelihood framework combined with institutional analysis and the resilience
perspective provided a useful insight into the complex range of assets and activities affected
by climatic events as well as the responses of fishermen. This work is, hitherto, one of the few
empirical studies exploring fishermen livelihoods in Peru and further research is warranted as
well as the incorporation of the findings into ecological and biological studies looking at the
dynamics of the artisanal fisheries, especially in the context of El Niño.

1
TABLE OF CONTENTS Acknowledgements ..................................................................................................................... i Abstract ..................................................................................................................................... iii List of Figures ............................................................................................................................ 5 List of Tables.............................................................................................................................. 7 List of Abbreviations.................................................................................................................. 9 CHAPTER 1 ........................................................................................................................... 10 INTRODUCTION.................................................................................................................... 10 1. Research rationale ............................................................................................................ 10 1.1 Climate variability and artisanal fisheries .................................................................... 10 1.2 Peru and El Niño .......................................................................................................... 11
1.2.1 Artisanal fisheries management and the role of social sciences .......................... 12 1.3 Thesis aims ................................................................................................................... 13 CHAPTER 2 ........................................................................................................................... 16 FISHING FOR CHANGE: THE STUDY OF FISHERFOLK RESILIENCE TO CLIMATE VARIABILITY FROM A LIVELIHOODS AND INSTITUTIONAL PERSPECTIVE ........ 16 2.1 Introduction .................................................................................................................. 16 2.2 Resilience ..................................................................................................................... 17
2.2.1 Emergence of the resilience perspective .............................................................. 17 2.2.2 Social-ecological systems and fisheries ............................................................... 19
2.3 Vulnerability................................................................................................................. 23 2.3.1 Political economy, social constructivism and political ecology........................... 24 2.3.2 Hazards approach and IPCC definition of vulnerability ...................................... 25
2.4 Fisherfolk resilience: towards a framework ................................................................. 28 2.5 Livelihoods security ..................................................................................................... 30
2.5.1 The sustainable livelihoods approach and livelihood security............................. 30 2.5.1.1 Human security and livelihood security........................................................... 32
2.5.2 Fisheries livelihoods and climatic stresses........................................................... 33 2.5.2.1 Changes in natural capital ................................................................................ 34 2.5.2.2 Reduced financial capital, damage to physical capital and changes in livelihood outcomes 35 2.5.2.3 Reduced human capital .................................................................................... 36 2.5.2.4 Impact on social capital .................................................................................... 37
2.5.3 Integrating livelihood security in the study of resilience ..................................... 38 2.6 An institutional approach to the study of resilience and vulnerability......................... 43
2.6.1 Theories of Institutions......................................................................................... 43 2.6.1.1 “Old” Institutional Economics ......................................................................... 43 2.6.1.2 “New” Institutional Economics........................................................................ 44 2.6.1.2.1 Transaction Costs Theory............................................................................. 44 2.6.1.2.2 Theory of collective action........................................................................... 46 2.6.1.3 What about social capital?................................................................................ 48
2.6.2 Institutions in fisheries ......................................................................................... 50 2.6.2.1 Institutional design ........................................................................................... 50 2.6.2.2 Institutional interplay: the example of co-management and decentralization.. 54 2.6.2.3 Fit and scale...................................................................................................... 55
2.7 Hybrid conceptual framework to study resilience of fisherfolk:.................................. 57 2.8 Conclusion.................................................................................................................... 59

2
CHAPTER 3 ........................................................................................................................... 61 STUDY SITES AND METHODS........................................................................................... 61 3.1 Introduction .................................................................................................................. 61 3.2 Peruvian artisanal fishery ............................................................................................. 61
3.2.1 Characteristics: fleet, target species and socio-economic features....................... 61 3.2.2 Political and administrative framework ............................................................... 64
3.3 El Niño and the fisheries sector.................................................................................... 70 3.4 Multiple-case studies approach .................................................................................... 72
3.4.1 Region of Piura: Bahia de Sechura....................................................................... 72 3.4.2 Region of Ica: Bahia Paracas and Independancia ................................................ 74
3.5 Methods ........................................................................................................................ 75 3.5.1 Research Methods – Data collection .................................................................... 77
3.5.1.1 Archival research.............................................................................................. 77 3.5.1.2 Workshops and focus groups ........................................................................... 77 3.5.1.3 Observations and interviews ............................................................................ 79 3.5.1.4 Audiovisual interviews..................................................................................... 80 3.5.1.5 Quantitative approach: fishermen survey......................................................... 80 3.5.1.6 Fieldwork limitations and ethical considerations............................................. 82
3.5.2 Research Methods - Data analysis........................................................................ 82 3.5.2.1 Data processing and initial stages of analysis .................................................. 82 3.5.2.2 Analysing qualitative data ................................................................................ 83 3.5.2.3 Quantitative analysis ........................................................................................ 83 3.5.2.3.1 Univariate analysis ....................................................................................... 83 3.5.2.3.2 Multivariate analysis .................................................................................... 84 3.5.2.4 Causal loop diagrams ....................................................................................... 85
CHAPTER 4 ........................................................................................................................... 86 LIVELIHOOD ASSETS: WHAT ARE THE BUIDLING BLOCKS OF LIVELIHOOD SECURITY?............................................................................................................................. 86 4.1 Introduction .................................................................................................................. 86 4.2 Objective and methods ................................................................................................. 87
4.2.1 Workshops and interviews ................................................................................... 87 4.2.2 Fishermen surveys................................................................................................ 87
4.3 Understanding the asset base in Sechura and Pisco: learning from resource users ..... 88 4.3.1 Human capital....................................................................................................... 88 4.3.2 Social capital ........................................................................................................ 91 4.3.3 Financial capital ................................................................................................... 91 4.3.4 Physical capital..................................................................................................... 92 4.3.5 Natural capital ...................................................................................................... 92
4.4 Fishermen capital assets ............................................................................................... 93 4.4.1 Typology of fishermen and demographic characteristics..................................... 93 4.4.2 Human capital....................................................................................................... 95
4.4.3 Financial capital ....................................................................................................... 98 4.4.4 Social capital ........................................................................................................ 98 4.4.5 Physical capital................................................................................................... 101 4.4.6 Natural Capital ................................................................................................... 106
4.5 Discussion .................................................................................................................. 113

3
4.5.1 Human capital..................................................................................................... 113 4.5.2 Social capital .......................................................................................................... 115 4.5.3 Financial capital ..................................................................................................... 118
4.5.4 Physical capital................................................................................................... 119 4.5.5 Natural capital .................................................................................................... 120
4.6 Conclusion.................................................................................................................. 122 CHAPTER 5 ......................................................................................................................... 124 LIVELIHOODS OPTIONS, OUTCOMES AND CONSTRAINTS ..................................... 124 5.1 Introduction ................................................................................................................ 124 5.2 Objectives and methods.............................................................................................. 125
5.2.1 Workshops and interviews ................................................................................. 125 5.2.2 Fishermen survey ............................................................................................... 125
5.3 Occupation and livelihood diversification ................................................................. 126 5.4 Migration as a livelihood strategy .............................................................................. 128 5.5 Livelihood outcomes .................................................................................................. 130 5.6 ‘Narratives from below’: Users’ perception of fisheries management and its impact on livelihoods .............................................................................................................................. 132 5.7 Discussion .................................................................................................................. 138
5.7.1 Occupational diversity or dependence on marine resources? ............................ 138 5.7.2 Seasonal migration as a livelihood strategy ....................................................... 139 5.7.3 Livelihood outcomes: what can income tell us? ................................................ 140 5.7.4 Institutional design and cross-scale interaction.................................................. 142
5.8 Conclusion.................................................................................................................. 143 CHAPTER 6 ......................................................................................................................... 144 IMPACTED, COPING OR ADAPTING? FISHERMEN LIVELIHOOD SECURITY IN THE CONTEXT OF EL NINO ...................................................................................................... 144 6.1 Introduction ................................................................................................................ 144 6.2 Objectives and methods.............................................................................................. 145
6.2.1 Workshop and interviews................................................................................... 145 6.2.2 Fishermen survey ............................................................................................... 145
6.3 Impact of EN on Natural capital................................................................................. 146 6.4 Impact of EN on fishing activities and fishermen responses ..................................... 152
6.4.1 Impact on fishing activities ................................................................................ 152 6.4.2 Responses to changes in natural capital ............................................................. 155 6.4.3 Integrated view of impacts and response strategies ........................................... 157
6.5 Impact on households................................................................................................. 158 6.6 Social capital: did fishermen and their household cope ............................................. 162 6.7 ‘Narratives from above’: institutional response in Sechura and market changes ...... 164 6.8 Discussion .................................................................................................................. 166
6.8.1 Impact on natural capital .................................................................................... 166 6.8.2 Impact on physical capital .................................................................................. 166 6.8.3 Responses to changes ......................................................................................... 167
6.8.3.1 Short term adaptation strategies ..................................................................... 167 6.8.3.2 Long term adaptation strategies ..................................................................... 168
6.8.4 Can household cope on their own?..................................................................... 169 6.9 Conclusion.................................................................................................................. 169

4
CHAPTER 7 ......................................................................................................................... 171 CLIMATE VARIABILTY AND THE PERUVIAN SCALLOP FISHERY: THE ROLE OF FORMAL INSTITUTIONS IN RESILIENCE BUILIDNG.................................................. 171 7.1 Introduction ................................................................................................................ 171 7.2 Objectives and methods.............................................................................................. 172
7.1.1 Interviews and secondary data ........................................................................... 172 7.1.2 Stakeholder meetings and causal loop analysis.................................................. 172
7.3 Impact of ENSO ......................................................................................................... 173 7.4 Formal institutional response to climate variability ................................................... 175
7.4.1 El Niño of 1982-83: The surprise....................................................................... 175 7.4.2 El Niño 1997-98: Missed opportunity................................................................ 176 7.4.3 The 2000-06 period: Steps toward adaptation?.................................................. 178
7.5 Responding to disturbance: a synthesis...................................................................... 180 7.6 Exploring the role of formal institutions in resilience building with causal loop diagrams ................................................................................................................................. 183
7.6.1 Conceptual model description ............................................................................ 184 7.6.2 Identifying causality and feedback loops ........................................................... 187
7.7 Discussion and conclusion: Pathways to resilience?.................................................. 189 CHAPTER 8 ......................................................................................................................... 191 CONCLUSIONS.................................................................................................................... 191 8.1 Livelihood security and institutions: building blocks for resilient social ecological systems?.................................................................................................................................. 191 8.2 El Niño and livelihoods.............................................................................................. 193 8.3 Formal institutions and El Niño: what role in resilience building?............................ 194 8.4 Fisheries management in the context of climate variability and change.................... 195 8.5 Outlook....................................................................................................................... 196 REFERENCES ..................................................................................................................... 197 ANNEX 1............................................................................................................................... 213 ANNEX 2............................................................................................................................... 214 ANNEX 4............................................................................................................................... 216 ANNEX 5............................................................................................................................... 220

5
List of Figures CHAPTER 1 Figure 1Thesis structure in relation to research objectives ...................................................... 15 CHAPTER 2 Figure 2 Resilience is another dimension of the adaptive cycle. Source of text and picture (Gunderson and Holling, 2001)................................................................................................ 21 Figure 3 Space/time-scale diagram of characteristic processes from the natural sciences: (a) physical; (b) biological and from the social sciences; (c) fishing; (d) fishing communities. From Perry and Ommer (2003) ................................................................................................ 23 Figure 4 Conceptual model for vulnerability assessment at the global scale Allison et al (2005) ....................................................................................................................................... 27 Figure 5 Rural livelihoods framework (Allison and Horemans 2006)..................................... 31 Figure 6 Identifying resilience of fisherfolk livelihood security with causal loop diagrams: a theoretical example................................................................................................................... 42 Figure 7 Typology of co-management arrangements (Allison and Badjeck, 2004 adapted from ; Sen and Raakjaer Nielsen, 1996) ........................................................................................... 55 Figure 8 Temporal scale and fisheries management (Garcia and Charles, 2007) .................... 56 Figure 9 Multitier framework for analyzing SES (Ostrom, 2007) ........................................... 58 Figure 10 Second-tier variables in framework (Ostrom, 2007) ............................................... 58 Figure 11 Hybrid framework for the study of fisherfolk resilience. ........................................ 59 CHAPTER 3 Figure 12 Effect of El Niño on pelagic species (Ñiquen and Bouchon 2004) ......................... 70 Figure 13 Map of Study sites ................................................................................................... 72 Figure 14 Atlas Network View of code “Negative institutional response to El Niño”............ 83 Figure 15 Causal loop diagram ................................................................................................ 85 CHAPTER 4 Figure 16 Migrants distribution across survey sites. Percentages............................................ 95 Figure 17 Type of capacity building received. Percentage of valid answers. .......................... 97 Figure 18 Distribution across site of possession of social and health insurance and credit. Percentage of valid answers. .................................................................................................... 98 Figure 19 Distribution of type of groups across sites. Percentage of valid multiple responses (n=339). .................................................................................................................................. 100 Figure 20 Distribution of type of help received across sites. Percentage of valid multiple responses (n=299)................................................................................................................... 101 Figure 21 Component plot of fishing activity and physical capital variables for Sechura (A) and Pisco (B) .......................................................................................................................... 105 Figure 22 Scallop divers in Sechura Bay. Photo M-C Badjeck ............................................. 106 Figure 23 Component plot of fishing activity and target species for Sechura (A) and Pisco (B)................................................................................................................................................ 112 Figure 24 Dendogram from hierachical cluster analysis (Ward’s method and percent disagreement), using species presence absence data and types of gear for Sechura (A) and Pisco (B) ................................................................................................................................. 113

6
CHAPTER 5 Figure 25 Distribution of type of occupations across sites (excluding fishing). Percentage of valid answers (n=437 open ended question). ......................................................................... 126 Figure 26 Reasons for choosing fishing as an activity. Percentage of valid answers (n=332 open-ended question) ............................................................................................................. 127 Figure 27 Distribution of type of women occupations across sites. Percentage of respondents (N=572) (Number of answers n=333). ................................................................................... 128 Figure 28 Classification tree (CHAID growing method) with dependent variable ‘decision’ to and independent variables: Site, Fishing activity and position on board ............................... 129 Figure 29 Classification tree (CHAID growing method) with dependent variable family income quartile and independent variables site and fishing activity...................................... 132 Figure 30 Network view of code “No management” ............................................................. 136 Figure 31 Steps to obtain a special concessions in Pisco (below the green line) and Lima (above the green line) ............................................................................................................. 137 CHAPTER 6 Figure 32 Component plot of fishing activity and target species for Sechura (A) and Pisco (B)................................................................................................................................................ 150 Figure 33 Classification tree (CHAID growing method) with dependent variable Type of change and independent variables: Site and Fishing activity................................................. 156 Figure 34 Changes in fishing zones during EN. Percentage of valid answers. ...................... 157 Figure 35 Classification tree (CHAID growing method) with dependent variable Type of impact (1.Positive, 2. Negative, 3.More or less, 4.No effect) and independent variables: Site and Fishing activity. ............................................................................................................... 159 Figure 36 Classification tree (CHAID growing method) with dependent variable “Needed help?” (0.No 1.Yes) and independent variables: Site and Fishing activity. ........................... 162 Figure 37 Who provided assistance during EN? Percentage of valid answers. ..................... 163 Figure 38 What kind of help did you received?. Percentage of valid answers. ..................... 163 CHAPTER 7 Figure 39 Annual catch and sea surface temperature changes in Pisco 1982- 2003 (Flores et al. 1994; Mendo and Wolff 2003; Guevara and Estrella unpublished)....................................... 173 Figure 40 Annual catch, sea surface temperature (SST) and river discharge changes in Sechura 1982-2003. Landing data was derived from IMARPE catch statistics (Flores et al. 1994) and reports (Tafur et al. 2000; Flores Ysla et al. 2005; Guevara and Estrella unpublished). River discharge data was granted by the GeoforschungsZentrum (GFZ) Postam and recorded by the Sistema de Alerta Temprana – Piura (SIAT), at the Sanchez Cerro Bridge, Piura River.............................................................................................................................. 174 Figure 41 Institutional responses to disturbance over time in Pisco (a) and Sechura (b). Shaded areas are disturbances (environmental, socio – economic etc.) while non-shaded areas are responses. Dashed lines represent migration fluxes of fishermen.................................... 181 Figure 42 Phases of policy development for the scallop fishery for the period 1982 - 2003 related to landings in Sechura and Pisco. ............................................................................... 183 Figure 43 Conceptual model of scallop’s fishery response to ENSO events using causal loop diagrams. ................................................................................................................................ 185 Figure 44 Conceptual model of the scallop fishery and institutional response to ENSO event................................................................................................................................................ 186

7
List of Tables
CHAPTER 2 Table 1 Resilience concepts, from the more narrow interpretation to the broader social–ecological context (Folke 2006) ............................................................................................... 21 Table 2 Studying resilience of fisherfolk: the example of climate variability ......................... 30 Table 3 Capital assets change and climatic stress: possible indicators .................................... 39 Table 4 Livelihood approach and impact assessment through indicators: challenges and issues (Badjeck 2004) ......................................................................................................................... 40 Table 5Historical evolution of property rights in fisheries (Scott 2000). ................................ 53 CHAPTER 3 Table 6 Ley General de Pesca (1992) adapted from Mendo et al, 2002, p.37 ......................... 65 Table 7 Aquaculture property right regime.............................................................................. 66 Table 8 National formal organizations involved in the fisheries sector................................... 68 Table 9 Regional formal organizations involved in the management of fisheries resources in Sechura Bay’s (Piura) and Paracas and Indenpendencia Bay (Ica)......................................... 69 Table 10 Damages to the fishery sector in Peru during EN 1997-98 (1, 000 of Nuevo soles) (CAF, 2000).............................................................................................................................. 71 Table 11 Summary of methods ................................................................................................ 76 CHAPTER 4 Table 12 General characteristics of the asset base in Sechura based on stakeholder workshop (n=35) ....................................................................................................................................... 89 Table 13 General characteristics of the asset base in Pisco based on stakeholder workshop (n=25) ....................................................................................................................................... 90 Table 14 Fishing gear and demographic characteristics across survey sites of sampled population (N=572). Percentage and mean of valid answers. .................................................. 94 Table 15 Formal knowledge across sites. Percentages of valid answers. ................................ 96 Table 16 Completion of studies by educational level across sites. . ........................................ 96 Table 17 Age and years of fishing and incidence of injuries across sites. Mean and percentage of valid answers........................................................................................................................ 97 Table 18 Measure of social capital across sites. Percentage of valid answers. ...................... 100 Table 19 Physical capital variables across sites. Shaded areas with P values<0,05 .............. 102 Table 20 Physical capital and type of fishing activity: Component loadings ........................ 104 Table 21 Target species across sites, means of valid multiple responses. Shaded areas with P values<0,05............................................................................................................................. 107 Table 22 Target species across sites, means of valid responses, Shaded areas with P values<0,05 continued from Table 21................................................................................... 108 Table 23 Target species and type of fishing activity: Component loadings .......................... 110 Table 24 Target species and type of fishing activity: Component loadings .......................... 111 Table 25 Diferences between generalists and specialist fishermen (Smith and McKelvey 1986 adapted from ; Salas and Gaertner 2004) ............................................................................... 121 CHAPTER 5 Table 26 Migration as a livelihood strategy. Percentage of valid answers ............................ 129 Table 27 Fishing and total family income and expenditure across sites in soles (1 soles:0,36 USD)....................................................................................................................................... 130

8
Table 28 Family income quartiles across sites. Percentages.................................................. 131 Table 29 Correlation between family income and fishing activity, ownership of productive assets and occupational diversitya .......................................................................................... 131 Table 30 Identifying and ranking problems in Pisco. Workshop in Pisco in 2005................ 134 Table 31 Identifying and ranking problems in Sechura. Workshop in Sechura in 2005 ....... 135 CHAPTER 6 Table 32 Target species across sites, means of valid multiple responses. ............................. 147 Table 33 Target species and type of fishing activity: Component loadings ......................... 151 Table 34 Target species and type of fishing activity: Component loadings continued from Table 6.X ................................................................................................................................ 152 Table 35 Impact of EN on economic activitya across sites. Shaded areas with P values<0,05 and * P values<0,01................................................................................................................ 154 Table 36 Strategies to cope with changes in natural capital. Percentage of valid answers.... 155 Table 37 Impact of EN on fishing activity : Component loadings......................................... 158 Table 38 Type of impact on householdsa of EN across sites. * P values<0,01...................... 160 CHAPTER 7 Table 39 Interview excerpts from Atlas.ti.5.0........................................................................ 177

9
List of Abbreviations
CENSOR Climate Variability and El Niño Southern Oscillation: implications for natural coastal resources and management
CEP Centro de Entrenamiento de Paita CERPER Certificaciones Pesqueras CLD Causal Loop Diagram DICAPI Direccion General de Capitanías y Guardacostas del Perú DIREPRO Dirección Regional de Producción EN El Niño ENSO El Niño Southern Oscillation EPSEP Empresa Peruana de Servicios Pesqueros EU European Union FAO Food and Agriculture Organization
FIUPAP Federación de Integración y Unificación de los Pescadores Artesanales del Perú
FONDEPES Fondo Nacional de Desarrollo Pesquero GDP Gross Domestic Product GECHS Global Environmental Change and Human Security GFL General Fishing Law GTZ Deutsche Gesellschaft für Technische Zusammenarbeit HCLME Humboldt Current Large Marine Ecosystem
IHDP International Human Dimension Programme on Global Change
IIAP Instituto de Investigaciones de la Amazonía Peruana IMARPE Instituto del Mar del Perú INRENA Instituto Nacional de Recursos Naturales ITP Insituto Tecnológico Pesquero ITQ Individual Transferable Quotas LN La Niña NIE New Institutional Economics OIE Old Institutional Economics PCA Principal Component Analysis PIP Policies, Institutions or Processes PROMPEX Commission for Export Promotion
PROCLIM Programa de Fortalecimiento de Capacidades Nacionales para Manejar el Impacto del Cambio Climático y la Contaminación del Aire
PRONAA Programa Nacional de Asistencia Alimentaria SES Socio-Ecological System SLA Sustainable Livelihoods Approach SLP Sea Level Pressure UNALM Universidad Nacional Agraria La Molina US United States

10
CHAPTER 1
INTRODUCTION
1. Research rationale
1.1 Climate variability and artisanal fisheries Fisherfolk depend for a major part of their livelihood on resources whose distribution and
productivity are known to be influenced by climate dynamics (Allison et al. 2005). Since
climatic factors affect the biotic and abiotic elements that influence the numbers and
distribution of fish species, most research on climate variability and fisheries is targeted for a
detailed understanding of the mechanisms causing fluctuation in fish stock size and
distribution (see seminal work by Cushing 1982; Glantz 1992). Additionally, the body of
research related to the impact of climate variability on fisheries has historically been focused
on oceanic regime changes and the major pelagic fish stocks of upwelling zones that are the
target of large scale industrial fisheries (Klyashtorin 2001; Yanez et al. 2001; Guti et al.
2007). Changes in artisanal fisheries due to climate dynamics and the human dimension of
these changes have in the past received little attention by researchers and policy makers
(Allison et al. 2005). While studies focusing on fluctuating stocks, livelihoods systems and
fisheries management have been undertaken in Africa (Sarch and Allison 2000; Conway et al.
2005; Perry and Sumaila 2006; Allison et al. 2001), Asia (Craig et al. 2004) and higher
latitude regions like Canada and Greenland (Hamilton et al. 2000; McGoodwin 2007),
remarkably, research empirically examining the impacts of climate variability on small-scale
fishermen is still sparse. Understanding the linkages between climate variability and resulting
changes in artisanal fishermen livelihoods is essential for designing appropriate policies and
management strategies in the fisheries sector. Additionally, climate change and projected
increased climate variability are likely to place additional stress on fish production systems,
many of which are already threatened by overexploitation and habitat degradation (FAO
2008; Nellemann et al. 2008). The impact of global warming on the fisheries sector in socio-
economic terms is difficult to asses not only because of the great uncertainty regarding the
extent and rate of climate change, but also due to the uncertainty surrounding the impacts on
bio-physical processes. Studying the complex way in which fishermen were impacted, have

11
coped or adapted to past climatic events can provide insights into what policies and strategies
could be put into place to face the new challenges of global change. This research thus springs
from a dual necessity: the lack of empirical studies related to climate variability impacts on
small-scale fisherfolk, and the lack of knowledge of the implications of future climate change
on artisanal fisheries. The El Niño Southern Oscillation (ENSO) is one of the most well-
known inter-annual climate variability phenomena. ENSO is an irregular oscillation of 3-7
years involving a warm (El Niño - EN) and enhanced cold (La Niña - LN) phases that evolves
under the influence of the dynamic interaction between the atmosphere and the ocean. During
the warm phase of ENSO, the eastern tropical Pacific is characterized by equatorial positive
sea surface temperatures (SSTs) and negative sea level pressure (SLP) anomalies, while the
western tropical Pacific is marked by off-equatorial negative SSTs and positive SLP
anomalies (Wang and Fiedler 2006). Although ENSO effects are felt globally, the major
signal occurs in the equatorial Pacific, especially in the south-east Pacific Humboldt Current
Large Marine Ecosystem (HCLME) located on the shores of Peru and Chile (Lehodey et al.
2006).
1.2 Peru and El Niño The HCLME is the most productive large marine ecosystem in the world, providing about
15% of the world’s fisheries catch (FAO 1998). The total harvest of the artisanal near shore
fishery is relatively low compared to the pelagic harvest. However, the livelihoods of
thousands of fishermen are dependant on this diverse fishery, where several species of fish
and invertebrates are exploited (Wolff et al. 2003). From 1950 to 2003 there have been eight
EN events of varying intensity affecting Peru with the 1982–83 and 1997–98 being the
strongest ones. During the same period, there were eight cold phase events (La Niña), the
latest one in 1999-2000 (Wang & Fiedler 2006). ENSO warm events dramatically reduced the
abundance and/or shifted the distribution of certain species like the Peruvian anchoveta
(Engraulis ringens), the Peruvian hake (Merluccius gayi peruanus) and mussels (Aulacomya
ater) (Arntz et al. 2006; Taylor et al. in press). On the contrary, an increase in the abundance
and/or spatial distribution of jack mackerel (Trachurus picturatus murphyi), invertebrates like
scallops (Argopecten purpuratus) and octopus (Octopus sp.), and warm water crustacean
species like shrimp (Penaeus sp.) can be observed (Espino 1999; Ñiquen and Bouchon 2004).
While the impacts of EN on aquatic organisms have been well researched in Peru (Arntz
1986; Wolff et al. 2007), few studies have been reported on the impact of these events on
artisanal fishermen livelihoods (Meltzoff et al. 2005). The body of work relating to the socio-

12
economic impacts of EN in Peru focuses mainly on the industrial fishing sector (CAF 2000;
Broad et al. 2002) and on agricultural-based livelihoods (Reyes 2002; Valdivia et al. 2003).
Hitherto, this general lack of knowledge of how changes in ecological systems affect the
livelihoods of Peruvian artisanal fishermen, and how they respond to theses changes, hinders
the design of adaptive management strategies for the artisanal fisheries sector and warrants
studies that can inform policies.
1.2.1 Artisanal fisheries management and the role of social sciences
The challenge and necessity of investigating the human dimension of fisheries and explore the
social dimension of ecosystem management has also been a major driver for the author to
undertake this study. The importance of the social dimension in ecosystem management has
been acknowledged in recent years (Townsley 1998; Glaser 2006; Pauly 2006), and in
fisheries management numerous authors put forward the necessity to incorporate in the
management process societal goals and “realities”, as well as the impact of policies and
regulations on fishing communities (Catanzano and Rey 1997; Caddy and Cochrane 2001;
Kaplan and McCay 2004; Pollack et al. 2008). Recently in the development discourse,
artisanal fisheries have been recognized as a contributor at the local scale to poverty
alleviation, rural development and food security, and at the national scale to economic growth
(see Béné et al. 2007). The development of “people-centered” approaches in natural resource
management and the impetus to undertake participatory research have also allowed over the
years to include users in fisheries research and management (Symes 2006). Despite these
advances, currently anthropology and related social sciences play a negligible role in
informing fisheries management compared to their colleagues in ecology, biology and
economics (Pauly 2006). Research in Peru related to the artisanal fishing sector adheres to this
state of affairs, with few published studies attempting to understand fishermen livelihoods in
coastal communities (Wosnitza-Mendo et al. 1988). Peruvian artisanal fisheries management
follows the trend of many Latin America countries, where fisheries research has mainly
focused on biological-ecological aspects, with limited attention paid to socio-economic issues
(Salas et al. 2007). Additionally, industrial fisheries in the region have been the subject of
extensive research over the years, with small-scale fisheries often being marginalized (Charles
et al. 2007).
Moreover, Peruvian artisanal fisheries currently operate in the context of human and
biophysical processes such as EN, overexploitation, globalization and global warming that

13
might jeopardize their long term sustainability. In recent years, diverse frameworks, concepts
and methods have been made available to fisheries managers in an effort to explain
interactions between aquatic ecosystems and resource users, and design appropriate
management interventions. These include the ecosystem approach, concepts of resilience,
institutions and the livelihoods analysis. Mainstreaming of these concepts into fisheries policy
as well as the development of strong diagnosis methods that integrate them are still sparse,
especially in Peru. This research will provide the opportunity to bring together existing
theories and concepts as well as operationalizing them to study the impacts of climate
variability on fisherfolk involved in small-scale fisheries. To conclude, the work presented
here has been driven by the desire to shift the focus of fisheries management in Peru,
especially in relation to climate variability, from purely ecological and biological approaches
to a perspective that takes into account the human dimension. This was made possible by the
author’s participation in the European Union funded CENSOR project (Climate variability
and El Niño Southern Oscillation: implications for natural coastal resources and
management). CENSOR aims at enhancing the detection, compilation, and understanding of
ENSO effects on the coastal zone and its resources, to mitigate damage, better use beneficial
effects, and thus improve livelihoods. One of its objectives is to develop conceptual and
quantitative ecosystem/resource-use and socio-economic models as tools for an adaptive
management approach.
1.3 Thesis aims This thesis is one of the first empirical studies in Peru examining coastal fishermen
livelihoods, and the human dimension of the interaction between climate-driven resource
fluctuations and livelihoods. The general objective can be summarized as:
To understand how artisanal fishermen livelihoods in Peru are secured in the
context of ENSO-driven climate variability and its implication for artisanal
fisheries management in the context of future climate change
The specific research objectives are to:

14
1) Characterize fisherfolk livelihoods in two Peruvian costal communities to
understand how livelihoods are constructed and maintained
2) Understand how livelihoods are impacted and maintained during El Niño events
3) Establish how institutions enable or constrain fisherfolk livelihoods and adaptation
processes
4) Explore the implications of the results for relevant research and policy, especially in
the context of future climate change
The development of the research objectives was an iterative process. Throughout the first year
of the thesis, preliminary fieldwork and discussion with Peruvian stakeholders, ultimately the
end-users of this work, shed light on the relevance of the research objectives and the
feasibility of the research methods. This approach allowed for reflexive learning and puts this
research at the crossroad of inductive and deductive approaches. An overview of how each
chapter addresses these objectives is presented below and summarized in Figure 1 while
general methods used are available in Chapter 3.
In Chapter 2, frameworks and concepts used to understand interactions between aquatic
ecosystems and resource users are reviewed in order to suggest a framework to study the
impacts of climate variability on fisherfolk involved in small-scale fisheries. The central task
of this chapter is thus to connect existing concepts to gain a better understanding of how
fisherfolk cope and adapt to changes in complex marine social-ecological systems.
Afterwards, in Chapters 4 and 5, the thesis explores fishermen livelihoods in two coastal
regions. Chapter 4 deals with the building blocks of livelihoods, while Chapter 5 explores
livelihoods options, outcomes and constraints. The aim is to provide insight into ways
fisherfolk make a living within their broader environmental and institutional context. In
Chapter 6 the research investigates how fishermen livelihoods were impacted by EN, with a
focus on their coping and adaptation strategies. The thesis then explores if institutions are
inhibitors or promoters of fisherfolk resilience to climatic events in Chapter 7. By examining
the scallop fishery, the thesis unveils how institutions responded to climate variability and
how these responses affected fisheries management and livelihoods. Finally, in Chapter 8
management implications of response mechanisms, coping strategies and adaptation processes
of fishermen and institutions are discussed. Additionally, possible implications of the results
for relevant research and policy, especially in the context of future climate change, are
presented.

15
how artisanal fishermen livelihoods in Peru are secured in the context of ENSO-driven climate variability and its implication for artisanal fisheries management in the context of future climate
change
1) Characterized fisherfolk livelihoods to understand how livelihoods are constructed and maintained
Chapters 4, 5
2) Understand how livelihoods are impacted and maintained during El Niño events
Chapters 5, 73) Establish how institutions enable or constrain fisherfolk livelihoods and adaptationprocesses
Chapter 6
4) Explore the implications of the results for relevant research and policy, especially in the context of future climate change
Chapter 8
Figure 1Thesis structure in relation to research objectives

Chapter 2 Resilience from a livelihoods and institutional perspective
16
CHAPTER 2
FISHING FOR CHANGE: THE STUDY OF FISHERFOLK RESILIENCE TO CLIMATE VARIABILITY FROM A LIVELIHOODS AND
INSTITUTIONAL PERSPECTIVE
“If you don’t know what you’re talking about, call it „system“; (…) if you don’t know how it works, call it „process”.” Zawodny(1966) cited in Schneider and Bauer(2007)
2.1 Introduction
Around 90% of the 38 million people recorded globally as fishers are classified as small-scale
(Béné et al. 2007 p. 2). Small-scale fisheries (also referred to as artisanal) can be defined as
relatively labor intensive and using small fishing vessels (if any) operating in near-shore
waters for subsistence or commercial purposes (local consumption or export)1 (FAO 2005).
Many fisheries world wide have declined sharply or have already collapsed over the last
decades due to overfishing (Pauly et al. 1998). Moreover, major fishing grounds are
concentrated in only a few areas of the oceans and inland waters, in zones threaten by
pollution, mismanagement of freshwater and coastal development (Nellemann et al. 2008).
With strong evidence of accelerated global warming impacting marine life (Perry et al. 2005),
climate change is likely to alter artisanal fisheries already under stress. A plethora of concepts
can be used to understand how climate variability and change affect artisanal fisherfolk, and
how these [will] respond to and mediate such changes. While conceptual frameworks can be
as diverse as case studies, understanding the epistemological nature of the variety of
knowledge used in research is not just a mundane academic exercise: it is about understanding
how concepts are created, interpreted and how they could be linked to provide more powerful
insights into the study of complex and coupled systems. Additionally, as Ostrom posits, while
there are no single blue prints or ‘panacea’ for studying human-environment interactions,
“without a common taxonomy of core variables, research conducted by scholars from multiple
disciplines tends to focus on variables of major interest to their own disciplines […]” (Ostrom
2007 p. 15186). Therefore one might wonder: What research frameworks can help us 1 This is a broad definition. One must recognize differences between small-scale fishermen in developed and developing countries, mainly based on financial capital and size of boats. See FAO (2005)

Chapter 2 Resilience from a livelihoods and institutional perspective
17
understand how fisherfolk livelihoods are maintained while socio-ecological systems undergo
changes? What makes systems in which livelihoods unfold vulnerable, persist or transform?
The goals of this chapter are threefold. A first objective is to untangle the conceptual
fuzziness surrounding resilience and vulnerability. In the last few years major reviews have
explored the links between the concepts of resilience, vulnerability and adaptation in an
attempt to develop a shared conceptual framework for the study of environmental changes and
their impact on human communities (Adger 2000; Carpenter et al. 2001; Folke et al. 2003;
Klein et al. 2003; Folke 2006; Gallopin 2006; Janssen and Ostrom 2006b; Janssen et al.
2006). These will be re-visited, underlying their contribution to the study of the interactions
between marine ecosystems and fisherfolk. While resilience thinking is a powerful framework
for integrating natural and social dynamics, it is difficult to operationalize in the field
(Carpenter et al. 2001), and fails short to clearly address institutional dynamics and
governance issues (Anderies et al. 2004). In this chapter it is argued that theories of
institutions and the sustainable livelihood approach, both widely used not only in the fisheries
literature (Noble 2000; Allison and Ellis 2001; Jentoft 2004; Imperial and Yandle 2005;
Wilson et al. 2006) but also by practitioners in donor agencies (DFID 2001; Allison and
Horemans 2006), should complement the resilience perspective to address its pitfalls. A
second objective of this chapter is thus to situate research on resilience of marine socio-
ecological systems within the framework of livelihood security and theories of institutions.
The concept of livelihood security and how it applies to the study of fisherfolk resilience and
climate variability is presented. Then an overview of theories of institutions, outlining major
themes in the study of fisheries governance is put forward. A third objective is to provide a
framework integrating the resilience perspective (which includes vulnerability), and the
livelihoods and institutional approach in the study of complex interactions between the human
dimension of fisheries and climate variability and change.
2.2 Resilience
2.2.1 Emergence of the resilience perspective The concept of resilience is now used in a great variety of interdisciplinary work concerned
with the interactions between people and nature (Carpenter et al. 2001; Folke 2006). The
concept was originally used by ecologists in the 1970s in their analysis of population ecology.
It was mainly interpreted as a concept for understanding ecological systems in order to be able

Chapter 2 Resilience from a livelihoods and institutional perspective
18
to predict how they reacted to small disturbances (Grimm 1996). Ecologist C.S Holling first
introduced it, stating that:
“resilience determines the persistence of relationships within a system and is a measure of the ability of these systems to absorb change of state variable, driving variables, and parameters, and still persist” (Holling 1973 p. 17).
This is in contrast to stability, defined by Holling (1973) as the ability of a system to return to
a state of equilibrium after a temporary disturbance. A very stable system would not fluctuate
greatly but return to ‘normal’ quickly while a highly resilient system might be unstable under
significant fluctuations (Handmer and Dovers 1996 cited in Klein et al, 2003). As described
by Folke (2006), Holling’s concept of resilience challenged the single equilibrium, global
stability focus of ecological research, stating that ecosystems are inherently dynamics and
equilibrium states are not something one should seek (Gunderson 2000; Klein et al. 2003).
Stuart Pimm’s 1984 article on the stability of ecosystems offers the only other moderately
cited definition without strong affiliation to the work of Holling (Schoon 2005). According to
Odenbaugh (2006), Pimm defines system resilience as the speed of return to a steady state
following a disturbance, that is how fast the variables return to their equilibrium, the focus
being on the efficiency function. Holling himself acknowledges this measure of stability as
‘engineering resilience’ and contrasts it with his preferred definition of ‘ecological resilience’:
the magnitude of disturbance that can be absorbed before the system restructures while
maintaining the existence function (Holling 1996).
In the field of fisheries science and marine ecology these developments led to new conceptual
models that encompassed the role of history and non-equilibrium dynamics in the tempo and
mode of ecosystem change (Hughes et al. 2005 p. 381). Less focus was placed on maximum
sustainable yield and the design of ‘optimal’ harvesting of targeted stocks in systems that
were assumed to be stable (Hughes et al. 2005 p. 380). In management terms, this is a
profound shift from traditional perspectives, which attempt to control changes in systems that
are assumed to be stable, towards an approach aiming at adapting to uncertainty and surprise
(Adger et al. 2005b). Since ecological systems are dynamic, management strategies also must
incorporate uncertainty, non-linearity, and policy experiments to learn about the ecosystem
(Olsson et al. 2004). Resilience perspective thus became the theoretical foundation for work
related to adaptive management (Folke 2006). Adaptive management deals with the

Chapter 2 Resilience from a livelihoods and institutional perspective
19
unpredictable interactions between people and ecosystems, emphasizing the importance of
feedbacks from the environment in shaping policy (Berkes and Folke 1998a p. 10) and of the
ability to learn and experiment (Armitage et al. In Press, Corrected Proof). Fisheries stock
management under uncertainty and adaptive management have been extensively studied ( see
for instance Glantz and Thompson 1981; Clark et al. 1995; Cole 1996; Gordon and Munro
1996; Flaaten et al. 1998; Rothschild 2005). Rooted in Holling’s work, adaptive management
as a strategy for fishery management was further developed within the concepts of social-
ecological systems and complex adaptive system.
2.2.2 Social-ecological systems and fisheries Socio-ecological systems (SESs) refer to social systems in which some of the interdependent
relationships among humans are mediated through interactions with biophysical and non-
human biological units at multiple temporal and spatial scales (Anderies et al. 2004; Janssen
and Ostrom 2006a). The work by Berkes and colleagues (1998b; 2003b) has been central in
the use of the concept of resilience when studying socio-ecological systems. They put forward
that social and ecological systems are complex adaptive systems, having a number of
attributes that are not observed in simple systems, such as nonlinearity, uncertainty,
emergence, scale and self-organization (Berkes et al. 2003a). Box 1. describes those main
attributes while it is acknowledged that complex systems have numerous other characteristics.
Resilience in this context is defined by Berkes and colleagues (2003a p. 13) as: 1) the amount
of change the system can undergo and still retain the same control on function and structure,
or still be in the same state, within the same domain of attraction, 2) the degree to which a
system is capable of self-organization, 3) and the ability to build and increase the capacity for
learning and adaptation. Adaptive capacity is considered an aspect of resilience that can be
defined as the ability of systems to change inherent properties to return to a reference or
alternative state they belong to. The question of whether the new alternative state is a more
‘desirable’ one is particularly relevant, shedding light on the fact that adaptation does not
always lead to desirable outcomes (‘mal-adaptation’). Adaptive capacity thus translates into
increasing the ability and speed to evolve and adapt to new situations as they arise and the
flexibility to experiment and adopt novel solutions (Walker et al. 2002).

Chapter 2 Resilience from a livelihoods and institutional perspective
20
Box 1 Attributes of complex adaptive systems
The resilience perspective aims at understanding how SESs evolve, transform or collapse
overtime, identifying major drivers and variables behind these dynamic of changes. Berkes
and colleagues (2003b) use Holling’s adaptive renewal cycle to illustrate the dynamic cyclic
change of socio-ecological systems. The adaptive cycle (Figure 2) involves the movement of a
system through four phases: 1) a period of rapid growth and exploitation (r); 2) a phase of
accumulation, monopolization, and conservation of structure, during which resilience tends to
decline (K); 3) a very rapid breakdown or release phase (creative destruction (Ω); 4) and,
finally, a relatively short phase of renewal and reorganization (α) (Walker et al. 2002). In this
phase, the system can still retain previous components to remain within the same
configuration as before or new components can enter (i.e. species, institutions, polices), a new
emerging system appearing (Walker et al. 2002). This idea of renewal is relevant to natural
resource management where crisis (deforestation, over fishing, natural disasters etc.) can
trigger the opportunity of an adaptive renewal cycle in systems capable of adapting and
learning (Berkes et al. 2003a).
Nonlinearity and Uncertainty: Nonlinearity is related to inherent uncertainty. Complex systems organize around one or several possible equilibrium states or attractors. There is no simple equilibrium but several equilibriums (stability/attraction domains). Scale: Many systems are hierarchical (sub-systems nested in large systems). Different processes occur at different scales. Behaviour of a sub-system at one scale is qualitatively different from that of a sub-system at another scale (e.g. household unit compared with a region). Processes at different scales do not function independently of one another. Emergence: Occasionally the interaction of process and pattern at one scale produces emergent organization at a larger, slower scale (production of unexpected processes and structures). Thus change is not only non-linear, it can be structural (structural view of emergence). Resilience can be considered an emergent property of a system (one that cannot be predicted). Self-organization: Open systems will re-organize at critical points of instability. For instance disturbances select for "fitness" of individuals, species adapt, and the system re-organises to accommodate the change. Self-organization produces macroscopic patterns that emerge through local, small-scale interactions. Of fundamental importance to self-organization is memory. Memory, accumulated history and experience, gives a system the ability to re-organize. Sources: (Hartvigsen et al. 1998; Peterson 2000b; Berkes et al. 2003a)

Chapter 2 Resilience from a livelihoods and institutional perspective
21
Figure 2 Resilience is another dimension of the adaptive cycle. Resilience shrinks as the cycle moves toward K, to expand as the cycle shifts rapidly into a "back loop" to reorganize accumulated resources for a new initiation of the cycle. Source of text and picture (Gunderson and Holling, 2001)
Resilience thinking has thus evolved from the narrow definition of “engineering resilience”
with its focus on efficiency and recovery to socio-ecological resilience where transformability
and adaptation are key aspects (Table 1). Complex system theory and the concept of resilience
assert that management of socio-ecological systems can be improved “by making them more
adaptable and flexible, able to deal with uncertainty and surprises, and by building capacity to
adapt to change” (Berkes et al. 2003a p. 9).
Table 1 Resilience concepts, from the more narrow interpretation to the broader social–ecological context (Folke 2006)
Resilience concepts Characteristics Focus on Content Engineering resilience Return time, efficiency Recovery, constancy Vicinity of a stable
equilibrium
Ecological/ecosystem resilience and Social resilience
Buffer capacity, withstand shock, maintain function
Persistence, robustness Multiple equilibria, stability landscapes
Social-ecological resilience
Interplay disturbance and re-organization, sustaining and developing
Adaptive capacity transformability, learning, innovation
Integrated system feedback, cross-scale dynamic interactions
This resilience perspective has been recently integrated into the epistemic community dealing
with the human dimension of aquatic ecosystems. The papers by Mahon et al (In Press,
Corrected Proof), Hughes et al (2005) and Olsson et al (2004) provide valuable uses of the
concept of resilience in marine social-ecological systems research. They all approach fisheries
management from the resilience perspective, highlighting the importance of embracing
uncertainty as well as learning and adaptation. Wilson (2006) in his treatment of ocean

Chapter 2 Resilience from a livelihoods and institutional perspective
22
fisheries as complex adaptive systems contends that there is a mismatch between ecological
and management scales. To improve feedback, multi-scale governance must be in place, while
the fine-scale (individual fisherman knowledge) should be integrated into science. Scale refers
to the spatial, temporal, quantitative, or analytical dimensions used by scientists to study
object and processes (Gibson et al. 2000; Cundill et al. 2005) and is central to the resilience
perspective. For instance temporal scale can vary from days (fishing trips and daily water
turbulences) to decades (political changes or inter-decadal oscillations), to centuries (climate
change). The issue of scale in marine ecosystems and human interaction was reviewed by
Perry and Ommer (2003). The authors posit that scale is central to SESs, as the choice of scale
affects the identification of systems variables, patterns and dynamics (Figure 3). They argue
that appropriate scales of natural science analysis must be used when building management
policies, and that both social and natural science analyses need to be aware of the “shifting
baseline” problem (Perry and Ommer 2003). The “shifting baseline syndrome” was
introduced by Pauly (1995) and refers to the fact that the baseline can change significantly
depending on the chosen time scale. Sáenz-Arroyo et al (2005), when investigating
fishermen’s perception of environmental change in Mexico’s Gulf of California, reveal that
despite times of plentiful large fish still being within living memory, few young fishers
appreciated the abundance and productivity of fishing sites. They argue that such rapid shifts
in perception of what is natural help explain why society is tolerant of biodiversity loss.
The burgeoning literature related to SESs and fisheries is a reflection of how resilience
thinking is influencing fields outside of ecology, ranging from ecological economics to
cultural theory (Folke 2006). On the whole the SESs and the resilience approach provide a
bridge between natural and social science by using the same terminology when referring to
social and ecological systems, thus providing a ‘meta-language’. Abel and Stepp in their
editorial of a special issue of Conservation Biology titled ‘A New Ecosystems Ecology for
Anthropology’ stated that: “It would seem today that anthropology and the other social
sciences have embraced ecology as never before.” (Abel and Stepp 2003 p. 1). However,
Adger (2000) warns that simply taking the concept of resilience from the ecological sciences
and applying it to social systems assumes that there are no essential differences in behavior
and structure between socialized institutions and ecological systems. Social sciences have a
long standing tradition of research in this field that must be taken into account and brings a
much needed dimension in the concept of resilience, especially in the interpretation of how

Chapter 2 Resilience from a livelihoods and institutional perspective
23
and why systems persist in time. The adoption of the vulnerability concept by the epistemic
community using the resilience perspective is one way to deal with the limitations of the
latter.
1 0 0
1 0
1 F ish in g to w
F ish in g tr ip
p r ice f lu c tu a tio ns a nd ec o n o m ic cy cles
hu m a n w ork in g lifesp a n
F ish in g
Spat
ial s
cale
(km
)
H r D a y W k M o S ea son Y r D eca d e C en tu ry
1 0 0 0 0
1 0 0 0
1 0 0
1 0
1
in ter -d eca da l
osc illa tio ns
cu rren tsfron ts
s tra tifica tio n
w a ter m a ss ex cha n g es
tid etu rb u lenc e P h y s ic a l
1 0 0 0 0
1 0 0 0
1 0 0
1 0
1
s tock a b u nda n c em igra tion
sp a w n in g
b otto m fid e lity
sch o olin g
v er tica l m igra tion
feed in g
B io log ic a l
1 0 0 0 0
1 0 0 0
1 0 0
1 0
1 F ish in g to w
F ish in g tr ip
p r ice f lu c tu a tio ns a nd ec o n o m ic cy cles
hu m a n w ork in g lifesp a n
F ish in g1 0 0 0 0
1 0 0 0
1 0 0
1 0
1 F ish in g to w
F ish in g tr ip
p r ice f lu c tu a tio ns a nd ec o n o m ic cy cles
hu m a n w ork in g lifesp a n
F ish in g
H r D a y W k M o S ea son Y r D eca d e C en tu ry
T e m p o ra l sc a le
1 0 0 0 0
1 0 0 0
1 0 0
1 0
1
M a na gem en t R egu la tio n
E m p lo y m ent
In v es tm ent
P o litica lB u sin ess
H u m a n
F ish in g C o m m u n itie s
H r D a y W k M o S ea son Y r D eca d e C en tu ry
T e m p o ra l sc a le
1 0 0 0 0
1 0 0 0
1 0 0
1 0
1
M a na gem en t R egu la tio n
E m p lo y m ent
In v es tm ent
P o litica lB u sin ess
H u m a n
F ish in g C o m m u n itie s
a
b
c
d
1 0 0
1 0
1 F ish in g to w
F ish in g tr ip
p r ice f lu c tu a tio ns a nd ec o n o m ic cy cles
hu m a n w ork in g lifesp a n
F ish in g
Spat
ial s
cale
(km
)
H r D a y W k M o S ea son Y r D eca d e C en tu ry
1 0 0 0 0
1 0 0 0
1 0 0
1 0
1
in ter -d eca da l
osc illa tio ns
cu rren tsfron ts
s tra tifica tio n
w a ter m a ss ex cha n g es
tid etu rb u lenc e P h y s ic a l
1 0 0 0 0
1 0 0 0
1 0 0
1 0
1
s tock a b u nda n c em igra tion
sp a w n in g
b otto m fid e lity
sch o olin g
v er tica l m igra tion
feed in g
B io log ic a l
1 0 0 0 0
1 0 0 0
1 0 0
1 0
1 F ish in g to w
F ish in g tr ip
p r ice f lu c tu a tio ns a nd ec o n o m ic cy cles
hu m a n w ork in g lifesp a n
F ish in g1 0 0 0 0
1 0 0 0
1 0 0
1 0
1 F ish in g to w
F ish in g tr ip
p r ice f lu c tu a tio ns a nd ec o n o m ic cy cles
hu m a n w ork in g lifesp a n
F ish in g
H r D a y W k M o S ea son Y r D eca d e C en tu ry
T e m p o ra l sc a le
1 0 0 0 0
1 0 0 0
1 0 0
1 0
1
M a na gem en t R egu la tio n
E m p lo y m ent
In v es tm ent
P o litica lB u sin ess
H u m a n
F ish in g C o m m u n itie s
H r D a y W k M o S ea son Y r D eca d e C en tu ry
T e m p o ra l sc a le
1 0 0 0 0
1 0 0 0
1 0 0
1 0
1
M a na gem en t R egu la tio n
E m p lo y m ent
In v es tm ent
P o litica lB u sin ess
H u m a n
F ish in g C o m m u n itie s
a
b
c
d
Figure 3 Space/time-scale diagram of characteristic processes from the natural sciences: (a) physical; (b) biological and from the social sciences; (c) fishing; (d) fishing communities. From Perry and Ommer (2003)
2.3 Vulnerability The concept of vulnerability can be identified as stemming from five schools of thought: the
social constructivist and political economy approaches, political ecology, and the natural-
hazard and climate change literature.

Chapter 2 Resilience from a livelihoods and institutional perspective
24
2.3.1 Political economy, social constructivism and political ecology Political economy analysis is concerned with the interaction of political and economic
processes in a society: the distribution of power and wealth between different groups and
individuals, and the processes that create, sustain and transform these relationships over time
(Collinson 2003). Political economy conceptualizes vulnerability in terms of powerlessness:
differential economic and political power play a role in determining differential vulnerability
of individuals and groups (Greenberg and Park 1994). It was widely used in the fields of
famine, hunger and entitlements (O'Brien 1985; Watts and Bohle 1993). In the realm of
fisheries, Iberra et al (2000) identified how different economic policies in Peru, Chile and
Mexico where used to deal with overcapitalisation and over-fishing, rendering the fisheries
more vulnerable. They highlight the importance of the political and economic context in the
development of Latin American fisheries (agrarian reform, military government and neo-
liberal ones in the 1990s). In contrast to political economists who emphasize structural factors
and power relations, constructivist theorists focus on the role of human agency and culture in
explaining differential vulnerability. Themes such as culture, ethnicity, religion and gender
become individual determinants of vulnerability that allow a better understanding of its
underlying causes (Fordham 1998; Cannon 2002). However, as for political economy, this
approach could be labeled as ‘reductionism’ and is effective in explaining the causes of
vulnerability when combined with other approaches. For this reason the political ecology
framework was developed, with its particular emphasis on environmental problems.
Political ecology is concerned with the relationship between nature and society, and embodies
the assumption that environmental problems and solutions are highly politicized and
unequally suffered or perceived (Blaikie and Brookfield 1987 p. 6 ; Bryant 1992; Blaikie
1995; Bryant et al. 1997). It allows to investigate whether environmental benefits and costs
emanating from ecological changes are distributed unequally among actors, and whether such
distribution reinforces existing social and economic inequalities and power relations, leading
to conflict (Blaikie 1995). Bryant (1998) argues that at the heart of political ecology research
is the notion that politics should be 'put first' in the attempt to understand how human-
environment interaction may be linked to the spread of environmental degradation (Bryant
1998 p. 80). In this vision, political ecology gives a particular focus on the way meso and
macro scale political and economic forces set the context for local environmental action and
interaction (Robbins 2003). For instance Doods (1998) links the decrease in restaurant

Chapter 2 Resilience from a livelihoods and institutional perspective
25
consumptions in the United States (U.S) with changes in lobster trade that directly affect the
Miskito population in Honduras. If wages are too low in Honduras due to lower demand in
the U.S, this can lead to a shift from fishing activity to lodging and agriculture which results
in increased rates of deforestation (Dodds 1998p. 101). This case study highlights how local
ecological change can be linked to macro-level economic changes.
The inability of economic theory to predict human behavior in novel, poorly understood
situations suggests that it has severe shortcomings in explaining human behavior in many
human–ecological interactions (Gale 1998; Peterson 2000a p. 325), warranting the use and
incorporation of approaches like political ecology. However, it has been argued that political
ecology tends to overlook ecological dynamics and focus upon the structure of human
systems, representing nature as a passing object transformed by human actors (Peterson
2000a). While this type of research may yield important social science insights and findings, a
political ecology that does not address the physical environment falls short of its trans-
disciplinary objective (Little 1999).
2.3.2 Hazards approach and IPCC definition of vulnerability The concept of vulnerability is often considered as having its roots in the study of natural
hazards (Hewitt 1983). John Dewy and Harlan Barrows are cited among the founding fathers
of ‘geography as human ecology’ on which the hazard research is based (Mileti 1999; Cutter
et al. 2000). Dewey put forward that humanity lives in an hazardous world that results in
human insecurity and environmental hazards which are not independent from society but are
shaped and defined by human actions (Dewey 1929 cited in Mileti, 1999). Barrows, based on
Dewy’s work, was one of the first scholars to extensively investigate how US society could
adjust to floods. In the 1960s and 1970s, inspired by his predecessors, Gilbert White and
colleagues focused on (1) the identification and distribution of hazards, (2) the range of
adjustments that are available to society and individuals, and (3) how people perceive and
make choices regarding hazard events (Cutter et al. 2000 p. 714-715). These earlier works,
pinned down as the ‘hazard paradigm’, were criticized on the basis that they considered only
hazards themselves and not enough the particular contexts in which they were embedded
(Cutter 1996). The neglect of structural factors and the focus on biophysical factors were
deemed insufficient in the study of the interdependence between hazards and society. As a
result a new approach focusing on hazards in context (Mitchell 1989) recognized that hazards

Chapter 2 Resilience from a livelihoods and institutional perspective
26
are a physical and social phenomena (Cutter et al. 2000). Disaster and hazard research thus
evolved to incorporate the concept of vulnerability developed by political ecology. In this
context vulnerability is defined as a risk of exposure and is seen as a pre-existing condition
(potential exposure) (Cutter et al. 2000). Wisner and colleagues (2004) in their definition of
vulnerability to hazards bridge the notion of social vulnerability in political economy and the
biophysical risk/hazard perspective by stating:
“By vulnerability we mean the characteristics of a person or group […] that influence their capacity to anticipate, cope with, resist and recover from the impact of a natural hazard […]. It involves a combination of factors that determine the degree to which someone’s life, livelihood, property and other assets are put at risk by a discrete and identifiable event (or series or ‘cascade’ of such events) in nature and in society.” (Wisner et al. 2004 p. 11)
Bridging the gap between a focus on natural stimuli and exposure, and social determinants of
vulnerability was driven by new research focusing on the vulnerability of people to impacts of
climate change (Janssen et al. 2005). In global change and climate change research
vulnerability is as an integrative measure of the threats to a system (Cutter, 1993; Boughton et
al., 1999; McCarthy et al., 2001). When referring to the concept of vulnerability, the
Intergovernmental Panel on Climate Change (IPCC) defines vulnerability to climate change
as:
“The degree to which a system is susceptible to, or unable to cope with, adverse effects of climate change, including climate variability and extremes. Vulnerability is a function of the character, magnitude, and rate of climate variation to which a system is exposed, its sensitivity, and its adaptive capacity.” (McCarthy et al. 2001 p. 995)
Vulnerability is therefore made up of a number of components including exposure and
sensitivity to hazard and the capacity to adapt:
Vulnerability = ƒ(exposure, sensitivity, adaptive capacity)
In IPCC terminology, sensitivity is the degree to which a system will respond to a change in
climatic conditions. This could be measured, for example, by a proportional change in
ecosystem productivity as a result of perturbations in temperature or precipitation (i.e. change
in catches). Adaptive capacity is the ability of a system to evolve in order to accommodate
climate changes or to expand the range of variability with which it can cope. Vulnerability,

Chapter 2 Resilience from a livelihoods and institutional perspective
27
according to the IPCC definition, thus presents an external dimension (exposure) and an
internal dimension (sensitivity and adaptive capacity) (Füssel and Klein 2005).
From a fisheries perspective, few studies have looked at the vulnerability of the fishing sector
to climatic stress. One of these is the vulnerability assessment of capture fisheries and
aquaculture to climate change conducted by Allison et al (2005) and Handyside et al ( 2006).
Figure 4 presents the conceptual model used in both studies where vulnerability is a function
of the potential impacts (PI) of climate change, reduced or modified by peoples’ or
institutions’ adaptive capacity (AC): V = f(PI, AC). The aim of both vulnerability assessments
was to capture a snapshot of present-day vulnerability of fisheries production systems to
future climate changes at the global scale. In the case of capture fisheries, Allison et al (2005)
explored potential impacts of climate change and adaptive capacity with indices using: 1) the
number of fishers and their economic and nutritional dependence on fish to assess sensitivity,
2) measures of overall health, education and governance, 3) and the size of the economy for
the country being considered. They concluded that Asia, the Amazon and Western Sahara
regions would be most at risk from increasing air temperature changes (projections to 2050
from the IPCC 2001 assessments). Most sensitive countries were China, Indonesia, India,
Vietnam, Mauritania and Peru. While the analysis was a first attempt to identify vulnerable
countries to climate change in terms of fisheries, data used for the exposure index (air
temperature) is inappropriate to fully explain changes in aquatic systems. More refined studies
at the large ecosystem level and case study level are needed to insure that vulnerability
assessment of this type take into account ecological processes.
Figure 4 Conceptual model for vulnerability assessment at the global scale Allison et al (2005)

Chapter 2 Resilience from a livelihoods and institutional perspective
28
At finer scales, assessments of vulnerability of fisherfolk to environmental change are
likewise limited. Nagy and colleagues (2006) provide one of the few studies investigating the
impact of climate variability on fisheries in Argentina using a vulnerability approach based on
the driver-pressure-state- impact-response framework. However, the analysis falls short of
encompassing adaptive capacity beyond the individual level, that is what roles aspects like
governance play in the vulnerability of fishermen. Both studies show the limitations of the
vulnerability approach when it fails to integrate different scales (individual behavior, social
processes at a lager scale) and ecological dynamics.
2.4 Fisherfolk resilience: towards a framework The present review has shown that the concepts of resilience and vulnerability stem from two
different knowledge base: the natural science one with its roots in ecology and the more social
science one with emphasis on social construction, power, hazards and exposure. This
distinction is not only attributable to their respective roots in different disciplines, but also to
the fact that they were produced by particular people, at particular times and places, and in
different institutional contexts. Janssen et al (2006) bibliometirc analysis of the knowledge
domains of resilience and vulnerability offers an interesting perspective on the development
of both concepts. One could argue that the two concepts are mutually inclusive: increased
resilience leads to decreased vulnerability and vice-versa. Adger et al (2005c) when
investigating the impact of Hurricane Katrina on New-Orleans stated that : “The resilience
(or conversely, the vulnerability) of coastal societies is more tightly linked to larger-scale
processes today than in the past.” (Adger et al. 2005c own italics). O’Brien and Vogel (2004)
similarly posit that “some would argue that resilience increases the capacity to cope with
stress and hence serves as a loose antonym for vulnerability” (p.1).
Research on fisherfolk and climate variability and change provides the opportunity to explore
the combined use of the concepts of resilience and vulnerability, and could contribute to a
better understanding of the ‘political’, ‘social’ and ‘ecological’ interpretations of human-
environment interactions. Based on this review vulnerability is defined as a function of
exposure and resilience:
V=f (exposure and resilience)

Chapter 2 Resilience from a livelihoods and institutional perspective
29
Exposure refers to the kind and magnitude of disturbance (stressor) the system is exposed to.
Taking the Peruvian Humboldt current system as an example, the stressors could be the intra-
annual variability ENSO, global climate change or changes in international fisheries markets.
At the national or regional scale it could refer to political and social changes (decentralization,
neo-liberal fisheries policies). Resilience is defined as a function of changes in absorption, self
organisation and adaptive capacity:
Resilience = f (changes in absorption+ self organisation + adaptive capacity)
Changes in absorption refer to the amount of change the system under study can undergo and
still retain the same controls on function and structure, or buffering (absorptive) capacity. In
the case of the Peruvian fisheries this would mean to what extent artisanal fishermen can carry
out productive activities without any change. Self-organization refers to the ability of a system
to return to a reference or desirable state without changing any of its inherent properties. This
translates into enough redundancy to provide continuity of function and application of
existing available responses to address the problem. The response of a system to change can
arise organically, reflecting the self-organizing capacity of the system, or more
mechanistically (Dalziell and McManus 2004). In this case, this would refer to fishermen
response to changes using available coping strategies such as intensification of fishing effort
or what Perry et al (In revision) called “ridding out the storm”, that is waiting for the crises to
pass. Coping does not emphasize the strategic nature of planned adaptation, putting more
stress on reactive responses, self-organization that does not involve major changes in social-
ecological systems. Adaptive capacity refers to the ability of a system to change inherent
properties to return to a reference or alternative state. It translates into increasing the ability
and speed of the system to evolve and adapt to new situations as they arise, the application of
novel responses to address the problem. Adaptation strategies of fishermen can range from
change in target species and migration. Table 2 presents the conceptual framework when
applied to the study of fisherfolk resilience2. In terms of scale, the focus is on aquatic system
(freshwater or marine, boundary defined by management unit or ecological criteria depending
on the case study). Two sub-systems (levels) have been identified: the local scale and the
regional, national scale or global scale (meso and macro levels depend on the case study).
22 This framework elaborates on concepts developed by Berkes (2003), Anderies (2004), and more recently Ostrom (2007). The relation with Ostrom multitier framework will be discussed further in the chapter.

Chapter 2 Resilience from a livelihoods and institutional perspective
30
The temporal reference is the present (current resilience) while the variable of concern within
the subsystems are the actors involved in the fishing sector.
Table 2 Studying resilience of fisherfolk: the example of climate variability
System boundary Sub- system 1
Harbours/villages/municipalities bays ecosystem
Sub - system 2 Region/Country/World
Variable of concern in the system
Actors in the fishing sector (users and governance system) Resource units
Actors in the fishing sector (users and governance system)
Exposure = Disturbance/stressor Shock versus gradual change
Social Economic and Political settings (Human drivers) Intra-annual variability, ENSO and climate change (ecosystem drivers)
Social Economic and Political settings (Human drivers) Intra-annual variability, ENSO and climate change (ecosystem drivers)
Resilience Change in absorption
To what extent can actors carry on productive activities (fishing) without changes and resource units remain within their domain of attraction
To what extent can users and governance system carry on activities (“business as usual”) without any change
Self-organisation Actors and resource units response Actors response
Adaptive capacity Actors change and learning? Actors change and learning?
Now that the different components of vulnerability and resilience have been defined and the
system bounded, how can this framework be transformed into an operational one? How can
specific fisherfolk responses be clearly identified and measured? One of the difficulty
encountered in resilience research is to define ‘what to measure’ and ‘for what’ (Carpenter et
al. 2001). At the micro scale, the sustainable livelihoods approach (SLA) is a powerful tool
for understanding people’s lives in the context of a changing environment, exploring in details
fishermen strategies and responses to change while broadening fishery discussions beyond
fishing per se to emphasize the entirety of individual, household or community sources of
livelihoods (Charles 2005). The concept of livelihood thus provides valuable insights and a
way to render operational the resilience framework presented here.
2.5 Livelihoods security
2.5.1 The sustainable livelihoods approach and livelihood security The sustainable livelihoods approach (SLA) developed in the 1980’s is increasingly adopted
to achieve a more accurate understanding of natural resource management systems (Carney

Chapter 2 Resilience from a livelihoods and institutional perspective
31
1998). A livelihood can be defined as the capabilities, assets and activities required for means
of living (Chambers and Conway 1992). The concept of sustainable livelihood seeks to bring
together the critical factors, assets and activities, that affect the vulnerability or strength of
household strategies (Ellis 2000; Allison and Ellis 2001). People can access, build and draw
upon five types of capital assets: human, natural, financial, social and physical (Box 2). The
way in which people combine and transform those assets, and how through relationships with
other actors, markets and society they expand their asset base is a characteristic of livelihood
inquiry (Bebbington 1999). In Figure 5, markets and other institutions like law and social
relations and organizations (NGOs, government agencies, private sector) and related policies
are understood as policies, institutions or processes (PIPs). They differ from the vulnerability
context by being endogenous to the norms and rule of the society under study (IDS Accessed
4/01/2008).
Box 2 Livelihoods capital assets
Figure 5 Rural livelihoods framework (Allison and Horemans 2006)
Natural capital – the natural resource stocks (soil, water, air, genetic resources etc.) and environmental services (hydrological cycle, pollution sinks etc) from which resource flows and services useful for livelihoods are derived. Physical capital – physical assets comprise capital that is created by economic production processes. It refers to the basic infrastructure and producer goods needed to support livelihoods. Economic or financial capital – the capital base (i.e. cash, credit/debt, savings, and other economic assets) which are essential for the pursuit of any livelihood strategy. Human capital – the skills, knowledge, ability to labour and good health and physical capability important for the successful pursuit of different livelihood strategies. Social capital – the social resources (networks, social claims, social relations, affiliations, associations) upon which people draw when pursuing different livelihood strategies requiring coordinated actions. Source: (Badjeck 2004) adapted from (DFID 2001) and (Scoones 1998)

Chapter 2 Resilience from a livelihoods and institutional perspective
32
For instance climatic stress whether seasonal or on a decadal scale enters within the
vulnerability context. Livelihoods are thus affected by a vulnerability context which is
conceptually similar to the concept used in hazard and climate change research (Allison and
Horemans 2006). PIPs can mediate access to assets while actors can change or transform the
rules that govern access, distribution and transformation of assets (Bebbington 1999).
Livelihood strategies are the range and combination of activities and choices that people make
in order to achieve livelihoods outcomes. Livelihoods therefore are about how actors can
mobilize capitals and capabilities to achieve well-being, building on the seminal work by Sen
on entitlements, development, and capabilities (Sen 1981; Sen 1999). The sustainable
livelihoods approach is well recognized as an integrated mechanism for poverty reduction and
natural resources management that is cross-sectoral and one that encompasses all the assets
(natural, human, physical, and social) of a community. Yet, the relevance of this approach in
ensuring human security has not been sufficiently explored in the current discussion on
human security and social development. This is an important drawback because the notion of
security brings to the livelihood concept the notion of equity (“whose security?”) and
mainstreams livelihoods in the current environmental security debate.
2.5.1.1 Human security and livelihood security From an historical perspective, security has emerged in the 17th century as a normative
concept typically interpreted mainly in terms of what it means to the nation-state, and
primarily in terms of military security (Goran 1997), later on to incorporate individual
security with the development of ‘social security’ in what can be called the traditionalists
perspective (Brauch 2005). A broader perspective seeks to extend the agenda to incorporate
economic, societal and environmental sectors (Buzan et al. 1997). Nowadays security research
embraces this wider perspective, with human security research focusing on the way diverse
social and environmental processes combine to affect human well-being, including people's
health, economic opportunities, and political freedoms. The United Nations identifies freedom
from want (the development agenda) and freedom from fear (the security agenda), as the two
concepts encompassing the idea of human security (Annan 2000). The Global Environmental
Change and Human Security project, a core project of the International Human Dimensions
Programme on Global Change, focuses especially on freedom to take action on one’s own
behalf in response to changing environmental conditions, in addition to freedom from want
and freedom from fear (GECHS Accessed 01/03/2008). In this context individual should have

Chapter 2 Resilience from a livelihoods and institutional perspective
33
the options to end, mitigate or adapt and the freedom to exercise these options. Ellis’s
definition of livelihoods is the starting point of this thesis’s approach to livelihood security:
“A livelihood comprises the assets (natural, physical, human, financial and social capital), the activities, and the access to these (mediated by institutions and social relations) that together determine the living gained by individuals or household.” (Ellis 2000 p. 10).
Building on this definition the concept of livelihood security is defined as:
“Livelihood security means the freedom to engage in activities that are necessary for the pursuit of sustainable livelihood options. It means creating socio-ecological systems which give people the access to assets necessary for this pursuit, which provide building blocks for the maintenance of livelihoods in the face of critical and pervasive threats and situations”.
Emphasis is put on the word sustainable. Indeed while freedom to choose and freedom from
want are emphasized, they are in the context of a limited natural resource base. Additionally,
the problem remains that ‘one person's security is often another's insecurity’. Security can
refer to a subjective, psychological feeling of being secure and an objective situation of being
legally secured (Brauch 2005). This dual aspect of objective and subjective feeling of security
has been an area of inquiry for many scholars in the social sciences (Brauch 2005), and the
emerging debate on the concept of security as it relate to environmental and human security is
: (1) what security and (2) whose security (Goran 1997). This can be translated into “what
resilience” and “whose resilience” need to be maintained in the face of socio-ecological
changes. Thus the concept of livelihood security, going beyond the traditional SLA,
encompasses the notion of equity and fairness.
2.5.2 Fisheries livelihoods and climatic stresses
Climate-induced changes to resource flows can fundamentally affect the viability of the
livelihoods of the poor (SEI et al. 2003). In the climate change literature the concept of
livelihoods is employed to understand the vulnerability context of communities (Adger 1999;
Morris et al. 2002; Ziervogel and Calder 2003), with work on fisheries focusing on climate
variability, fluctuating stocks and livelihoods systems (Sarch and Allison 2000; Allison et al.
2001). Different types of climate variability impacting on fisherfolk can be linked to the
various elements of the livelihoods framework. Livelihood security can thus be undermined

Chapter 2 Resilience from a livelihoods and institutional perspective
34
by changes in livelihoods capital assets, access to these assets and ability to exercise
livelihood options. In Allison et al (2005), the author of this thesis undertook an extensive
review of the possible impacts of climatic stress on the five livelihood assets, and the
following sub-sections draw heavily on that work.
2.5.2.1 Changes in natural capital
Possible impacts of climate change and climate variability, and related natural hazards on
fishermen are centered around changes in stock distribution and abundance (Roessig et al.
2004). In Taiwan the landing of mackerel purse-seine fishery experienced a dramatic decrease
of 47,75% following the 1997/98 El Niño due to changes in SSTs in the area between Taiwan
and Japan (Suna et al. 2005). Similarly in Chile the warmer SSTs lead to the collapse of the
horse mackerel with catches during EN a third of what they were in the mid-1990’s (Avaria
et al. 2004). In Peru, the industrial sector relying on pelagic species like anchovies and
sardines (for oil and fish meal), was the most affected during EN 1997-98. Total volumes of
landings decreased by 55% compared to 1996 (CAF 2000). It is worth noting that while the
fishery sector was adversely affected by the reduced stock of anchovies and sardines in the
eastern pacific upwelling areas fishermen in Denmark received near record prices for Baltic
sprat, a competing species for fishmeal production (MacKenzie and Visser 2001). Changes in
migration routes and biogeography of fish stocks can also affect fishermen’s fishing effort; for
instance increased travel time can lead to increase fuel and ice costs (Mahon 2002). Dalton
(2001) showed that fluctuations in SSTs, including El Niño events, have significant effects on
fishing effort in the albacore tuna, Chinook salmon, sablefish and squid fisheries in Monterey
Bay, California. Fishing effort is defined by Dalton as the number of vessels or boats landing
an individual species. Under a scenario of SSTs corresponding to the ENSO events of 1983
(increase of 1.2º Celsius), this number decreases by 60% for sablefish fishery and 400% for
squid fishery (Dalton 2001). This dramatic fall in the squid fishery is partly explained by the
forward-looking behavior of fishermen: prices only decreased by 50% but squid harvesters
expectations of increased costs due to increased SSTs decreased the number of boats (Dalton
2001). Changes in species abundance could also lead to changes in harvest and processing
costs due to retooling (change of gear, boat) to harvest the new abundant specie (Knapp et al.
1998; Broad et al. 1999). The capacity to quickly adapt to new harvesting techniques and
tools will determine the success of certain fisheries. In Peru, during EN 1997-98, boats
equipped with gill nets and pure seine nets were adapted into trawl nets for the new shrimp

Chapter 2 Resilience from a livelihoods and institutional perspective
35
resource that appeared in the northern part of the country (Carbajal and Alvitres 1998).
Moreover climate change and increased climate variability could also result in the arrival of
new tropical species or environmental conditions that favor the development of certain species
against others. The Peruvian bay scallop (Argopecten purpuratus) is highly susceptible to the
rise in SST triggered by ENSO events. During the EN period of 1983–1985, the scallop
harvest in Independence Bay - Pisco in the South of Peru was the highest ever recorded,
catches rising by 920% compared to 1980-82 (Palomino 1985). While some invertebrates like
scallops and octopus experienced an increase other species suffered mass mortalities like
crabs and sea urchins (Arntz 1986). Fishermen, following an opportunistic behavior,
dramatically increased their profits with the “scallop boom” and the introduction of species
such as mahi-mahi and shark was initially highly profitable for the artisanal fisheries sector
(Broad et al. 1999; Broad et al. 2002). However, several factors undermined potential benefits
to fishermen of additional species in 1997-98: the market price of mahi-mahi dropped to
below US$1 due to over-supply, the ‘Asian crisis’ decreased export demand, and there was a
lack of adequate gear (Broad et al. 1999). While EN negatively affects pelagic fisheries in the
Humboldt current system (Peru-Chile), La Niña events (cooling of SST) lead to increased
catches and revenues for the industrial sector dedicated to capture of anchovies for fishmeal
production (Ordinola 2002).
2.5.2.2 Reduced financial capital, damage to physical capital and changes in livelihood outcomes
Changes in the availability of fish products (natural capital) can affect total revenues and
harvesting costs (net revenues) of fishermen. Decreased revenues for fishermen due to the
decline in total catch and stock abundance are commonly cited as a consequence of natural
disasters and climate variability (Mahon and Joseph 1997; Callaway et al. 1998; Knapp et al.
1998; Lum Kong 2002; Mahon 2002). In Belize, Hurricane Mitch destroyed the main lobster
and fin-fishing grounds of the northern part of the country in 1998. This translated into a loss
in production of 65,000lbs that year (Gillet 2003). Based on comprehensive daily logbook
records during 1982–1999 and a fishing cost survey it was estimated that the loss of the
Taiwanese mackerel purse-seine fishery during the 1997/1998 EN to be US$6,22 million for
1998 (Suna et al. 2005). Climate variability and change through sea-level rise, storminess and
floods can lead to decreased harvesting capacity. Loss of revenues can be the result of
closures of fisheries activities during a weather anomaly (Siung-Chang and Lum Kong 2001;
Lum Kong 2002) or the reduction of fishing days due to increased weather variability such as

Chapter 2 Resilience from a livelihoods and institutional perspective
36
increased frequency of storms and changes in wind patterns (Broad et al. 1999; Mahon 2002;
Nagy et al. 2006). In Newfoundland, warmer temperatures and low water levels between 1975
and 1999 led to an increase in closures of the recreational salmon fishery (Dempson et al.
2001). Storm and severe weather events can destroy or severely damage infrastructures and
equipments such as ports, landing sites and boats (Jallow et al. 1999). For instance during
hurricane Gilbert in 1998, Jamaican fishermen lost 90% of their traps resulting in a loss of
revenue and high cost of repairs, as well as the inability to resume fishing activities promptly
(Aiken et al. 1992). In Belize, losses in relation to the loss of fishing tackle and associated
infrastructures as a consequence of Hurricane Mitch (1998) has been estimated at US$ 1,2
millions (Gillet 2003). More recently in the Florida Keys an estimated one-fourth to one-half
of all commercial spiny lobster traps were tangled or destroyed by the passage of Hurricane
Katrina in 2005 (Buck 2005). Climatic events outside the normal range (from El Niño to
natural disasters) can also have an impact on transportation and marketing systems (Catto
2004). In Peru, during EN of 1997-98, rural fishing villages in the northern part of the country
were damaged by heavy rains and were unable to get their products to markets due to washed
out roads and bridges (Broad et al. 1999; CAF 2000). In Mississippi, about 95% of the 62
seafood dealers were destroyed or so severely damaged that commercial fishermen were
unable to sell their catch or buy fuel or ice (Buck 2005). A reduction in financial capital
through the lack of access to credit and loans can also be observed. In Peru, at the time of the
1997-98 EN, a percentage of catch value was put into a recently privatized social security and
health organization for industrial fishermen (Broad et al. 1999). As a result of decreasing
catches the agency’s coffer quickly ran dry (Broad et al. 1999, p.15). This left fishermen
without a safety net and access to financial resources to cope with the difficult economic
situation. The lack of financial assistance to fishermen during fisheries crisis is a pivotal
problem in developing countries, while in countries like Canada and Norway social safety
nets and public programs provide important support (Badjeck et al. in prep.)
2.5.2.3 Reduced human capital The effects on human capital could be felt in terms of health and safety, and food security.
Injury and death are the direct health impacts often associated with natural disasters linked to
climatic stresses such as floods and hurricane, in the case of injury reducing the physical
capabilities of fishermen to pursue their livelihoods. Studies have also shown that the EN
cycle in certain areas is associated with changes in the risk of diseases transmitted by

Chapter 2 Resilience from a livelihoods and institutional perspective
37
mosquitoes, such as malaria and dengue fever, and diseases caused by arbodviruses other than
the dengue virus. The risk of malaria in South America, Central Asia, and Africa (areas where
the majority of small scale fishermen are located) has been shown to be sensitive to variability
in climate driven by EN (Patz and Kovats 2002). Small coastal rural communities often lack
potable water, sewage and drainage; health sector problems are thus often enhanced by
climatic events such as ENSO’s. Additionally, marine phytoplankton blooms caused by
increased SSTs can result in red tides that could cause diarrhoeal and paralytic diseases linked
to shellfish poisoning (Hales et al. 1999; Patz 2000). Safety while pursuing fishing activities is
a significant issue in fishing communities because of changes in weather and storm events or,
in the case of artic communities, stability and safety of ice and snow. Indeed personal safety
in artic communities practicing ice fishing can be jeopardized by unpredictable ice conditions
in winter making travel dangerous (Berkes and Jolly 2001). Catto (2004), presenting the
impacts of climate change for Atlantic Canadian fisheries communities, also puts forward that
changes in seasonality and storminess may necessitate operational changes by fish harvesters,
with implication for both health and safety search-and-rescue operations. Impacts to food
security related to access and availability of important traditional food species could equally
be significant in a scenario of decreased catches due to climate change events. The risk of
malnutrition and undernutrition for communities highly dependent on fish as a source of
protein (Ogutu-Ohwayo et al. 1997), combined with changes in diet (reduction of protein
from fish source) are some of the possible effects. Decline in commercial fisheries, leading to
decrease in income, can also reduce the ability to purchase store-bought food during periods
of natural resource scarcity (Callaway et al. 1998). Finally, infrastructure damages due to
extreme events or flooding can cut access to local markets, reducing the availability of food
products as well as increasing their prices, resulting in higher incidence of malnutrition in
communities (Niiya 1998) .
2.5.2.4 Impact on social capital At the local scale it could be argued that changes in abundance patterns and displacement of
stock could similarly lead to conflicts over property rights and resource access. For instance in
Peru the “scallop boom” in the south (Pisco) triggers a flow of migrants from all over the
country who are opportunistic fishermen wanting to share the bonanza of the EN event
(Meltzoff et al. 2005). However, since the last EN artisanal fishermen in Pisco have been
forming small associations to qualify for marine tenure to develop scallop aquaculture

Chapter 2 Resilience from a livelihoods and institutional perspective
38
(Meltzoff et al. 2005). With the open access of the scallop fishery removed and climate
variability being a common feature of the Humboldt Current System, one can wonder how
migrants fishermen will respond to this management scheme and social conflict can be
foreseen. In Southern Africa, increasing frequencies of droughts are forecasted, leading to
greater variability in lake levels and river flows, affecting lakeshore and river floodplain
livelihoods that incorporate fishing (Conway et al. 2005). Under increasing uncertainty,
migratory fishing becomes a more rational livelihood strategy than investing in a stable
village-based existence. As in Peru, this opportunistic behavior of fishermen resulting in
increased levels of displacement and migration can put a strain on communal-level
management and resource access systems, while decreasing commitment to stable settlement
affects investment in community level institutions and services. In the case of extreme events
and natural disasters the destruction of one sector infrastructure (e.g. agriculture, tourism, and
manufacturing) could lead to the displacement of the labor force into the fishing sector if the
latter was not significantly affected, leading to conflicts over scarce labor opportunities.
Mahon (2002) observed that in Antigua and Barbuda, during Hurricane Luis in 1995, the
destruction and damage to tourist infrastructures resulted in the transfer of workers from this
sector into fishing for short term employment, adding pressure to fishing stocks and labor
supply. In the case of Africa, it is put forward that droughts affecting agriculture may also
push people out of agriculture and into fishing (e.g. Senegal in the late 1990s) (Conway et al.
2005).
2.5.3 Integrating livelihood security in the study of resilience As shown above the livelihood framework and its focus on assets can be used to clearly
understand the pathways in which climatic stresses affect fisherfolk livelihood security. As
mentioned before, one of the difficulty encountered in resilience research is to define what to
measure and for what (Carpenter et al. 2001). The advantage of the livelihood framework is
that for each of the capital assets, indicators can be derived and the concept has been
vigorously debated in the literature (Campbell et al. 2001) and used by practitioners (DFID
2001; Allison and Horemans 2006). The aim of the indicators is to measure changes
(qualitatively and quantitatively) in the distribution and access to assets. Table 3 provides an
example of the type of indicators that can be used based on the review of the impact of
climatic stresses on capital assets. Changes in capital assets can be used as surrogates to
measure resilience, more specifically changes in absorption, self-organization and adaptive
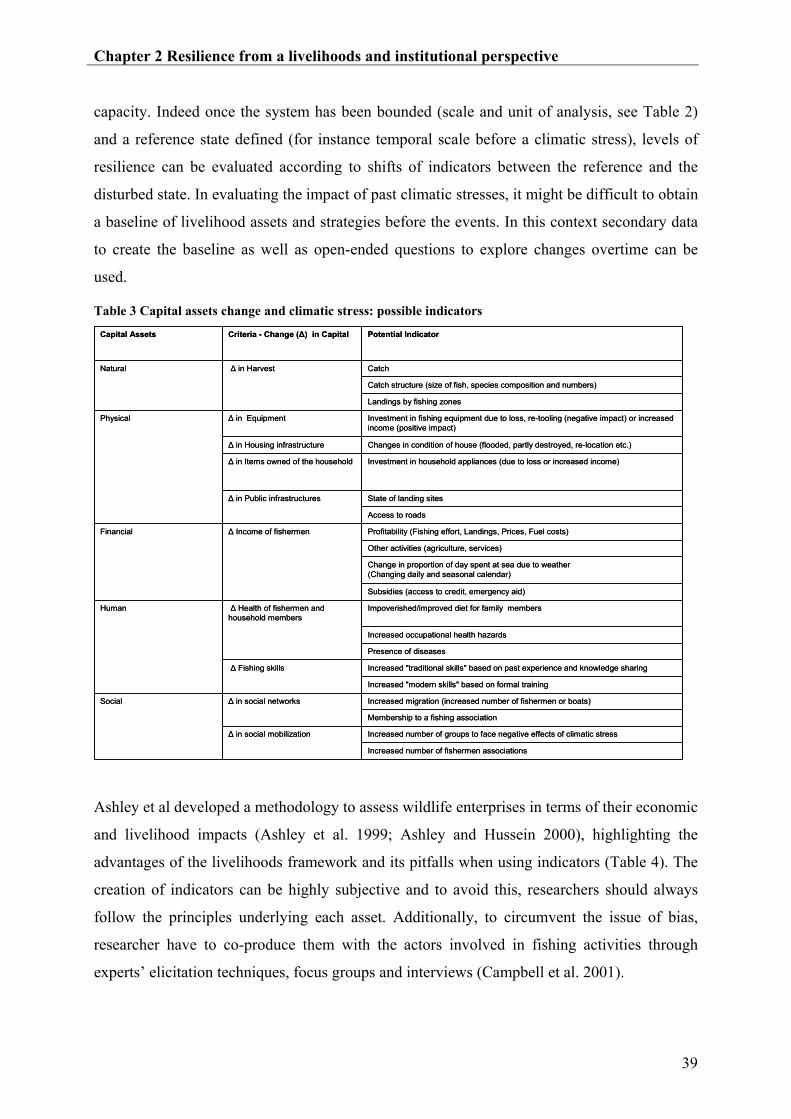
Chapter 2 Resilience from a livelihoods and institutional perspective
39
capacity. Indeed once the system has been bounded (scale and unit of analysis, see Table 2)
and a reference state defined (for instance temporal scale before a climatic stress), levels of
resilience can be evaluated according to shifts of indicators between the reference and the
disturbed state. In evaluating the impact of past climatic stresses, it might be difficult to obtain
a baseline of livelihood assets and strategies before the events. In this context secondary data
to create the baseline as well as open-ended questions to explore changes overtime can be
used.
Table 3 Capital assets change and climatic stress: possible indicators
Increased number of fishermen associations
Increased number of groups to face negative effects of climatic stressΔ in social mobilization
Membership to a fishing association
Increased migration (increased number of fishermen or boats)Δ in social networks Social
Increased "modern skills" based on formal training
Increased "traditional skills" based on past experience and knowledge sharingΔ Fishing skills
Presence of diseases
Increased occupational health hazards
Impoverished/improved diet for family membersΔ Health of fishermen and household members
Human
Subsidies (access to credit, emergency aid)
Change in proportion of day spent at sea due to weather(Changing daily and seasonal calendar)
Other activities (agriculture, services)
Profitability (Fishing effort, Landings, Prices, Fuel costs)Δ Income of fishermenFinancial
Access to roads
State of landing sitesΔ in Public infrastructures
Investment in household appliances (due to loss or increased income)Δ in Items owned of the household
Changes in condition of house (flooded, partly destroyed, re-location etc.)Δ in Housing infrastructure
Investment in fishing equipment due to loss, re-tooling (negative impact) or increased income (positive impact)
Δ in Equipment Physical
Landings by fishing zones
Catch structure (size of fish, species composition and numbers)
Catch Δ in HarvestNatural
Potential Indicator Criteria - Change (Δ) in CapitalCapital Assets
Ashley et al developed a methodology to assess wildlife enterprises in terms of their economic
and livelihood impacts (Ashley et al. 1999; Ashley and Hussein 2000), highlighting the
advantages of the livelihoods framework and its pitfalls when using indicators (Table 4). The
creation of indicators can be highly subjective and to avoid this, researchers should always
follow the principles underlying each asset. Additionally, to circumvent the issue of bias,
researcher have to co-produce them with the actors involved in fishing activities through
experts’ elicitation techniques, focus groups and interviews (Campbell et al. 2001).

Chapter 2 Resilience from a livelihoods and institutional perspective
40
Table 4 Livelihood approach and impact assessment through indicators: challenges and issues (Badjeck 2004)
The capital assets being interconnected, indicators interact dynamically with each other as
shown in Figure 6 with a causal loop diagram (CLD). CLDs are a powerful tool for
understanding complexity of dynamics systems, thus resilience, by identifying underlying
assumptions about the linkages and causality in the system. The use of CLD to conceptualize
livelihood security appears suited for linking the asset approach with the resilience
perspective, giving a more explicit systems perspective to the SLA (see Campbell et al. 2001;
Habtemariam and Gibbon 2002). Knowing what are the mechanisms, pathways and causal
relationships of resilience allows a better understanding of how livelihood security is
maintained over time. Figure 6 illustrates the dynamic nature of capital assets using a CLD for
a hypothetical fishery. Although not shown in the example in Figure 6, causal relationships
can be qualified as positive or negative. This ability to qualitatively explore relationships can
provide a surrogate measure for resilience. Some scholars have argued that the evaluation
within a complex adaptive systems worldview should place a priority on responding
(adapting) to feedback (Bennett et al. 2005; Plummer and Armitage 2007). Using CLDs
Advantages Problems
Gets closer to the reality of how rural
people live their lives and judge
development impacts than narrow
definitions of impact focusing only on
economics, or only on social change.
Recognises complexity while providing
useful tools or structures for assessing it.
Lays strong emphasis on assets and on
issues of vulnerability/security, both of
which are recognised to be key issues
for poor people.
Source: Ashley et al., 1999
What to measure? What are the indicators
of improved livelihoods?
Many components of livelihoods cannot be
quantified.
Nor converted in one denominator for
comparing or combining measures of
livelihood change.
How to define people sense of ‘well-
being’?
Criteria for judging livelihood security vary
from place to place, person to person. But
making comparisons across areas/enterprise
requires some common indicators.
Many livelihood impacts occur over the long-
term. These may be among the most important.
Yet there is a risk of assessing wishes and fears,
rather than actual impacts, if evaluation focuses
too much on possible impacts

Chapter 2 Resilience from a livelihoods and institutional perspective
41
allows for the identification of feedback loops. Feedback loops are a succession of cause-
effect relations that start and end with the same variable and control the dynamic behavior of
the system over time. The resilience perspective combined with the livelihood security
approach becomes thus a powerful tool to understand how fisherfolk can cope and adapt to
disturbances like climate variability and climate change, with a particular focus on feedbacks
when using CLDs. While they are powerful frameworks for integrating natural and social
dynamics at the micro-scale (actor level), socio-economic development and legislative and
marine management regimes are largely defined at regional scales (Charles 2001). These are
seldom fully integrated in research related to individual fishermen adaptation. The strength of
the SLA is that it aims to reflect the complex range of assets and activities on which people
depend on for their livelihoods. However, concerns have been expressed about the approach,
mainly that it is stronger on the micro details than on how these may be linked to macro
policy, and that it does not address issues of politics and of power (Norton and Foster 2001).
Murray (2001), in his review of concepts and methods related to livelihood research, argues
that one of the weaknesses of the SLA is that inequalities of power and conflicts of interest are
not sufficiently acknowledged, “either within local ‘communities’ themselves or between
‘communities’ and, for example, regional elites and government agencies” (Murray 2001 p.
7). Similarly, Allison and Horemans (2006) posit that the analysis of PIPs is cursory, and the
importance of markets and macro-economic linkages is diminished by the overemphasis on
the ‘asset pentagon’. Relating meso-scale to micro-scale processes is essential for exploring
how fisherfolk maintain livelihood security. In this context the study of institutions and
institutional change is crucial to understanding what makes individuals or social groups
change their priorities and regularize new forms of behavior (relevant to understanding self-
organization and adaptive capacity). In institutional analysis of SESs, Anderies et al (2004)
argue that a major focus has been on either harvesting decisions of resources users
(operational processes – actor level) or policy choices (collective choice processes – meso and
macro level). Little work has been done to analyze together the operational and the collective
choice level. To complete the proposed framework and go beyond a rapid appraisal of PIPs, it
is necessary to fully understand the governance system using theories of institutions. The
following section briefly describes theories of institutions and their use in fisheries
management, and how they can be incorporated to form a hybrid-framework to explore
livelihood security and resilience of fisherfolk.

Chapter 2 Resilience from a livelihoods and institutional perspective
42
Natural capital(resourcesavailable)
Physical capital(infrastructures)
Human capital (healthand knowledge status)
Social capital (socialnetwork and mobilization)
Financial capital(income)
Fish abundance(biomass)
Fish stock distribution(species migration) access to credits
price state of fishinginfrastructure (landing sites,
equipment)
access to roads
fishing effort
number of fishingassociations
migration
access to foodstaple
diseases (cholera,malaria) fishing skills
state housinginfrastructure
fuel costs
number of boats
number of groups tohelp face hardship
membership tofishermen association
Agricultural cropyield
Disturbances (trends, shocks,seasonality)
Livelihoods Security
PIPs
Livelihoods strategies
FB
Natural capital(resourcesavailable)
Physical capital(infrastructures)
Human capital (healthand knowledge status)
Social capital (socialnetwork and mobilization)
Financial capital(income)
Fish abundance(biomass)
Fish stock distribution(species migration) access to credits
price state of fishinginfrastructure (landing sites,
equipment)
access to roads
fishing effort
number of fishingassociations
migration
access to foodstaple
diseases (cholera,malaria) fishing skills
state housinginfrastructure
fuel costs
number of boats
number of groups tohelp face hardship
membership tofishermen association
Agricultural cropyield
Disturbances (trends, shocks,seasonality)
Livelihoods Security
PIPs
Livelihoods strategies
Natural capital(resourcesavailable)
Physical capital(infrastructures)
Human capital (healthand knowledge status)
Social capital (socialnetwork and mobilization)
Financial capital(income)
Fish abundance(biomass)
Fish stock distribution(species migration) access to credits
price state of fishinginfrastructure (landing sites,
equipment)
access to roads
fishing effort
number of fishingassociations
migration
access to foodstaple
diseases (cholera,malaria) fishing skills
state housinginfrastructure
fuel costs
number of boats
number of groups tohelp face hardship
membership tofishermen association
Agricultural cropyield
Disturbances (trends, shocks,seasonality)
Livelihoods Security
PIPs
Livelihoods strategies
FB
Figure 6 Identifying resilience of fisherfolk livelihood security with causal loop diagrams: a theoretical example. Dotted square refers to interactions within the assets pentagon (five assets in pink). The green hexagons refers to policies, institutions and processes (PIPs) and disturbances, the blue one to final outcome of livelihood security. FB is an example of a feedback loop.

Chapter 2 Resilience from a livelihoods and institutional perspective
43
2.6 An institutional approach to the study of resilience and vulnerability A number of scholars have defined the concept of institutions and their work largely relate to
the study of processes of institutional creation and change, which means analyzing economic,
social and political factors that create and make institutions alter their structures and
operational strategies. Leading contributors to institutional thought come from the fields of
economics, political science and sociology. But what are institutions? What is their role in
fisheries management? Albeit with brevity due to space constraints, an overview of the theory
of institutions will be provided, with a focus on new institutional economics. Then its use in
fisheries management research, especially in the context of resources fluctuations and climate
variability will be introduced.
2.6.1 Theories of Institutions
2.6.1.1 “Old” Institutional Economics Led by Gustav Schmoller (1838-1917), the German Historical School of institutional theory
insisted that economic processes operated within a social framework, which was in turn
shaped by a set of cultural and historical forces (Scott 2001 p. 2). Economic behavior was thus
contingent upon its historical, social and institutional context3. These ideas were adopted by
early American institutional economists such as Thorstein Veblen, John Commons, Westley
Mitchell and Walton Hamilton. They criticized the classical abstract deductive reasoning of
neo-classical economics, the hypothesis of the ‘economic man’, where people are highly
rational and operate in a perfectly competitive economy in equilibrium, with perfect
information flow and where analysis pay no attention to historical change (Peukert 2001;
Scott 2001). As observed by Spiegel (1971 pp 631-632), Veblen rejected the orthodox
“hedonistic conception of man as a lightning calculator of pleasures and pain”. Old
institutional economists (OIE) not only believed that institutions existing within a culture
played a significant role in the economic dynamics of that society. Their concept of
3 The German Historical School is thus characterized by a cross-disciplinary methodology: One must look at economic life with the eye of a historian and sociologist, as well as an economist. Historicism, was based on the idea of gathering facts and studying them in relation to their historical significance (inductive analysis).. Weber’s explanation of the influence of Protestantism on capitalism, albeit coming from a sociologist, is a good example of this (see Peukert, 2001).

Chapter 2 Resilience from a livelihoods and institutional perspective
44
institutions rested on the idea that habits4 were the basis of human action, with knowledge and
learning central to an actor’s behavior. Accordingly, an institution was defined as “a way of
thought or action of some prevalence and permanence, which is embedded in the habits of a
group or the customs of a people […] Institutions fix the confines of and impose form upon
the activities of human beings.” (Hamilton 1932 p. 84). OIE are a departure from orthodox
economics with its attempt to understand how actors behave in a society not only in terms of
rational maximizing agents, but also in terms of their environment (whether social, political,
or cultural). This leap from the traditional approach can be considered an attempt to study the
dynamics of a society in a multidisciplinary perspective.
2.6.1.2 “New” Institutional Economics ‘New institutional economics (NIE) as old institutional economics believed that institutions
mattered but contrary to OIE, it put forward that “the determinants of institutions are
susceptible to analysis by the tools of economic theory” (Matthews 1986 p. 903), hence not
shying away from neoclassical economics. NIE purpose is to explain the determinants of
institutions, their evolution over time, and to evaluate their impact on economic performance,
efficiency and distribution. Two approaches strongly rooted in neoclassical economics are
present in NIE: transaction costs, and the theory of collective action (Nabli and Nugent 1989).
2.6.1.2.1 Transaction Costs Theory Transaction cost theory was developed by Coase (1937) and puts forward that transaction
costs are the costs of running the economic system, of “doing business”, and can be
considered ex-ante and ex-post. As an example, the costs of arranging a contract are ex-ante
while monitoring and enforcing it are ex-post, as opposed to production costs, which are the
costs of executing the contract (Matthews 1986 p. 906). Transaction costs can therefore
include costs such as costs of discovering trading partners and monitoring performance
(Parada 2002), and are to a large extent what Matthews called the “costs of relations between
people and people” (Matthews 1986 p. 906). North, in seminal contributions (North 1989;
North 1991), extensively discusses the role of institutions in minimizing enforcement costs,
reducing risk in transactions, and hence on trade, making long term economic planning
possible and profitable (Heiskala 2007 p. 256). North argues that in close knit communities, 4 Hodgson (1998) defines a habit as a “form of self-sustaining, non-reflective behavior that arises in repetitive situations” (p.178). Hodgson GM (1998) The Approach of Institutional Economics. Journal of Economic Literature 36: 166-192.

Chapter 2 Resilience from a livelihoods and institutional perspective
45
transaction costs between villagers are low since people know each other and rely on social
networks to provide constraints (North 1991). As trade expands, personal ties and practices
such as ostracism that work in a small community are no longer effective, and the
development of an institutional environment that provides incentives for contract fulfillment
is necessary to make possible transacting and engaging in long-distance trade (North 1991 p.
100). Transaction costs are thus key to the performance of economies (North 1989), and
institutions can be considered transaction cost-minimizing arrangements (Nabli and Nugent
1989 p. 1336). Expanding on this idea North defines institutions as:
“(…) the humanly devised constraints that structure political, economic and social interaction. They consist of both informal constraints (sanctions, taboos, customs, traditions, and codes of conduct), and formal rules (constitutions, laws, property rights)” (North 1991 p. 97).
The non-interactive divide between formal and informal institutions proposed by North has
been criticized on the basis that this dichotomy fails to capture the empirical overlap and
interrelationships (Mehta et al. 1999, p.16). Hodgson (2006) argues that “the dividing line
between institutions that are entirely “formal” on one hand and entirely “informal” institutions
on the other is false, because “formal” institutions always depend on non-legal rules and
inexplicit norms in order to operate.” (Hodgson 2006 p.11). He puts forward that one
possibility is to make the formal/informal distinction one of explicit versus tacit rules. This is
in concordance with Zenger et al (2002) approach that defines formal institutions as rules that
are readily observable and explicit and informal institutions, in turn, as rules based on implicit
understandings, being in most part socially derived and therefore not accessible through
written documents or necessarily sanctioned through a formal position (Zenger et al. 2002
p.2).
Issues related to transaction costs are closely related to the theme of property rights (Demsetz
1988), Nabli and Nugent (1989 p. 1336) putting forward that “the existence of property rights
might reduce conflicts and facilitate cooperation, in both cases resulting in a reduction in
transaction costs”. According to Coase (1960), externalities5 can be internalized if property
rights are well established. In Coase’s view, if property rights are well defined and
5 Some of the costs (negative externalities) or benefits (positive externalities) of activities/decisions "spill over" onto third parties. See the work by Pigou on where environmental problems are considered externalities. Pigou AC (1932) The Economics of Welfare

Chapter 2 Resilience from a livelihoods and institutional perspective
46
transactions costs are very low or inexistent, then it may be possible for the parties involved in
an externality situation to reach an efficient solution by bargaining and negotiations.
Nevertheless, Coase outlines that the decision on property rights will affect the distribution of
income in the final outcome. This is the essence of what has been labeled the “Coase
Theorem.” North in his work extensively discusses the issue of property rights when he
addresses the issue of economic developments stating that:
“A capital market entails security of property rights over time and will simply not evolve where political rulers can arbitrarily seize assets or radically alter their value.” (North 1991 p. 101).
Building on the property rights approach collective action theory addresses issues of social
dilemmas related to public goods and the free-rider6 problem. The extensive literature on
collective action is too large to be addressed here; nevertheless a brief overview of the theory
and how it relates to NIE is presented below.
2.6.1.2.2 Theory of collective action The theory of collective action was developed by Olson to account for the ability of economic
groups to provide collective goods for their members (Olson 1971). Oslon tried to understand
under which conditions individuals can achieve cooperation, looking specifically at interests
groups seeking to lobby governments, and how to address the free-rider problem in the case of
public goods. As summarized in Paavola and Adger (2005) and Nabli and Nugent (1989),
Olson argues that determinant of success in collective action are the nature of the group (size,
age etc.), its homogeneity and purposes, and individuals still possessing the incentive to ride
free due to the nonexclusive character of public goods. Elinor Ostrom’s pioneering work
moves the core of the analysis from the firm and interest groups to its use in common pool
resources (CPRs), forming the basis of the rebuttal of the argument posited by Hardin on the
“Tragedy of the Commons”. Ostrom and colleagues define CPRs as:
“natural and human constructed resources in which (i) exclusion of beneficiaries through physical and institutional means is especially costly, and (ii) exploitation by one user reduces resource availability for others” (Ostrom et al. 1999 p. 218).
6 Individual who enjoys the groups benefits created by the contribution of others without paying the costs Henrich J (2006) Cooperation, Punishment, and the Evolution of Human Institutions. Science 312: 60 - 61

Chapter 2 Resilience from a livelihoods and institutional perspective
47
Hardin (1968) argued that these characteristics of common goods created a situation where if
one user limits his use of the good and other users do not, and the resource still collapses, then
the user faces a dilemma and will not have any incentives to restrain his use. However,
Ostrom and colleagues (2002) put forward that the logic of the tragedy of the commons does
not take into account human motivation, rules governing real commons do not always permit
free access, and resource systems themselves have dynamics that influence their response to
human use (Ostrom et al. 2002 p. 3). Common property and collective action approaches,
grounded in new institutional economics, therefore suggest that individuals can act for the
collective rather than their individual good if institutions mediating social relationships and
making of cooperation a rational strategy exist (Ostrom 1990; Bromley 1991). Theories of
institutions have thus been widely used to gain an understanding of their role in common-pool
resource management (Noble 2000; Ostrom et al. 2002; Dietz et al. 2003), and explain why
some institutions and institutional arrangements more than others successfully manage natural
resources (Wade 1988; Ostrom 1990; Baland and Platteau 1996; Dolsak and Ostrom 2003).
Agrawal (2001) in his synthesis of the empirical work on collective action and CPRs
identified more than 30 variables critical to enable the sustainability of the commons. Key
factors identified were (a) characteristics of resources, (b) nature of groups that depend on
resources, (c) particulars of institutional regimes through which resources are managed, and
(d) the nature of the relationship between a group, and external forces and authorities such as
markets, states and technology (Allison and Badjeck 2004 p. 50). Ostrom outlines that while it
is important to identify what structural variables lead to successful mode of collective action,
their shear number impedes the development of one large causal theory (Ostrom 1998 p. 16).
She points out that research should focus on developing coherent scenarios that start with
relatively simple baseline models and then change one variable at a time; from such scenarios
one can move to formal models (Ostrom 1998 p. 16). To conclude collective action theory
and the transaction approach share the belief that an actor behavior is not driven by
impersonal historical forces (Hotimsky et al. 2006 p. 2), but by self-interest and bounded
rationality, using an utilitarian perspective assuming that actors make decisions by weighing
costs and benefits. Indeed Ostrom posits that:
“one of most powerful theories used in contemporary social sciences -rational choice theory- helps us understand humans as self-interested, short-term maximizers” (Ostrom 1998 p. 2).

Chapter 2 Resilience from a livelihoods and institutional perspective
48
However, Ostrom points out that a second-generation model of rationality is needed, where
concepts of reputation, reciprocity, trust and various other norms of behavior are included
(Ostrom 1998).
2.6.1.3 What about social capital? Paavola and Adger (2005 p. 364), citing Ruttan (1999; 2001), argue that the concept of social
capital is useful to institutional economics because it extends the analysis of NIE to the
relationships between culture, beliefs and behavior on the one hand and the institutional,
economic, and environmental outcomes on the other. This is what Ostrom seemed to advocate
when talking about a second-generation model of rationality (Ostrom 1998). Social capital is a
highly valued term in social science and has emerged as one of the dominant concepts for
explaining various social and economic phenomena.
Bourdieu (1986) pioneering work expanded the notion of capital beyond its economic
conception, introducing the concept of cultural capital. However, it is Coleman’s work, and
later Putnam’s, that were essential in the creation of a broader, unifying concept of social
capital. Coleman defines social capital as a variety of entities part of social structures that
facilitates relations between actors of that structures (Coleman 1988). Putman builds on this
definition to posit that social capital encompasses networks, norms and social trust that
facilitate coordination and cooperation for mutual benefit (Putnam et al. 1993). When applied
to natural resource management, Pretty and Ward (2001) define it as the relations of trust,
reciprocity, common rules, norms and sanctions, and connectedness in institutions. These
definitions are closely related to North’s definitions of institutions and the concepts of
informal institutions (especially when talking about networks and trust). In the sustainable
livelihood approach (SLA), social capital means the social resources upon which people draw
in pursuit of their livelihoods, and include networks and connectedness, membership of more
formalised groups and relationships of trust, reciprocity and exchanges (DFID 2001).
Paavola and Adger (2005) put forward that there are two form of social capital: an asset which
can be created and passed on by individuals and a public good bound up with institutions. In
this thesis, it is put forward that in the SLA approach social capital is considered as a private
good (individual micro level of analysis) that is available to individuals or households

Chapter 2 Resilience from a livelihoods and institutional perspective
49
(Allison and Badjeck 2004) and when applied to institutions it refers to its public dimension,
the main difference being that:
“public dimension of social capital reside in networks that enhance overall economic performance [from a transaction cost perspective] rather then that of specific agents [in the private dimensions]” (Paavola and Adger 2005 p. 363).
The study of social capital at the macro level is thus important to complement the institutional
economics approach and the SLA framework.
NIE, from an economics perspective, oscillates between hyper-rational agents (game theory)
and adaptive agents with low-rationality (evolutionary theory) (Young 1998). This is in
contrast with the Veblenian emphasis (OIE) on habits of thoughts and on the fact that markets
are not an eternal feature of human society (Parada 2002 p. 49). While it is too complex to
develop here, it is worth nothing that the NIE approach to social dilemma has been contested
in other areas of social sciences. For instance social constructionist views hold that one cannot
have an over-reliance on a utilitarian perspective of human behavior: institutions are
embedded in social, economic, cultural and power structures that shape individual action
(Hotimsky et al. 2006). Critics of the rational theory approach in political sciences argue that
the “idea that human action is to some degree price elastic” (Shapiro 2005 p. 52) does not
yield valuable insight into why people engage in certain activities that do not benefit them.
For instance ideals and values can lead people to cooperate (Green and Shapiro 1996).
Additionally, from a structuration perspective developed by Giddens (1984), actors have the
ability to construct new institutions. Thus institutions can shape the decision-making process
of actors, being a primary mechanism to mould and facilitate particular outcomes; however
individuals have the agency to change institutions to reach desired outcomes. This is similar
to the capability theme addressed in the livelihoods framework. NIE, through institutional
analysis, can thus be a powerful tool to analyze society-nature interactions with a focus on
how social system respond to ecological changes and how these changes shape social systems.
However when using institutional analysis, one must be aware of its limits in order to
adequately explain social phenomena. In the next section a bird's eye view of how
institutional analysis has approached fisheries management and climate variability is
presented.

Chapter 2 Resilience from a livelihoods and institutional perspective
50
2.6.2 Institutions in fisheries Since these developments, theories of institutions and institutional analysis have been widely
used in natural resource management and more specifically in fisheries. Institutional analysis
examines how institutional arrangements affect users’ behaviour and incentives to coordinate,
cooperate and contribute in the formulation, implementation and enforcement of management
regimes (ICLARM 1996). The central role of institutions in determining environmental
outcomes has been put forward by several scholars (Ostrom 1986; Ostrom 1988; Imperial
1999b). Some argue that the fisheries literature does not adequately address notions of
institutional design and performance, and the institutional challenges facing ecosystem-based
management (Imperial 1999a; Imperial and Yandle 2005). When analysing the variety of
institutional arrangements in fisheries Imperial and Yandle (2005) showed that different
institutional arrangement lead to different levels of performance. Similarly Rudd (2004) and
Jentoft (2004) posit that an institutional approach to fisheries management facilitates critical
examination of important cross-cutting issues, and that the efficacy of fisheries management is
largely a question of institutional design and dynamics.
2.6.2.1 Institutional design Dolsak and Ostrom ( 2003) provide a good overview of the challenges faced when managing
natural resources. They argue that the characteristics of a particular common pool of resource
as well as the characteristics of resource users have a strong effect on institutional design.
Generally common-pool resources’ characteristics that can lead to successful governance are:
“(…) small size, stable and well-delineated resource boundaries, relatively small negative externalities from resource use, ability of resource users to monitor resource stocks and flows, (…) and well understand dynamics of the resource.” (Dolsak and Ostrom 2003 p. 12)
In fisheries small-sized, well-delimited and stable resource boundaries are not always found.
This is a particular challenge for migratory fish stocks such as tuna and halibut. Taking the
example of shared stocks between Canada and the U.S in the Gulf of Maine, Herbert (1995)
highlights how adequate management of transboundary fish resources is constrained by
political and geographical delimitations. Indeed the fisheries agencies of Canada and the U.S.
instead of focusing on conservation of shared resources competed on its extraction and
policies were aimed at the control of violation of the boundaries between the two countries.

Chapter 2 Resilience from a livelihoods and institutional perspective
51
This is particularly relevant in the context of climate variability and change, with fish species
possibly changing their stock distribution. Forecasted temperature changes in the Pacific
Islands could lead to a spatial redistribution of tuna resources to higher latitudes within the
Pacific Ocean (World Bank 2000). Consequently, distant water fishing fleets should be able to
adapt to changes in tuna distribution compared to domestic fleets which are restricted to
exclusive economic zone (World Bank 2000). This could lead to increased conflict between
industrial foreign fleets and national ones over the stock of tuna and would warrant
appropriate fisheries agreement. Similarly, Miller (2000) observed that changes in sea surface
temperatures and circulation patterns experienced in the North Pacific has led to divergent
trends in Northern and Southern salmon abundance. This directly affected the abundance-
based management agreement between the US and Canada (Pacific Salmon Treaty) and led to
conflicts in the management of the stock. Furthermore, climatic variations may destabilize
efforts to cooperatively manage resources that are shared among multiple jurisdictions (Miller
2000; Miller and Downton 2003; Miller 2007). Munoz (1988), referring to EN impacts on
pelagic fishery management in the Eastern Pacific also highlighted the importance of
international cooperation. Hannesson (2005) argues that establishing property rights to fish is
more complicated than establishing property rights to land for resources on and underneath
land due to their migratory nature. Defining boundaries for fisheries resources is thus a
particular issue of aquatic resources.
Property rights systems are often classified into four categories (Allison and Badjeck 2004
p.21):
• Open access (Res nullius) – where access is free and open to all (or there are no well
defined use rights)
• State Property (Res publica) – where rights to a resource are held in trust by
governments for the benefits of citizens and certain rights (use rights) may be granted
to citizens through state licensing schemes
• Common Property (Res communes) – rights are held by an identifiable community of
users with rights to exclude others
• Private Property (Res privata) where an individual or firm has the rights to exclude
others from using the resource
Literature on how characteristics of property rights affect fisheries management is extensive
(see for instance Gordon 1991; Toufique 1997; Crean 2000; Shotton 2000; Béné et al. 2003a;

Chapter 2 Resilience from a livelihoods and institutional perspective
52
Newkirk 2006). Few fisheries are truly defined as open-access with customary tenure system
such as common property often found in developed countries, while private property is a more
common feature of developed ones but exist in developing countries in the form of
aquaculture enterprise or small ponds (Allison and Badjeck 2004). Individual transferable
quotas (ITQ) are the most commonly used regulatory form of restricting access (private
property scheme) but their success is still debated (Hannesson 2005). Changing property
rights regimes can have a detrimental effect such as those portrayed by Marshall (2001).
Marshall describes how the privatization of marine commons on the Canadian east coast for
the development of aquaculture has undermined small fishing communities’ ability to get
access to wildlife resources. Scott (2000) provides an interesting overview of the evolution of
property rights in fisheries (Table 5) highlighting how declining stocks are often an incentive
to restrict access to a fishery. The creation of property rights can be a self-organization
process, what Menger (1981) (cited in Hodgson 2006 p.13) called “organic” institutions,
where as a consequence of changes users change the rules of access. It can also be a more top-
down approach where rules are imposed to users, referred to by Menger as “pragmatic”
institutions (designed).
Going back to Dolsak’s and Ostrom’s ( 2003) proposition that one of the factors that lead to
successful governance is the ability to monitor and understand the dynamics of resources, the
fisheries literature highlights the uncertainty surrounding the dynamics of fish stock (see for
instance Gordon and Munro 1996; Flaaten et al. 1998), especially under disturbances such as
climate variability (Glantz and Thompson 1981; Rothschild 2005; Allison et al. 2001).
Uncertainty is inherent to fisheries management. Managers routinely face difficulties in
designing effective policies to ensure the sustainability of stocks due to uncertain knowledge,
as the collapse of the cod banks in Canadian waters highlighted (Mitchell 1997).
Nevertheless, scientific uncertainty and lack of knowledge is not always the reason for bad
governance as highlighted by the Peruvian case study. The 1973 EN provided to Peruvian
institutions involved in fisheries management increased knowledge to deal with the impact of
climatic events on the fisheries industry. After the 1973 collapse, the Ministry of Fishery was
empowered to exercise tighter regulation and management of marine resources (Zapata and
Broad [undated]). However, limited proactive measures aimed at minimizing the negative and
enhancing the positive impacts on the fisheries sector during EN 1997-98 were implemented,
which many attribute to the government’s economic policy of minimal intervention in private

Chapter 2 Resilience from a livelihoods and institutional perspective
53
sector activities (Broad et al. 1999). In this case forecasting did not prevent massive labour
disruption, increase in illegal fishing and apparent biological and economic collapse of the
fishery (at least short term) (Broad et al. 1999).
Table 5Historical evolution of property rights in fisheries (Scott 2000).
1000
AD
1215 Magna Carta
1600 Grotius
1750 Naval powers
1900 Exhaustibility
1960s 1990s
Inland
Pond Stock right
Stock right
River Catch right
Catch right
Regulated
Tidal
River Catch Free Free Regulated Regulated & licensed
Inshore Catch Free Free Some regulated
Regulated & licensed
ITQ
Offshore Catch Free “None” Free No regulation Regulated & licensed
ITQ
National sovereignty
Declared “None” 3-mile limit 12 to 50 non limit 200 (EEZ) non limit
Treaty Waters
Fishery Treaties Fishery treaties
“Open seas” Law of the Sea
This reveals that lack of information in decision-making regarding climate variability and
fisheries management response is not always the only determinant; behavioral attitudes and
estimation of risks are also key factors. Consequently a focus on cultural and normative
factors affecting institutional performance is warranted (De la Torre-Castro 2006).
Institutional design based on imperfect knowledge is a challenge facing fisheries around the
world, especially in the context of climate variability and global changes. When assessing
how fisherfolk are impacted by and respond to climatic stresses, understanding the role played
by institutional design such as property right characteristics in shaping their behavior is
essential. However institutions are not static, rather they are dynamic like the systems they
belong to. It has been argued that in natural resource management the extent to which
environmental or resource regimes yield outcomes that are sustainable is a function not only

Chapter 2 Resilience from a livelihoods and institutional perspective
54
of the allocation of tasks between or among institutions operating at different levels but also
of cross-scale interactions among distinct institutional arrangements (Young 2002b p. 266). In
fisheries management, co-management and decentralization have been portrayed as one way
to increase cross-scale interaction and lead to efficient institutional arrangements.
2.6.2.2 Institutional interplay: the example of co-management and decentralization
Institutions interact with one another both horizontally or a the same level of social
organization (i.e. interaction between government agencies dealing with natural resources)
and vertically or across levels of social organization (i.e. interaction between local level of
land tenure and national regulations) (Berkes 2000; Young 2002b). This interaction among
scale and across scales can be referred to as interplay7. Horizontal interaction has been a
major focus of the fisheries literature through the advocacy of co-management arrangements
as a mean to achieve good governance (ICLARM 1996; Lane and Stephenson 2000; Castilla
and Defeo 2001). Co-management has been defined by many authors but the approach of Sen
and Raakjær Nielsen (1996) is one of the most used scheme (see for instance Wilson et al.
2006) and will be explained after Allison and Badjeck (2004). Sen and Raakjær Nielsen
(1996) classify co-management into five broad types: instructive, consultative, cooperative,
advisory and informative, according to the balance between the roles that the two groups play
(Figure 7). This classification is based on the relative power given to stakeholders. It has been
argued that that excluding users from resource management results in negative management
outcomes (see for instance Castilla and Defeo 2001). However, Berkes (Berkes 2000; Berkes
2004) puts forward that pure “informative” local-level management will not work by itself.
Instead of focusing on redesigning institutions at one level attention should be directed
towards the cross-scale linkages between the different levels. Similarly, in their review of co-
management in Asian fisheries, Wilson and colleagues (2006) posited that cross-scale
institutional linkages were essential for successful co-management, the state having an
important role in using its authority to structure and balance interactions between various
groups in order to allow them to be responsive to the changing demands of aquatic resource
management. The enthusiasm for co-management was rapidly cooled down by some scholars
(see seminal papers by Agrawal and Gibson 1999 who criticize the notion of '"perfect
community" as a steward of resources and; Leach et al. 1999 who put forward that one should
7 In this thesis interplay and cross-scale interaction are used as synonyms

Chapter 2 Resilience from a livelihoods and institutional perspective
55
look at the broader role of institutions not only communities). Likewise the initial fervor
displayed by proponents of decentralization in natural resource management was countered by
the realization that if decentralizing meant only the devolution of responsibilities without
increasing capabilities (whether financial or normative) at the local level, management
outcomes would be as detrimental as top-down approaches (Satria and Matsuda 2004; Ribot
et al. 2006).
Figure 7 Typology of co-management arrangements (Allison and Badjeck, 2004 adapted from ; Sen and Raakjaer Nielsen, 1996)
Decentralization refers to the systematic and rational dispersal of power, authority and
responsibility from the central government to lower or local level institutions (Pomeroy and
Berkes 1997 p.469) and often responsibility are the only things government are willing to
devolve. The examples of decentralization and co-management highlight the fact that
interaction between different scales is an essential aspect of good fisheries governance.
However, the focus has so far been on the functional scale, which is the interaction between
levels of social organization and political linkages (local versus regional and national
institutions). Yet, spatial and temporal dimensions of scale and fit with ecosystems are key
issues when addressing institutional change in the context of climate variability.
2.6.2.3 Fit and scale The resilience perspective described in section 2.2 puts great emphasis on the issue of scale.
In terms of spatial scale, managing an estuary, a bay or high see fisheries requires different
kinds of management regimes. The problem of fit revolves around how institutional
characteristics can “fit”, be compatible with the characteristics of the biophysical systems with

Chapter 2 Resilience from a livelihoods and institutional perspective
56
which they interact (Young 2002a). Cumming and colleagues (2006) argue that scale
mismatches between social and ecological components are widespread in socio-ecological
systems. Re-visiting the issue of transboundary migratory stocks, one can clearly see that an
institution operating only at the national level would not be able to control the effect of fishing
on stock outside of its jurisdiction, cooperation between countries thus being warranted
(Miller 2007). Additionally, fisheries management must operate at various temporal scales
(Figure 8) to deal with seasonal, intra-annual resource fluctuations as well as infrastructure
and development planning (Garcia 2004).
Operational Strategic
Conventional management
Multi-annual management
Development planning
Daily Seasonal Annual medium term long term
Multi-scale governance
Operational StrategicOperational Strategic
Conventional management
Multi-annual management
Development planning
Conventional management
Multi-annual management
Development planning
Daily Seasonal Annual medium term long term
Multi-scale governance
Figure 8 Temporal scale and fisheries management (Garcia 2004)
How can the “mismatch” problem be resolved? While multilevel-governance has been
portrayed as the solution, Lebel et al (2006) add that the ability to detect thresholds in a timely
manner, and the capacity to build knowledge about ecological processes into institutions
should improve the fit between rules and ecosystems, and allow societies to take measures to
prevent ecosystems from crossing thresholds. Allison et al (2005) argue that while models are
being developed to be more accurate and better predict stock dynamics and climate anomalies,
and accuracy allows the reduction in uncertainty, interpretation of information is still an issue
and forecast providers should consider explicitly how the fisheries sector and all its
stakeholders (i.e. government, large- and small- scales sector) would benefit from such
information. Greater emphasis is also needed on downscaling the results of models to a
management scale (e.g. from global model to regional and basin level). Knowledge building
and institutional learning are thus essential for decreasing the mismatch between institutions
and ecosystems and necessary for institutions to design adaptive management strategies.
Additionally, institutions must not only design adaptive strategies, they must sometimes also
undergo changes themselves.

Chapter 2 Resilience from a livelihoods and institutional perspective
57
The aim of this section was not to give an encompassing view of institutions in fisheries
management, but rather to highlight some of the main features that need to be addressed when
trying to understand how institutions respond and adapt to environmental change and how
they inhibit or enable user’s responses to these changes. The focus on interaction, scale and
feedback between scales is reminiscent of the system perspective. As for livelihoods, causal
loop diagrams can be used to conceptualize these interactions and feedbacks and provide a
qualitative understanding of the behavior of institutions (Young et al. 2006). Institutions are
thus treated as a system with its actors, boundaries and dynamic interactions. Institutions are
relevant to the study of fisherfolk responses because they regulate human-environment
interactions, co-evolve with environmental change, and mediate social responses (Bakker et
al. 1999). Governance is derived from the Latin word “gubernare” which means to “steer”; by
analyzing how institutions are or could be “steering” livelihood security in a desirable
direction, one obtains a greater understanding of the role of institutions in maintaining
livelihood security.
2.7 Hybrid conceptual framework to study resilience of fisherfolk: The multitier framework for analyzing social-ecological system proposed by Ostrom (2007) is
used as basis to integrate the resilience perspective (which includes vulnerability), and the
livelihoods and institutional approach in the study of complex interactions between the human
dimension of fisheries and climate variability and change. Ostrom (2007) posits that a
plethora of variables can affect patterns of interactions and outcomes observed in empirical
studies of SESs. In such a context, there is a need to organize attributes under a framework
that addresses governance arrangements and specific problems related to SESs. As a result she
presents a multitier framework for analyzing a SES and the main variables included in that
framework. The framework further elaborates the Institutional Analysis and Development
framework developed by scholars involved in the study of collective action at Indiana
University and the framework developed by Anderies et al. (2004) for examining the
robustness of SESs (Ostrom 2007). A multitier framework signifies that there is a number n-
of tiers (layers, elements, variables) that can take different configuration. This refers to the
fact that there are several levels of analysis for a SES, and at each level a certain number of
variable and patterns can be identified, putting forward that SES are nested systems. Ostrom
in her framework depicted in Figure 9 presents the highest tier variables (basic conceptual
map) while in Figure 10 second-tier variables are introduced with more details.

Chapter 2 Resilience from a livelihoods and institutional perspective
58
Figure 9 Multitier framework for analyzing SES (Ostrom, 2007)
Figure 10 Second-tier variables in framework (Ostrom, 2007)
The framework proposed in Figure 11 is inspired by Ostrom’s, but it tries to incorporate the
livelihoods approach, the concept of sustainable livelihoods having become an important
organizing framework for practitioners in multilateral donors, NGOs and government
agencies. Allison and Horemans (2006) pointed out that some scholars objected to the use of
the term livelihood strategies, arguing that strategies implies planning and choice which is not
always the case for fisherfolk. Here Ostrom’s term “interactions” referring to a bundle of
actions that can or cannot be planned and are reactive is more suited. This hybrid framework

Chapter 2 Resilience from a livelihoods and institutional perspective
59
is of interest to those not seeking to propose a “blue print” for the study of resilience of
fisherfolk that must be followed; rather, it highlights the importance of a truly
multidisciplinary endeavor in resilience research where strength from past approaches are
incorporated into new empirical work. After the system boundaries are defined (as presented
in section 2.4) the hybrid framework allows for the operationalization of the study of
resilience by specifically looking at the impact of a disturbance on the asset pentagon and on
the four attributes that characterize governance systems which are design, fit, scale and
interplay.
In teraction s (Resp o nses)
G o vern an ceSystem
SFish erfo lk
N
H
FP
Ou tcom es
So cial, Eco no m ic, and Po lictial S etting s (S )An th ro po g en ic Drivers
Ecosystem related (ECO)Environ m en tal Drivers
In te rp lay
F it S ca le
D es ign
Figure 11 Hybrid framework for the study of fisherfolk resilience.
2.8 Conclusion
“When the only tool you have is a hammer, everything around you starts to look like a nail.” (Shapiro 2000)
Digging through the shear amount of concepts and approaches used nowadays to appraise
fisherfolk interactions with their resource base and the role played by the institutional context
and climatic stress in maintaining or disrupting their livelihoods was a daunting task. The
objective was not to provide a blue print or ready made tool; rather it was to highlight the fact
that complex socio-ecological problems cannot be dealt with narrow approaches based on

Chapter 2 Resilience from a livelihoods and institutional perspective
60
disciplinary lines or schools of thoughts. Research frameworks must seek to connect existing
concepts in order to provide more powerful insights. While scientists have a tendency to “fish
for change”, always looking for new ways and concepts to explore problems at hand, one
should always take a reflective stance and explore what other existing approaches can be
linked to enhance knowledge. This chapter, the conceptual foundation of the thesis, was an
attempt to incorporate into fisheries research the resilience perspective without loosing the
insights brought by institutional and livelihoods concepts developed in the last 20 years.

Chapter 3 Study sites and methods
61
CHAPTER 3
STUDY SITES AND METHODS
“The dangers of theorizing while safely ensconced in the ivory tower are not exaggerated. Yet […] throwing
out the methods of modern science along with quantification and statistics [ . . .] is putting the
researcher in more danger – the danger of being wrong with no way to show it.”(Gladwin et al. 2002; cited in
McDougall and Braun 2003)
3.1 Introduction This chapter presents an overview of Peruvian artisanal fisheries and a description of the two
study sites. The institutional arrangements pertaining to the artisanal sector as well as the impact
of EN are briefly reviewed. Specific emphasis is placed on aspects that are of particular relevance
to the analysis in subsequent chapters. Additionally a summary of the methods used is presented,
both for the data collection and the analysis.
3.2 Peruvian artisanal fishery
3.2.1 Characteristics: fleet, target species and socio-economic features Peru has a coastline of more than 3 000km long and is dominated by the Humboldt-Peru eastern
boundary current system, one of the most productive eastern boundary systems in the world
(Levin et al. 2002). This system is characterized by coastal upwellings, wind–driven masses of
cold nutrient rich waters replacing nutrient poor surface warm waters, resulting in a highly
diverse and productive fishery (Wolff et al. 2003). Peru’s fisheries sector is the second highest
generator of foreign currency after mining, accounting for 1,124 million dollars in exports in
2001 (FAO 2003). More than 95% of fisheries catches belong to the industrial sector, with
pelagic resources such as anchovy, jack mackerel and chub mackerel (Majluf et al. 2005). The
artisanal fishery represents only 1,2 to 2,4% of the catches with an average of 100 to 200

Chapter 3 Study sites and methods
62
thousands tons per years (Majluf et al. 2005). In spite of its low contribution to total catches, the
sector plays an important socio-economic role in the country. More than 37 700 artisanal
fishermen operate along the coast while around 10 000 artisanal boats have been reported
(IMARPE 2008). Artisanal fishermen target more than 270 species. Some of the most common
fish species caught include corvina (Cilus gilberti), choicyruff (Seriolella sp.), Peruvian seabass
(Paralabrax humeralis), smoothhound (Mustelus sp.) as well as mullets (Mugilidae), silversides
(Odontesthes regia regia), weakfish (Cynoscion analis) and dolphin fish (Coriphanea sp.)
(Majluf et al. 2005). Fishing areas in Peru can be divided into three zones (adapted from
Corporación Andina de Fomento 2000 p. 143):
• Northern zone: High variety of fishing resources due to large continental platform and the
Cromwell current. Some of the most common invertebrate species are giant squid,
scallops, octopus, and snails. Demersal species include weakfish, seabass, croacker,
shrimps, smoothhound, ray and small pelagic like the anchovy can also be found
• Central zone: costal resources mainly in shallower waters with species like lorna, pejerrey,
mullet and some invertebrates like scallops, snails and mussels. During the summer
sardine are concentrated in Pisco and Pucusana, south of Lima, and in the spring in Callao
(Lima). The jack mackarel dominates this zone in October (Huacho y Pucusana) and
spring (Callao). The chub mackarel is frequently fished in October around Huacho.
Anchovies are located offshore (up to 300 miles from the coast)
• Southern zone: Accidental coastline characterized by small continental platform. Species
include anchovy, choicyruff, bonito, silverside and some invertebrates like scallops, snails
and mussels
In the last ten years the artisanal fishing sector has undergone several changes. According to
Estrella et al (2006), over the last decade the taxonomic composition of catches has changed from
a dominance of fish species (anchovy and sardine) to a dominance of invertebrates (jumbo squids
and scallops). Additionally, the number of fishermen has increased by 34% while the number of
boats by 54%, increasing the fishing effort in the sector (IMARPE 2008). The highest number of
fishermen is observed in the Piura region, in the North of the country, and has increased by 43%
since 1995 (IMARPE 2008). Fishermen migration and adoption of fishing as a main economic

Chapter 3 Study sites and methods
63
activity have been attributed to two factors: the open access nature of the fishery and ease of entry
into the sector. With positive demographic trends and poverty levels in Peru, fishing is seen as a
“refuge” where employment can easily be found (IMARPE 2008). In addition, when local
resources become overexploited fishermen have a tendency to migrate to more favorable fishing
zones (Majluf et al. 2005).
Currently the Peruvian artisanal fleet is composed mainly of gill and drift nets (33,0%) and hooks
and lines (28,4%) (IMARPE 2008). The gear description that follows is based on FAO’s
definition and classification of main types of gear (Nedelec and Prado 1990). Gill and entangling
nets are strings of single, double or triple netting walls, vertical, near by the surface, in mid-water
or on the bottom. Target species are pelagic, demersal and benthic ones. Driftnets, a special type
of entangling net, are used to catch schooling pelagic species like herring, mackerel and sardines,
but also tuna and pelagic squid. Trawlers are cone-shaped nets which are towed on the bottom or
in mid-water. Target species are bottom, demersal and pelagic species. In Northern Peru trawlers
are sometimes used by artisanal fishermen. Hook and lines are gear where the fish is attracted by
a natural or artificial bait (lures) placed on a hook fixed to the end of a line or snood, on which
they get caught. Target species are pelagic, demersal and benthic species. They can either be
operated by hand in small fishing boats or by mechanic systems in larger ones. Purse seiners
represent 12,3% of the fleet (IMARPE 2008). They are a type of surrounding nets which are
large netting walls set for surrounding aggregated fish both from the sides and from underneath,
thus preventing them from escaping by diving downwards. Target species are school of pelagic
species. Beach fishermen, present in small numbers along the coast, are defined in this study as
fishermen catching species without a boat, mainly through snorkeling from the shore. The diving
fishery consists of a small motor boat and a compressor for diving. The crew usually comprises
four or five persons, two of which are divers. Divers manually capture benthic invertebrates and
sometimes fish with harpoons. It is worth noting that according to IMARPE data the diving fleet
has seen in the last ten years a significant increase, from 5.1% in 1995 to representing 13,7% of
the fleet in 2005 (IMARPE 2008). The high demand for bivalves such as scallops in the
international market could explain this increase.

Chapter 3 Study sites and methods
64
3.2.2 Political and administrative framework Artisanal fisheries problems in Peru are, by and large, similar to those of other developing
countries: adverse economic conditions, sparse technical assistance, inadequate basic services,
short-term approach to use and management of aquatic resources, over-exploitation, production
changes due to natural or anthropogenic phenomena, and deficient marketing system (Mendo et
al. 2002 p. 25). Moreover the artisanal sector has not been considered in development planning in
terms of poverty reduction and food security. The legal framework in Peru has observed various
changes throughout the years. The General Fishing Law (GFL) of 19718 that regulated the sector
in the 80’s was characterized by state control. The government owned Pesca-Perú dedicated to
fishmeal production, EPSEP (Empresa Peruana de Servicios Pesqueros) dedicated to the
commercialization of direct human consumption fishery products and CERPER (Certificaciones
Pesqueras) dedicated to fishery certification. Additionally, municipal councils and political
authorities were obligated to control the price given to the consumer according to a system
established by the Fisheries Ministry9. It is interesting to note that pre-hispanic fishermen in Peru
had a common property regime (Res communes), where rights were held by an identifiable
community of users with rights to exclude others. For instance, in the Andean world, beaches
were the property of those who lived nearby and only certain zones where accessible for fishing
(Rostworowski 2005). The Spanish rule introduced the concept of the “Mar Grau para todos los
Peruanos10” which is still alive in the mind of most Peruvians. The GFL of 1992 currently forms
the basis for the exploitation of fisheries resources in Peru. The GFL states that aquatic resources
are state property (Res publica) and certain use rights may be granted to citizens through
licensing schemes. Table 6 presents the main characteristics of the GFL. There is no territoriality
related to the extraction of aquatic resources, the Peruvian fishery being considered a regulated
open-access fishery (de-facto open access).
8 General Fishing Law, Law Decree N° 18810 - 1971 9. Law Decree N° 18810 Art.20. 10 Grau [a famous Peruvian General] sea for all the Peruvians

Chapter 3 Study sites and methods
65
Table 6 General Fishing Law (1992) adapted from Mendo et al, 2002, p.37
Objective Regulates fishing activities in order to promote its sustainable development as a source of food, employment and income. Ensure the responsible use of aquatic resources, optimizing economic benefits as well as biodiversity (Art.1)
Aquatic Resources Aquatic resources found in waters under the jurisdiction of Peru, belong to the national patrimony (Art.1), for which the State regulates the integrated management and exploitation of these resources, taking into account that fisheries are of national interest (Art. 2)
Additional Tasks Fisheries policy, zoning, research and capacity-building, extraction and classification of resources, processing, aquaculture, prohibitions and sanctions, intra-institutional coordination, general fishery registry
Fisheries The ministry, based on scientific evidence and socio-economic factors determines the type of fisheries, management, quotas, moratoriums and fishing zones as well as regulating fishing efforts, minimum catch size (Art. 9)
Artisanal Fisheries The states promotes its development as well as capacity-building and technological transfer to artisanal fishermen, providing incentives and benefits following the appropriate rules and norms
With the liberal approach of Fujimori’s government in the 90’s, the 1992 GFL aimed to attract
private and foreign investments. This liberal approach and the promotion of exports were
reinforced in 2001 when the Regulation of the GFL was implemented by the transitional
government of Valentin Paniagua 11. The objective of the latter change was to simplify norms and
favour investment with fiscal initiatives such as the reduction of income taxes for aquaculture
companies. The Aquaculture Law and its Regulation12 was promulgated at the same time and
establishes two modalities to undertake aquaculture activities: through concessions (sowing in the
ground or suspended culture in nets) and authorizations (stocking and re-stocking purposes), as
long as they do not interfere with other traditional activities13. In protected areas such as the
Paracas National Reserve, special regulations14 prevail: in “special concessions” only suspended
culture is allowed and seed collection from natural banks is prohibited. Suspended culture
11 Regulation of the General Fishing Law, Supreme Decree No 012-2001-PE - 2001 12 Law for the Promotion and Development of Aquaculture, Law Decree N° 27460 - 2001 and Regulation of Law for the Promotion and Development of Aquaculture, Supreme Decree N° 030-2001-PE 13 Art. 13.2 of LPDA (D.S N° 030-2001-PE) stipulates that the accreditation of areas occurs taking into account the fact that selected areas must not interfere with other traditional activities being undertaken in the zone 14 Law of Natural Protected Areas and its Regulation, Law Decree Nº 26834 - 1997

Chapter 3 Study sites and methods
66
requires significant capital investments that often fishermen association are not able to bear. All
the modalities presented must follow rigorous standards to fulfil sanitary requirements of local
and export markets. Table 7 provides a summary of the main institutional arrangements relative
to property rights regime in the aquaculture sector, as well as highlighting some bottlenecks of
the law. It is worth noting that aquaculture also refers to the culture in natural environments
without the need to complete the full life cycle (from larvae development to harvesting)15. As a
consequence sea-ranching of scallop resource and stock-enhancement activities are considered
aquaculture activities despite the fact they do not involve a full life cycle. For bivalve aquaculture
the general practice in Peru is thus to retrieve seeds from the natural environment and sow them
in closed areas (delimited areas by nets in the water); once sowed they are fattened and then
harvested, mainly aimed at the international market.
Table 7 Aquaculture property right regime
Activities permitted Limitations Problems
Concessions Private or public, legal or natural persons From 10 (subsistence aquaculture) to 30 years (large scale aquaculture) both renewable (Art. 40.1 LPDA)
Cannot interfere with other traditional activities
Conflicts with other users
Authorizations Communities and fishermen social organizations as well as research entities. For stoking and re-stoking. 10 years renewable (Art. 14.1 LPDA)
Only as a complement of income generation (RM N°102-2006-PRODUCE/DNA)
Stoking and re-stoking currently the main economic activity
Special
concessions
Development of aquaculture activities in natural protected areas for fishermen associations. Only suspended culture. 3 years renewable (Art. 27.2 LPDA)
Bottom culture and seed collection from natural banks prohibited
Fishermen collect seeds from natural banks and do not possess the financial capital for suspended culture
One of the corner stone of the Aquaculture Law and it accompanying Regulation is the notion of
natural banks which are defined as the assemblage of benthic organism where a taxonomy
predominates in a specific geographic area16. The notion of natural banks, due to their migratory
nature, is a constant source of conflicts between users and the administration in the establishment
of aquaculture areas. Currently there are no management plans for the scallop fishery, regulation
of capture size being the only management measure (65 mm minimum size) and the elaboration 15 Art.3, Law Decree N° 27460 - 2001 16 Art. 82 LPDA, Supreme Decreee N° 030-2001-PE

Chapter 3 Study sites and methods
67
of the norms and regulation in this sector is heavily influenced by social and economic interests,
hindering management (Mendo et al. 2002). In addition to these legal provisions, the main
commercial fisheries possess their on management regulations (Reglamentos de Ordenamiento
Pesquero) (FAO 2003). Furthermore, the GFL defines artisanal fisheries17 as a fishing activity
practiced by individuals or companies with or without a boat and these must have a maximum
capacity of 32,3m3 and a maximum length of 15 meters, with a predominance of manual labour.
Catches must be mainly for human consumption and only artisanal activities are permitted within
the five nautical miles from the coastal zone 18.
The political structure of decision-making in the fisheries sector is divided into two levels:
national and regional (Table 8 and 9). Since 2002 Peru is divided in 25 regions19 with their
respective elected regional government. Previously, under the highly centralized Fujimori’s
administration, Peru’s 24 regions have been administered by devolved extensions of the central
bureaucracy (Schneider and Zuniga-Hamlin 2005). The Production Ministry – Vice-Ministry of
Fisheries is now the principal entity governing the national fishing sub-sector and the Peruvian
Marine Institute (Instituto del Mar del Perú – IMARPE) provides scientific advice. The different
departments that make up the Vice-Ministry of Fisheries (aquaculture, artisanal fisheries etc.) all
have their respective competencies and branches in regional offices. Despite the presence of
regional branches the management process remains heavily centralized (Mendo et al. 2002).
Organization among Peruvian artisanal fishermen and lobbying power are low despite the
presence of a national organization (Federación de Integración y Unificación de los Pescadores
Artesanales del Perú – FIUPAP). At the local level the number of fishermen organizations has
been growing due to the fact that only registered associations can access grounds for scallop
aquaculture. Currently little cohesion exist among these different associations due to competition
for aquaculture sites among themselves as well as with other artisanal fishermen who traditionally
fish in the areas (Mendo et al. 2007).
17 Art. 29, Regulation of the General Fishing Law, Supreme Decree No 012-2001-PE - 2001 18 Art. 63.1, Regulation of the General Fishing Law, Supreme Decree No 012-2001-PE - 2001 19 Organic Law of Regional Government, Law Decree Nº 27867 - 2002

Chapter 3 Study sites and methods
68
Table 8 National formal organizations involved in the fisheries sector
Actor Major regulatory responsibilities Production Ministry (PRODUCE) Formulates, authorizes, supervises and executes national policies related to extractive, productive activities and
the transformation industry and the industrial and fisheries sector Vice Ministry of Fisheries Formulates, executes and directs policies in the sub-sector fisheries which include marine and continental
fisheries and the extraction, processing and aquaculture of aquatic resources
Departments within the Vice Ministry (Dept. of Aquaculture, Extraction and processing, Artisanal Fisheries, Environment and Control)
Technical bodies responsible for the development, implementation and supervision of policies related to their sub-sector. They are headed by a national director
National Commission for Aquaculture Multi-stakeholder commission where the Secretariat is held by PRODUCE. Proposes activities (capacity building, technological transfer) and management plans
Instituto del Mar del Perú (IMARPE) Scientific research on fisheries resources and their environment for the rational management and protection of these resources. Advisory body for the Vice-Ministry of Fisheries on a scientific and technical basis
Instituto Tecnológico Pesquero (ITP) Promotes, executes and disseminates scientific programs that promote technological transfer for the adequate manipulation, conservation and processing as well as sanitary control of fisheries products
Fondo Nacional de Desarrollo Pesquero (FONDEPES) Promotes, executes and provides technical and financial support for the development of the artisanal fisheries and aquaculture
Centro de Entrenamiento de Paita (CEP Paita) Capacity building and educational activities for workers involved in the fisheries sector and aquaculture, especially the artisanal fishing sector
Instituto de Investigaciones de la Amazonía Peruana (IIAP).
Develop research in the Amazon region on natural resources
Ministry of Defence - Guard coasts (Direccion de Capitania)
The DICAPI is involved in the zoning of territorial water, the enforcement of these zoning rules and the control of sea transport activities
Ministry of Agriculture – National Institute of Natural Resources (Instituto Nacional de Recursos Naturales - INRENA)
INRENA is a decentralized organism of the ministry of agriculture who is the national authority on renewable natural resources and rural environment
Ministry of Mines and Energy To certain extent involved in the control of contamination of aquatic resources Commission for Export Promotion (PROMPEX) Promotes fisheries sector products on the international market through cross-sectoral coordination

Chapter 3 Study sites and methods
69
Table 9 Regional formal organizations involved in the management of fisheries resources in Sechura Bay’s (Piura) and Paracas and Indenpendencia Bay (Ica)
Actor Major regulatory responsibilities Regional Government and its respective departments (Gerencia)
Formulates, authorizes, supervises and executes environmental policies and plan (zoning) in accordance to local regional plans
Regional Direction of Production (Direccion Regional de Production - DIREPRO)
Formulates, executes and directs policies in the sub-sector fisheries at the regional level. Can emit Directorial Resolutions (Resolution Directorial) on certain aspect of management such as zoning for aquaculture sites
Departments within the DIREPRO (Dept. of Aquaculture, Extraction and processing, Artisanal Fisheries, Environment and Control)
Technical bodies responsible for the development, implementation and supervision of policies related to their sub-sector at the regional level. They report to the regional director of DIREPRO and their respective central department. At the local level they are involved in primary data collection (i.e. landings) and control operations (inspectors)
Regional Offices IMARPE- Paita and IMARPE Pisco
Scientific research on regional fisheries resources and their environment for the rational management and protection of resources. They report to the head office in Lima: cannot authorize norms and regulations (all decisions in Lima)
Regional Office Instituto Tecnológico Pesquero (ITP)
Promotes, executes and disseminates scientific programs that promote technological transfer for the adequate manipulation, conservation and processing as well as sanitary control of fisheries product at the regional level, reports to central agency. Cannot authorize norms and regulations (all decision in Lima)
Fondo Nacional de Desarrollo Pesquero (FONDEPES)
Promotes, executes and provides technical and financial support for the development of the artisanal fisheries and aquaculture at the regional level. Cannot authorize norms and regulations (all decision in Lima)
Centro de Entrenamiento de Paita (CEP Paita) Capacity building and educational activities for workers involved in the fisheries sector and aquaculture, especially the artisanal fishing sector. Mostly fishermen from the Northern part of Peru
Navy and coastguards (DICAPI Pisco and DICAPI Paita )
The DICAPI is involved in the zoning of territorial water, the enforcement of these zoning rules and the control of sea transport activities
INRENA Pisco (National Paracas Reserve) Management of the reserve

Chapter 3 Study sites and methods
70
3.3 El Niño and the fisheries sector Abiotic changes due to EN in Peru include strong increases in temperature, less intense
upwelling, changes in oxygen, salinity, freshwater and sediment input as well as increased sea
level (Arntz et al. 2006 p. 246). Biotic responses resulting from these environmental changes
include changes in species composition, abundance and biomass due to emigration,
immigration, changes in reproductive success, larval dispersal and recruitment, as well as
changes in food availability, competition and predation (Arntz et al. 2006 p. 246). Pelagic
species are especially sensitive to EN events and the impact of these events on their
population dynamics and the economic impact on the industrial sector have been extensively
studied (Pontecorvo 2001; Broad et al. 2002; Chavez et al. 2003; Alheit and Niquen 2004;
Bertrand et al. 2004; Ñiquen and Bouchon 2004). Niquen and Bouchon (2004) offer an
interesting study of the effects of EN on small pelagic, which are summarized in Figure 12.
While the prevalence of anchovy drastically decreases, other species like sardine and jack
mackerel strive. This results in taxonomical catch changes, with an increased percentage of
other pelagic resources and a reduced percentage of anchovy (Ñiquen and Bouchon 2004).
Increased SSTs also bring a variety of (sub) tropical immigrants and expands the distribution
zone of some species. For instance during EN 1982–1983 and 1997–1998 penaeid shrimps
(Xiphopenaeus kroyeri), and rock lobsters (Panulirus gracilis) from the Panamic Province
appeared in Peru (Arntz 1986; Arntz et al. 2006). These species, as well as dolphin fish, tuna
and diamond shark became a new economic opportunity for the artisanal fishing sector (CAF
2000).
Figure 12 Effect of El Niño on pelagic species (Ñiquen and Bouchon 2004)

Chapter 3 Study sites and methods
71
While demersal species such as hake, lorna extended their area southward, cold-adapted
benthic upwelling species such as mussels, clams, snails and crabs were negatively affected
by EN (Arntz et al. 2006). However, benthic invertebrates such as scallop (Argopecten
purpratus), purple snail (Thais chocolata) and octopus (Octopus mimus) proliferated under
warmer conditions (Arntz et al. 2006). The (normal) cold upwelling conditions (summer water
temperature of about 16°C) were drastically altered in Central Peru (Pisco) to tropical warm
water conditions (around 25°C), affecting scallop population dynamics by increasing growth
rate and recruitment, as well as the bay’s scallop carrying capacity (Wolff and Mendo 2000;
Mendo and Wolff 2003). Conversely, in Northern Peru (Sechura Bay) increased rainfall and
river runoff may negatively impact the benthic communities (Arntz et al. 2006). Vadas et al.
(2008) developed a predictive model for the Sechura scallop harvest. This modified model
demonstrates a significant negative correlation between scallop catches and river discharge.
River discharge causes a significant increase in mortality probably via decreased salinity
and/or increased sedimentation rates. Moreover, increased fluvial discharge in the North,
resulting from higher precipitations between January and April 1998, negatively impacted the
shrimp fishery, with the destruction of production infrastructures (hatcheries) (CAF 2000).
The strong rainy season also caused damage on infrastructures such as landing sites, boats and
transportation routes (CAF 2000). The latter particularly hindered the commercialization of
fishery products. It has been estimated that the cost of EN on the fisheries sector in 1998 was
73, 7 millions of soles (26, 3 millions of dollars20) (Table 10). This had a negative effect on
the country’s balance of payment of around 8,4 millions soles (CAF 2000). The major losses
were registered in the industrial fishing sector (processing and exportation). During EN 1997-
98, the total volumes of landings decreased by 55% compared to 1996 (CAF 2000).
Table 10 Damages to the fishery sector in Peru during EN 1997-98 (1, 000 of Nuevo soles) (CAF, 2000)
Type of damage Total damage Indirect Direct Effect on the balance of
payment
Infrastructures 41, 800 41, 800 8, 400
Reduction of catches 19, 260 - 19, 260 -
Shrimp industry 12, 610 - 12, 610 -
Total 73, 670 41, 800 31, 870 8, 400
20 Exchange rate of 1998

Chapter 3 Study sites and methods
72
Artisanal fisheries were diversely affected depending on the migration and abundance of
certain species but no published studies specifically examining the impact on the sector and
on fishermen livelihoods were found.
3.4 Multiple-case studies approach The research was carried in two study sites: Pisco, in South-Central Peru and Sechura, North
of Peru (Figure 13). Similarities reside in the differential effect of EN, while differences in the
presence in one site of a marine National Park and tourism among others. A multiple-case
study approach was warranted to understand the differential impacts of climate variability in
coastal Peru. Multiple-case studies designs based on the prediction of contrasting results but
for predictable reasons allow for the development of a rich theoretical framework, and the
evidence is more compelling for the generalization of findings (Yin 2003). The degrees of
contrast and similarity among the sites will allow this empirical based work to be of relevance
for other regions of Peru, as well as providing external validity to the findings.
Figure 13 Map of Study sites
3.4.1 Region of Piura: Bahia de Sechura Piura is an arid coastal region located in northern Peru, 1200km north of Lima. Piura is
derived from the Quechua word “Pirhua”, which means granary or more broadly supply base
(Alban Ramos 1985). Indeed the region in an important agricultural center in the country with

Chapter 3 Study sites and methods
73
rice, lemon and mango production for the local and international markets. Fisheries landings,
while representing only 7,1% of the regional gross domestic product (GDP) in 2001,
represented 28,6% of the national sectoral GDP (Tarazona, 2005). The region is divided into
eight provinces, the province of Sechura being one of the most populated, with 17,7% of the
total regional population (Chapa 2005). More than 40% of the population lives below the
poverty line (i.e. with less than two dollars a day per capita), and 12,5% is trapped in extreme
poverty, with less than one dollar a day (Flores Ysla et al., 2005). Fishing activities are an
important source of revenue, providing work to more than 30% of the economically active
population in 1993 (Chapa 2005). Sechura Bay (5,6° S, 80,9° W) is relatively shallow with
depths of less than 30 meters and extends over 89 kilometres. It is situated within the zone of
transition between cold water transported from the south by the Humboldt Current and warm
water of the tropical equatorial region (Taylor et al. 2007). The Lobo de Tierra Island located
at 15 hours by boat from the Bay is another important fishing area in the high seas where
artisanal fishermen mainly extract invertebrates (scallop and squid). In the Bay, there are three
main docks (“caletas”) with associated settlements: Constante, Parachique – La Bocana and
Puerto Rico. Diving is a recent activity brought by fishermen from the South in the late 80’s
and early 90’s. Based on available data it is estimated that the diving fishery currently
represents 25% of the fleet in 2005 compared to 19% in 1995 with more than 30% of the 6
000 artisanal fishermen are involved in the fishery (Pers. comm. Fiesta; DIREPE 1995;
DIREPRO 2005b). Of the 155 species extracted in the bay, principal resources include
(Gonzales and Yepez, 2007):
• anchovy Engraulis ringens – 92.9% of total landings mainly for the industrial sector • giant squid Dosidicus gigas - 2.5 % • scallop Argopecten purpuratus 1.1 % • Patagonian squid Loligo gahi 0.8 % • longnose anchovy Anchoa nasus 0.6 %, • snake eel Ophichthus remiger 0.6 %, • mullet Mugil cephalus 0.3 %
The El Niño phenomena results in catastrophic consequences in the region of Piura, having
been referred to as the “castigo de Piura” (“Piura’s curse”) (Reves 1983). During the 1997–
1998 El Niño the total accumulated rainfall in the city of Piura was 1802mm, thirty times its
normal value (Takahashi 2004) which resulted in river discharge in the bay four times higher
than normal. The floods caused negative impact on agriculture, with a third of the cotton and
rice production being lost (Niiya 1998; Van der Veen 1998), food security becoming a severe

Chapter 3 Study sites and methods
74
problem in the area (Niiya 1998). The cost of staple foods such as rice and cooking oil was
heightened by heavy damage to transport infrastructures. More than 10% of rural housing
infrastructures were destroyed while 40% of transport route were damaged (CIPCA and
COER 1998). Additionally, the usually dry watersheds became active and formed in Sechura
a lagoon called “La Niña”. This lagoon is the result of effluents from the Piura River
augmenting the water level of the Las Salinas Lagoons and transforming them into a lake
were fishes such as mullets, species favouring brackish waters, became abundant (Goicochea
1998).
3.4.2 Region of Ica: Bahia Paracas and Independancia The region of Ica is divided into five provinces. The province is located 250km South of
Lima, and is characterized by the presence of the Paracas National Reserve, the only marine
reserve in the country created in 1975. The reserve attracts a significant number of national
and international tourists each year, with in 2001 nearly 99 000 people having visited the
reserve (ERM 2002). It’s main agricultural productions are cotton and grapes (mainly for the
manufacture of wine and the Pisco liquor) (ERM 2002), with agriculture representing 15% of
the regional GDP (Gobierno Regional de Ica 2006). Fisheries, with 8% of the regional GDP
(Gobierno Regional de Ica 2006), play an important economic role in coastal towns,
especially the province of Pisco. The province is one of the main seafood provider of the large
Lima urban market (ERM 2002). Official statistics characterizes 29,2% of the population as
poor and 2,4% as extremely poor (INEI 2004). Additionally, Pisco is considered a province
with negative migration balances (ERM 2002).
Independencia and Paracas Bay are located within the province (14°S-76°W) and are
relatively shallow (5 to 25 meters). Independancia Bay is situated within the Paracas National
Reserve, and has an area of 150km2. Paracas Bay, adjacent to Independancia but located
outside the reserve is a smaller bay. Both bays are heavily influenced by upwelling conditions.
The main pelagic fish species extracted are anchovy, jack mackerel, sardines and chub
mackerel (Mendo et al. 2005). Invertebrates with the high landing volumes are scallops,
mussels, abalones, snails and clams (Mendo et al. 2005). The south of Peru saw the beginning
of diving activities with the apparition in 1941 of the first diving equipment with compressor
in Pucusana, near Pisco (Zavala Lopez No date). The Peruvian scallop fishery started in Pisco
in the 1950’s while the first experiences with intensive culture were initiated in 1979

Chapter 3 Study sites and methods
75
(Valdivia & Benites 1984, Valdivieso 1990). The province became the hub of the scallop
diving fishery and until now the most skilled divers are considered to come from the area. It is
estimated that 39% of the 3059 artisanal fishermen from the Pisco area are involved in the
diving fishery, representing 46% of the fleet (Mendo et al. 2005). The Paracas National
Reserve restricts the extraction of aquatic resources. Under special conditions only fishermen
associations are allowed to culture scallops in the Reserve while in Paracas Bay, outside the
reserve, companies own most of the aquaculture sites. In Independancia Bay main landing
sites are Lagunilla, Laguna Grande-Muelle and Rancherio, the latter being a human settlement
which in 1999 consisted of 102 “ranchos” (sheds) while Laguna Grande had 59 “ranchos”. In
Lagunilla there are no human settlements. In Paracas Bay the main landing site is El Chaco
while near Pisco, San Andres is the commercial hub where products are sold to intermediaries
from Lima. Sea temperatures during the year normally fluctuate between 12°C (bottom) y
16°C (surface) while during EN events temperature reach values above 20°C (Wolff and
Mendo 2000).
3.5 Methods Methodological pluralism is the favored method of inquiry used, with a combination of
quantitative and qualitative methods rooted in the social sciences, breaking away from the
traditional approach in Latin America to focus assessment of artisanal fisheries solely on
ecological and biological aspects (changes in biomass, catches) to inform policy.
Additionally, in the identification of processes in social settings the subjectivity of the
researcher must be down-played by a co-definition of fundamental processes with actors in
the system studied using participatory methods. The multi-method approach comprised
archival research, participant observation, semi-structured and unstructured interviews,
workshops and surveys. Research was carried out in two municipalities and one settlement
around Sechura Bay: Sechura, Parachique and Puerto Rico. In Pisco, field work was
conducted in two municipalities: Laguna Grande and San Andres. These locations are
characterized by being the principal fishing docks in both study sites. Additionally, in
Sechura, some field work was conducted in the Lobo de Tierra Island (temporary fishing
settlement). A fundamental problem in research is defining what the unit of analysis is; that is
individuals, groups or communities (Yin 2003). In this work the unit of analysis is related to
the way the research questions were defined. These focused on fishermen livelihoods and
responses to El Niño events thus information relevant to individual fishermen was collected

Chapter 3 Study sites and methods
76
(i.e. fishermen survey instead of household survey). However, it is acknowledged that
households, groups, communities and supra-communities entities influence fishermen
livelihoods and behavior so while the focus was individual the research strategy was designed
to understand contextual variables that influence fishermen livelihoods. Local community in
this study is defined principally in terms of place or location where a group of interacting
people are tied together for instance by residence, not necessarily identity (Berkes et al. 2001).
To elicit how climate variability affects fishermen in depth unstructured and semi-structured
interviews were conducted with selected informants. These concentrated on perceptions of
how EN affected their fishing activities and their households, and more generally what factors
inhibited rather than encouraged their activities. A fishermen survey complemented this
information while providing socio-economic parameters to inform the livelihood analysis.
Unstructured and semi-structured interviews to key informants were also used to determine
the major constraints faced by the artisanal fisheries sector in terms of management. Interview
topics included the articulation between national and regional authorities, the effectiveness of
fisheries policies and the impact and management of EN events. Evidence of the findings for
responses of institutions to climate variability is driven by secondary data, namely reports,
policy statements, planning documents and archival research of fisheries legislations.
Workshops and focus groups also provided the mean to understand stakeholders’ perception
of the impact of EN and the current fishery management regime. Finally, to understand how
different driving forces affect institutions’ responses, a conceptual model was developed using
causal loop diagrams. Table 11 provides a summary of the methods used while the following
sections explore them in more details.
Table 11 Summary of methods
Research Objectives Methods Characterize fisherfolk livelihoods to understand how livelihoods are constructed and maintained
Interviews, observation, surveys and workshop
Understand how livelihoods are impacted and maintained during El Niño events
Interviews, surveys, workshop and focus group
Establish how institutions enable or constrain fisherfolk adaptation processes
Archival research, interviews, workshops, focus groups and causal loop diagrams

Chapter 3 Study sites and methods
77
3.5.1 Research Methods – Data collection
3.5.1.1 Archival research Researchers should make a maximum use of historical and secondary data to supplement the
primary data collected. Too often, these sources of data are rejected outright as being
unreliable (Smith et al. 1983). The first phase of a research should thus focus on a
comprehensive secondary data collection (Smith et al. 1983). Information pertaining to the
artisanal fisheries sector in Peru and in the study sites was thus collected at the onset of this
thesis. Published and unpublished studies, government reports, academic thesis, newspapers
and library archives were revised. It is worth noting that little published information exist on
the artisanal sector and on the specific impacts of EN.
3.5.1.2 Workshops and focus groups
A series of workshops were undertaken between March 2005 and 2007. All workshop results
were compiled in reports made available in Spanish to participants (i.e. Mendo et al. 2006a;
Mendo et al. 2006b).21 The first two workshops were conducted at the onset of the thesis in
Pisco and Sechura in 2005. Participants ranged from fishermen, government representatives
and businessman (Annex 1). The objectives of the workshops were to:
• Establish a first contact with users of fisheries resources in the two bays
• Understand the asset base on which fishermen rely in the study sites
• Establish what constraints and problems each study site faced in terms of fisheries and
coastal management.
Participants were divided into groups of 5 to 7 persons; groups were formed to ensure
heterogeneity of actors (fishermen – aquaculture and non-aquaculture, government officials
etc.). In each group a moderator was elected and CENSOR project members were instructed
to remain passive observers, only intervening to respond to inquiries about the methodology
and doubts, and taking notes. In the first activity each group identified assets available to
fishermen using the livelihood framework. The second activity of the workshop was a
participatory ranking exercise. Problem ranking is a way of quickly identifying main
problems experienced by individuals or groups (Mikkelsen 1995). Divergent ranking can be
compared and consensus reached through discussion (Mikkelsen 1995). In each group a
brainstorming session was initiated on problems related to the use and management of
21 Some are available on the project website www.censor.name

Chapter 3 Study sites and methods
78
fisheries resources in the area. Each participant was asked to rank the problems from one to
five (least to most important problem). The total sum of each vote was used to establish a
ranking of problems in each group. Then, for the five most important problems, the causes,
consequences and possible solutions were identified. Finally, based on each group works, a
consolidate table was create relating the five most important problem in each site based on the
value of votes assigned to them.
After these first two workshops, five others were undertaken between 2006 and 2007. Central
components of these events were group discussions and experts input. The objectives of these
workshops were to:
• Assess local perception of scallop fishery management issues and the impact of
climate variability on scallop resources
• Present preliminary results to obtain feedback, ensuring triangulation of the research
results
The meetings provided a learning platform for the researcher, allowed institutions,
communities and fishermen to get acquainted with the research and comment on preliminary
results, as well as permitting the exchange of ideas between users and authorities who seldom
meet in such venues. These workshops were instigated by the CENSOR project to address the
particular issue of the scallop fishery which is an important resource for artisanal fisheries in
both bays and is subject to drastic changes during El Niño events. The formats of the
workshops were: expert presentations followed by discussion with participants and a plenary
were main results of the discussions were presented. Experts were not only “academics” but
representatives from government as well as presidents of fishermen organizations and
representatives from companies. Three of the five of the workshops were open to the general
public. Fishermen, by being presenters, were given the opportunity to share their knowledge,
reversing the power relation and moving the research from simply extracting to empowering
fishermen (Chambers 1997 p. 154). The feedback from users and local experts allowed the
author to contextualize the findings, avoid bias and mis-interpretation, and basically ensure
triangulation of the data. Triangulation is a method to overcome the problems that stem from
relying on a single method, single data set or single investigator (Mikkelsen 1995 p. 81).
Additionally to the workshops three focus groups with fishermen, one in Sechura and two in
Pisco, were undertaken in December 2006 and January 2007. Focus groups are somewhere

Chapter 3 Study sites and methods
79
between “ a meeting and a conversation” (Agar and MacDonald 1995; cited in Kidd and
Parshall 2000), where participants relate their experiences and reactions among presumed
peers. Homogenous focus groups are an optimal way to obtain in-depth information about
certain activities (Mikkelsen 1995). The focus group in Sechura was composed of migrant
fishermen involved in scallop extraction. The objective was to understand migration patterns
of fishermen and responses to EN events. In Pisco individuals involved in scallop extraction
were asked to share their experiences within the activity, highlighting trends, constraints and
responses to EN.
3.5.1.3 Observations and interviews Observation is widely used in classical anthropology and is an indirect method of data
collection that stresses the importance on dialogue rather than extractive techniques
(Mikkelsen 1995). Participant and non-participant observation was undertaken throughout the
field work. Participant observation included activities such as snorkelling with divers, taking
part in communal kitchen meal preparation and community group meetings. Participant
observation implies getting to know people, establishing a rapport and a relationship of
mutual trust (True 1989). Non-participant included walks in communities and observing
unloading of catches at the main fishing docks as well as fish market activities. Key
informants semi-structured interviews were also undertaken to obtain specific knowledge on
the study sites and the fisheries. Key informants are individuals anticipated to have a
particular insight or opinions abut the topic under study (Mikkelsen 1995 p. 75). They ranged
from fishermen (presidents of association), individuals in the private sector (aquaculture and
fishing companies), NGOs and international donor agency workers, academic experts,
individuals in government agencies and leaders of community groups (i.e. communal
kitchen). Semi-structured interviews are appropriate when one has specific objectives but still
wants to leave room for exploration during the interview (True 1989). Probes were used to
steer the conversation towards specific topics (Annex 2). Manual recording was the favoured
method for recording data during the interview, combined with post-interview write up. In
addition informal and open-ended interviews were conducted, with no premeditation of
questions. The characteristic of this approach is that information is collected from different
people on different topics (Mikkelsen 1995). This less systematic approach offers to the
researcher the possibility to deal with delicate questions that cannot be spelled out right (True
1989), such as those related to corruption.

Chapter 3 Study sites and methods
80
3.5.1.4 Audiovisual interviews As part of the project CENSOR a 25 minutes documentary on climate variability and the
scallop fishery was co-produced by the author (Annex 3). Key informants were involved in
the development of the script. The video was filmed during June and July 2007 and a first
screening occurred in March 2008. The interviews and focus groups in the video provided an
invaluable opportunity to capture stakeholder perception of the impact of EN on their
livelihoods and triangulate information collected during previous field work.
3.5.1.5 Quantitative approach: fishermen survey In order to collect data to support the livelihood analysis, a fishermen survey was designed
and conducted (Annex 4). The survey had two main components:
1. basic data on socio-economic profile of respondents and details on fishing activity
2. questions specifically pertaining to climate variability and El Niño
The first part of the questionnaire consists of close ended questions aimed at collecting socio-
economic information such as age, birth place, educational level, income, housing
characteristics, type of fishing activity and membership to an association. This section of the
survey was designed based on a survey conducted by the Universidad Agraria La Molina
(UNALM) in Pisco in the fall of 2005 where more than 1 500 fishermen were surveyed. The
objective was to allow researchers in the University to compare the results of this thesis with
their work. Often surveys are conducted in a vacuum and it was felt important to build on the
work already undertaken. The second part of the questionnaire consisted mostly of open
ended questions to explore how El Niño affects livelihoods. First fishermen were asked which
other income generating activities they participated in and if women in their household also
engaged in such activities. Then fishermen were asked what were their target species (up to
five) in non- EN years and during EN. A series of open ended questions regarding EN and
their fishing activity followed, investigating whether respondents changed income generating
activities during EN (which ones?), how EN affected their economic activities (i.e. operational
costs, income) and if they had to change fishing zones (which ones?). Respondents were then
asked how El Niño affected their households and if they required and received help during
such events (what? from whom?). To explore the different dimensions of social capital a
specific section of the survey addressed issues such as if the respondent or a member of his
household are part of a community group, how their engagement helps their household and if
the group provided assistance during EN. Finally it is worth noting that in the second phase of

Chapter 3 Study sites and methods
81
the survey data collection a specific section on migration was added, as interviews and
workshops data revealed it to be an important aspect of livelihoods.
A pre-test of the survey occurred in January 2006 in Pisco to evaluate its effectiveness. The
survey was then conducted in February and March 2006 in Pisco, and June 2006 in Sechura.
A second phase occurred in December 2006 (Sechura) and Jaunary 2007 (Pisco). Surveys
were administrated with the help from students from local universities (Universidad Nacional
de Piura and Universidad San Luis Gonzaga, Pisco) and the author was involved in all the
survey campaigns. Students were trained and conducted pre-tests of the questionnaire in order
to ensure their understanding of the questions and their ability not to guide or cloud responses
from fishermen. At the time of the survey design, statistics provided by DIREPRO were used
in Sechura to estimate the fishermen population and gear composition. Data regarding
artisanal fishermen ranged from 4 500 to 6 000 (DIREPE 1995; DIREPRO 2005b) while
national statistics only reported 3 320 (PRODUCE 2004). Diving boat with compressors
represented nearly 40% of the fleet (DIREPRO 2005b). The difficulty to obtain reliable
statistics is an issue that plagues many developing countries and the lack of reliability of the
data was highlighted by key informants. It was thus decided to use lower-end estimate and
assume a population ranging between 3 500 and 4 000. Sample size, based on the approach by
Bunce et al (2000) was thus set at 350 fishermen. In Pisco, the recent study by the UNALM
provided valuable grounds to design the sampling strategy. Around 3 000 artisanal fishermen
were estimated to operate in the area, with nearly 40% involved in the diving fishery (Mendo
et al. 2005). In actuality, while a total of 650 surveys were conducted only 572 were selected
for this study (rejection of survey was for instance based on too many missing questions and
pre-test surveys being excluded). In Sechura 333 fishermen were surveyed while in Pisco 239.
These sample sizes, despite falling short of the target in Pisco, still represent good estimates.
The sampling design was initially based on a stratified random design. Nevertheless, in the
field, surveying depended on fishermen willingness to take part in the study and the design
can thus be re-qualified as convenience sampling rather than random. Finally, it is worth
noting that in the sampled population the high count of divers is not only due to the real
importance of this fishery in each study sites but also to sampling bias. Divers come more
frequently to the docks to unload their product while fishermen using nets and line often stay
on boats. While the research team tried to correct this issue by going at sea to survey

Chapter 3 Study sites and methods
82
fishermen on boats, the proportion of divers was still higher than expected (50% in this study
compared to estimates of 40%). Therefore, albeit the relatively big size of the sampled
population gives allowance for inference about the larger population of fishermen in both
sites, these caveats warrant the use of non-parametric statistical analysis and careful
extrapolation of the results from the surveyed sample to the larger population with the use of
triangulation.
3.5.1.6 Fieldwork limitations and ethical considerations Doing fieldwork and research in environmental and development studies raises important
ethical concerns. Ethical guidelines such as informed consent and confidentiality, the latter
when requested, were followed throughout the fieldwork. The issue of power differential
between the researcher and the researched and how this affects research outcomes from a
scientific point of view was also taken into account (Chambers 1997). Being a foreigner, an
educated individual at the post-graduate level and a woman can all pose challenges during
fieldwork, especially in a male dominated sector. Informants might mislead the researcher by
providing deceitful information that serves their own interests, involvement in certain
activities might be limited and lack of trust due to the status of ‘outsider’ hinders the exchange
of information. These challenges were mainly addressed with one strategy: building trust with
time. Indeed research was conducted over nearly two years in Peru and great care was given in
building relationships of trust and ‘learning to learn’ from fishermen. Additionally, language
barrier was not an issue and the use of interpreters not warranted, peeling away another layer
of ‘remoteness’ between the researcher and actors in the fisheries sector.
3.5.2 Research Methods - Data analysis
3.5.2.1 Data processing and initial stages of analysis Survey data was assembled into an Access database as well ws Excel spreadsheets. Attention
was given to missing data, naming of variables and coding for open-ended questions. A
codebook was created involving components such as the code, brief description, type of data
(categorical, continuous etc) and in certain cases guidelines for when to use the code to ensure
they were exclusive codes, avoiding overlapping of ‘meaning’. For multiple responses (target
species, type of impact) responses were coded then a presence (1) and absence (0) matrix was
created. Once initial data scrutiny and coding were completed, statistical analysis was
undertaken. Interviews, workshop data and focus groups were conducted in Spanish. Notes

Chapter 3 Study sites and methods
83
were manually recorded and then used to write English summaries of each respondent
answers in the case of interviews, and reports in the case of workshops and focus groups.
Recording using devices only occurred during the taping of the CENSOR documentary. Sity-
five nterviews were organized into separate files and entered into the Atlas.ti software
(Scientific Software Development, Berlin, www.atlasti.de) for coding.
3.5.2.2 Analysing qualitative data With the Atlas ti. software open and axial coding was used to analyze interview data. Open
coding involved creating inductively codes with a line-by-line revision of the summaries in
order to categorize the data (Strauss 1990). Axial coding is the next stage after open coding
where categories are linked together in order to identify causal relationships. Whereas open
coding fractures the data into categories, axial coding puts the data back together by making
connections between the categories and subcategories (Kendall 1999 p. 747). The objective is
to establish specific connections between categories and sub-categories (Figure 14).
Quotations within the thesis are used to illustrate the categories and provide support to the
interpretations of interviews.
is associated withis associated with
BureaucracyWeak Institutions
Response to EN -
Figure 14 Atlas Network View of code “Negative institutional response to El Niño”
3.5.2.3 Quantitative analysis
3.5.2.3.1 Univariate analysis Exploratory data analysis included summary statistics (quantitative variables) and frequency
tables (qualitative ones). Due to the biased identified in section 3.5.1.5 in the sampling and the
data following a highly non-normal distribution, non-parametric methods were used. All the
analyses were performed using SPSS software version 15.0 and the statistical significance
level was set at 5%. The Mann-Withney U test was used to identify differences among sites

Chapter 3 Study sites and methods
84
for numerically codified variables (i.e. presence absence of target species). The Pearson Chi-
square test was used to establish the relationship between two categorical variables (i.e. gear
type and educational level). To analyze how a categorical variable differed from its
hypothesized proportions within one population a Chi-square goodness of fit test was used
(i.e. distribution of type of gears). Finally, Spearman correlation was used to measure the
association between variables (ordinal or continuous) such as codified type of gear (1 to 9)
and income.
3.5.2.3.2 Multivariate analysis Classification tree analysis comprises a set of model-free methods for analyzing multivariate
data (Biggs et al. 1991). The classification tree procedure in SPSS creates a tree-based
classification model. Classification trees explain variation of a single response variable by one
or more explanatory variables. The response variable is categorical and the explanatory
variables can be categorical and/or numeric (De'ath and Fabricius 2000). The tree is
constructed by repeatedly splitting the data, defined by a simple rule based on a single
explanatory variable. The tree stops growing when no additional questions will improve the
ability to predict the value of the dependent variable, as measured by the selected criterion.
For instance the classification tree is used to determine if site and gear type are predictors of
formal rule compliance (holding licenses and fishing cards). Classification trees used in this
thesis were created with algorithms based on statistical significance (chi-square statistics)
(Biggs et al. 1991).
Factor analysis is a form of exploratory multivariate analysis that is used to either reduce the
number of variables in a model or to detect relationships among variables. Principal
component analysis (PCA) is designed to reduce the number of variables that need to be
considered to a small number of indices (called principal components) (Manly 2004). The
objective is to obtain two or three principal components that provide a good summary of all
the original data (Manly 2004). PCA in this work is used for instance to identify how target
species and type of fishing activity explain the total variance in one site. Cluster analysis is
another factor analysis method concerned with the identification of groups of similar objects
(Manly 2004). Hierarchical techniques such as dendogram using percent disagreement and
Ward’s method of linkage are particularly useful if the data for the dimensions included in the
analysis are categorical in nature. Cluster analysis is used to identify the distance (level of
dissimilarity) between gear groups based on target species (presence/absence data). The

Chapter 3 Study sites and methods
85
objective is to assess whether the type of fishing activity is closely associated with the type of
target species. PCA and cluster analysis together provide a mean to identify patterns and
structure in the data.
3.5.2.4 Causal loop diagrams System dynamics, firstly proposed by Forrester (1961), applies the engineering principles of
feedback and control to social systems in order to understand their behaviour over time. The
purpose of a system dynamics study is to understand the causes of a dynamic problem, and
search for policies that alleviate or eliminate them (Barlas 2002). Causal loop diagrams
articulate our understanding of the dynamic of a system (Figure 15). A causal relation
between variable (A) and (B) is represented by an arrow and means that the input variable (A)
has some causal influence on the output variable (B). A positive (+) influence means that a
change in (A), ceteris paribus, causes (B) to change in the same direction and a negative (-)
influence, ceteris paribus, means a change in an opposite direction, such as an increase in (B)
causes a decrease in (D). A feedback loop is a close circle of variables and their
interdependencies and is either positive (reinforcing) or negative (balancing). A short line
indicates that there is a delay between a change in (A) and the corresponding change in (B).
Causal loop diagrams are used to analyse the scallop fishery dynamics in Pisco and Sechura in
order to provide a conceptual model of formal institutional behaviour under ENSO conditions
in Chapter 7. The causal loop diagrams are constructed based on interviews and workshop
data.
Figure 15 Causal loop diagram

Chapter 4 Livelihood assets: what are the building blocks of livelihood security?
86
CHAPTER 4
LIVELIHOOD ASSETS: WHAT ARE THE BUIDLING BLOCKS OF LIVELIHOOD SECURITY?
4.1 Introduction Livelihood analysis provides a useful framework to move beyond the image of rural people
livelihoods solely dependent on natural resources but rather on a range of assets that enables them
to achieve livelihood security. The concept of livelihoods thus seeks to gain an understanding of
people’s strengths (assets or capital endowments) and how they endeavor to convert these into
positive livelihood outcomes (DFID 2001). Livelihood security has been defined in Chapter 2 as:
“The freedom to engage in activities that are necessary for the pursuit of sustainable livelihood outcomes. It means creating socio-ecological systems which give people the access to assets necessary for this pursuit, which provide building blocks for the maintenance of livelihoods in the face of critical and pervasive threats and situations.”
The capital assets that can be accessed by fishermen are grouped into five categories, and can be
described as the “livelihood platform” (Bond et al. 2007). These comprise human, financial,
physical, social and natural capitals (see Chapter 2). Although the term ‘capital’ is used, not all
the assets are capital stocks in the strict economic sense of the term in which capital is the product
of investment which yields a flow of benefits over time (DFID 2001). Capital assets are the basic
building blocks upon which individuals are able to undertake production, engage in labour
markets, participate in reciprocal exchanges with other individuals or households (Ellis 2000,
p31). Knowledge of fishermen livelihood platforms will provide a better understanding of how
fishermen livelihoods respond to climate variability (Chapter 6) as it has been argued that the
stronger and more varied the asset base is, the greater is people’s adaptive capacity and the level
of security of their future livelihoods (Cooper et al. 2008). Moreover assets should not be seen
through an instrumentalist lens as only a way to maintain livelihoods. As posited by Bebbington
(1999), capital assets “are not simply resources that people use in building livelihoods: there are
assets that give them the capability to be and to act” ( p. 2022). Therefore they not only provide a

Chapter 4 Livelihood assets: what are the building blocks of livelihood security?
87
mean to achieve livelihood security, they also give a meaning to these livelihoods (Bebbington
1999).
4.2 Objective and methods The objective of this chapter is to map out the different assets fishermen draw upon in building
their livelihoods in Sechura and Pisco. In conducting the analysis within this chapter, the focus is
on the characterization and identification of differences between study sites in terms of
“livelihood platforms’’. The detailed description of the methods as well as the descriptive and
multivariate statistical analysis used in this chapter can be found in Chapter 3. The sub-sections
below purport to recall the specific set of empirical data used for this chapter.
4.2.1 Workshops and interviews In order to better understand livelihood realties of fishermen and ground the thesis on peoples’
self-understandings of what are the assets on which they can draw to achieve desired livelihood
outcomes, workshops were undertaken in each study site at the onset of this research. Stakeholder
workshops were conducted in May 2005 in Pisco and Sechura, and overall 50 participants
attended these events. Stakeholders ranged from government officials, representatives from
IMARPE and fishermen organizations as well as experts from local Universities. Participants
were divided into groups and asked to identify the assets on which fishermen depend for their
livelihoods. The workshop data was supplemented by interviews and participatory observations
undertaken throughout the field work.
4.2.2 Fishermen surveys In order to collect data to support the livelihood analysis, a fishermen survey was designed and
conducted. A total of 572 fishermen were surveyed, the content of the survey paying particular
attention to the socio-economic characteristics of each respondent. The choice to administer
open-ended question in some cases was to avoid researcher bias, and thus get a better understand
of the range of factors that shaped each asset.

Chapter 4 Livelihood assets: what are the building blocks of livelihood security?
88
4.3 Understanding the asset base in Sechura and Pisco: learning from resource users The workshops were seen as a mean to generate a common understanding of livelihoods realities
that would enrich the analysis of survey data. Tables 12 and 13 present a summary of the group
exercises involving the identification of the major assets in each site.
4.3.1 Human capital Human capital represents the skills, knowledge, ability to labor and good health that together
enable people to pursue different livelihood options. Participants in both study sites noted that
formal education was insufficient. While they agreed that primary education was attained by most
fishermen in their communities, they felt that secondary education was still not accessible.
Participants also pointed out that traditional knowledge, described as fishermen experience and
“know-how”, was undervalued by authorities and should be integrated into management plans.
The incidence of decompression illness for diving fishermen was highlighted as particular health-
related problem, especially in Sechura where no decompression chamber is available in the Isla
Lobo de Tierra located at a 15-hour boat distance from the mainland. In Pisco this problem
increased during periods of high abundance of bivalve resources. Additionally, few divers are
licensed, implying that they did not undertake a dive course explaining the safety measures
regarding their activity. In discussions participants highlighted the poor service provision
heightened by the lack of health insurance available to fishermen. Finally in Sechura it was noted
that during EN events the incidence of gastric diseases increased. This will be further discussed in
Chapter 6.

Chapter 4 Livelihood assets: what are the building blocks of livelihood security?
89
Table 12 General characteristics of the asset base in Sechura based on stakeholder workshop (n=35)
Capital Assets
Main Characteristics
Human • Formal education low, fishermen traditional knowledge considered important • No health or life insurance. Lack of health professionals. Health problems: decompression illness
and injuries with fishing equipment. Gastric problems during EN events.
Social • Many formal fishermen groups (associations, guild, and trade unions) but not well organized. Presence of NGO
• Women more involved in the productive process with development of scallop aquaculture (post-
harvest) • Conflicts with fishing rights in Isla Lobo de Tierra and with temporary migrants
Physical • Private infrastructures: no housing programs. No drainpipe and sewage infrastructures. Limited water supply. Houses are subject to flooding during EN
• Fishing infrastructures: docks are in fragile state, jetties collapsing and sanded-in; vulnerable to EN.
No decompression chamber. No freezing and cold storage plant • Roads: main road to Piura in good state but access to some docks difficult. During EN 83 difficult
commercialization, in 98 more prevention work so less effect Natural • Fish resources in decline (anchovy, chub mackerel, jack mackerel, sardine). Shellfish resources
(scallops, surf clam, snail etc) abundant but on a seasonal basis • Aquaculture activities • Predominance of small farmstead but no land title Financial • Private loans mostly for stock enhancement activities, fishing activities without government
subsidies • High interest rates from private institutions (>25%). Cannot fulfill the prerequisite for collateral
(house title, possession of own boat etc.) Informal lenders, as much as 75% interest rate
• Few fishermen save and invest. Most have agreements with buyers and owners of boats

Chapter 4 Livelihood assets: what are the building blocks of livelihood security?
90
Table 13 General characteristics of the asset base in Pisco based on stakeholder workshop (n=25)
Capital Assets
Main Characteristics
Human • Most fishermen have primary education but little secondary education • Low number of licensed divers • No health or life insurance. Decompression illness is a problem for divers, especially in times of
resource abundance Social • Many formal fishermen groups (associations, guilds and trade unions) but few are active and
organized. Number of groups multiply during EN • Poor product commercialization and marketing => controlled by intermediaries • Desire to create a regional fishermen association to represent their interests • Women participation in the activity is low except for algae collection and in San Andres where they
sell catches of their husbands • There are no NGO promoting artisanal fisheries Physical • Freezing and cold storage plant and one decompression chamber • New post-harvest processing plants • Fishing infrastructures: ±600 boats registered but diving and drag net fleet "boliche" highly mobile
Natural • High biodiversity, Paracas National Reserve • Fish fluctuate more than shellfish resources (i.e. Silverside species) and increased fishing effort • New and potential resources to develop: sea cucumber, algae, seahorse • Pollution a threat to resources. Households in-equitable access to potable water Financial • Access to credit limited, only government institutions
• Need for private investment (aquaculture, marketing of products) • No safety nets from the government when losses occur

Chapter 4 Livelihood assets: what are the building blocks of livelihood security?
91
4.3.2 Social capital Social capital was described to participants as social networks, presence of formal organizations
and mechanisms in place to participate in the decision-making process. In both sites participants
felt that while fishermen groups were present, they lacked organization and did not voice their
concerns. In Pisco they repeatedly expressed that intermediaries in the fisheries sector and the
disorganization of fishermen was an impediment to obtaining good prices for their products. The
development of new activities in both sites provided the impulse to increase the level of
organization as well as the involvement of women. In Sechura the development of aquaculture
activities resulted in the burgeoning of fishermen groups, albeit in a hap-hazard manner, and an
increase in the engagement of women in the post-harvesting sector. In Pisco women involvement
in the commercialization of fishing products and the extraction of algae were also portrayed as
increasing trends. Women in both sites were deemed generally well organized through women
clubs and communal kitchens. The influx of migrants and conflicts over access to resources were
also highlighted as problems eroding the cohesion of fishermen. In Pisco the desire to form a
regional organization to defend the interest of local fishermen and their access rights was
expressed. Finally, outside intervention through NGOs and the private sector were perceived as
an essential building block to reinforce social capital. In Pisco the installation of the gas pipeline
increased the funding for community projects through the company PlusPetrol but participants
felt that an NGO specifically promoting the fishery sector and protecting fishermen rights was
needed. In Sechura the presence of an NGO is currently playing an important role in the socio-
economic development of the bay. This highlights the positive role extra-community
organizations can play in building social capital in both study sites.
4.3.3 Financial capital Financial capital was put forward as the ability to save and access credits and loans. Participants
in both sites felt that banking institutions and other formal lending bodies were not responsive to
their needs and the provision of comprehensive financial services was incomplete. Most
fishermen do not have a house or land title, nor possess a boat that would allow them to fulfil the
collateral requests made by formal institutions, which combined with high interests rates result in
barriers to access micro-finance products. It was highlighted that micro-finance products in the

Chapter 4 Livelihood assets: what are the building blocks of livelihood security?
92
private sector were mostly geared towards aquaculture activities, ignoring the diversity of fishing
activities and subsequent needs of fishermen. Finally, it was observed that fishermen themselves
lacked saving habits which decreased their ability to invest further in productive activities inside
or/and outside the fishing sector. A high reliance on the informal sector as well as on boats
owners, intermediaries and processing plans in terms of safety nets and providers of loans was
put forward by participants.
4.3.4 Physical capital Physical capital was described to participants as the basic infrastructures and producer goods
needed to support livelihoods. The most striking difference between sites were the complaints
expressed by participants in Sechura in terms of inadequate housing conditions, the absence of
government housing programs and water and sanitation infrastructures. Additionally, dwellings
were deemed extremely vulnerable to EN events. In both sites the lack of adequate potable water
supply was perceived as a problem. In terms of fishing infrastructures Sechura appeared to be less
well endowed than Pisco. It was mentioned that the dire state of fishing docks were a risk during
flooding events and the lack of a decompression chamber posed a great occupational health risk.
The absence of freezing and cold storage plants accessible to artisanal fishermen was also
mentioned in Sechura.
4.3.5 Natural capital Natural capital was put forward to participants as the wide range of natural resources on which
fishermen can draw to sustain their livelihoods. Small scale and subsistence agriculture were
identified as an important natural capital in Sechura. In Pisco participants were proud to have the
Paracas National Reserve in their region and acknowledged the high biodiversity of the area.
However they mentioned that fishing effort increased in the last few years, mainly due to increase
in fleet size and capacity. A similar assessment was put forward in Sechura, especially for small
pelagic species. In both workshops while the high diversity of resources was pinpointed, their
fluctuating nature was presented as a key characteristic. Finally new target species in Pisco and
the development of aquaculture in Sechura was seen as a reflection of the high potential of the
zones in terms of aquatic resources.

Chapter 4 Livelihood assets: what are the building blocks of livelihood security?
93
4.4 Fishermen capital assets
The findings of the previous section were instrumental in obtaining an insight about the asset base
on which fishermen in Sechura and Pisco rely to achieve livelihood outcomes. However, they did
not generate detailed information on these assets. Drawing extensively from survey data, the
following sections decipher the five capitals assets of the livelihood platform.But, before
describing each capital individually, general characteristics of the sampled population in terms of
fishing gear and some demographic traits are presented.
4.4.1 Typology of fishermen and demographic characteristics Fishermen were categorized into groups with reference to the gear they used. In the sampled
populations, as shown in Table 14, divers and purse-seiners are the most important groups
(respectively 55,9% and 16,0 %), followed by gill and drift net users (13,5%) and hook and lines
users (5,1%). The distribution of the type of gear differs across the two study sites (X2 =15,91
d.f.=8,00, p<0,05). Pisco has no trawlers and a lower proportion of purse seiners (13,9%
compared to 17,5%) as well as a lower proportion of hook and line gear (2,9% compared to
6,6%). Difference in type of gear is dependent on the type of resources in the study area and will
be further explored in the section on natural capital asset. The survey data also revealed that few
fishermen reported using different types of gear: in Sechura 6,9% of fishermen reported to use
more than one fishing gear while this proportion is 7,6% in Pisco.
Basic demographic characteristics of the sampled populations are presented in Table 14.
Migration status can be defined in a variety of ways. In this case migrants are fishermen born
outside the province of the study area (province of Pisco and province of Sechura). Additionally a
differentiation is made between migrants from the regions of Ica and Piura, where the study sites
are located, and other regions of Peru (Table 14).

Chapter 4 Livelihood assets: what are the building blocks of livelihood security?
94
Table 14 Fishing gear and demographic characteristics across survey sites of sampled population (N=572). Percentage and mean of valid answers.
Sechura Pisco All Sites (n=333) (n=239) (N=572)Fishing Geara Beach Fishermen 0,6 3,4 1,8Diver 55,9 55,9 55,9Gill and Drift net 11,5 16,4 13,5Hook and Lines 6,6 2,9 5,1Purse Seine 17,5 13,9 16,0Trawling 0,9 0,0 0,5Diver and other 3,6 4,6 4,0Gill and Drift net and other 1,5 1,3 1,4Purse Seine and other 1,8 1,7 1,8Multi Gearb 6,9 7,6 7,2Civil Statusa Divorced 0,6 0,8 0,7Live in Partner 31,5 33,1 32,2Married 36,3 46,4 40,6Sinlge 28,5 18,0 24,1Widowed 3,0 1,7 2,4Agec 34,3 (± 12,3) 41,9 (± 13,1) 37,5 (± 13,2) Number of Childrenc 2,4 (± 2,4) 3,0 (± 2,9) 2,7 (± 2,6) Migration Birth Placea Inside Province of Sechura 58,0 0,0 33,9Inside Region of Piura 16,9 0,0 9,9Inside Region of Ica 2,1 5,5 3,5Inside Province of Pisco 1,8 83,0 35,5Others 21,1 11,5 17,1Residency Timec 14,7 (±12,7 ) 16,9 (±13,8 ) 15,6 (±13,2 )
a. Percentage of valid answers
b. Multi Gear: total of variables Diver and other Gill, Drift net and other , Purse Seine and other
c. Mean
In Pisco fishermen are primarily born in the study area (83%) whereas in Sechura only 58% are
born within the Province, the total number of immigrants representing 42% of the surveyed
population (Figure 16). Immigrants in Sechura come primarily from within the Piura region, from
cities located in the hinterland where agriculture is the main occupation, and from other regions
of Peru, mainly the center and south of the country (Chiclayo, Lambayeque, Lima and Pisco). In

Chapter 4 Livelihood assets: what are the building blocks of livelihood security?
95
Pisco immigrants come primarily from outside the region of Ica, mainly from the center of the
country (Callao, Chimbote, Lima) and the Andes (Puno).
0
5
10
15
20
25
30
35
40
45
Migrants Migrants from withinthe Region
Migrants from outsidethe Region
Perc
enta
ge
SechuraPisco
Figure 16 Migrants distribution across survey sites. Percentages
While Sechura has more immigrants, no significant differences where observed in terms of years
of residency between sites (Z=-0,963, p>0,05). When performing a Pearson chi-square test to
assess the independence of the variables site and civil status, a significant statistical difference is
observed (X2=11,12 d.f.=4,00 p<0,05). Survey data show data a higher proportion of fishermen
surveyed are married or living with a partner in Pisco than in Sechura (79,5% compared to
67,9%), which is expected since younger adults would have a higher probability to be single.
4.4.2 Human capital Fishermen educational level and whether they have received capacity building courses related to
their activity is used as a proxy to assess formal knowledge. Four different education categories
are used to define educational level: 1) primary school, 2) secondary school, 3) technical and 4)
university level. To assess more informal type of knowledge based on experience at sea, age and
years fishing are used as a proxy. Finally, the propensity to incur injuries is used as proxy of
occupational risk to illustrate the health dimension of human capital. In both sites, as shown in
Tables 15, the majority of respondents possess a formal education until the secondary level while
the overall completion rate is 58,7%. A difference is observed between sites in terms of level of
studies achieved (X2 =27,50 d.f.48,00, p<0,05) and if respondents received any capacity building
course (X2 =6,63 d.f.=1,00, p<0,05). Secondary level education is more widespread in Pisco than

Chapter 4 Livelihood assets: what are the building blocks of livelihood security?
96
in Sechura, and has a higher completion rate in the former (Table 16). Similarly, post-secondary
education is more prevalent in Pisco. When desegregating survey results by type of fishing
activity, in Sechura a significant difference between gear category in terms of the level of study
is observed (X2 74,27= d.f.=32,00, p<0,05) while in Pisco no significant difference is observed
(p>0,05).
Table 15 Formal knowledge across sites. Percentages of valid answers.
Sechura Pisco All Sites (N=333) (N=239) (N=572) Level of Education Primary School 50,5 29,1 41,6 Secondary School 43,2 61,5 50,8 Technical 4,3 5,1 4,6 University 1,2 3,4 2,1 None 0,9 0,9 0,9 Completed Studies 59,8 57,0 58,7 Capacity Building 50,6 39,5 46,1
Table 16 Completion of studies by educational level across sites. Percentage of valid answers.
Sechura Pisco Total (n=325) (n=229) (n=554)
Primary School 56,9 25,4 44,3 Secondary School 40 65,4 50,2 Technical 2,6 6,9 4,3 University 0,5 2,3 1,2
Using the classification tree method, with level of study as dependant variable and type of gear as
an independent one, two gear groups are identified in Sechura: divers and other types of gear.
The diver group is a significant predictor of secondary level education while the other types of
gear are a significant predictor of primary education. This means that divers possess a higher
propensity to have secondary education than other groups in Sechura. In terms of capacity
building survey data from Pisco reveal that fishermen received less capacity building than in
Sechura (Table 4.4). When desegregating survey results by type of fishing activity, in Sechura a
significant difference between gear category in terms of capacity building is observed (X2 21,00=
d.f.=8,00, p<0,05). As for level of education, no significant difference is observed (p>0,05) in
Pisco. The classification tree method, using capacity building as the dependent variable, revealed

Chapter 4 Livelihood assets: what are the building blocks of livelihood security?
97
two groups in Sechura: divers, trawlers and multi-gear purse-seiners also using other gears, and in
a second group the rest of the gear categories. The first group is a significant predictor of having
received capacity building. In a close ended question fishermen were asked what kind of capacity
building they received. Responses included fishing (i.e. diving, safety at sea) with 46,2%,
aquaculture with 22,2% and environmental awareness with 16,2%. Figure 17 presents the break
down of type of capacity building received by sites. It is worth noting that capacity building in
aquaculture and fishing are more mentioned in Sechura while environmental education and
leadership courses (management, organizational) had higher incidences in responses in Pisco.
Informal fishermen knowledge was significantly different between sites (p<0,05), with Sechura
being characterized by a younger population with less experience at sea (Table 17). When asked
if they incurred injuries during their fishing activities, 18,5% responded yes with no major
difference between sites.
Sechura n=162
28%
3%
10%51%
3% 3%2%
Pisco n=77
11%
3%
29%
38%
4%
6%
9%
AQUA
COM
ENVT
FISH_
MNGT
ORG
OTH
Figure 17 Type of capacity building received. Percentage of valid answers.
Table 17 Age and years of fishing and incidence of injuries across sites. Mean and percentage of valid answers.
Sechura Pisco All Sites Z score P N=333 N=239 N=572 Informal Knowledgea Age 34,3 (± 12,3) 41,9 (± 13,1) 37,5 (± 13,2) -7,026 0,000 Years Fishing 16,7 (± 13,1) 23,8 (± 13,2) 19,6 (± 13,6) -6,838 0,000 Health Riskb Injuries 19,3 17,2 18,5 0,584
a. Mean. Mann Withney Test (2-tailed) b. Percentage. Pearson Chi-square

Chapter 4 Livelihood assets: what are the building blocks of livelihood security?
98
4.4.3 Financial capital Whether fishermen have obtained a credit and have a life or social insurance is used as proxy to
understand the dimension of financial capital. Only 15% of fishermen responded they had
received a credit while 8,9% and 6,9% possessed social insurance and life insurance respectively
(Figure 18). Tests of statistical significance revealed a difference between sites in terms life
insurance (X2 =13,16 d.f.1,00, p<0,05) while no difference where observed for the other two
variables (p>0,05). Additionally, distribution of variables by type of gear revealed no differences
in both sites. It is worth noting that these variables reflect formal safety nets and forms of
borrowing. There is much informal borrowing and forms of saving for difficult times in rural
communities, for instance through neighborhood credit groups (“junta vecinal”) or fishermen
association providing assistance in case of death or diseases.
0
5
10
15
20
Social_Ins Life_Ins Credit
Perc
enta
ge Sechura
Pisco
All Sites
Figure 18 Distribution across site of possession of social and health insurance and credit. Percentage of valid answers.
4.4.4 Social capital Formal rule compliance (adherence to the law) is measured with the question “What type of
document do you hold ?”. In Peru fishermen by law have to be registered with the navy, and
possess an identification document, whether a fishing or diving license, crew identification card
or armador license. Membership to formal fishermen organizations is used as a measure of
fishermen ability to create networks and trust each other. Membership to community groups,
ranging from religious to credit groups, is used as a measure of network and reciprocity at the
community level which may provide the basis for informal safety nets among fishermen
households.

Chapter 4 Livelihood assets: what are the building blocks of livelihood security?
99
Overall 77,6% of fishermen hold an identification document (Table 18) with a higher propensity
in Pisco (89,3% compared to 68,3%). A significant difference was observed between sites in
terms of the type of document respondents held (X2 =96,72 d.f.8,00, p<0,05). Based on the
classification tree method, with type of document as a dependent variable and type of gear as
dependent one, this difference can be attributed to the high number of fishermen not holding any
identification in Sechura (31,7%) and possessing a fishing card in Pisco (57,1%). When
desegregating the results by gear type a significant difference is observed in Sechura (X2 85,19=
d.f.=56,00, p<0,05) and Pisco (X2 102,43= d.f.=48,00, p<0,05) with two groups being identified:
divers and other types of gear. In Pisco, the diver group is a significant predictor of what type of
document a fisherman holds with only 33,4% of divers possessing a fishing license while 80,4%
of fishermen in other groups possessed one. It is worth noting that 33,9% of divers possess a
diving license which implies that overall 67,3% have an identification document, a value still
lower than for other gear groups. In Sechura, the diver group is also a significant predictor of
what type of document a fisherman holds with 36,2% of divers not holding any type of
documents. Additionally, more fishermen in other gear groups hold a fishing license (31,1%
compared to 18,1% for divers). As in Sechura, divers also posses diving licenses but with a lower
propensity than in Pisco (22,1%). These results reveal that informality is greater in Sechura than
in Pisco, with the diving group being the most informal one in both sites.
Overall 52,6% of fishermen are member of a fishing organization and membership to is unequally
distributed across sites with 41,7% in Sechura and 52,6% in Pisco (X2=9,70 d.f.=1,00, p<0,05).
When desegregating these results by gear type with the classification tree method no significant
differences were found in both sites (p>0,05). The results show that while fishermen are more
formally organized in Pisco than in Sechura, the type of fishing activity in both sites is not a good
predictor for membership to associations. Fishermen were then asked through an open ended
question if they or a family member belonged to a community group in order to broaden the
notion of social capital beyond formal fishing groups. Overall 60,9% of respondents mentioned
that at least one member of their household belong to a community group with no significant
difference across sites (p>0,05). When asked what type of group they belonged to in an open
ended question, respondents reiterated adherence to fishing groups (44,5%) and mentioned
religious groups (43,2%), mainly evangelic. In Sechura households are more involved in religious

Chapter 4 Livelihood assets: what are the building blocks of livelihood security?
100
groups than in Pisco (Figure 19). Other difference among sites are expressed with a higher
involvement in Pisco in credit groups, political groups and football teams, while women
involvement in the group “vaso de leche”, a government led organization dealing with food
security, was only mentioned in Sechura.
Table 18 Measure of social capital across sites. Percentage of valid answers.
Sechura Pisco All Sites P Valuea N=323 N=234 N=557 Type of document 0,000 Fishing card 24,2 57,1 38,8 Armador card 1,1 0,4 0,8 Fishing and crew card 13,5 8,0 11,1 Fishing, crew and diving card
0,0 0,9 0,4
Fishing and diving card 2,5 0,9 1,8 Crew card 14,6 1,8 8,9 None 31,7 10,7 22,4 Diving card 12,5 19,2 15,4 Diving and crew 0,0 0,9 0,4 Fishermen Organization 0,002 Yes 47,1 60,6 52,6 Group Membership 0,548 Yes 61,9 59,4 60,9
a. Pearson Chi-square
0
10
20
30
40
50
60
CREDIT FISHING FUTBOL OTHER POLI_ REL_ VASO_L
Perc
enta
ge SechuraPiscoAll Sites
Figure 19 Distribution of type of groups across sites. Percentage of valid multiple responses (n=339).

Chapter 4 Livelihood assets: what are the building blocks of livelihood security?
101
In another open ended question fishermen were asked how the involvement of household
members in these groups helped their families (Figure 20). Some respondents expressed that their
membership did not provide any help (24%), with a high level of dissatisfaction in Pisco (39,3%).
In Sechura and Pisco respectively spiritual help involving greater family and community
cohesion (48,9% and 14,9%), provision of food (6,3% and 17%), economic assistance (5,8% and
7,4%) and credits (2,6% and 5,2%) were the most mentioned categories.
0
10
20
30
40
50
60
CAP_ORG
CREDIT
DIS_ACC
ECO
FISHING
FOOD/C
FUNERALS
LOBBYIN
GMAR_
NO HELP
OTHER
SPIRIT_
Per
cent
age Sechura
PiscoAll Sites
Figure 20 Distribution of type of help received across sites. Percentage of valid multiple responses (n=299)
4.4.5 Physical capital Fishermen physical capital includes their productive assets such as boats and other form of
property (land, rented house etc.) and household assets. Household assets include liquid assets
(cellular, refrigerator, car etc.) and housing characteristics (for instance type of household
material). Additionally physical capital includes access to utilities and service infrastructures such
as electricity and water. First difference between sites will be identified in this section, followed
by an exploration of the variance within the data taking into account the type of fishing activity
(gear). All the components of physical capital are presented in Table 19 with their respective
mean and standard deviation. Differences among sites were tested with the Mann-Whitney test U
(2-tailed), Z and P value being also available in Table 19.

Chapter 4 Livelihood assets: what are the building blocks of livelihood security?
102
Table 19 Physical capital variables across sites. Shaded areas with P values<0,05
Sechura Pisco All Sites Z score c P Values
Mean Std. Deviation Mean
Std. Deviation Mean Std. Deviation
Productive Assets a OWN_VES 0,06 0,23 0,05 0,22 0,06 0,23 -0,297 0,767 OTHER_IM_C 0,15 0,36 0,14 0,34 0,14 0,35 -0,514 0,607 Service Infrastructure a WATER_SU 0,88 0,33 0,97 0,16 0,92 0,27 -4,206 0,000 SEWAG_FA 0,33 0,47 0,90 0,31 0,56 0,50 -13,503 0,000 ELEC 0,78 0,41 0,94 0,24 0,85 0,36 -5,198 0,000 House ownership b 1,14 0,35 1,19 0,39 1,16 0,37 -1,516 0,129 Housing Characteristics a NBR_ROOM 2,36 1,10 3,00 1,43 2,62 1,29 -5,588 0,000 ADOBE 0,00 0,00 0,16 0,36 0,06 0,24 -7,330 0,000 BRICK 0,80 0,40 0,84 0,37 0,81 0,39 -1,294 0,196 QUIN 0,07 0,25 0,00 0,00 0,04 0,20 -3,986 0,000 RUSH_M 0,14 0,34 0,00 0,07 0,08 0,27 -5,513 0,000 Liquid Assets a TEL 0,14 0,35 0,20 0,40 0,17 0,37 -1,663 0,096 CABLE 0,21 0,41 0,05 0,22 0,14 0,35 -5,381 0,000 CEL 0,59 0,49 0,13 0,34 0,40 0,49 -11,118 0,000 INTER 0,01 0,08 0,01 0,09 0,01 0,08 -0,334 0,738 WASH_M 0,07 0,25 0,06 0,24 0,06 0,25 -0,168 0,867 COMP 0,02 0,15 0,03 0,16 0,02 0,15 -0,077 0,939 REFRI 0,25 0,43 0,46 0,50 0,34 0,47 -5,317 0,000 CAR 0,02 0,12 0,03 0,16 0,02 0,14 -0,861 0,389
a. Binary variables (1=presence; 0=absence), mean can be read as percentages b. Binary variable (1=owner; 2=renting); mean not read as percentage c. Computed using Mann Whitney U test 2-tailed

Chapter 4 Livelihood assets: what are the building blocks of livelihood security?
103
In terms of productive assets a majority of fishermen surveyed in both sites do not own their
boats (94%). Some respondents (14%) hold other types of property (14%), from interview data
these ranging from small land holdings to other small dwellings. The distribution of liquid assets
cable, cellular and refrigerator differ significantly across sites (p<0.01). In Sechura 21% and 59%
of fishermen possessed a cellular and access to cable while in Pisco this proportion was only 5%
and 13%. However, 46% of respondents in Pisco had a refrigerator comparatively to only 25% in
Sechura. Another significant difference (p<0.01) was observed in term of household
characteristics. Fishermen in Sechura reported that their houses were made of quincha (7%) and
rush-mat (14%) while in Pisco such material was not present. Quincha is a traditional
construction system that uses mainly wood and cane or giant reed, forming a framework covered
in mud and plaster. Both quincha and rush-mat are inexpensive construction characteristics of
low income dweelings. Additionally the mean number of rooms per dwelling was lower in
Sechura (2,36, ±1,10) than in Pisco (3,00, ±1,43). Access to service infrastructure also shows a
significant difference among sites (p<0.01) whith Pisco having overall greater access to facilities
such as electricity, water and sewage. The proportion of the latter was highly different between
Sechura (33%) and Pisco (90%).
To explore the variance within the data taking into account the type of fishing activity (gear) in
each site principal component analysis is used. In Sechura three components were extracted,
accounting for 49,98%, 19,07% and 5,50%, respectively, of the total variance, and between them
account for 74,55% of the variance. Based on factor scores (Table 20), the first component
consisted mainly of variables related to service provision and liquid assets (highest loadings)
while in the second component the variable with the highest loading was the type of fishing
activity (Figure 21A). The third component consisted of the size of the houses (number of rooms)
and was not graphically represented since it explained only 5,50% of the variance.

Chapter 4 Livelihood assets: what are the building blocks of livelihood security?
104
Table 20 Physical capital and type of fishing activity: Component loadings
Sechura Pisco Component (% of variance) C1 (49,98) C2 (19,07) C3 (5,50) C1 (45,20) C2 (32,46) Fishing Gear 0,482 -0,800 0,357 -0,085 0,996 Productive Assets OWN_VES 0,159 0,196 -0,142 0,008 0,054 OTHER_IM_C 0,176 0,020 0,114 0,155 -0,045 Service Infrastructure WATER_SU 0,310 0,129 0,077 0,145 0,080 SEWAG_FA 0,585 0,277 -0,050 0,196 0,125 ELEC 0,544 0,250 -0,057 0,134 0,119 House Ownership 0,081 0,097 -0,358 -0,204 -0,112 Housing characteristics NBR_ROOM 0,241 0,491 0,836 0,973 0,225 ADOBE - - - -0,109 0,031 BRICK 0,357 -0,085 0,026 0,105 -0,020 QUIN -0,188 0,150 -0,012 RUSH_M -0,272 -0,014 -0,021 0,007 -0,047 Liquid Assets TEL 0,346 0,317 -0,037 0,063 0,203 CABLE 0,477 0,358 -0,113 0,222 0,149 CEL 0,435 0,305 -0,121 0,175 0,063 INTER 0,229 0,064 -0,037 0,107 0,085 WASH_M 0,077 0,212 0,012 0,137 0,010 COMP 0,036 0,098 0,013 0,115 -0,003 REFRI 0,542 0,211 -0,025 0,228 0,067 CAR 0,030 0,146 0,015 0,204 0,046
Extraction Method: Principal Component Analysis. Rotation Method: Varimax with Kaiser Normalization. Empty
cells: variable had zero variance
In Pisco two components were extracted, accounting for 45,20% and 32,46%, respectively, of the
total variance, and between them account for 77,66% of the variance. Based on factor scores
(Table 20), the first component mainly consisted of the variable number of rooms and house
ownership while the second component was related to the type of fishing activity (Figure 21B). If
focusing initially on the first components, these results can be interpreted in the following
manner: service provision and house size in Sechura explain the variance in the data set while in
Pisco house ownership and dwelling size explains the variance. When looking at the second
components, the type of fishing activity explains the variance in the data set in both sites.
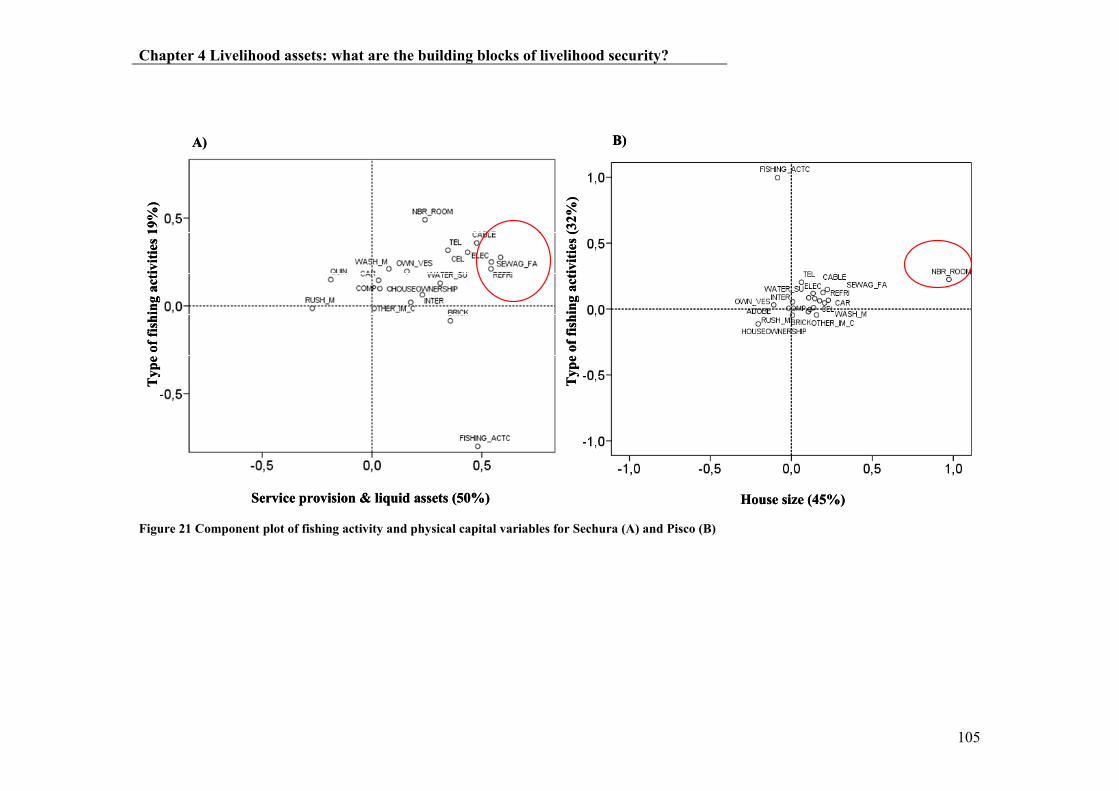
Chapter 4 Livelihood assets: what are the building blocks of livelihood security?
105
Service provision & liquid assets (50%)
Typ
e of
fish
ing
activ
ities
19%
)A)
House size (45%)
Typ
e of
fish
ing
activ
ities
(32%
)
B)
Service provision & liquid assets (50%)
Typ
e of
fish
ing
activ
ities
19%
)A)
House size (45%)
Typ
e of
fish
ing
activ
ities
(32%
)
B)
Figure 21 Component plot of fishing activity and physical capital variables for Sechura (A) and Pisco (B)

Chapter 4 Livelihood assets: what are the building blocks of livelihood security?
106
4.4.6 Natural Capital Natural capital is the term used for the natural resource stocks from which resource flows and
services useful for livelihoods are derived. Here the focus is on aquatic resources fishermen rely
on for their livelihoods. In an open ended question fishermen were asked what their main target
species were. A total of 44 species were reported by fishermen and answers, after presence-
absence codification, were divided into fish and invertebrate species and descriptive statistics are
presented in Tables 21 and 22. The most mentioned littoral fish species were seabass (17%),
blenny fish (6%) and cabinza grunt (4%). For pelagic fish species, anchovy (7%), chub mackerel
(7%), mullet (6%), smoothhound (4%), jack mackerel (3%) and bonito (3%) were the most
important target species. In terms of invertebrates captured by diving scallop (39%), octopus
(25%) and snails (23%) were mentioned as target species. In Sechura, squid (11%), giant squid
(7%) and shrimp (6%) were also mentioned as important target species while in Pisco they were
not reported. This is consistent with the northern geographical distribution of these warm water
species. Significant differences (p<0,05) across sites are only observed for invertebrates species
associated with the diving fishery (Table 22). Clam, octopus, scallop and surf clam species are
consistently more reported in Sechura than in Pisco, with scallops presenting the highest
difference (46% versus 19%), highlighting the importance of these species for the diving fishery
in Sechura (Figure 22).
Figure 22 Scallop divers in Sechura Bay. Photo M-C Badjeck

Chapter 4 Livelihood assets: what are the building blocks of livelihood security?
107
Table 21 Target species across sites, means of valid multiple responses. Shaded areas with P values<0,05 (Table continues next page).
Sechura Pisco Total Z scoreb P value (n= 248) (n=94) (n=342) Speciesa Mean Std.
Deviation Mean Std.
DeviationMean Std.
Deviation
Scientific Name Littoral Fish Labrisomus sp. Blenny fish 0,03 0,18 0,12 0,32 0,06 0,23 -0,832 0,406 Acanthistius pictus Brick seabass 0,02 0,13 0,00 0,00 0,01 0,11 -1,243 0,214 Isacia conceptionis Cabinza grunt 0,02 0,15 0,07 0,26 0,04 0,19 -1,381 0,167 Seriolella sp. Choicy ruff 0,00 0,06 0,01 0,10 0,01 0,08 -0,789 0,430 Anisotremus scapularis Grunt- Peruvian 0,02 0,13 0,01 0,10 0,01 0,12 -1,253 0,210 Rhinobatos planiceps Guitarfish-Pacific 0,01 0,11 0,03 0,18 0,02 0,13 -0,407 0,684 Menticirrhus sp. Kingcroaker 0,00 0,00 0,04 0,20 0,01 0,11 -0,062 0,950 Sciaena deliciosa Lorna drum 0,00 0,00 0,04 0,20 0,01 0,11 -0,062 0,950 Stellifer minor Minor Stardrum 0,00 0,06 0,02 0,15 0,01 0,09 -0,394 0,693 Citharichthys sp. Pacific sanddab 0,02 0,14 0,05 0,23 0,03 0,17 -0,278 0,781 Paralonchurus peruanus Peruvian banded croaker 0,08 0,27 0,00 0,00 0,06 0,23 -0,832 0,406 Trachinotus paitensis Pompano 0,02 0,15 0,00 0,00 0,02 0,13 -0,560 0,575 Myliobatis sp. Ray 0,02 0,13 0,03 0,18 0,02 0,14 -0,307 0,759 Paralabrax sp. Seabass-Peruvian 0,19 0,39 0,12 0,32 0,17 0,38 -0,926 0,354 Epinephelus sp. Snowy grouper 0,03 0,17 0,00 0,00 0,02 0,14 -0,307 0,759 Prionotus sp. Volador 0,00 0,00 0,02 0,15 0,01 0,08 -0,789 0,430 Engraulis ringens Anchovy 0,06 0,24 0,09 0,28 0,07 0,25 -1,748 0,080 Sarda chiliensis chiliensis Bonito-Eastern Pacific 0,01 0,09 0,07 0,26 0,03 0,16 -1,691 0,091 Cynoscion analis Weakfish-Peruvian 0,08 0,28 0,00 0,00 0,06 0,24 -0,543 0,587
a. Binary variables (1=presence; 0=absence), mean can be read as percentages b. Computed using Mann Whitney U test 2-tailed

Chapter 4 Livelihood assets: what are the building blocks of livelihood security?
108
Table 22 Target species across sites, means of valid responses, Shaded areas with P values<0,05 continued from Table 21.
Sechura Pisco Total Z scoreb P value Speciesa (n= 248) (n=94) (n=342)
Scientific Name
Mean Std. Deviation Mean
Std. Deviation Mean
Std. Deviation
Pelagic Fish Coryphaena hippurus Perico, dolphinfish 0,00 0,06 0,03 0,18 0,01 0,11 -1,119 0,263 Scomber japonicus Chub mackerel 0,08 0,28 0,04 0,20 0,07 0,26 -1,425 0,154 Cilus Gilberti Corvina 0,00 0,00 0,01 0,10 0,00 0,05 -0,557 0,577 Not Specified Fish 0,02 0,14 0,02 0,15 0,02 0,14 -1,487 0,137 Trachurus picturatus murphyi Jack mackarel 0,02 0,14 0,06 0,25 0,03 0,18 -1,156 0,248 Mugil cephalus Mullet 0,05 0,22 0,07 0,26 0,06 0,23 -0,277 0,782 Sardinops sagax sagax Sardine 0,00 0,06 0,00 0,00 0,00 0,05 -0,616 0,538 Scomberomorus sierra Sierra 0,00 0,06 0,00 0,00 0,00 0,05 -0,616 0,538 Odontesthes regia regia Silverside 0,00 0,06 0,04 0,20 0,01 0,12 -1,253 0,210 Mustelus sp.,Triakis sp. Smoothhound 0,05 0,22 0,01 0,10 0,04 0,19 -0,612 0,541
Invertebrates Diving Fishery
Concholepas concholepas) Abalone 0,00 0,00 0,07 0,26 0,02 0,14 -1,487 0,137 Gari solida Clam 0,09 0,28 0,03 0,18 0,07 0,26 -3,942 0,000 Cancer sp. Crab 0,00 0,00 0,19 0,40 0,05 0,22 -1,856 0,063 Aulacomya ater Mussel 0,00 0,00 0,18 0,39 0,05 0,22 -1,768 0,077 Octopus mimus Octopus 0,29 0,45 0,16 0,37 0,25 0,44 -4,198 0,000 Tagelus dombeii Razor clams 0,00 0,00 0,05 0,23 0,01 0,12 -1,253 0,210 Argopecten purpuratus Scallop 0,46 0,50 0,19 0,40 0,39 0,49 -5,932 0,000 Not specified Shellfish 0,00 0,00 0,01 0,10 0,00 0,05 -0,557 0,577 Stramonita sp. Snails 0,21 0,40 0,30 0,46 0,23 0,42 -0,690 0,490 Mesodesma donacium Surf clam 0,10 0,31 0,00 0,00 0,08 0,27 -2,320 0,020
Invertebrates Nets and Lines
Dosidicus gigas Giant squid 0,06 0,24 0,00 0,00 0,04 0,21 -0,963 0,336 Panulirus gracilis Lobster 0,00 0,06 0,00 0,00 0,00 0,05 -0,616 0,538 Xiphopenaeus sp. Prawn 0,01 0,09 0,00 0,00 0,01 0,08 -0,789 0,430 Not speficified Shrimp 0,07 0,25 0,00 0,00 0,05 0,22 -1,768 0,077 Loligo gahi Squid 0,11 0,31 0,00 0,00 0,08 0,27 -1,128 0,259

Chapter 4 Livelihood assets: what are the building blocks of livelihood security?
109
To explore the variance within the data taking into account the type of fishing activity (gear) in
each site a principal component analysis was undertaken. In Sechura three components were
extracted, accounting for 66,03%, 6,60% and 3,61%, respectively, of the total variance, and
between them account for 76,24% of the variance. Based on factor scores (Tables 4.12 and 4.13),
the first component consisted of items related to fishing activity, followed by seabass and
invertebrates species scallop, octopus, snails and squid. Of particular note, the fishing activity
variable correlated relatively strongly with the first component (-0,661). This implies that type of
gear is one of the most important variables explaining the variance in the data. The second
component was related to diving fishery invertebrates and littoral fishes, with invertebrates
having the highest loadings. Components one and two are graphically represented in Figure 23A.
The third component is not graphically represented (explaining only 3,6% the variance) and the
items with highest loadings were type of fishing activity and the specie Peruvian seabass.
In Pisco three components were extracted, accounting for 67,38%, 4,9% and 3,77% respectively,
of the total variance, and between them account for 76,05% of the variance. Based on factor
scores (Tables 23 and 24), the first component mainly consisted of invertebrate species related to
the diving fishery, with the highest loading being snails, octopus, crabs and scallops. The second
component again included invertebrate species related to the diving fishery as well as Peruvian
seabass. Components one and two are graphically represented in Figure 23B. The third
component is not graphically represented (explaining only 3,77% the variance) and the items with
highest loadings were type of fishing activity and pelagic species (anchovy and dolphinfish). One
of the main outputs of these results is that in Pisco fishing activity does not explain the variability
within the data and while invertebrate species explain part of the variance, in Sechura littoral
species play particular role.

Chapter 4 Livelihood assets: what are the building blocks of livelihood security?
110
Table 23 Target species and type of fishing activity: Component loadings
Sechura Pisco Component (% of variance) C1 (66,03) C2 (6,60) C3 (3,61) C1 (67,38) C2 (4,9) C3 (3,77)
Fishing Activity -0,661 -0,113 0,742 0,252 0,196 0,947Scientific Name Littoral Fish Labrisomus sp. Blenny fish 0,242 -0,088 0,040 0,024 0,457 -0,369Acanthistius pictus Brick seabass 0,186 -0,075 0,052Isacia conceptionis Cabinza grunt 0,109 0,121 0,239 0,259 0,151 -0,001Seriolella sp. Choicy ruff 0,052 0,100 0,094Anisotremus scapularis Grunt- Peruvian 0,009 0,156 0,001 0,154 0,059 -0,222Rhinobatos planiceps Guitarfish-Pacific -0,115 0,035 -0,011 0,202 -0,010 -0,035Menticirrhus sp. Kingcroaker - - - 0,210 0,044 0,016Sciaena deliciosa Lorna drum - - - 0,056 0,166 0,121Stellifer minor Minor Stardrum - - - 0,175 0,024 -0,036Citharichthys sp. Pacific sanddab -0,016 0,024 -0,080 0,144 -0,031 -0,145Paralonchurus peruanus Peruvian banded croaker -0,118 0,415 0,006 - - -Trachinotus paitensis Pompano -0,001 0,275 0,012 - - -Myliobatis sp. Ray -0,077 0,122 -0,078 0,202 -0,010 -0,035Paralabrax sp. Seabass-Peruvian 0,569 0,328 0,703 0,039 0,534 0,160Epinephelus sp. Snowy grouper 0,297 0,067 0,196Prionotus sp. Volador - - - 0,131 0,030 0,098Cynoscion analis Weakfish-Peruvian -0,119 0,417 0,061 - - - Pelagic Fish Engraulis ringens Anchovy -0,292 -0,027 0,044 0,095 0,030 0,436Sarda chiliensis chiliensis Bonito-Eastern Pacific 0,133 0,116 0,135 0,234 0,053 0,117Coryphaena hippurus Perico, Dolphinfish - - - 0,030 0,034 0,344Scomber japonicus Chub mackerel -0,030 0,262 0,389 0,171 0,146 -0,024Cilus Gilberti Corvina 0,154 0,059 -0,222Not Specified Fish 0,001 -0,118 -0,043 -0,073 -0,022 -0,167Trachurus picturatus murphyi Jack mackarel -0,090 0,066 0,154 0,156 0,171 0,072Mugil cephalus Mullet -0,069 0,347 -0,020 0,273 0,101 0,071Sardinops sagax sagax Sardine -0,028 0,061 -0,064 - - -

Chapter 4 Livelihood assets: what are the building blocks of livelihood security?
111
Extraction Method: Principal Component Analysis. Rotation Method: Varimax with Kaiser Normalization. Empty cells: variable had zero variance
Table 24 Target species and type of fishing activity: Component loadings
Sechura Pisco Component (% of variance) C1 (66,03) C2 (6,60) C3 (3,61) C1 (67,38) C2 (4,9) C3 (3,77)
Scientific Name Pelagic Fish Odontesthes regia regia Silverside - - - 0,166 0,149 0,006
Mustelus sp.,Triakis sp. Smoothhound -0,097 0,223 -0,029 0,021 0,017 0,177
Invertebrates Diving Fishery
Concholepas concholepas) Abalone - - - -0,354 0,348 -0,153
Gari solida Clam 0,068 -0,252 -0,204 -0,004 -0,282 -0,026Cancer sp. Crab - - - -0,554 -0,338 -0,146Aulacomya ater Mussel - - - -0,137 -0,706 -0,035Octopus mimus Octopus 0,530 -0,564 -0,123 -0,621 0,537 -0,229Tagelus dombeii Razor clams - - - 0,097 -0,043 -0,181Argopecten purpuratus Scallop 0,579 -0,571 -0,322 -0,373 -0,480 -0,089Not specified Shellfish 0,091 -0,004 -0,070Stramonita sp. Snails 0,404 -0,557 -0,151 -0,832 -0,173 -0,201Mesodesma donacium Surf clam -0,033 0,016 -0,330 - - - Invertebrates Nets and Lines
Dosidicus gigas Giant squid -0,220 0,100 -0,048 - - -Xiphopenaeus sp. Prawn -0,051 -0,009 0,129 - - -Not speficified Shrimp -0,229 0,080 0,047 - - -Loligo gahi Squid -0,368 0,152 0,116 - - -
Extraction Method: Principal Component Analysis. Rotation Method: Varimax with Kaiser Normalization. Empty cells: variable had zero variance

Chapter 4 Livelihood assets: what are the building blocks of livelihood security?
112
Type of fishing activities (66%)
Inve
rtab
rate
s Div
ing
fishe
ry (7
%)
A)
Invertabrates Diving Fishery (67%)Se
abas
s & D
ivin
g fis
hery
(5%
)
B)
Type of fishing activities (66%)
Inve
rtab
rate
s Div
ing
fishe
ry (7
%)
A)
Invertabrates Diving Fishery (67%)Se
abas
s & D
ivin
g fis
hery
(5%
)
B)
Figure 23 Component plot of fishing activity and target species for Sechura (A) and Pisco (B)

Chapter 4 Livelihood assets: what are the building blocks of livelihood security?
113
DIVERPS
GDHL
DI_OTHERGD_OTHER
TRAWPS_OTHER
BEA_FI0,0
0,2
0,4
0,6
0,8
1,0
Link
age
Dis
tanc
e
GDPS
PS_OTHERHL
GD_OTHERDI_OTHER
DIVERBEA_FI
0,0
0,1
0,2
0,3
0,4
0,5
0,6
0,7
0,8
0,9
1,0
To investigate in more detail the dissimilarities in terms of gear and type of species in each
site, a cluster analysis was used to find the true groups of fishermen that are assumed to exist
based on target species. The results of the cluster analysis for Sechura and Pisco are presented
in Figure 24A and 24B respectively. In Sechura clustering of the presence/absence species
data first identified two groups: divers and purse seiners and other gears, separated by a
disagreement level of about 95%. In Pisco clustering first identified two groups: gill and drift
nets and divers, separated by a disagreement level of about 54%. Divers in Sechura are thus
well separated in terms of target species compared to Pisco. Overall the disagreement level
between groups is higher in Sechura than in Pisco, suggesting that gear groups share more
target species in Pisco than Sechura. Of particular note is in Pisco the well separated group
formed by divers and beach fishermen where as in Sechura divers and beach fishermen are the
most separated groups.
A) B)
Figure 24 Dendogram from hierachical cluster analysis (Ward’s method and percent disagreement), using species presence absence data and types of gear for Sechura (A) and Pisco (B)
4.5 Discussion
4.5.1 Human capital Human capital is not only the result of formal education, but includes practical learning that
takes place on the job, as well as non formal education, such as specific training courses that
are not a part of traditional formal educational structures (Davidsson and Honig 2003).
Overall the survey showed in both sites that 50,8% of fishermen attended secondary school
Chapter 4 Livelihood assets: what are the building blocks of livelihood security?
114
with a competition rates of 50,2%. These low percentages are consistent with low values of
completion of secondary education (30,7%) in Peruvian rural zones (INEI 2007). The lack of
perceived relevance of formal education provision to fishing communities, coupled with the
need to earn income from a young age could be factors to that explain low completions rates
(Petersen 2007). In interviews fishermen often mentioned the inability to secure enrolment
fees and the need to earn extra-income for the family as a reason to drop out of school. In
Chapter 5 the motivation behind respondents’ adoption of fishing as an occupation will be
further explored. These low percentages of attendance and completion of secondary level
studies (and to some extent primary level ones) are another barrier faced by fishermen in
terms of developing their capabilities and entrepeurnarial skills. Literacy and numeracy skills
are important factors in the livelihoods of fishing communities with fishing activities often
requiring practices of record keeping, communication, management of business activities and
marketing (FAO 2006). Additionally, possessing skills only specific to the fishing profession
can make movement out of fishing difficult when occupational diversity is sought (Townsley
1998). Our data revealed that secondary education is more widespread in Pisco than in
Sechura with higher completion rates in Pisco. This regional disparity is also observed by
national statistics, with completion rates in Piura of 37,6% compared to 46,3% in Pisco (INEI
2007). Difference can be attributed to geographical and inequalities in educational access.
However, it is worth noting that the migratory nature of fishermen might make them more
inclined to not complete their education (Petersen 2007). When desegregating results by gear
types, divers have a higher propensity to achieve secondary education than other groups in
Sechura while in Pisco no gear differences were observed. Diving is an activity that involves
learning new techniques that are not traditionally embedded in Sechura, an area traditionally
geared towards line and net fishing. Perhaps, as put forward by Davidsson and Honig (2003),
individuals with higher amounts of human capital, whether formal or informal, have greater
self-confidence, enabling them to make a choice toward independent entrepreneurship
(Davidsson and Honig 2003).
In terms of capacity building, less then half of the fishermen surveyed acknowledged having
received training, with fishermen in Pisco reporting less training than in Sechura. It is worth
noting that an NGO has been actively present for the last two years in Sechura while in Pisco
capacity building activities have significantly decreased since another NGO pulled out due to
lack of financing. Additionally, Sechura is located at a two-hour drive from the Centro de

Chapter 4 Livelihood assets: what are the building blocks of livelihood security?
115
Entrenamiento Pesquero (CEP) run by IMARPE in Paita. The CEP is a major sector specific
training center in the Northern part of Peru and to a certain extent could explain higher
capacity building reporting in the area. When desgragating the survey results by gear type a
significant difference is observed in Sechura while none in Pisco, with more divers reporting
to have received training. Again, this may be attributed in the active role played by the local
NGO in terms of capacity building related to scallop aquaculture. Type of training received
confirmed this, with a higher proportion of surveyed fishermen in Sechura having received
training related to aquaculture compared to Pisco. However, Pisco experiences a higher
percentage of fishermen with training related to managerial skills (10%) and environmental
education (29%) compared to Sechura (6% and 10% respectively). Workshop and interview
data in Pisco reveal that the presence of the company PlusPetrol and the constant challenges
faced in terms of pollution are the main drivers behind these types of training. The lack of
managerial skills in Sechura, combined with lower level of education could be an impediment
to develop new businesses and move from fishermen to entrepreneurs. It has been argued that
some research tends to support the existence of a positive relationship between human capital
and entrepreneurial activity (Davidsson and Honig 2003). In this context, it has been posited
that government polices should focus not only on agricultural rural development, but also on
endowing poor rural people with the skills permitting them to “escape” rural poverty (Rigg
2006). Informal type of learning based on experience at sea appears to be more prevalent in
Pisco than in Sechura. However, these results should be interpreted with caution as they are
based variables which do not encompass all the dimension of fishermen knowledge.
Workshop participants felt fishermen knowledge was little if not acknowledged by decision
makers and more attention should be paid on fishermen ability to share their experiences of
the environment surrounding them with decision makers and scientists. Participants also
highlight the problem of fishing-related injuries and illnesses, especially in the case of diving.
While a relative low number of fishermen reported occupational injuries (18,5%) it is
important that authorities include in sectoral policies provisions for occupational safety,
health, and accident prevention.
4.5.2 Social capital Of all the different capital assets, social capital is probably the least tangible and so the one
that is least understood (Bebbington 1999). This chapter has focused on fishermen individual
social capital based on Airriess et al. (in press) argument that social capital is not “a thing

Chapter 4 Livelihood assets: what are the building blocks of livelihood security?
116
possessed by a community because a community is an outcome of social relationships; only
individuals or institutions are able to possess social capital”. Although there are many
different definitions of social capital the one put forward by Pretty and Ward (2001) is used,
with its four central aspects: relations of trust; reciprocity and exchanges; common rules,
norms and sanctions; connectedness, networks and groups. Social capital is thus the idea that
social bonds and social norms are an important part of the basis for sustainable livelihoods
(Pretty and Ward 2001). When evaluating rule and norm compliance by fishermen a
significant difference was observed between sites and gear groups, with Sechura having a
higher rate of informality than Pisco, the diver group being the most informal one in both
sites. Uncovering the reasons behind these differences is not simple, but a first approach
involves linking the higher rates of immigration and the development of the recent
development of the diving activity in Sechura in the last ten years as possible explanation of
greater informality. Additionally, interviews revealed that the administrative process behind
the obtainment of licences and fishing or diving cards is plagued by red-tape and costs
(money and time) that fishermen are often not willing to bear. Informality and non-
compliance to rule has been shown to interfere with management goals and efficiency
(Bodiguel 2002). Currently in Sechura, the regional Fisheries Office and the Municipal
Fisheries Office have great difficulty in managing the artisanal sector due in part to the lack of
information regarding the number of users.
Social bonds and networks can be divided into three categories: bonding, bridging and linking
social capital. Bonding social capital involves linkages or ‘strong ties’ within groups and is
viewed in an horizontal form, referring to the strong social bonds and effective organisations
within a homogeneous group (Narayan 1999; Grafton 2005; DaCosta and Turner 2007). Over
all only half of the fishermen surveyed belong to a fishermen organization, a type of bonding
capital. Membership differs across sites, with Pisco having a higher percentage of fishermen
engaged in fishing groups than Sechura. No gear differences were observed in terms of
membership. Pisco over the year has undergone substantial changes with the creation of the
Paracas National Marine Reserve in the 1970s, conflicts with the fishmeal industry in the
1990’s and 2000’s PlusPetrol Camisea gas pipeline near the reserve. These developments
have encouraged fishermen to create ties in order to defend their interests. Sechura is a less
closed-knit community with a constant influx of migrants and a rift existing between
traditional fishermen using lines and nets and divers involved in the new aquaculture industry.

Chapter 4 Livelihood assets: what are the building blocks of livelihood security?
117
Disputes mainly involve claims of increase drug abuse and unrest in communities due to
migrants and conflicts, sometimes violent, between divers involved in aquaculture and
fishermen using nets over access rights. However, an increasing trend has been observed in
Sechura as a consequence of the development of the aquaculture industry. Nevertheless higher
level of membership in Pisco does not indicate whether these groups function or not. The
workshop and interview data point out that fishermen groups lack organization, and the level
of trust within the groups is low. Elite capture, where leaders of association put forward their
own interest, was highlighted as a specific problem. The issue of rent-seeking elites in rural
areas is often mentioned as a factor undermining the success of co-management of natural
resources (Beck and Nesmith 2001; Allison and Badjeck 2004) and has been observed in both
study sites. Additionally, group formation and continuity over time, according to interviews,
is highly influenced by external factors such as market changes and environmental ones. In
this context while community groups are often portrayed as stewards of natural resources, the
uncertainty surrounding their effectiveness and longevity will be an impediment to the
promotion of resilience (Pretty and Ward 2001).
Bridging social capital is concerned with linkages across similar, but different, groups or
social networks (Grafton 2005) highlighting the heterogeneous form of social networks
(DaCosta and Turner 2007). Bridging social capital may also play a crucial role in generating
regional co-operation across fishing communities and in conflict resolution across competing
fishing gears and interests (Grafton 2005). The survey revealed that a majority of fishermen
(or a member of their household) are members of a community group in both sites (60,9%).
Religious groups, mainly evangelic ones, are particularly prevalent in Sechura and one of the
major benefits of being part of community groups was mentioned to be a “spiritual” one, with
greater family and community cohesion, often the women in the household being actively
engaged in such organizations. Informal social networks formed by religious affiliation might
encourage contributions to the public good either directly through their activities or indirectly
through a sense of connectedness created by these memberships (Owen and Videras 2007)..
Interview and workshop data revealed that women are women play a particular role in
Sechura with their strong involvement in women clubs and communal kitchen as well as
church groups, while in Pisco their involvement seemed to be greater in the
commercialization of fisheries products, especially in San Andres. In Pisco, sport activities,
through football teams, provide a platform for networking among fishermen and a higher

Chapter 4 Livelihood assets: what are the building blocks of livelihood security?
118
engagement in credit and political groups is observed. The latter can be explained by the
nature of municipal politics in the Province of Pisco and Region of Ica: being near the capital
Lima fishermen in the area are heavily solicited by political parties during elections as
observed during field work in 2006.
Whether as members of a fishing organization or a community group, a quarter of respondents
in Sechura and nearly 40% in Pisco felt their membership to the groups did not provide them
any benefits. As highlighted earlier, the functioning of organizations, involvement of users
and the benefits they receive from them is as important, when exploring social capital, as the
actual membership to particular organizations. Overall, does who felt satisfied with their
involvement in fishing or community groups, expressed that these were able to assist them
when facing household shocks such as diseases, burials and food insecurity while nearly 10%
mentioned economic assistance or loans. Lobbying was also put forward as a benefit from
being part of a group, were respondents felt their interest were put forward to local authorities,
groups and social networks thus acting as linking capital.
4.5.3 Financial capital Overall financial capital was similar across sites with the exception of access to life insurance,
with fishermen Pisco having a greater access to this service. For all variables no differences in
terms of type of gear were observed, highlight access to financial capital, or lack of thereof, is
systemic within the surveyed sites. Access to formal sources of credit was weak in Sechura
and Pisco. The formal financial system in Peru provides very limited rural and agricultural
finance services and most financial institutions focus uniquely on serving urban clients
(Campion 2007). Workshop data revealed that the lack of rural and sectoral service provision
combined with a lack of fishermen saving and investment skills as well as the presence of
prohibitive interest rates, represented barriers to access. If institutions lend at all, it is
primarily to the aquaculture sector and larger business. Results of the exploration of social
capital in both study sites also revealed that community groups were sometimes used for
economic assistance and loans (around 10% overall) and in times of distress. The lack of
access to formal financial service is the main driver behind these initiatives, albeit these
remain insufficient to meet the needs of fishermen and their households. Fishermen to be able
to fulfill the high initial capital requirements often rely on private enterprises, traders or
money lenders. As observed in other fishing communities, informal sources of credit are

Chapter 4 Livelihood assets: what are the building blocks of livelihood security?
119
disadvantageous for fishermen and result in high interest rates, and credit is frequently linked
to unfavourable terms of trade and the establishment of exploitive relationships (Tietze and
Villareal 2003 ). To avoid the creation of dependency and client-patron relationship fishermen
should be encouraged to draw formal agreements with these businesses, and sectoral policies
should favor public private partnerships. Additionally, they should reduce the perception of
high credit risk that often service providers experience in Peru (Wenner et al. 2007).
Currently, formal specialized micro-finance rural institutions exist in Peru (Campion 2007)
along with government-led programs loan programs in the fishery sector. These formal micro-
finance institutions should pay particular attention to elite-capture in communities as
mentioned in the previous section. As Amin (2003) put forward: “subsidized credit has a
disappointing history of being politically manipulated and diverted from its intended
beneficiaries, the poor” (p.59). With this caveats, while polices at the macro level should be
put into place, fishermen should also increase their associative capabilities. Indeed, groups are
often used as financial intermediaries or guarantors of loans, replacing the traditional
collateral requirements (Tietze and Villareal 2003 ). Acclaimed models such as the Grameen
Bank (Amin et al. 2003) were no collateral are required as group members mutually guarantee
each other’s loans requires social capital in its structural (type of organization ) and cognitive
(trust) forms that are currently sparse in both study sites.
4.5.4 Physical capital Physical capital encompasses productive assets such as boats; land and other dwellings that
directly contribute to the generation of income. The results show that in both study sites the
majority of fishermen do not own their own vessel nor possess other properties, limiting their
ability to generate income other than with fishing as an occupation. Liquid assets are
consumable goods easily accessible, which can be exchange for cash, sometimes being
considered as financial capital for this latter reason. Of interest is the fact that liquid assets are
overall more reported in Sechura than Pisco. They are also more readily available to the
individual fishermen than adequate housing characteristics and service infrastructure. Another
dimension of physical capital is public infrastructure and service provision. The results clearly
show a disparity between sites, especially in terms of electricity and sewage and sanitation
facilities provision. In terms of electricity provision 78% of respondent in Sechura reported
having access while this figure was 945 in Pisco. Among Latin American countries, the
urban-rural disparity is most extreme in Peru for electricity provision (Fay and Morrison

Chapter 4 Livelihood assets: what are the building blocks of livelihood security?
120
2007). While access to electricity in the data is above regional averages for Ica and Piura,
respectively 83,55 and 56,2% (INEI 2007), the results reflect the regional disparities observed
in the country. Sewage and sanitation infrastructure exhibits an even greater disparity with
only 33% of the respondents having access to these facilities in Sechura compared to 90% in
Pisco. Again these figure are in line with regional statistics, with 31% of the population in
Piura living in dwellings without proper toilet facilities compared to 14,2% in Ica. Difference
in service provision have been attributed to a deficient decentralization policy and a focus on
urban areas (Escobal 2001). Additionally, it is worth noting that Pisco is characterized by the
presence of the Paracas National Reserve which makes it a hub for tourism and holiday-
related activities, an impetus for better service provision and infrastructure development.
If looking at each sites independently, the type of fishing activity explained some of the
variance within the data set more in Pisco than Sechura , respectively 32% and 19%. The
results show that the type of fishing activity seems to have little effect in the distribution of
assets in Sechura, meaning that lack of access to service infrastructure is a systemic problem
not confine to particular gear groups. Sechura is characterized by high immigration rates
which imply that informal settlements are expanding at a rapid rate, without significant
improvement in service provision. The province of Sechura thus bears the brunt of inadequate
rural development policies with under-development and absence of roads and infrastructures.
Housing characteristics also greatly differed between sites, with Sechura presenting a higher
proportion of rush mat and quincha materials, which are low cost materials, and smaller
dwellings (less number of rooms). Qualitative information revealed that dwellings are
extremely vulnerable to flooding and no government housing program is in place for the new
migrants. Additionally interviews, workshop data and participant observation show that
fishing infrastructure (docks, cold storage and decompression chambers) are in a dire state in
Sechura, especially in the Puerto Rico docks. It has been argued that inadequate infrastructure
undermines growth and competitiveness and hampers the fight against poverty, exclusion, and
inequality (Fay and Morrison 2007).
4.5.5 Natural capital This section aims at describing fishing strategies based on target species in order to identify
the level of heterogeneity of the fishery in both study sites. Salas and Gartner (2004) posit that
while one cannot make rigid differentiation between fishermen, these are not an homogenous

Chapter 4 Livelihood assets: what are the building blocks of livelihood security?
121
group (Table 25). Specialists concentrate in one area and one species or fishing method while
generalists fishermen can more easily switch activities or gear and can change more easily
target species (Salas and Gaertner 2004). Most small scale fishermen are considered
generalists, even when traces of specialization are observed (Salas and Gaertner 2004). Target
species can be defined by multiple factors such as the commercial value and the availability in
easily accessible ecosystems and not only its abundance (Tzanatos et al. 2005).
Littoral and pelagic fishes presented no statistical differences among sites. Target species that
differentiated both sites were invertebrates ones, namely clam, octopus, scallop and surf clam.
Scallop and octopus were more reported in Sechura while in Pisco the snail, crab and mussel
fishery were more prevalent in answers. Other site differentiation resided in the absence of a
giant squid, shrimp and squid fishery in Pisco, which is consistent with the geographical
distribution of these species.
Table 25 Diferences between generalists and specialist fishermen (Smith and McKelvey 1986 adapted from ; Salas and Gaertner 2004)
Characteristics Generalist Specialist Time frame
Short Long
Flexibility
High Low
Technology
Not specialized More specialized
Activities
Wide range Limited
Fix costs
Low High
Operation costs
Variable Variable
Opportunity costs (due to change of activity)
Low High
When exploring the variance within the data taking into account the type of fishing activity in
each site several conclusions can be drawn. In Sechura, the type of gear used, littoral fish
species like seabass and weakfish, snail, octopus and scallop and the squid fishery explained
most of the variance in the data set, with fishing activity, scallop and seabass loading heavily
on the first factor of the principal component analysis. In Pisco, the most important variables
explaining the variance within the data sets were target species of the diving fishery (snail,
octops, mussel, scallop) and littoral fish species seabass and blenny fish. The structure of the
artisanal fleet in Sechura consisted of two marked groups corresponding to divers and non-
divers. And in Pisco of divers and beach fishermen and the rest of the gear groups, with the

Chapter 4 Livelihood assets: what are the building blocks of livelihood security?
122
difference between groups were smaller. Fishermen in Pisco are thus more generalists and
have a higher level of heterogeneity than in Sechura in terms of target species, as observed in
other small scale fisheries (Tzanatos et al. 2005). In Sechura the diving group appeared to be
highly specialized. This high specialization can be explained by market forces: since 2000 the
bay has obtain sanitary certificate to export to the European Union and the demand by traders
and intermediary for the scallop species has been in a constant increase in the last few years.
While the survey data showed that divers were highly specialized, it is worth noting that in
interviews line and net fishermen reported that diving boats also used nets underwater,
depleting the seabass species. Thus while specialization is higher based on species
preferences, fishermen remain opportunistic in terms of fishing strategy. These results
highlight the fact that, as in other small-scale fishery, the heterogeneity of the small scale
fishery makes single species management approach meaningless (Tzanatos et al. 2005 p.156).
The management goals of the multi-species management and the ecosystem approach is to set
harvest levels of target species while maintaining the sustainability of other species in the
ecosystem, which are connected with the target species through prey–predator relationships or
other biological and environmental factors (Morishita 2008 p.23). In the last years ecosystem
models have been designed in Peru (see for instance ECOPATH model of Sechura Bay by
Taylor et al. 2007). However these models so far have not translated into management
policies. For instance in Sechura Bay the regional government, in synch with national polices,
is heavily promoting the development of the scallop aquaculture. By regarding divers has a
homogenous group only relying on scallops and promoting mono-species aquaculture, it down
plays the importance of resources like octopus and snails.
4.6 Conclusion The study discerned major axes of differentiation between the livelihood platform of Pisco
and Sechura. Human capital and physical capital were higher in the Pisco, lower educational
levels and public infrastructure and service provision mainly explaining the differences. In
terms of social capital, differences start to blur. While informality is higher in Sechura, both
sites exhibit a highly informal diving group. This warrants policies at the regional level
promoting the adoption of fishing and diving cards at low costs. While membership to
fishermen organizations was higher in Pisco, dissatisfaction also followed the same trend.
Likewise, issues of lack of trust and elite capture were common to both sites but migration
trends posed specific challenges to Sechura. In terms of natural capital Sechura presented a

Chapter 4 Livelihood assets: what are the building blocks of livelihood security?
123
high variety of species but a more specialized diving fishermen group than in Pisco, as a result
of the promotion of scallop extraction and aquaculture.
Finally, similarities among sites include a lack of access to financial capital, which was
highlighted as a major constraint to the development of income generating activities. These
results underscore the fact that to build and secure the assets in both study sites broad general
policies at the national level will not be able to tackle the specific problems faced by these
communities. Their differences in asset endowment can be traced to a variety of historical,
social and political factors. As other studies in rural areas of Peru have shown (Kristjanson et
al. 2007), while national policies are important, policies need to be region-specific and may
even have to be community specific. Interventions at different scales is needed with a sectoral
approach for promoting access to financial services, a regional approach for investing in
public service infrastructure and education in the North, and an ecosystem-based approach
that takes into account the level of heterogeneity of the artisanal fishery in both sites and the
impact of migration, as well as local level capacity building to upgrade human and social
capital.

Chapter 5 Livelihoods options, outcomes and constraints
124
CHAPTER 5
LIVELIHOODS OPTIONS, OUTCOMES AND CONSTRAINTS
5.1 Introduction Livelihood options are the range and combination of activities and choices that people make
in order to achieve their livelihood goals. It is now well recognized that rural income
portfolios and activities are diverse (Carney 1998; Ellis 2000; Smith et al. 2001) and that the
pursuit of alternative sources of livelihood are a necessity as much as a choice (Ellis and
Allison 2004). Diversification is defined as the process by which households construct
increasingly diverse livelihood portfolios, making use of increasingly diverse combinations
of resources and assets (Niehof 2004 p. 321). It has been argued that diversification and
building a portfolio of livelihood options is a primary means by which many individuals
reduce risk and cope with uncertainty (Ellis 2000; Barrett et al. 2001; Eakin 2005). Only
recently income characteristics and occupational diversity has been a focus of research
related to artisanal fisheries (Allison and Ellis 2001; van Oostenbrugge et al. 2004). A
growing body of literature is also arguing that migration is an important facet of livelihoods
dynamics in fishing communities (Kramer et al. 2002; Marquette et al. 2002; Ellis and
Allison 2004). Migration itself represents a diversification strategy which in certain cases can
enable households to overcome credit and risk constraints and facilitate investments in
relatively high return activities (Wouterse and Taylor 2008). Diversification and migration
are thus critical research issues in the analysis of livelihoods. Moreover, as shown in Chapter
2, livelihoods unfold at the micro level but are shaped by meso and macro level policies. The
micro-macro links are important to decipher the constraints imposed on livelihood options
and outcomes. For instance, the identification of how institutions hamper or improve
people’s ability to construct and secure livelihoods is essential to connect the institutional
context with individuals or household strategies (Ellis et al. 2003). A specific arena of
inquiry is the devolution of power to local communities through co-management and
decentralization initiatives. Decentralization has been portrayed as a mean to improve cross-
scale linkages (Adger et al. 2005a) resulting in “good governance” of natural resources
(Batterbury and Fernando 2006). However, while local government and decentralization
strategies provide building blocks for improved livelihoods, the potential failures of

Chapter 5 Livelihoods options, outcomes and constraints
125
governance also reside in such initiatives being ill-conceived and wrongfully implemented
(Batterbury and Fernando 2006).
5.2 Objectives and methods The objectives of this chapter are to understand the livelihood options exercised by fishermen
and livelihood outcomes. It seeks to answer the following questions: what activities do
fishermen pursue? What outcomes do they achieve? Another objective is to explore how
institutions enable or constraint livelihoods. Chapter 3 offers details on methods used for
analysis, the section below only highlighting the type of data used within this Chapter.
5.2.1 Workshops and interviews The workshops conducted in 2005, where a participatory ranking exercise was undertaken,
provide the data necessary for analyzing how the institutional environment affects fishermen
livelihoods. Subsequent workshops conducted between 2006 and 2007 offered the opportunity
to refine the initial analysis and triangulate preliminary results. The interviews with users,
government authorities and NGO workers also allowed the triangulation of the ranking
exercise results collected at the inception of the study. Particular attention during interviews
(semi-structured) was placed on the understanding of the interaction between government
agencies and users and the identification of bottle necks in current fisheries management.
5.2.2 Fishermen survey Information was gathered on the portfolios of occupations to assess the importance of, and
dependence on, fishing activities. In order to take into account women’s activities as
contributors to household income (‘family income’), fishermen were also asked if women
living in their household engaged in an activity. Activity was defined as any occupation that
is generating revenues or goods to the family and direct dependents. Income was divided into
monthly fishing and family income. Respondents often felt more at ease expressing their
income by week or days. In these instances the values were multiplied by the number of
average working days (three weeks a month). The migration section of the survey was added
in the second phase of fieldwork with the objective of understanding the importance of
seasonal migration as a livelihood strategy. Seasonal migration referred to changes in fishing
grounds, areas outside the bays understudy.

Chapter 5 Livelihoods options, outcomes and constraints
126
5.3 Occupation and livelihood diversification Fishermen were asked in an open-ended question what kind of activities they engaged in to
sustain their household. While respondents mainly rely on fishing as a primary activity
(100% in Sechura and 99,8% in Pisco), they also mentioned agriculture, taxi driving and
owning a small business as alternative occupations (Figure 25). A difference was observed
between sites regarding the type of activities they were involved in (X2= 39,65 d.f.=11,00,
p<0,05). Agriculture is an alternative source of income in both sites, with a greater
percentage of fishermen involved in farm activities in Sechura (8,7% Sechura and 5,6% in
Pisco). In Pisco a greater number of fishermen mentioned working in processing plants (2,6%
versus 1,2%) and miscellaneous activities (6,1% versus 4,2%). This category (“OTHER”)
includes such diverse activities as lender, and football player. The mean number of
occupations per fishermen (1,34 ± 0,62) did not vary among sites (Z=-0,502, p>0,05) nor was
it correlated with the type of fishing activity (rs=0,501 p>0,05).
0123456789
10
FIS_S
ERV
MECANIC
FI_C
OM
LABOURER
PLANT_P
T
TRANSP
SMALL_B
TAXI
AGRI
OTHER
Perc
enta
ges
Sechura
Pisco
All Sites
Figure 25 Distribution of type of occupations across sites (excluding fishing). Percentage of valid answers (n=437 open ended question).
To explore the motivation behind the engagement of respondents in fishing activities, a sub-
sample of fishermen (N=344) were asked the open-ended question. “Why did you start
fishing?”. Economic hardship, ranging from the necessity at a young age to sustain the family
income to no other occupational opportunity being available, was the most prevalent type of
answer with 41,3% of respondents mentioning it. This was followed by fishing being
considered a family tradition, providing more money and being a more enjoyable activity,
especially compared to farm work (Figure 26). Indeed respondents highlighted that ‘life at
sea’ and the freedom they enjoyed could not be provided by other type of occupations. While

Chapter 5 Livelihoods options, outcomes and constraints
127
a significant differences between sites was observed for the reason “economic hardship” (X2=
16,66 d.f.=5,00, p<0,05), for the other variables no significant differences were encountered
(p>0,05). In Pisco, a greater number of fishermen expressed that the lack of economic
opportunity and poverty were the main reason for entering the sector (59,1% versus 36,8% in
Sechura) Using the classification tree method, with reason to enter fishing as the dependant
variable and type of gear as the independent one, no gear group were identified as a
significant predictor of motivation to enter the fishery sector.
0
1020
3040
5060
70
EconomicHardship
FamilyTradition
Friend Like it Moremoney
Other
Perc
enta
ge Sechura
Pisco
All Sites
Figure 26 Reasons for choosing fishing as an activity. Percentage of valid answers (n=332 open-ended question)
Respondents were then asked if women in their household were engaged in income
generating activities and what these were (open-ended question). A difference was detected
in the engagement in activities (X2= 12,03 d.f.=1,00, p<0,05) and the type of activities (X2=
21,83 d.f.=10,00, p<0,05) among sites. More women in Pisco than in Sechura possess an
income generating activity (38,4% versus 24,3%). Overall women’s involvement are mainly
in small business (36,1%), which includes for instance restaurants or small informal stores,
and post-harvesting activities in the fisheries sector (33,5%), such as processing or
commercialization. In Sechura they are more involved in small businesses (44,9% versus
29,2%) and in agriculture (2,9% versus 1,1%). However, in Pisco formal employment is
more important with occupations such as professor or nurse (Figure 27). The mean number
of occupations per women (1,07 ± 0,26) did not vary among sites (Z=-1,133, p>0,05).

Chapter 5 Livelihoods options, outcomes and constraints
128
0
10
20
30
40
50
AGRI
DOM_HELP
NURSE
OTHER
PROFE
RESTAU
SEWIN
GFISH
BUISNESS
Per
cent
age Sechura
PiscoAll sites
Figure 27 Distribution of type of women occupations across sites. Percentage of respondents (N=572) (Number of answers n=333).
5.4 Migration as a livelihood strategy Migration status is here presented as temporary/seasonal migration. Fishermen were asked if
they ever migrated in order to find better fishing grounds. A majority of fishermen responded
they had moved to other fishing grounds, and overall seasonal migration mostly occurred in
the summer (Table 26). Using the classification tree method with “Have you migrated” as a
dependent variables and type of gear as an independent one no predictors could be observed.
However, tests of statistical significance revealed a difference between sites, with fishermen
in Pisco changing fishing zones in greater proportions, especially in the summer (83,75),
while in Sechura migration occurred mostly during the winter (50%).
The decision to migrate was made by fishermen themselves, only 19% reporting that they
followed the decision of the owner. While no significant difference was found between sites
and types of gear, a classification tree revealed that the position on board of a boat (crew,
diver, owner etc.) was a good predictor of who took the decision to migrate (Figure 28).
Fishermen who are crew have less of a tendency to decide on their own whether they migrate
or not. For those who did not migrate, the major reasons invoked for not doing so included
family ties, habit (including good knowledge of their traditional fishing grounds) and the
perception that species abundance in their current area was satisfactory.

Chapter 5 Livelihoods options, outcomes and constraints
129
Table 26 Migration as a livelihood strategy. Percentage of valid answers
Sechura Pisco Total P valuesa
n=249 n=95 n=344 Have you migrated? 0,009 Yes 63,1 78,3 67,4 Seasons 0,000 Both 4,5 0 1,4 Winter 50 20,4 29,6 Often 13,6 8,2 9,9 Summer 36,4 83,7 69 Decision 0,464 Own 78,9 73,1 77 Owner 18,3 20,9 19,1 Both 2,8 6 3,8 If not why? 0,63 Access Conflicts 1,4 0 1,1 Costs 4,3 0 3,3 Family 27,1 30 27,8 Habit 24,3 20 23,3 No Opportunity 14,3 10 13,3 Did not want 4,3 0 3,3 Species good here 20 25 21,1 Other 4,3 15 6,7
a. Pearson Chi-square
Figure 28 Classification tree (CHAID growing method) with dependent variable ‘decision’ to and independent variables: Site, Fishing activity and position on board

Chapter 5 Livelihoods options, outcomes and constraints
130
5.5 Livelihood outcomes Livelihood outcomes are the achievements or outputs of livelihood strategies. While one
should not assume that people are entirely dedicated to maximizing their income, it is
nonetheless a useful measure of successful livelihood outcome, albeit it needs to be
contextualized. Additionally to income, fishermen were asked to estimate their monthly
expenditure in order to identify if they could rely on a safety net or disposable income for
investment in productive activities. Mean monthly income from fishing activity is soles 728,7
± 760,5 (1 soles:0,36 USD). Total family income is soles 804,4 ± 885,3 and total expenditure
523,9 ± 406,5. These figures highlight that overall fishing is a primary source of income and
that disposable income is available to households (34,9% of income available for savings and
investments). However these values differed greatly among sites (p<0,05) with Sechura
having greater mean fishing income and family income, and lower family expenditure (Table
27). The disposable income available in Sechura represents 46,1% of total family income
compared to only 14,4% in Pisco.
Table 27 Fishing and total family income and expenditure across sites in soles (1 soles:0,36 USD)
Sechura Pisco All sites Z a
P Value
n= 333 n=239 n=572
Mean Standard Deviation Mean
Standard Deviation Mean
Standard Deviation
Fishing Income 831,0 935,3 588,8 375,2 728,7 760,5 -3,116 0,002 Family Income 934,2 1073,9 642,7 528,5 804,4 885,3 -3,547 0,000 Family Expenditure 503,6 424,6 550,3 380,9 523,9 406,5 -3,721 0,000
a. Computed using Mann Whitney U test 2-tailed
Similarly a significant difference was observed in the distribution of income quartiles across
sites (X2= 22,93 d.f.=3,00, p<0.01) with Sechura demonstrating a higher percentage of
respondents in the top quartile, while fishermen in Pisco were mainly concentrated in the
middle quartiles (Table 28).

Chapter 5 Livelihoods options, outcomes and constraints
131
Table 28 Family income quartiles across sites. Percentages
Sechura Pisco Total n=333 n=239 n=572 Income quartiles
I 23,0 25,9 24,3 II 17,1 32,4 23,9
III 29,4 25,5 27,6 IV 30,5 16,2 24,1
These findings are further explored by examining correlations between the type of fishing
activity, boat ownership, number of activities in which women and fishermen engage in,
possession of other properties (land etc.) and family income (Table 29). A significant positive
correlation is found between family income and ownership of other properties. In Sechura,
the type of fishing activity is negatively correlated to income levels. Contrary to what could
be expected the level of occupational diversity (number of activities) does not seem to be
associated with income levels. Additionally, when performing a Pearson Chi-square test of
statistical significance, income portfolios (type of activities) across quartile did not vary in
each sites (p>0,05).
Table 29 Correlation between family income and fishing activity, ownership of productive assets and occupational diversitya
Sechura Pisco All
Sites (n=333) (n=239) (n=572) Fishing Activity 0,034* 0,132 0,032* Vessel Owner 0,739 0,269 0,586 Possesses other properties 0,002** 0,001** 0,000** Nbr. Eco. Activities Women 0,671 0,292 0,322 Nbr. Eco. Activities Fishermen 0,071 0,634 0,220
a. Spearmans rank correlation coefficients.*p<0,05, **p<0,01
Using the classification tree method, with family income quartile as dependant variable and
type of gear and site as independent ones, two gear groups are identified in Pisco: divers,
beach fishermen and purse-seiners using various gears and the reminder of gear types (Figure
29). The group comprising divers is a significant predictor of being part of the third quartile
while those using other gears are significant predictors for the first quartile. This means that
divers, beach fishermen and purse-seiners using various gears have a higher propensity to
belong to the wealthier groups. In Sechura no gear types are identified as significant
predictor.

Chapter 5 Livelihoods options, outcomes and constraints
132
Figure 29 Classification tree (CHAID growing method) with dependent variable family income quartile and independent variables site and fishing activity.
5.6 ‘Narratives from below’: Users’ perception of fisheries management and its impact on livelihoods
The workshops conducted in 2005 were a unique opportunity to understand the challenges
resources users faced in Sechura and Pisco through a ranking exercise. On both sites marine
pollution was highlighted as the main threat due to lack of adequate infrastructure and to non-
compliance to environmental norms. In Pisco (Table 30) participants identified a weak
institutional environment and organizational deficiencies (these mostly related to fishermen
organizations) as a cluster of problems hampering fisheries management. The low social
capital at the micro level was associated with a lack of leadership and skills in fishermen
organizations that posed serious constraints to users’ ability to manage their own resources
and market their products. Pisco’s participants were particularly adamant that this low social
capital posed enormous challenges for the adequate commercialization of their catches.
Indeed commercialization in fishing docks around Peru is controlled by intermediaries who
either sell the products to processing plants or wholesalers in Lima’s main seafood markets.

Chapter 5 Livelihoods options, outcomes and constraints
133
At the macro level the weak institutional environment in the form of insufficient enforcement
of the legal framework (i.e. moratoriums), the ‘absence’ of the state and inadequate policies
was pinpointed as a cause of overexploitation. It is worth noting that while participants in the
workshops blamed authorities for their inability to control and enforce the legal framework,
they acknowledged that fishermen themselves played an important role in resource
degradation, departing from the theoretical paradigm that communities are the best
custodians of resources. In Sechura (Table 31) participants associated overexploitation not
only to fishermen behavior and the absence of state control and enforcement, but also to the
nature of property rights. Indeed open access was deemed to be a cause of resource
degradation and the need for restricting access through the regionalization of the fishery was
put forward. Interviews with fishermen and government representatives revealed the same
tendencies:
“The Achilles’ heel [of the fishery] is the fact that there is not limit of access to (…) resources”
P28: UI-5-BB-Piura.rtf - 28:5 (11:11)
“Right now in the sector there is a regionalization movement to fight off immigration. In Parachique people do not want people from Pisco. [But] There is a lack of information regarding the migration of the fleet (…)”
P40: UI-7-BA-Lima.rtf - 40:4. (27:27)
Corruption, informality (non rule compliance) and deficient policies was another cluster of
problems attributed to fisheries management in Sechura. These issues are intimately
interconnected; indeed one could argue that informality is an offspring of bureaucracy which
leads to corruption. The fact that participants separated the two issues highlights their
fundamental preoccupation as users: the inability to be formal and exercise their rights while
respecting the legal norms, and the corruption and bureaucracy within the state apparatus. On
both study sites participants advocated a reform of the state, whether through administrative
decentralization, simplification of procedures and a stronger presence of authorities at the
local level to ensure rule compliance by users.

Chapter 5 Livelihoods options, outcomes and constraints
134
Table 30 Identifying and ranking problems in Pisco. Workshop in Pisco in 2005
Total Points
Problem Causes Consequences Solutions
Fishmeal industry Loss of biomass and biodiversity
Adapt/improve the norms. Better technology. Ensure compliance with the law
11 1) Marine Pollution
Waste water from urban areas Deteriorating water quality. Treatment of residual waters. 6 2) Lack of capacity
building Lack of interest (users). Lack of time and money
Low technical knowledge. Overexploitation
Motivation. Financing to capacitated
Perishable product. Lack of organization. Lack of infrastructure. Seasonality of resources
No equitable distribution of income to fishermen.
Implementation of refrigeration equipment. Processing plant for added value products
5 3) Commercialization
Centralization. Lack of help for lack of trust
Deterioration of fishing fleet Agreement with the state to establish commercialization point Promotion o fish and seafood consumption
4 4) Organization/ Weak institutions
Political interference within the organizations. Lack of leadership
Poor protection of resources Insufficient management
Capacity building of new leaders. Participation of , and assessment by the university
Lack of consciousness from fishermen
Scarce fishing resources Ecological consequences
Management plans (authorities) 4 5) Overexploitation
Lack of control illegal fishing Affects the fisherman economy
Efficient control from the Navy and Ministry of Fisheries. Sanctions

Chapter 5 Livelihoods options, outcomes and constraints
135
Table 31 Identifying and ranking problems in Sechura. Workshop in Sechura in 2005
Total Points
Problem Causes Consequences Solutions
23 1) Pollution Fishmeal industry and industrial boats. Non-compliance of environmental norms No contamination limits
Disappearance of species Drastic control and sanctions. Relocation of fishmeal plants. Elaboration of contamination limits
Lack of control Effluent from the river Piura
Environmental risk which would limit possibility of export
Environmental education Waste water treatment Fund with boat owners and exporters to ensure sanitary accreditation
14 2) Overexploitation, high fishing effort
Open access. Oversized fleet. Transport of seeds and fishing of juveniles
Fleet regionalization. Promotion of aquaculture. Limit access to artisanal fisheries and capture quotas Protected area. Zoning moratorium
Lack of capacity building and compliance to norms. No environmental conscience
Scarce resources Poor success for scallop culture Scarcity of seeds in the Bahia. Low prices
Strengthening and control of authorities. Capacity building for fishermen - reactivation of a fishermen school
7 3) Corruption, deficiencies of policies and control
Bureaucracy. Lack of clear rules Lack logistical means Influence of the industrial sector
Discouragement, informality Disorder in the fishing activity Administrative procedures difficult Concessions only for industrial
Reform and modernize the state system Stronger presence of authorities Administrative decentralization Bay patrimony for artisanal fishing
7 4) Informality Inequity in the compliance of norms. Excesses of the bureaucracy No knowledge of administrative process
Corruption No incentive to be formal No access to credit Illegal fishing
Formalization of activities Simplify administrative procedures for better control and formalization
5 5) Lack of Infrastructures
Wrong state policy. No attention from the state Lack of budget and internal conflict in docks
No value of the production Pollution and sanitary problems
More investment from the state, NGO, private sector etc. More active participation from the population

Chapter 5 Livelihoods options, outcomes and constraints
136
is associated with
is cause of
is cause of
is cause of
is cause ofis cause of
is cause of
is cause of
is property of
is cause of
Lack Trust
Informality
No Management
Bureaucracy
Corruption
Weak Institutions
Analysis of the interviews triangulated the workshop data, with interviewees identifying
informality, lack of trust and overall weak institutional environment as the major causes
of the absence of adequate resource management. The Atlas.ti network view (Figure 30)
shows that the codes ‘Lack of trust’, ‘informality’ and ‘weak institutions’ are causal
factors that lead ‘No management’, code which refers to the absence or/and inadequate
management of resources (i.e. absence of management plan). The code bureaucracy was
also indirectly associated to inadequate management through corruption, lack of trust
and informality.
Figure 30 Network view of code “No management”
The slow administrative process and heavy bureaucracy is exemplified by the case of the
special concessions in Pisco. Special concessions for scallop aquaculture are renewable
every three years in the Paracas reserve but since 2001 fishermen associations were
awaiting for the approval of new concession licenses. The process to obtain a license is
tedious (Figure 31) and involves several organizations at the regional and national levels.
From 2001 to 2006 the process stalled due to the inability of fishermen to fulfill the

Chapter 5 Livelihoods options, outcomes and constraints
137
different perquisites (e.g. presentation and approval of a management plan), INRENA
and PRODUCE lack of communication as well as INRENA delay in approving the
licenses in order for PRODUCE to issue them. In February 2006 a fishermen association
was fined for undertaking aquaculture activities in an area since 200422. However
fishermen complained that they had indeed started the process to obtain a license in 2004
but the process plagued by bureaucracy constrained them to operate illegally. This
Kafkaesque situation illustrates how the institutional context can hinder the achievement
of livelihood outcomes.
Fishermen Association
Vice-Ministry of Fisheries
Dpt. Aqua.
INRENA
NavyPisco
DIREPROPisco
Dpt. Aqua.
Ministryof Agriculture
INRENAPisco
Vice-Ministry of Fisheries
Dpt. Aqua.
DIREPROPisco
Fishermen Association
Fines for activitieswithout permit
Process delayedUnable to agree
No communication between levels
Flow administrative procedures for concession licences
Fishermen Association
Vice-Ministry of Fisheries
Dpt. Aqua.
INRENA
NavyPisco
DIREPROPisco
Dpt. Aqua.
Ministryof Agriculture
INRENAPisco
Vice-Ministry of Fisheries
Dpt. Aqua.
DIREPROPisco
Fishermen Association
Fines for activitieswithout permit
Process delayedUnable to agree
No communication between levels
Flow administrative procedures for concession licences Flow administrative procedures for concession licences
Figure 31 Steps to obtain a special concessions in Pisco (below the green line) and Lima (above the green line)
The stronghold Lima, the capital, has on the decision making process despite the
regionalization effort is deeply felt not only by fishermen but also local authorities in
Pisco. However users recognize that devolution of power to local institutions with low
financial and technical capabilities will not lead to adequate management either:
“There is no development with centralism. The central government does not want to give power to the regional government (…) But these people are not prepared to assume responsibilities: ‘worst the cure than the disease’. Institutions here are not prepared.”
P50: UI-21-BB-Pisco.rtf - 50:2 & 50:3
22 R.D Nª 273-2006-PRODUCE/DINSECOVI published 24/04/2006

Chapter 5 Livelihoods options, outcomes and constraints
138
In Sechura, the regional office of the Vice-Ministry of Fisheries is actively involved in
zoning efforts regarding authorizations and concessions for scallop stock enhancement
and culture. While regional decrees are being promulgated at the regional level23,
workshop discussions highlighted that they could never be implemented without the tacit
accord from Lima: the ability to design management plans that respond to local needs,
crises and conflicts with users is hampered by this lack of autonomy.
5.7 Discussion
5.7.1 Occupational diversity or dependence on marine resources? Most analyses on income diversification in rural Peru are a by-product of the literature
on rural poverty and agriculture-based livelihoods (Escobal 2001), with no published
work on occupational diversity in coastal fishing communities. Half of agricultural
households’ net income in Peru is derived from non-farm activities, suggesting that
diversification could indeed exist in agrarian economies (Escobal 2001). The results
presented here are at variance with these findings and the general adage that livelihood
occupational multiplicity is becoming more common and more pronounced in rural areas
(Rigg 2006) and that coastal communities do not depend solely on fishing (van
Oostenbrugge et al. 2004). Dependence on fishing was extremely high on both sites with
few respondents engaged in any other activity. The average number of activities (1,34)
in which respondents were engaged was not associated with the type of gear,
emphasizing that low occupational pluralism is systemic. When engaged in other
activities, agriculture and moto taxis are the main source of alternative income on both
sites, with agriculture being more important in Sechura. Fishermen initially engaged in
fishing activities mainly because of poverty and lack of alternative opportunities
(‘economic hardship’). In this context in Pisco, fishing appears to be the occupation of
‘last resort’, a safety valve for the rural poor (Béné 2003) made possible by the open
access nature of aquatic resources in Peru. However, in Sechura the data provide some
caveats to this ‘old paradigm’ of fishing as a last resort. Indeed family tradition also
played an important role in the decision to engage in the activity. It suggests that fishing 23 i.e. RD Nº 007-2005-GRP-420020-100 for zoning of authorization areas

Chapter 5 Livelihoods options, outcomes and constraints
139
remains in certain circumstances a traditional occupation, entry being modulated by
kinship connections to the activity. Additionally on both sites, maybe surprisingly,
fishermen also stated that they entered fishing not because they were poor but because
they could generate more income and enjoyed their activity. This corroborates recent
literature suggesting that fishermen are not the ‘poorest of the poor’ (Allison and Ellis
2001; Béné 2003; Béné et al. 2003b). It also places emphasis on the occupational culture
and identity of fishing (Davis 1986) to which respondent adhered: the notion (true or
false) to be freer and more independent than in land locked activities.
The role of women in livelihood generation was also explored. Overall less than half of
the respondents reported that women in their household engaged in income generating
activities, the main ones being small businesses and pots-harvest activities in the fisheries
sector. More women in Pisco are engaged in an occupation, mainly in commercialization
of fisheries products. Interviews revealed that women from San Andres are the ones
leading the sales of their husbands’ catches, controlling the money flows, practices which
have been observed in other small-scale fisheries (Bennett 2005). The focus on gender
exploring occupational pluralism thus reveals that women are still a ‘human capital’
untapped in these communities, as few are involved in income generating activities.
Policies should aim at promoting not only women involved in fisheries, but also those
engaged in other income generating activities such as small businesses and agriculture.
On the whole the findings highlight the complexity behind the dynamics of livelihood
options on both sites. Diversification is not as prevalent as the literature would suggest,
with a high dependence on marine resources. Additionally engagement into fishing
activities is based on contextual socioeconomic variables, and is as much a choice as a
strategy motivated by necessity.
5.7.2 Seasonal migration as a livelihood strategy Migration has been identified has an important livelihood strategy on both study sites for
all types of gear, yet patterns and motivations behind migration processes are currently
poorly understood and researched in artisanal fishing communities in Peru. In other
small-scale fisheries, it has been shown that seasonal availability of fisheries resources

Chapter 5 Livelihoods options, outcomes and constraints
140
play an important role in shaping migration patterns (Marquette et al. 2002). Study
findings reveal strong seasonal patterns reflecting the distributional range of target
species on both sites. This seasonal mobility is made possible by the defacto open access
nature of the fisheries, open access being portrayed in the literature as facilitating
fishermen mobility (Curran 2002; Curran and Agardy 2002; Marquette et al. 2002).
However, the workshops and interviews revealed that a chorus of dissent is growing
among fishermen on both study sites, especially in regards to the exploitation of scallop
resources, a sedentary resource. Smith et al (2005) identified different types of livelihood
strategies in their study of inland fisheries in developing countries based on the level of
diversification. They argued that highly specialist full time fishermen needed restricted
access and effective management measures to sustain their incomes. Conversely
fishermen for which fishing was a subsistence activity of ‘last resort’ thrived in fisheries
characterized by open-access and overexploitation would often ensue. A successful, self-
regulated open access regime will not be ill-fated if fishermen were highly diversifying
and relying on other resources. It is argued here that in light of the findings artisanal
fisheries on both sites are experiencing an important shift since the development of the
scallop, and more broadly bivalve aquaculture, and the specialization and territoriality of
the diving fishery might in the long term hamper migration patterns.
5.7.3 Livelihood outcomes: what can income tell us? High poverty and social inequality remain striking features of the Peruvian society even
after recent periods of economic expansion (Valdivia 2004). In the year 2000, more than
half of the Peruvian population remained under the poverty line, with the rate increasing
two-thirds in rural areas (Valdivia 2004). In 2004 the poverty line was established by the
government at 113 soles per month (INEI 2004), which is less than forty dollars a month.
On both sites fishing income is greatly above the poverty line (on average between 642
and 934 soles), highlighting the fact that fishermen are not ‘the poorest of the poor’ as
argued before. If one focuses solely on economic outcomes, Sechura overall achieves
better livelihood outcomes than Pisco with higher incomes and lower family
expenditures. Moreover, distribution of income across quartiles is more heterogeneous
and skewed towards the top quartile in Sechura, implying that more fishermen are

Chapter 5 Livelihoods options, outcomes and constraints
141
economically well off than in Pisco. In the latter, income differences by type of fishing
activity was observed, with divers, beach fishermen and purse seiners using multiple
gears having a stronger tendency to be in the third quartile compared to other groups. In
Sechura no gear types are identified as significant predictor of income quartile, from
which one can speculate that income levels are not determined by the type of fishing
activity. Considering the high diversity and abundance of fisheries resources in the area
this is not surprising. While studies of rural livelihoods emphasize the importance of
income composition (Ellis et al. 2003), in this study occupational diversity (number of
activity) and income portfolio (type of activity) is not associated with income levels in
both sites. With these findings emphasis is placed again on the fact that fishing income is
playing a critical role in overall household income in both communities.
Finally the ownership of productive assets (possession of other properties such as land)
was found to be significantly correlated to household income on both sites, highlighting
the fact that diversification is not only engaging in different activities, it is also
possessing an array of assets. Here it is worth recalling the findings of Chapter 4 where
overall physical and human capitals in Pisco were higher than in Sechura. In the past,
distinct poverty profiles in Peru have been explained by the distinct regional allocation of
human, physical, financial and organizational assets as well as the endowment of public
goods (Escobal 2001) rather than solely individual income. Additionally, it has been
argued by several scholars that asset based measures are a more accurate measure of
socio-economic status than income (Filmer and Pritchett 2001; Vyas and Kumaranayake
2006). If only looking through the lens of income Sechura appears to achieve better
livelihoods outcomes, but in light of the findings in Chapter 4, the high level of income
and low level of human and physical capital rather highlight the failure to transform
household income into durable assets that would help build more resilience livelihoods.
Thus it is not all about maximizing income, but about reducing vulnerability through the
building of a resilient livelihood platform.

Chapter 5 Livelihoods options, outcomes and constraints
142
5.7.4 Institutional design and cross-scale interaction In Peru decentralization is a live policy issue (Muñoz et al. 2007) and it has been argued
that the power relationships between national, regional and local levels are characterized
by a fragile institutional system and self-seeking political system (Muñoz et al. 2007).
Hitherto, the institutional arrangements in the artisanal fisheries sector have not been the
subject of academic endeavors and government reform, the focus being on industrial
fisheries (see for instance Ibarra et al. 2000). The present analysis has shown that the
micro-macro interactions were inefficient, if existent. Efforts to decentralize political
powers and responsibilities in terms of fisheries management have clearly failed in
Sechura while in Pisco the interactions between users and the state are hampered by
bureaucracy and corruption, all of these affecting negatively fishermen livelihoods. From
a methodological perspective, this underlines the importance of not only conducting
studies at the micro levels in order to avoid “forging generally narrow and often static
interpretations of village conditions.” (Rigg 2006 p. 196). Within the debate about
‘rescale governance’ (Batterbury and Fernando 2006), it has been argued that the ability
to engage effectively at multiple scales is crucial for regional systems (Young 2002b) and
contributes to the resilience of social-ecological systems (SES) (Adger et al. 2005a). The
current latent centralism in the artisanal fisheries sector is thus a constraint to building
resilient SES, however it was acknowledged that decentralization in the context of local
institutions with low financial and technical capabilities will not lead to increased
resilience. The Peruvian state is thus left with a dual task: upgrade the capabilities at the
local level to manage the fisheries while ensuring that the devolution of not only
responsibilities but also power takes place. Initiatives such as those undertaken in
November 2006 by the government to allow regional offices to collect revenues from
fines in order to finance enforcement activity (PRODUCE 2006) are a first step in this
direction. Finally the findings challenge the current institutional design of de facto open
access. The government, with the promotion of aquaculture activities, hence private
property regimes, needs to evaluate the “spatial dimension of management”. Open access
is a central component of livelihood dynamics and while aquaculture offers economic

Chapter 5 Livelihoods options, outcomes and constraints
143
opportunities to fishermen, the lack of consideration in policies of migration patterns and
property rights that is currently observed will lead to un-sustainable outcomes.
5.8 Conclusion The level of dependence on marine resources has proved to be important in determining
the capacity to adapt to change (Turner et al. 2007) and diversification a form of self-
insurance (Barrett et al. 2001) and a building block of resilient livelihoods (Marschke and
Berkes 2006). The findings can thus suggest that fishermen on both sites are vulnerable to
external shocks due to their high reliance on fishing activities. Additionally, results
revealed that income measures are not an adequate tool for evaluating livelihoods
outcomes in the context of our case studies since it is the combination of public and
private assets that enhance the livelihood platform. The research also highlights the
importance of seasonal migration and how the de facto open access regime enables
fishermen to pursue this livelihood option. Finally, the findings contribute the ongoing
debate on decentralization in natural resource management and the need to not only
improve cross-scale interaction but also to upgrade the technical and financial capabilities
of regional institutions.

Chapter 6 Impacted, coping or adapting
144
CHAPTER 6
IMPACTED, COPING OR ADAPTING? FISHERMEN LIVELIHOOD SECURITY IN THE CONTEXT OF EL NINO
6.1 Introduction Important climatic drivers in fish production systems include: water temperature,
precipitation oceanographic variables such as wind velocity and wave action. Changes to
these drivers can bring about significant changes to ecosystems and their resident fish
populations. Changes to aquatic ecosystems can disrupt ecosystem functioning, bring
about changes to the population dynamics of fish stocks and thereby impact on fish
production. These changes can significantly affect fishermen dependent on fluctuating
resources for their livelihoods and can be coupled with floods, drought and other type of
extreme events that can engender negative livelihood outcomes. The impacts of climatic
stress can be linked to the various elements of the livelihood framework (Balgis et al.
2005; Elasha et al. 2005). In this context, changes in assets reflect not only the degree of
impact, but also the coping and adaptive capacity of fishermen. Coping strategies are
short-term and immediate responses to disturbances (Vasquez-Leon et al. 2003). Coping
does not emphasise the strategic nature of planned adaptation, putting more stress on
reactive responses, self-organisation that does not involve major changes in social-
ecological systems. Adaptive strategies are more permanent changes that people make in
their livelihoods (Vasquez-Leon et al. 2003) and can either be a process, action or
outcome in a system in order to better adjust, cope and manage changing conditions (Smit
and Wandel 2006) and ultimately enhance resilience. Responses mechanisms such as
adaptation and coping practices can be differentiated along several dimensions: by spatial
scale (local, regional, national), by sector of activity or by actors (individuals,
communities, governments) (Adger et al. 2007).

Chapter 6 Impacted, coping or adapting
145
6.2 Objectives and methods This chapter explores how fishermen livelihoods security is maintained during EN. It
seeks to assess how assets change and how fishermen respond to these changes in their
livelihood platform. The objective is to understand what coping and adaptation strategies
fishermen adopt in Pisco and Sechura. While the Chapter focuses on individual
adaptation, it is also complemented by a succinct analysis of government responses in the
region of Piura.
6.2.1 Workshop and interviews The interviews and workshops conducted between March 2005 and March 2007 in both
sites provide evidence for the types of impact and response fishermen and institutions
undertook. Interviews to fishermen and women aimed to elucidate the type of impact and
the different strategies adopted by individual and households to cope with changes.
Interviews to local authorities and aid organizations in Piura had for objective a better
understanding of government’s responses to disruption in fishing communities. Finally
the workshops provided the opportunity to explore if the current changes in the scallop
fishery, especially in Sechura, are part of an adaptation process.
6.2.2 Fishermen survey The notion of the five capitals (natural, physical, human, social and financial) is used,
albeit loosely, to capture and analyze fishermen perceptions of impacts of EN and coping
and adaptation strategies. A section of the questionnaire focused on the impact on fishing
activity, asking respondents to specify what were their target species and if they changed
fishing zones during EN. An open-ended question elucidated how their fishing activity
was impacted by the event and what coping strategies they adopted (if they changed
activity, which one). A second section of the questionnaire focused on impacts on
households and if they could cope on their own (“did you need help during EN?”).
Households were loosely defined as people living in the same dwelling. Finally, a series
of question elucidated if formal social networks and organization played a role in the
coping strategies (“did you received help?”; “from whom?”).

Chapter 6 Impacted, coping or adapting
146
6.3 Impact of EN on Natural capital In an open ended question fishermen were asked what their main target species were
during EN. A total of 49 species were reported by fishermen and answers, after presence-
absence codification, were divided into fish and invertebrate species and descriptive
statistics are presented in Tables 32 and 33. The most mentioned littoral fish species were
seabass (6%), weakfish (6%) and pompano (4%). For pelagic fish species, mullet (15%),
bonito (6%), perico (6%) and chub mackerel (4%) were the most important target species.
In terms of invertebrates, scallop (37%) and octopus (17%) were the most mentioned
ones. Shrimp (10%) and prawn (5%) were also mentioned as important invertebrate
species but mostly in the North. Significant differences (p<0,05) across sites are observed
for a variety of species (Table 32). Most significant differences (p<0,01) for littoral fishes
are for fish only reported in Sechura: the banded croaker (5%) and weakfish (13%), to the
exception of seabass (11% versus 2% in Pisco). For pelagic species mullet and sierra
experienced the greatest differences among sites, with mullet being an important target
species in Sechura (23% versus 8% in Pisco) while sierra was not mentioned (5% in
Pisco). Scallop, an invertebrate which is traditionally the target species of the diving
fishery, also experiences a striking difference among sites, being consistently more
reported in Pisco than Sechura (65% versus 8%), which is consistent with sharp decreases
in abundances in the North. It is also worth noting that it is by far the most mentioned
target specie in Pisco, highlighting its importance for the artisanal sector during EN in
that area. Conversely, octopus is more reported in the North (25% versus 10%) and with
mullet is the most important target specie in Sechura. Finally, invertebrate species that are
not the target of the diving fisheries (i.e. shrimp and giant squid) were either not reported
or represented only 1% (shrimp and lobster) of the answers in Pisco.

Chapter 6 Impacted, coping or adapting
147
Table 32 Target species across sites, means of valid multiple responses. Shaded areas with P values<0,05 and * P values<0,01 (Table continues next page).
a. Binary variables (1=presence; 0=absence), mean can be read as percentages b. Computed using Mann Whitney U test 2-tailed
Sechura Pisco All Sites Z scoreb P Value Speciesa (n=208) (n=220) (n=428) Mean Std.
Deviation Mean Std.
Deviation Mean Std.
Deviation
Scientific Name Littoral fish Labrisomus sp. Blenny fish 0,01 0,10 0,01 0,10 0,01 0,10 -0,056 0,955 Acanthistius pictus Brick seabass 0,00 0,07 0,00 0,00 0,00 0,05 -1,028 0,304 Isacia conceptionis Cabinza grunt 0,00 0,07 0,02 0,15 0,01 0,12 -1,574 0,115 Arius sp. Catfish 0,00 0,07 0,00 0,00 0,00 0,05 -1,028 0,304 Seriolella sp. Choicy ruff 0,00 0,00 0,00 0,07 0,00 0,05 -0,972 0,331 Anisotremus scapularis Grunt- Peruvian 0,01 0,10 0,01 0,12 0,01 0,11 -0,386 0,699 Rhinobatos planiceps Guitarfish-Pacific 0,02 0,14 0,01 0,10 0,01 0,12 -0,891 0,373 Menticirrhus sp. Kingcroaker 0,00 0,00 0,02 0,15 0,01 0,11 -2,184 0,029 Sciaena deliciosa Lorna drum 0,00 0,07 0,01 0,10 0,01 0,08 -0,530 0,596 Stellifer minor Minor Stardrum 0,00 0,07 0,01 0,12 0,01 0,10 -0,948 0,343 Citharichthys sp. Pacific sanddab 0,01 0,12 0,01 0,12 0,01 0,12 -0,069 0,945 Paralonchurus peruanus Peruvian banded
croaker 0,05 0,22 0,00 0,00 0,03 0,16 -3,452 0,001* Trachinotus paitensis Pompano 0,02 0,14 0,06 0,24 0,04 0,20 -2,285 0,022 Myliobatis sp. Ray 0,01 0,10 0,02 0,15 0,02 0,13 -1,068 0,286 Paralabrax sp. Seabass-Peruvian 0,11 0,31 0,02 0,13 0,06 0,24 -3,925 0,000* Epinephelus sp. Snowy grouper 0,02 0,14 0,00 0,00 0,01 0,10 -2,064 0,039 Prionotus sp. Volador 0,00 0,00 0,01 0,10 0,00 0,07 -1,377 0,169 Cynoscion analis Weakfish-Peruvian 0,13 0,34 0,00 0,00 0,06 0,24 -5,514 0,000* Pelagic Fish Engraulis ringens Anchovy 0,02 0,14 0,04 0,19 0,03 0,17 -1,072 0,284 Sarda chiliensis chiliensis Bonito-Eastern
Pacific 0,03 0,17 0,08 0,27 0,06 0,23 -2,378 0,017 Scomber japonicus Chub mackerel 0,05 0,22 0,03 0,16 0,04 0,20 -1,354 0,176 Cilus Gilberti Corvina 0,01 0,10 0,00 0,07 0,01 0,08 -0,628 0,530 Not Specified Fish 0,01 0,12 0,00 0,07 0,01 0,10 -1,060 0,289 Trachurus picturatus murphyi Jack mackarel 0,02 0,15 0,03 0,18 0,03 0,17 -0,487 0,626

Chapter 6 Impacted, coping or adapting
148
Table 32 Target species across sites, means of valid responses, Shaded areas with P values<0,05 and * P values<0,01 (continued from previous page)
Sechura Pisco All Sites Z scoreb P Value Speciesa (n=208) (n=220) (n=428) Mean Std.
Deviation Mean Std.
Deviation Mean Std.
Deviation
Scientific Name Pelagic Fish Coryphaena hippurus Perico, dolphinfish 0,04 0,19 0,08 0,27 0,06 0,23 -1,709 0,087 Sardinops sagax sagax Sardine 0,03 0,17 0,01 0,10 0,02 0,14 -1,507 0,132 Not Specified Shark 0,00 0,00 0,01 0,10 0,00 0,07 -1,377 0,169 Scomberomorus sierra Sierra 0,00 0,00 0,05 0,21 0,02 0,15 -3,108 0,002* Odontesthes regia regia Silverside 0,00 0,07 0,02 0,13 0,01 0,11 -1,285 0,199 Mustelus sp.,Triakis sp. Smoothhound 0,04 0,19 0,02 0,13 0,03 0,17 -1,269 0,205 Thunnus sp. Tuna 0,01 0,10 0,00 0,00 0,00 0,07 -1,456 0,145 Anchoa nasus White anchovy 0,00 0,00 0,01 0,10 0,00 0,07 -1,377 0,169
Invertebrates Diving fishery
Concholepas concholepas) Abalone 0,00 0,00 0,00 0,07 0,00 0,05 -0,972 0,331 Gari solida Clam 0,00 0,07 0,00 0,07 0,00 0,07 -0,040 0,968 Cancer sp. Crab 0,00 0,00 0,01 0,10 0,00 0,07 -1,377 0,169 Aulacomya ater Mussel 0,00 0,07 0,03 0,16 0,02 0,13 -1,829 0,067 Octopus mimus Octopus 0,25 0,43 0,10 0,29 0,17 0,37 -4,134 0,000* Atrina maura Penshell 0,01 0,10 0,00 0,00 0,00 0,07 -1,456 0,145 Tagelus dombeii Razor clams 0,00 0,00 0,01 0,12 0,01 0,08 -1,688 0,091 Argopecten purpuratus Scallop 0,08 0,27 0,65 0,48 0,37 0,48 -12,249 0,000* Not specified Shellfish 0,01 0,10 0,00 0,07 0,01 0,08 -0,628 0,530 Stramonita sp. Snails 0,09 0,28 0,05 0,22 0,07 0,25 -1,501 0,133 Mesodesma donacium Surf clam 0,01 0,12 0,00 0,00 0,01 0,08 -1,785 0,074 Invertebrates Nets
and Lines
Dosidicus gigas Giant squid 0,03 0,18 0,00 0,00 0,02 0,13 -2,740 0,006* Panulirus gracilis Lobster 0,05 0,21 0,01 0,10 0,03 0,17 -2,439 0,015 Xiphopenaeus sp. Prawn 0,09 0,29 0,00 0,07 0,05 0,21 -4,248 0,000* Not speficified Shrimp 0,19 0,40 0,01 0,12 0,10 0,30 -6,138 0,000* Loligo gahi Squid 0,05 0,21 0,00 0,00 0,02 0,15 -3,287 0,001*
a. Binary variables (1=presence; 0=absence), mean can be read as percentages b. Computed using Mann Whitney U test 2-tailed

Chapter 6 Impacted, coping or adapting
149
To explore the variance within the data taking into account the type of fishing activity
(gear) in each site a principal component analysis was undertaken. In Sechura two
components were extracted, accounting for 69,41%, and 4,88% respectively of the total
variance, and between them account for 74,29% of the variance. Based on factor scores
(Table 34), the first component consisted of items related to octopus, snails and mullet
species, with octopus heavily loading on the factor. In the second component, highest
loadings were for littoral species weakfish, seabass and banded croaker. Components one
and two are graphically represented in Figure 32.A. Similarly in Pisco two components
were extracted, accounting for 73,23% and 5,04% respectively of the total variance, and
between them account for 78,27% of the variance. Based on factor scores (Table 34), the
first component mainly consisted of species scallop, mullet and pompano, with scallop
having the highest loading. The second component included octopus and bonito, with
octopus having the highest loadings. Components one and two are graphically
represented in Figure 32.B. The results show that in Sechura octopus explains the main
variance within the data set while in Pisco the variance is explained by scallop and
mullet. In none of the sites the type of gear plays role in explaining the variance.

Chapter 6 Impacted, coping or adapting
150
Octopus (69%)
Litt
oral
fish
(5%
)
A)
Scallop and mullet (73%)
Oct
opus
& b
onito
(5%
)
B)
Octopus (69%)
Litt
oral
fish
(5%
)
A)
Scallop and mullet (73%)
Oct
opus
& b
onito
(5%
)
B)
Figure 32 Component plot of fishing activity and target species for Sechura (A) and Pisco (B)

Chapter 6 Impacted, coping or adapting
151
Table 33 Target species and type of fishing activity: Component loadings (Table continues next page)
Sechura Pisco Component (% of variance) C1
(69,41) C2 (4,88)
C1 (73,23)
C2 (5,04)
Fishing activity -0,322 -0,040 0,159 0,252 Scientific Name Littoral fish Labrisomus sp. Blenny fish 0,185 0,044 0,017 -0,190 Acanthistius pictus Brick seabass 0,150 -0,024 - - Isacia conceptionis Cabinza grunt 0,024 0,224 0,140 0,233 Arius sp. Catfish -0,055 -0,057 Seriolella sp. Choicy ruff -0,055 0,113 Dosidicus gigas Grunt- Peruvian 0,025 0,150 0,169 0,028 Rhinobatos planiceps Guitarfish-Pacific -0,067 -0,074 0,132 -0,008 Menticirrhus sp. Kingcroaker 0,371 -0,039 Sciaena deliciosa Lorna drum -0,022 0,014 0,144 -0,001 Stellifer minor Minor Stardrum -0,074 -0,060 0,223 -0,023 Citharichthys sp. Pacific sanddab -0,058 -0,048 0,162 -0,033 Paralonchurus peruanus Peruvian banded croaker -0,194 0,413 - - Trachinotus paitensis Pompano -0,057 0,108 0,554 0,029 Myliobatis sp. Ray -0,023 -0,027 -0,014 0,137 Paralabrax sp. Seabass-Peruvian 0,086 0,643 0,115 0,012 Epinephelus sp. Snowy grouper 0,062 0,031 - - Prionotus sp. Volador 0,031 0,048 Cynoscion analis Weakfish-Peruvian -0,188 0,760 - - Pelagic Fish Engraulis ringens Anchovy -0,032 -0,042 0,112 0,044 Sarda chiliensis chiliensis
Bonito-Eastern Pacific -0,050 0,236 0,057 0,599
Scomber japonicus Chub mackerel -0,112 0,291 0,092 0,154 Cilus Gilberti Corvina -0,024 0,076 0,058 0,037 Not Specified Fish 0,115 -0,041 -0,041 -0,007 Trachurus picturatus murphyi
Jack mackarel -0,088 0,195 0,080 0,281
Mugil cephalus Mullet -0,475 -0,258 0,716 -0,054 Coryphaena hippurus Perico, dolphinfish -0,032 0,007 -0,217 0,516 Sardinops sagax sagax Sardine -0,083 -0,062 -0,015 0,009 Not Specified Shark -0,163 0,165 Scomberomorus sierra Sierra 0,303 0,104 Odontesthes regia regia Silverside -0,010 0,084 0,266 0,076 Mustelus sp.,Triakis sp. Smoothhound -0,095 0,152 -0,272 0,242 Thunnus sp. Tuna 0,064 0,078 - - Anchoa nasus White anchovy 0,099 -0,029
Extraction Method: Principal Component Analysis. Rotation Method: Varimax with Kaiser Normalization. Empty cells: variable had zero variance

Chapter 6 Impacted, coping or adapting
152
Table 34 Target species and type of fishing activity: Component loadings continued from Table 6.X
Sechura Pisco Component (% of variance) C1
(69,41) C2 (4,88)
C1 (73,23)
C2 (5,04)
Scientific Name Invertebrates Diving fishery
Concholepas concholepas)
Abalone -0,003 -0,138
Gari solida Clam 0,145 -0,026 -0,028 -0,057 Cancer sp. Crab 0,030 -0,009 Aulacomya ater Mussel -0,011 -0,001 -0,042 -0,098 Octopus mimus Octopus 0,939 -0,048 0,036 -0,670 Atrina maura Penshell 0,166 -0,055 Tagelus dombeii Razor clams -0,006 -0,119 Argopecten purpuratus Scallop 0,199 0,037 -0,754 -0,461 Not specified Shellfish -0,026 -0,002 0,019 0,009 Stramonita sp. Snails 0,528 -0,023 -0,012 -0,335 Mesodesma donacium Surf clam -0,057 0,061 Invertebrates Nets and Lines Anisotremus scapularis Giant squid 0,051 0,001
Panulirus gracilis Lobster 0,338 -0,104 -0,019 -0,111 Xiphopenaeus sp. Prawn -0,304 -0,130 0,063 0,033 Not speficified Shrimp -0,209 -0,242 -0,004 -0,089 Loligo gahi Squid 0,041 0,068
Extraction Method: Principal Component Analysis. Rotation Method: Varimax with Kaiser Normalization. Empty cells: variable had zero variance
6.4 Impact of EN on fishing activities and fishermen responses
6.4.1 Impact on fishing activities Fishermen were asked in an open ended question how EN affected their fishing activities.
Four main components were extracted from the numerous codes the answer generated:
impacts on fishing incomes, on the environment, commercialization and operational
costs, and for each component significant differences were observed between sites (Table
35). Impact of EN on income followed opposite trends in Sechura and in Pisco, with a
68% decrease and 72% increase in income respectively. Difficult commercialization of
products, code which encompasses damages to infrastructures such as roads and docks
and decrease in price of certain species due to high abundance, was a particular concern
in Sechura (10%):

Chapter 6 Impacted, coping or adapting
153
“There was enough squid, and mullet because of the freshwater but we could not bring them to the markets because of the broken roads; prices were low because nobody could buy due to the low economy; the bridge fell, we had to move with chalanas [small boats]” Survey ID 293 Purse seiner Sechura In Pisco and Sechura an increase in operational costs was also one of the main impacts
fishermen identified (25% and 22%). In both sites the re-tooling costs (nets, compressor
etc.) provided some strain to income. Additionally, in Pisco fishermen had to sometimes
go further than their traditional fishing grounds and inflation was permeating with prices
of petrol and food rising due to the high demand:
“(…) Operational costs increased by 100%, the petrol to go and find fishing zones where the commercial sizes [of scallop] is bigger. The trip to go to the work zone increased and the food.” Survey ID 78 Diver_other Pisco In Sechura fishermen especially complained about the rising prices of food which made
trips at sea more expensive (and as such considered a separate category in the coding) and
the costs of adapting to new species such as the mullet. Additionally, fishing activities
were hampered by adverse weather conditions (‘mar movida’, ‘the moving sea’ and the
constant rains):
“I went for the mullet in the lagoon (…), there was enough but the price was low and the rain would not let us work; there was not enough income from fishing, we were in debts (…)” Survey ID 295 Gill and drift nets Sechura “The scallop disappear; I had to buy new equipment; the rains was paralyzing us, we did not go out [at sea], we waited for it to pass; there was product, but going bad because the buyers were in Chiclayo and they could not use the highway” Survey ID 256 Diver Sechura
Significant differences between sites were observed in terms of the abundance of
resources, with more fishermen in Sechura mentioning they saw a decrease in species
available to them (6% versus 2%). In Pisco more fishermen mentioned that their
operational costs remained constant (5% versus 1%).

Chapter 6 Impacted, coping or adapting
154
Table 35 Impact of EN on economic activitya across sites. Shaded areas with P values <0,05
Sechura Pisco All Sites Z scores P value n=266 n=221 n=487 Mean Std.
Deviation Mean Std.
Deviation Mean Std.
Deviation
Fishing Income Increase 0,14 0,35 0,72 0,45 0,40 0,49 -12,894 0,000 Decrease 0,68 0,47 0,10 0,29 0,41 0,49 -12,938 0,000 Constant 0,15 0,36 0,18 0,38 0,16 0,37 -0,759 0,448 Environment Increased Fish.Res. 0,08 0,27 0,08 0,27 0,08 0,27 -0,101 0,919 Decreased Fish.Res. 0,06 0,25 0,02 0,13 0,04 0,20 -2,475 0,013 Negative Env.Factors 0,07 0,26 0,01 0,12 0,05 0,21 -3,057 0,002 Commercialization Difficult 0,10 0,30 0,01 0,09 0,06 0,23 -4,182 0,000 Good 0,01 0,09 0,01 0,09 0,01 0,09 -0,186 0,852 Operational costs Increased 0,22 0,42 0,25 0,43 0,23 0,42 -0,702 0,483 Decreased 0,00 0,00 0,01 0,12 0,01 0,08 -1,904 0,057 Increase in Food $ 0,10 0,30 0,01 0,12 0,06 0,24 -3,904 0,000 Constant 0,01 0,09 0,05 0,23 0,03 0,17 -3,073 0,002
a.Binary variables (1=presence; 0=absence), mean can be read as percentages of valid answers to open-ended question b. Computed using Mann Whitney U test 2-tailed

Chapter 6 Impacted, coping or adapting
155
6.4.2 Responses to changes in natural capital Fishermen were asked if during EN they performed any changes in their activities.
Overall respondents mentioned undertaking changes (64,8%) and a significant difference
among site was observed (X2 6,463= d.f.=1,00, p<0,05) with fishermen in Sechura
performing changes in a higher proportion (Table 36). Based on the classification tree
method, with change of activity as a dependent variable and type of gear as dependent
one, no groups were identified in both sites. Fishermen were then asked in an open ended
question what type of change they undertook (Table 36). In Pisco changes were mainly
made in the fishing activity, with changes in target species and gear, a high number of
fishermen especially mentioning a switch to scallop or/and diving (44,4%). In Sechura
responses included changes in target species and gear as well as working in processing
plants. A significant number of respondents (44,9%) exited the fisheries sector to
undertake agriculture activities or pursue activities such as carpenter (‘worker’ code) and
moto-taxi driver. Additionally 5,1% of respondents in Sechura mentioned they were
unable to pursue any income generating activities.
Table 36 Strategies to cope with changes in natural capital. Percentage of valid answers.
Sechura Pisco All Sites n=249 n=95 n=344 Change Yes 70,2 50,9 64,8 Type of Change Within the fishery sector 49,9 77,7 56 Species 20,4 18,5 20 Gear 18,3 11,1 16,8 Diving (scallop) 2 44,4 11,2
Worker fishing indus.
9,2 3,7 8
Outside the fisheries sector 44,9 22,2 40 Agriculture 16,3 7,4 14,4 Worker 11,3 14,8 12 Moto taxi 11,2 0 8,8 Other 6,1 0 4,8 No work 5,1 0 4

Chapter 6 Impacted, coping or adapting
156
When desegregating these results by gear type with the classification tree method a
difference could be observed, albeit not between sites (Figure 33). The diver, diver and
other, and trawler groups are significant predictor of change in target species while the
others gears are a significant predictor of changing activity specifically to diving.
Figure 33 Classification tree (CHAID growing method) with dependent variable Type of change and independent variables: Site and Fishing activity.
In a separate question fishermen were asked if they changed fishing zones during EN.
The majority of fishermen responded by the affirmative (59,2%) with no differences
between sites and gear groups identified (p>0,05). In Pisco the majority of the migratory
movement took place within the province, mainly to Bahia de Independancia (63,2%),
where several scallop banks are located. Additionally a smaller percentage mentioned
having to go more offshore than usual (Figure 34). In Sechura migration patterns are
more diversified. Fishermen either migrated towards the North (30,2%), in ports like
Paita and Talara or went to the Isla Lobos de Tierra (17,5%). In these areas shrimp and
squid fisheries operated. Migration within the bay also occurred (23%), and a number of
respondents specifically mentioned fishing in the Laguna La Niña, the lagoon created due

Chapter 6 Impacted, coping or adapting
157
to the increased water flow into the Bocana de Virrila estuary. Additionally, fishermen
also migrated to the centre and south of the country (16,7%).
0
10
20
30
40
50
60
70
Bahia
Indep
.
Bahia
Paraca
s
Bahia
Sechu
ra
Centre
Near C
oast
Islas
Lobo
s
Islas
Pisco
La N
ina La
goon
Far Coa
stNort
hOthe
rSou
th
SechuraPisco
Figure 34 Changes in fishing zones during EN. Percentage of valid answers.
6.4.3 Integrated view of impacts and response strategies In order to obtain a better understanding of what key variables explain the variance
within the data a principal component analysis (PCA) was performed for each sites. In
Sechura a first attempt was made to perform a PCA taking into account fishing activity as
one of the variable but only one component could be extracted. Indeed fishing activity
was the key variable explaining the variance within the data (factor loading 1,845). For
Pisco two components were extracted accounting for 65,96% and 9,05% respectively of
the total variance, and between them account for 75,01% of the variance. Based on factor
scores (Table 37), the first component consisted of changes in the activity and fishing
income and the second one on fishing activity. In stark contrast to Sechura, fishing
activity in Pisco thus accounts for very little of the variance in the data, changes in the
activity (fishermen response) being a more important factor.

Chapter 6 Impacted, coping or adapting
158
Table 37 Impacts of EN on fishing activity: Component loadings
Sechura Pisco Component (% of variance) C1 C1 (65,96) C2 (9,05) Fishing Activity 1,845 0,060 0,997 Fishing Income Increase 0,019 -0,630 0,042 Decrease 0,033 0,652 -0,127 Constant -0,032 0,074 -0,035 Changes in Activity Changes in Activity -0,040 0,792 0,078 Changes in fishing grounds -0,006 0,386 0,241 Environment Increased Fish.Res. 0,015 -0,019 -0,178 Decreased Fish.Res. -0,013 Negative Env.Factors -0,026 0,309 -0,147 Commercialization Difficult -0,010 -0,013 -0,236 Good 0,022 0,036 -0,237 Operational costs Increased -0,028 -0,288 0,407 Decreased -0,099 0,298 Constant -0,005 -0,167 -0,011 Increase in Food $ 0,029 - -
Extraction Method: Principal Component Analysis. Rotation Method: Varimax with Kaiser Normalization. Empty cells: variable had zero variance
6.5 Impact on households Overall 58,1% of respondents felt that EN had a negative effect on their households.
Significant differences are observed between sites (X2=196,250 d.f.=3,00, p<0,05), with
negative effects being strongly felt in Sechura compared to Pisco (86,6% compared to
20,6%). When desegregating these results by gear type no significant differences were
found in Sechura (p>0,05). Conversely in Pisco the divers, beach fishermen and purse-
seiners using several gears group was identified as a good predictor of positive impact on
households compared to other gear groups (Figure 35). This reveals that in Sechura
whether fishermen are impacted by EN at the household level is not necessarily
dependent on their type of activity while in Pisco being a diver, beach fishermen and

Chapter 6 Impacted, coping or adapting
159
purse seiners is a good predictor of perceiving positive impacts.
Node 0Category % n
37,2 1511,00058,1 2362,000
2,5 103,0002,2 94,000
Total 100 ,0 406
SiteAdj. P-value=0,000, Chi-
square=196,250, df=3Code Impact
Node 1Category % n
8,2 191,00086,6 2002,000
3,0 73,0002,2 54,000
Total 56,9 231
S1
Node 2Category % n
75,4 1321,00020,6 362,000
1,7 33,0002,3 44,000
Total 43,1 175
FISHING_ACTAdj. P-value=0,000, Chi-square=33,
024, df=3S2
Node 3Category % n
88,2 1051,00010,1 122,000
0,8 13,0000,8 14,000
Total 29,3 119
DIVER; PS_OTHER; BEA_FI; <blank>
Node 4Category % n
48,2 271,00042,9 242,000
3,6 23,0005,4 34,000
Total 13,8 56
PS; GD; DI_OTHER; HL
Figure 35 Classification tree (CHAID growing method) with dependent variable Type of impact (1.Positive, 2. Negative, 3.More or less, 4.No effect) and independent variables: Site and Fishing activity.
Fishermen were then asked in an open ended question to specify what kind of impacts
their household experienced (Table 38). As expected striking differences were observed
between sites (p<0,01). In Sechura most respondents reported damages to dwellings,
partial or total (57%). During the workshop conducted in 2005 (Chapter 4) participants
stressed the fact that most dwellings around Sechura bay were located in low-lying areas
subject to floods. In Parachique, after the last EN a coastal defense was built to protect
the settlement as observed during village walks. Interviews revealed that fishermen are
aware that this protection might no be sufficient and re-location to more sheltered areas
necessary. Nevertheless, they appear to have a selective acceptance of risk when it comes
to housing. Inhabitants consider moving an expensive solution, especially since most of
them do not have a land title, being unable to sell and re-invest the money in a new
parcel.

Chapter 6 Impacted, coping or adapting
160
Table 38 Type of impact on households of EN across sites. * P values<0,01
Sechura Pisco All sites Z P value (n=270) (n=202) (n=472)
Mean Std.
Deviation Mean Std.
Deviation Mean Std.
Deviation
Household Revenues Increased 0,03 0,17 0,58 0,50 0,26 0,44 -13,330 0,000* Decreased 0,19 0,39 0,14 0,35 0,17 0,38 -1,274 0,203 Constant 0,03 0,17 0,09 0,29 0,06 0,23 -2,814 0,005* Physical and Productive Assets Loss of house 0,57 0,50 0,01 0,07 0,33 0,47 -12,781 0,000* Loss of house equip. 0,03 0,17 0,00 0,00 0,02 0,13 -2,451 0,014 Purchase of Fishing equip. 0,01 0,09 0,15 0,36 0,07 0,26 -6,168 0,000*
Purchase of House 0,01 0,09 0,19 0,39 0,09 0,28 -7,007 0,000* Purchase of House equip. 0,01 0,12 0,19 0,39 0,09 0,29 -6,562 0,000*
Purchase of Land 0,00 0,06 0,09 0,28 0,04 0,19 -4,527 0,000* Assets did not increase despite gain
0,01 0,09 0,06 0,24 0,03 0,17 -3,305 0,001*
Commercialization routes and Basic Household Products
Difficult 0,12 0,32 0,04 0,18 0,08 0,27 -3,146 0,002* Good 0,00 0,06 0,01 0,10 0,01 0,08 -0,843 0,399 Lack of basic household products
0,19 0,39 0,04 0,20 0,12 0,33 -4,741 0,000*
More basic household products 0,00 0,06 0,09 0,29 0,04 0,20 -4,682 0,000* Human Capital Diseases 0,05 0,21 0,01 0,10 0,03 0,18 -2,341 0,019 Ability for More education 0,00 0,06 0,06 0,24 0,03 0,16 -3,679 0,000* New skills 0,01 0,11 0,04 0,18 0,02 0,14 -1,766 0,077 Not affected 0,14 0,35 0,04 0,18 0,09 0,29 -3,763 0,000*
a. Binary variables (1=presence; 0=absence), mean can be read as percentages.b. Computed using Mann Whitney U test 2-tailed

Chapter 6 Impacted, coping or adapting
161
Fishermen also mentioned a decrease in household revenues (19%) and the lack of basic
household products such as staple foods like rice, cooking oil and sugar (19%). Other
challenges faced by households are the damage of access roads and public infrastructures
which hinders the commercialization of staple foods and business activities, limiting
fishermen options to diversify:
“The flood did not affect the house where I live because I live in the higher ‘part’ but it affected me economically, there is no more work and you cannot diversify because there is nothing.”
Survey ID 146 Diver Sechura
“The movement of food and petrol was impossible due to the bad state of the highway; you could not sell nor buy anything; there was no food.”
Survey ID 233 Diver Sechura
Furthermore fishermen mentioned an increase in diseases (5%), ranging from gastric
diseases to malaria:
“Water came into the house because of the rains (…) there were mosquitoes that caused diseases.”
Survey ID 285 PurseSeiner_Other Puerto
In Pisco EN overall had a positive impact on household revenues, with 58% of
respondents mentioning an increase. Additionally, respondents mentioned they were able
to build or purchase a house and buy household equipment such as televisions (19%), as
well as buying land and providing better food for their families (9%). In terms of human
capital increased revenues were invested in education of the respondents or dependants
(6%) and EN gave them the opportunity to learn new skills, diving (4%). Fishermen also
reported that the increase in revenues allowed them to acquire new fishing equipment
(nets, boats, diving suit etc.):
“Really good fishing seasons, there was work for everybody. I did not know how to dive
but necessity made me learn. I bought a house and two boat s(…).”
Survey ID 17 Diver San Andres

Chapter 6 Impacted, coping or adapting
162
Nevertheless, some respondents also mentioned that despite an increase in their revenues
they did not increase their asset base by making investments (6%).
6.6 Social capital: did fishermen and their household cope Fishermen were asked if they required assistance during EN. Not surprisingly site
differences were observed (X2=54,965 d.f.=1,00, p<0,05), with 56,4% of fishermen
needing help in Sechura compared to only 23,77% in Pisco. When desegregating these
results by gear types no significant differences were found in Sechura (p>0,05) (Figure
36). The results show that the type of fishing activity is not a good predictor for whether
fishermen required help. Conversely in Pisco the divers, beach fishermen and fishermen
using gill and drift and other gears nets group was identified as a good predictor of
requiring no assistance compared to other gear groups.
Figure 36 Classification tree (CHAID growing method) with dependent variable “Needed help?” (0.No 1.Yes) and independent variables: Site and Fishing activity.
In Sechura and Pisco only a small number of respondents mentioned having received
assistance (16,08% and 8,74%). In Sechura emergency aid to households came primarily
from the government (54,08%) through regional and national programs such as Civil
Defense and the National Program for Food Assistance (Programa Nacional de Asistencia
Alimentaria – PRONAA). Respondents specifically singled out assistance from
municipalities (22,45%) who are an essential nexus for delivering aid coming from
outside the province. Finally, fishermen mentioned receiving assistance from financial

Chapter 6 Impacted, coping or adapting
163
institutions such as banks and cooperatives (11,22%). Family and friends, as well as civil
society (NGOs and religious groups) also played an important role in providing
assistance (Figure 37). It is worth noting that fishermen associations are not part of
fishermen coping strategies, providing only 1,02% of the aid received. Responses in
Pisco differ, with family and fishermen associations having a greater role in providing
assistance with 26% and 12% respectively compared to 14% for government. In terms of
aid, households in Sechura mainly received food and construction material to rebuild
houses. In Pisco assistance mainly consisted of economic aid.
0
10
20
30
40
50
60
Family
Govern
ment
Fishing
Cie
Own
Munici
pality
Financia
l Entiti
es
Fisherm
en Ass
oc.
Friend
s
NGO Reli
gious
grps
SechuraPiscoAll Sites
Figure 37 Who provided assistance during EN? Percentage of valid answers.
0
10
20
30
40
50
60
Food
Con
stru
ctio
nM
ater
ial
Loan
s
Econ
omic
Def
ense
agai
nst f
lood
s
Med
ical
and
othe
r
Rep
arat
ion
publ
icin
frast
ruct
ure
Rep
arat
ion
fishi
ngin
frast
ruct
ures
Alte
rnat
ive
inco
me
SechuraPiscoAll sites
Figure 38 What kind of help did you received? Percentage of valid answers.

Chapter 6 Impacted, coping or adapting
164
6.7 ‘Narratives from above’: institutional response in Sechura and market changes
Disaster management plans at the national level were written for the first time by the
Fishery Ministry during El Niño event of 1998 (CAF 2000). There is no evidence of
climate variability being mainstreamed into artisanal fisheries management, short-term
responses after events rather than long-term management policies being elaborated.
During workshops, participants put forward that currently climate variability was not
integrated into planning and management. As one Peruvian participant noted in the
CENSOR workshop conducted in September 2006 in Chile: “the current legislation can
be a problem for adaptive management: the law does not take into account eventualities
[uncertainties]”. Interviews revealed that EN events in Piura offered a window of
opportunity to facilitate adaptation processes in the region. Indeed the EN events of 1982-
83 and 1997-98 and their ensuing high physical damage provided the stimulus to design
and implement programs aiming at integrating climate variability into regional
development planning and develop cross-sector interaction on this issue:
“1998 post El Niño started the beginning of a network of relations: we need to get together to face Niño (…) In the last two and a half years in Piura the topic of climate change has been on the agenda.”
P32: UI-10-BB-Piura- GTZ technical advisor At the national level, the Peruvian government initiated the PROCLIM program,
Programa de Fortalecimiento de Capacidades Nacionales para Manejar el Impacto del
Cambio Climático y la Contaminación del Aire (National Capacities Strengthening
Program to Manage Climate Change Impact and Air Pollution). The regional government
with the aid of several international agencies initiated a series of studies on the impacts of
EN and possible adaptation and mitigation measures. The Autoridad Autónoma de
Cuenca Hidrográfica Chira Piura (Autonomous Authority of the Chira Piura Drainage
Basin) is the leading government agency in this endeavour and has been promoting the
integration of climate variability into the planning process with the help of the German
cooperation (GTZ)

Chapter 6 Impacted, coping or adapting
165
“Since last January the PDRS [GTZ] is assessing the Autoridad Autonoma to help mainstream, position the study [on climate change] in regional institutions [in order] to define strategies. The objective is to insert the results of the project into the planning processes so that they transform themselves into working documents. They are trying to design a regional by-law on climate change strategies and sustainable development for the Piura region.”
P32: UI-10-BB-Piura- GTZ technical advisor
While a multi-sectoral program, the focus of PROCLIM is mainly on the agricultural
sector in the region of Piura. Interviews in regional and municipal entities involved in the
fisheries sector revealed that users and fisheries managers were unaware of the program
outputs. Review of project documents (see for instance Tarazona 2005) also showed an
emphasis on the ecological and biological impacts of EN in the region, with little
information on the impacts on livelihoods and no documented typology of coping
mechanisms.
The after-math of the EN 1997-98 also corresponded with the development of scallop
aquaculture. Since 1999-2000 Sechura is experiencing a scallop boom due to optimal
growth conditions for scallops, and the subsequent increase in fishing effort and
migration. Favourable international and national markets, the issuance of the sanitary
certificate for export to the European Union, and lower landings in the south of the
country favoured this expansion of the fishery (Flores Ysla et al. 2005). The development
of aquaculture due to this favourable international market led to increased migration
fluxes with settlements along the bay growing in a hap-hazard way in flood-prone areas.
While this activity offers economic opportunities to fishermen, it is particularly sensitive
to changes in river discharge and can thus be considered highly vulnerable to EN events.
In 2006, amid fears of a strong EN event, fishermen involved in aquaculture expressed
fears of loosing their investments, as well as their inability to maintain their household
due to lack of savings. The same year, in May, a red tide event resulted in the mortality of
70,5% of scallop stocks in stock-enhancement areas (DePeru.Info 2007). In response the
government granted a credit consisting of scallop seeds for re-sowing with a two-year
period of grace for repayment. If aquaculture activities continue to increase in the bay the
question remains on whether the government will be able to provide to operators during

Chapter 6 Impacted, coping or adapting
166
EN events emergency aid that covers losses. Thus while the EN event of 2006 was mild,
the red tide revealed the vulnerability of these operators.
6.8 Discussion
6.8.1 Impact on natural capital Target species during EN events showed marked changes compared to normal years. In
Sechura, more fishermen mentioned targeting mullet and shrimps than during normal
years, with octopus also playing an important role in the fishery. The main mentioned
target species that observed a sharp decrease during EN are scallop (-38%) and snail (-
12%). In Pisco, scallops observe the only sharp increase as a target species (+46%) while
snail (-25%) and crab (-18%) observed the sharpest decrease. Conversely to normal years
the type of gear did not explain the variance in the choice of target species in both sites,
indicating that fishing strategies during EN are not based on gear but on the availability
of species. In normal years, fishermen surveyed in Sechura are highly specialized,
focusing on the scallop fishery, while during EN they become generalists. In Pisco the
reverse is observed: during normal years fishermen in Pisco are more generalists than in
Sechura but with EN the scallop becomes the main target species. These findings
illustrate the flexibility of fishermen, who exhibit an opportunistic behaviour with
changes of abundances.
6.8.2 Impact on physical capital The survey results show that in Sechura the floods impact on public infrastructure such as
roads were perceived as an important limitation to the marketing of fishery products as
well as the purchase of goods such as food items for households. However, it is the
impact on dwellings that was perceived as the most important impact in Sechura, with
more than half of the respondents reporting damage or loss of houses. It was estimated
that in the last EN in Peru 100,000 homes were either damaged or destroyed by floods
and landslides, affecting around half a million people, three-quarters of those in rural
areas (Reyes 2002). The data presented here is consistent with findings of other studies
conducted in coastal areas hit by extreme events (see for instance Birkmann and

Chapter 6 Impacted, coping or adapting
167
Fernando 2008). What is striking is the fact that re-location did not occur despite the
intensity of the event. There is a vast literature on flood prone areas and risk aversion of
house owners in terms of relocation (Tobin and Montz 1988) and risk perception (Etkin
1999; Miceli et al. 2008). Behavioural experiences play an important role in the
perception of risk, Halpern-Felsher et al (2001) showing that personal experience with
natural hazards can decrease the perception that the chance of experiencing negative
outcomes from another event are high. This ‘survival syndrome’ applies to Sechura,
where fishermen are aware that another flooding event will destroy their dwellings but
consider the probabilities negligible in the short term. Risk management partly involves
preparing for the future because one thinks it is more costly to have a ‘wait and see’
attitude, which is not the case in Sechura. Wood posits that a characteristic of poverty is
uncertainty and short-term behaviour, securing livelihoods and “the preparation for the
future [are] continuously post-poned for survival in the present- the Faustian bargain.”
(Wood 2003 p. 468). While re-location of dwellings is warranted in Sechura, it is clear
that without financial incentives these will not take place. Additionally, it has be argued
that disaster preparedness was positively associated with risk perception (Miceli et al.
2008), which could explain the low level of risk reduction strategies observed in
settlements along Sechura Bay. In Pisco the impact on physical infrastructure was
positive, with respondents being able to purchase new productive physical capital as well
as assets for their households.
6.8.3 Responses to changes
6.8.3.1 Short term adaptation strategies Fishermen responded to changes in natural capital in several ways. One coping strategy
was to change fishing zones: in Pisco fishermen concentrated their activity in Bahia
Independancia, more specifically in Laguna Grande were scallop extraction was striving.
In Sechura migration was mainly directed outside of the bay, towards northern ports or
the centre and south of the country. It has been argued that migration increases the
flexibility of fishermen and while presenting difficulties for fishery management

Chapter 6 Impacted, coping or adapting
168
agencies, it should be taken into account in fisheries policies (Johnson and Orbach 1990).
In Pisco, changes in target species and gear in order to take part in the scallop fishery
were the main strategies adopted by the majority of fishermen surveyed. In Sechura two
responses strategies were identified: staying with the fishery sector but changing target
species or gear, and exiting the artisanal fishery. Diversification into other sectors relied
mainly on agriculture, low lying areas in the Piura region being less affected by floods
than the ‘alto Piura’, the Andean part of the region (Reyes 2002). Mullet and shrimps
offered new opportunities to fishermen with the fisheries sector, allowing them to cope
with the loss of more traditional target species.
6.8.3.2 Long term adaptation strategies
In Sechura adaptation to EN was not observed, especially in term of housing, as
mentioned above. However, major changes in they bay occurred in the last 10 years with
the development of the scallop fishery and aquaculture. Aquaculture requires high levels
of capitalization and intensive levels of management, these risks compounded by a high
risk of disease outbreak (DaCosta and Turner 2007). This new livelihood option is
extremely vulnerable to changes in environmental factors. One avenue to explore in terms
of policies is risk-transfer mechanisms and microfinance tools to help small operators
build up financial resilience to climate variability. In the agricultural sector in Peru small
microfinance activities have grown over the years in rural areas. Currently in this sector
weather insurance products (index-based risk transfer products) are being developed to help
small farm holders face climate-related risk (Skees et al. 2007). In the fisheries sector there
is a need to increase access to financial services and explore the feasibility of weather
insurance products. As Linnerooth-Bayer in her analysis of risk-transfer instruments put
forward:
“The purpose of refocusing disaster aid is not to replace it with unaffordable private insurance but rather to complement post-disaster humanitarian aid with pre-disaster support of risk management programs that combine prevention and risk transfer” (Linnerooth-Bayer 2005 p. 1046)

Chapter 6 Impacted, coping or adapting
169
In this context the development of financial instruments to reduce risks in this activity
needs to be investigated. FAO has already undertaken several studies on risk management
in aquaculture (Secretan et al., 2007; Van Anrooy et al., 2006) and a study at a local level
based on this information and the experience gained in the agricultural sector should be
undertaken. But for these type of initiatives to be successful formal institutions in the
Region of Piura need to acknowledge the necessities of fishing communities when facing
EN, and reduce the knowledge gap that exist between agriculture and fisheries in terms of
coping and adaptation mechanisms to climatic stresses. In Pisco fishermen adapted to EN
since 1982 by developing aquaculture in the bays following “boom years”. This will be
dealt in more details in Chapter 7.
6.8.4 Can household cope on their own?
It has been argued that household behaviour for coping that involves risk-sharing is a
common way of dealing with crises and that kinship plays an important role in recovering
from a shock (Dekker 2004). Findings from Sechura reveal that fishermen and their
households heavily rely on government aid to cope with livelihood changes, local
networks and family and friend providing little help. This might be due to the systemic
nature of EN impacts, where all households are impacted indiscriminately, leaving none
to help the other. The government still has a role to play and should intervene, especially
in promoting adaptation processes such as relocation. However, while government should
steer the adaptation process there is a need to develop community-driven emergency
response strategies in order to reduce reliance on the state. For instance, fishermen
associations could play a greater role in disaster preparedness and response.
6.9 Conclusion
The level of flexibility and autonomous response of the artisanal fishery to changes in
natural capital during EN is an important feature of fishermen livelihoods in times of
climatic stresses. Fishermen adopted mainly three coping mechanisms: prey switching,

Chapter 6 Impacted, coping or adapting
170
migration or exiting the fisheries sector. The findings highlight the differential impacts of
EN on both study sites. Additionally, while apparently remote and unconnected
physically, the dynamics between Sechura and Pisco through migration play an important
role in the development of the fishery and this will be explored in the next Chapter.

Chapter 7 Role of formal institutions in resilience building
171
CHAPTER 7
CLIMATE VARIABILTY AND THE PERUVIAN SCALLOP FISHERY: THE ROLE OF FORMAL INSTITUTIONS IN RESILIENCE BUILIDNG
7.1 Introduction Resilience in social-ecological systems can be defined as the ability to absorb disturbance, the
degree to which a system is capable of self-organization, and the capacity to learn and adapt
(Resiliance Alliance; Berkes et al. 2003b). Theories of institutions have been widely used to
gain an understanding of their role in environmental change (O'Riordan and Jordan 1999;
Young 2002a; Young et al. 2006) and institutions within social-ecological systems have been
considered as vehicles through which resilience can be enhanced or compromised (Bingeman
et al. 2004). Adaptive capacity can be defined as the ability of institutions to change inherent
properties to return to a reference or alternative state of the system they belong to. The
question of whether the new alternative state is a more ‘desirable’ one is particularly relevant,
shedding light on the fact that adaptation does not always lead to desirable outcomes (‘mal-
adaptation’). Adaptive capacity thus translates into increasing the ability and speed to evolve
and adapt to new situations as they arise, and the flexibility to experiment and adopt novel
responses to address the problem (Walker et al. 2002). In this context, response is defined as
any action taken to manage environmental change, in anticipation of that change or after
change has occurred (Thompson and Adger 2005). The analysis of institutional responses to
climatic events allows us to gauge what role they play in the maintenance of the adaptive
capacity of the system under study. In this chapter the formal institutional responses to
climate variability focus on the explicit aspects of rules, norms and knowledge relevant to the
management of the scallop fisheries in Peru. During ENSO events the Peruvian bay scallop
(Argopecten purpuratus) undergoes substantial changes in its stock size. In the North of the
country strong warm ENSO events are synonymous with floods and river discharges that
negatively affect scallop biomass, while in the South increased sea surface temperatures lead
to an increase in stock size.

Chapter 7 Role of formal institutions in resilience building
172
7.2 Objectives and methods This chapter explores how formal institutions respond to climate variability and resource
fluctuations in the scallop fishery, and what role they play in the maintenance or erosion of
resilience. More specifically its objectives are threefold: 1) to understand how formal
institutions in the scallop fishery respond to climate variability in Peru with a focus on the El
Niño phenomena, 2) to identify what role they play in the maintenance of system resilience
and 3) to develop a conceptual model of the scallop fishery to inform future interventions and
policies. In the following sub-section the methodology used is described but for further details
the reader is referred to Chapter 3.
7.1.1 Interviews and secondary data
Evidence of the findings for response of institutions to climate variability is driven by
secondary data analysis, interviews and stakeholder meetings. Secondary data analysis
consisted of the content analysis of reports, policy statements, planning documents and
archival research of fisheries legislations. Interviews were conducted between March 2005
and June 2006 with key informants from government agencies, fishermen associations, and
non-governmental organizations to capture their perception of how ENSO affected the scallop
fishery. Topics included the articulation between national and regional authorities, the
effectiveness of fisheries policies and the impact and management of ENSO events.
7.1.2 Stakeholder meetings and causal loop analysis
Seven stakeholder meetings were held between 2005 and 2007. Central components of these
events were group discussions and experts input. The meetings provided a learning platform
for the author on local perception of management issues and the impact of climate variability
on scallop resources. Finally, to understand how different driving forces affect institutions’
responses, a conceptual model of formal institutional behaviour under ENSO conditions was
developed using system dynamic concepts and causal loop diagrams.

Chapter 7 Role of formal institutions in resilience building
173
7.3 Impact of ENSO
The Peruvian bay scallop is highly susceptible to changes in SST triggered by ENSO events.
During the El Niño period of 1983–1985, the scallop harvest in Independence Bay - Pisco was
the highest ever recorded, yielding around 40 000 tons as opposed to about 1000 tons in
previous normal years (Figure 39). The (normal) cold upwelling conditions (summer water
temperature of about 16°C) were drastically altered to tropical warm water conditions (around
25°C), affecting population dynamics by increasing growth rate and recruitment, as well as
the bay’s scallop carrying capacity (Wolff and Mendo 2000). Scallops can reach a commercial
size (65 mm) in one or one-and-a-half years in normal years and six to twelve months during
El Niño events. Cold events have been shown to have negative impacts on scallops
populations: at low temperatures spawning and recruitment decrease (Wolff et al. 2007)
leading to a decrease in landings. During the El Niño 1982-83 a time lag was observed
between temperature peaks and increases in landings (Figure 39). This could be explaining by
the fact that fishing effort reached its peak in 1984-85 once the population cohort of 1982-83
reached its marketable size and entry into the fishery by migrants was at its highest during this
period. In 1997–98, the scallop stock increased but instead of waiting for the cohort biomass
to build up, small juvenile scallops of low market value were extracted leading to lower
landings.
0
500
1000
1500
2000
2500
3000
3500
4000
4500
82 83 84 85 86 87 88 89 90 91 92 93 94 95 96 97 98 99 00 01 02 03
Land
ings
[10
of to
ns]
10
11
12
13
14
15
16
17
18
19
20
Sea
Sur
face
Tem
pera
ture
s [C
°]
Landings Sea Surface Temperatures
Figure 39 Annual catch and sea surface temperature changes in Pisco 1982- 2003 (Flores et al. 1994; Mendo and Wolff 2003; Guevara and Estrella unpublished).

Chapter 7 Role of formal institutions in resilience building
174
In Sechura during El Niño events an inverse relationship exists between scallop landings and
increased SST and river discharge in the bay (Figure 40). During the 1997–98 El Niño the
total accumulated rainfall in the city of Piura was 1802mm, thirty times its normal value
(Takahashi 2004) which resulted in river discharge in the bay four times higher than normal.
The low scallop catches in 1997-98 in Sechura have been suggested by fishermen to be the
result of river discharge: freshwater input into the bay could be decreasing salinity beyond the
scallops’ tolerance limit or/and increasing mortality with higher sedimentation rates. Taylor et
al (2007) developed a model which demonstrates a significant correlation between both
spawning stock size and river discharge- mediated mortality on catch levels, substantiating
observational data. Few studies have directly looked at the cold phase ENSO events (La Niña)
impact on the scallop fishery in Sechura but recent modeling efforts (Vadas 2007) argue that
the variation in scallop stocks is not dependent on temperature but river discharge, lower
temperature having little influence on population dynamics, the bay being located in a
transition zone near warm tropical waters.
0
50
100
150
200
250
300
350
400
450
500
82 83 84 85 86 87 88 89 90 91 92 93 94 95 96 97 98 99 00 01 02 03
Land
ings
[10
of to
ns],
Riv
erdi
scha
rge
[m-3
s-1
]
101112131415161718192021222324
Sea
Surf
ace
Tem
pera
ture
s [C
°]
Landings Discharge P iura River Sea Surface Temperatures
Figure 40 Annual catch, sea surface temperature (SST) and river discharge changes in Sechura 1982-2003. Landing data was derived from IMARPE catch statistics (Flores et al. 1994) and reports (Tafur et al. 2000; Flores Ysla et al. 2005; Guevara and Estrella unpublished). Data was unavailable for the 1992-94 periods. SST in Paita (a research station near Sechura used as a proxy) was provided by IMARPE-Paita coastal laboratory. River discharge data was granted by the GeoforschungsZentrum (GFZ) Postam and recorded by the Sistema de Alerta Temprana – Piura (SIAT), at the Sanchez Cerro Bridge, Piura River.

Chapter 7 Role of formal institutions in resilience building
175
7.4 Formal institutional response to climate variability
7.4.1 El Niño of 1982-83: The surprise Before the 1980s the international market for scallop was limited but in July 1983 Canada
entered a scallop moratorium which resulted in a high demand for the Peruvian scallop in the
North American markets (Echevarria Espezua 1985). The combination of a dramatic increase
of scallop population due to warm SSTs and a growing international demand resulted in the
first “scallop boom”. While during the first phase of El Niño commercially exploited shallow
water bivalves and crabs disappeared (Arntz 1986), later on the increase in scallop
populations led fishermen to rapidly focus on this specie. In 1982 scallops represented 8% of
the total seafood catch and the following year 88.9% (Morales 1993). The response was not
only local, fishermen from all over Peru entering the fishery due to its open-access nature. In
the Paracas Reserve the population went from 250 families and 80 boats to 4 500 crew, 3 000
divers and 1 500 boats (Morales 1993). Apart from the minimum size limit (65 mm) there
were no measures such as effort controls and harvest levels available to the authorities to
control the extraction. The government, under pressure from fishermen’s associations and the
advice of IMARPE, responded with fishing moratoriums, but these were not enforced nor
respected (Table 39, B). From the interviews the absence of enforcement and control were
partly attributed to the limited capacity the recently established regional office possessed and
the lack of preparedness of authorities. According to the accounts of staff working in 1983,
the Fisheries Regional Direction was not well managed and the workers were characterized by
a lack of training and little experience (Table 39, A).
During 1983-84 private companies promoted the establishment of scallop sea farms in
Independence and Paracas Bay. However, these sea farms being located on traditional fishing
grounds were not successful due to the lack of adequate techniques and conflicts with
artisanal fishermen (Garcia Carhuayo 1998). The state intervened in 1983 with a first of a
series of new legislation for the zoning and development of the activity24. Subsequent to El
Niño the activity decreased, migrants leaving and some fishermen from Pisco migrating to
24 Supreme Decree N° 021-82-PE: authorization for the installation of culture sites or “criaderos” in the Paracas National Reserve. Ministerial Resolution Nº 260-83-PE: complementary norms for aquaculture of molluscs approved. Ministerial Resolution Nº N° 357-84-PE: temporary norms and regulations for the recollection of scallop seeds. Supreme Decree N° 016-84-PE: regulation for aquaculture of molluscs approved

Chapter 7 Role of formal institutions in resilience building
176
other favourable zones like Sechura. Fishermen that persisted with aquaculture activities in
Pisco had to organize themselves to obtain special concessions since by law only registered
groups could have access to culture grounds. At the national level, the Ministry of Economy
and finance declared in April 1989 that the development of aquaculture was a priority for the
country25. In 1994 the government (Ministry of Agriculture - INRENA) elaborated the second
management plan for the Paracas Reserve26 based around tourism and aquaculture activities,
which was not the case of the first one in 1979 (Garcia Carhuayo 1998).
7.4.2 El Niño 1997-98: Missed opportunity The 1982–83 El Niño, which influenced climate around the globe, catalyzed government and
scientific interest in developing forecasting capabilities (Broad et al. 1999). As a result by July
1997 the 1997-98 event was prognosticated and government measures took place shortly
afterwards in September with the creation of a multi-sectoral task force on ENSO 27. Special
concessions in the Paracas Reserve were created in September 1997 for re-stocking purposes28
in order to control the activity and limit access. However, so many fishermen wanted to enter
the fishery that the Ministry had to suspend the reception of solicitudes and all procedures
were halted29, national level institutions responding rapidly to the “gold rush” triggered by
forecasted information on the climatic event. However, regional offices were not given human
(i.e. inspectors) and financial resources to ensure monitoring and enforcement. As a result
between 1998 and 2000 in Independancia bay 14 organizations were formal (550 fishermen
with 144 boats) while 36 were informal (1631 fishermen and 414 boats) (Proleon and Mendo
2002). Additionally, mortality of scallops due to high-density sowing occurred (Proleon and
Mendo 2002), reflecting an inadequate adoption of knowledge, and over exploitation of the
resource took place with the extraction of scallops below the minimum size (Mendo and
Wolff 2002).
25 Supreme Decree N° 073-89-EF Declares that the development of aquaculture is of national utility and social interest for the country - 1989 2626 Management plan for the Paracas Nacional Reserve (1994) and the accompanying bianual operacional plan, R.J. No 055/93/INRENA - 1993 27 Supreme Resolution N° 053-97-PE – 1997 28 Ministerial Resolution Nº 406-97-PE Creation of special concessions for collection of larvae and re-stocking for social purposes - 1997 29 Ministerial Resolution Nº 418-98-PE Suspension of all application procedures for concession and the attribution of concessions in the Province of Pisco – 1998

Chapter 7 Role of formal institutions in resilience building
177
Table 39 Interview excerpts from Atlas.ti.5.0. Reference column reads: ID (for reference in text), Atlas.ti file number, unstructured or semi-structured interview (UI-SSI), code for Word file, site and interviewee.
ID Codes Quote Reference
A Response to El
Niño and
Decentralization
"[In 1982] Direccion Regional de Pesqueria moves from
Pisco to Ica (30 persons) (DIREPES). Then it moves to La
Puntilla [near Pisco]. They came with their lack of training, a
lot of people, little experience and it was not well managed”
P51: UI-22-BB-Pisco
Ex-regional fisheries office
worker
B Response to El
Niño
[El Niño 82-83] "It was a total disaster, nothing was uniform
[we exceeded] the limits of extraction. The state started to
regulate but the contraband was born (scallop came out of
gasoline drums) [...]”
P51: UI-22-BB-Pisco
Ex-regional fisheries office
worker
C Migration "I came here 15 years ago but in 1998 I went to Pisco during
the boom and then I came back here after the boom."
P14: SSI-3-BB-Parachique
(Sechura) - Fishermen
D
"I have been in Puerto Rico five years and I come from Pisco
because here the product is better, a great variety"
P36: UI-13-BB-Puerto
Rico
(Sechura) - Fishermen
E Migration and
Conflict
"Problem during El Niño is that people from outside are
coming. It is a social problem and now the associations are
fighting because they are expecting another El Niño."
P60: UI-31-BB-San Andres
(Pisco) – NGO worker
F "Right now in the sector there is a regionalization movement
to fight off immigration. In Parachique people do not want
people from Pisco."
P40: UI-7-BA-Lima
IMARPE staff
G Centralization “Lima has a plan, a directive to respond to ENSO, not the
DIREPRO in Pisco. We have a normative dependency with
Lima. If there was the decentralization, a mini-ministry that
would give a better response to Niño. Also there is no budget,
we depend on the region”
P31: UI-10-BA-Pisco
Regional fisheries office
worker
H Bureaucracy For a concession they need a resolution from INRENA and
the Navy and then Produce.
P60: UI-31-BB-San
Andres. (Pisco) – NGO
worker
I No Interaction
(between actors)
[Regarding special concessions] "They [the fishermen] get
together and go and see the congress but people do not
receive them, there are failures and triumphs…"
P17: SSI-6-BB-San Andres
Pisco - Fishermen

Chapter 7 Role of formal institutions in resilience building
178
In Sechura in the early 1990s the scallop fishery developed due to the settlement of divers
from the South. Between 1994 and 1997 the fishery experienced a “boom” which resulted in
an increase of the fishing effort with nearly 500 boats involved (Tafur et al. 2000). However,
this boom was cut short by the 98 El Niño, interviews revealing that divers either switched
prey (for instance to warm water species like shrimps) or migrated South (Table 39, C). This
migration flux increased the pressure on scallop resources in Pisco and workshop results
highlight the fact that controlling access into the fishery was a major concern (Mendo et al.
2006a; Mendo et al. 2006b). Disaster management plans at the national level were written for
the first time by the Fishery Ministry during this El Niño event (CAF 2000). Document
analysis reveals that the major focus of the plan for the fisheries sector was anchovy (pelagic
species mainly exploited by industrial fishermen and negatively affected by El Niño) and
infrastructure damages, while there was no specific mention of resource management plans
and regulations for coastal benthic resources such as scallops. The regional fisheries office in
Pisco did not receive any specific instructions to deal with a new scallop boom (Table 39, G).
Broad et al (1999) in a study on the impact of El Niño on Peruvian industrial fishery observed
a similar behaviour in terms of institutional response: there were limited proactive measures
taken in the fishery sector to minimize negative effects or enhance positive ones. This was a
missed opportunity to learn from past events and mainstream climate variability into fisheries
management, switching from short-term responses to long term management policies.
7.4.3 The 2000-06 period: Steps toward adaptation? After the 1998 El Niño fishermen in Pisco formed associations in order to qualify for special
concessions in the Reserve. Special concessions are renewable every three years but between
2001 and 2006 no concession renewals were approved. Among the factors that slowed the
process of renewal is the discord between the Ministry of Fisheries and the Ministry of
Agriculture (MINAG) branch that manages the Paracas Reserve over the management plans
proposed by associations. Interviews with fishermen associations’ presidents and government
officials revealed conservation objectives versus exploitation of the resource were at the
center of the debate between the two agencies and that the bureaucratic red tape, no
communication between the different agencies from the local to the national level as well as
the absence of political will to reach an agreement impeded the renewal process (Table 39, H-
I). Additionally, in 2000 the Peruvian government suspended the export of bivalve molluscs

Chapter 7 Role of formal institutions in resilience building
179
as a response to the discovery of the presence of Hepatitis A virus in a shipment from Peru in
Spain30. Many organizations who at first were interested in acquiring a special concession
gave up, seeing no short term benefits. Only a few organizations remained in the “stock
enhancement” adventure, surviving by supplying the national market (Mendo et al. 2006a).
The bivalve moratorium coincided with a cold ENSO event which resulted in low catches in
the Paracas and Independancia bays.
In mid-2006 when positive SST anomalies appeared in the equatorial Pacific, workshop data
(Mendo et al. 2006b) and interviews (Table 39 E-F) revealed that fishermen while hopeful of
a new boom were fearful of the migration and chaos that would ensue. With a possible El
Niño in sight and pressure from associations, the newly elected government urged the
MINAG and the Navy to authorize aquaculture activities in the Reserve so that the Fisheries
Ministry could issue a Ministerial Resolution granting special concessions (24 Horas Libres
2006). As a result in April 2007, after five years of stalemate, special concessions were
granted31. The 2006-07 diving season in the end did not result in the expected scallop
bonanza, SSTs only being slightly above normal temperatures, but the combination of a new
political environment (presidential elections in 2006), the forecast of El Niño (albeit incorrect)
and pressure from associations were drivers for institutions to enforce their policies.
Nevertheless a preventive stand is still not taken by institutions: no scallop management plan
that includes climate variability currently exists.
In Sechura the period of 2000-06 is characterized by an increased activity of the scallop
fishery despite a trough in landings in 2001, attributed on the export moratorium (Figure 4). In
2002 warmer temperature could have favoured recruitment of scallops, landings going from 1
587 tons that year to 6 105 tons in 2004 (Gonzales and Yepez 2007) but more probably the
increase in landing is due to and increase in fishing effort. Indeed interviews revealed that
migration from the center and the south of the country (Pisco) increased during those years,
causing conflict between the new migrants and local fishermen not involved in the diving
fishery (39, D-F). In 2003-2004, the regional government granted 12 authorizations to
30 Directorial Resolution Nº 0327/2000/DIGESA/SA - 2000 31 For instance Directorial Resolution N° 027-2007-PRODUCE/DGA granting a special concessions to the fishermen association ‘Asociacion Comunidad Artesanal de Extractores y Maricultores’

Chapter 7 Role of formal institutions in resilience building
180
fishermen associations to conduct aquaculture activities in the bay. 32 Since then the number
of associations undertaking sea-ranching activities without authorizations dramatically
increased (DIREPRO 2005a). While the migration of fishermen during normal and cold years
from the south and center of Peru to Sechura has over the years resulted in the development of
the diving industry in the region, institutions have been unable to manage this booming
fishery (Mendo et al. 2007).
7.5 Responding to disturbance: a synthesis
Disturbances can be defined as changes, surprises and crisis. Surprises are a qualitative
disagreement between ecosystem behaviour and a priori expectations and become a crisis
when they reveal an unambiguous failure of management actions and policy (Gunderson
2003). From a management perspective Folke and colleagues (2003) identify three generic
responses when a crisis occur in socio-ecological systems: 1) no effective response, 2)
response without experience and 3) response with experience. Figure 40 summarizes
institutional responses to disturbances in Pisco and Sechura in the last 25 years.
No effective response refers to institutions that try to preserve the status quo, weakening the
resilience of ecosystems. We observe that in Pisco formal institutions did not preserve the
status quo, mainly due to pressure from fishermen adaptive capacity, individual fishermen
being not only able to self-organize to fluctuating resources through the application of
existing available responses (migration, prey switching) but also to adopt new techniques such
a scallop culture. Prior to the 1990s, institutions in Sechura had no scallop fishery to manage
but increased migration of scallop divers from the south after El Niño 1998 started to convert
a developing fishery into a mature one. The absence of a regulatory framework and the failure
of government agencies to make timely adaptive changes over the years could lead to a
depletion of the stock. This inertia and the inability of national and regional governments for
concentrated action culminated into a crisis in 2006 regarding marine tenure rights (Mendo et
al. 2007).
32 For instance Directorial Resolution N° 103-2003 GOB.REG-PIURA-DIREPE-DR granting authorizations to two associations in Sechura

Chapter 7 Role of formal institutions in resilience building
181
b) a)
El Niño 82-83 + International market
= scallop boom
No management plan that include climate variability
Management plans Control entry to the Fishery
Regional multi-sectorial commission
Development of sea-ranchingIncreased No. of
Associations
1982-84 1st legislations for Invertebrate aquaculture
El Niño 97-98 + Market = scallop boom
Conflict with immigrants
80’s and 90’s Embryonic scallop fishery No scallop management
plans
El Niño 97-98: River discharge Resource disappears
Migration or change of activities
Post El Niño scallop boom, =
Haphazard development
No management plan = resource use/allocation crisis
Institutional “chaos” and no incorporation of climate variability
El Niño 82-83: Great floods
No scallop fishery yet
Pisco center of diving and scallop fishery
development since 1950
Until the 80’s only traditional fishery (long line)
1999-2000 La Niña and scallop moratorium = catch decrease and
economic hardship
Increased migration = conflicts build up with traditional fishermen for marine tenure and with migrants + decrease in
catch
Figure 41 Institutional responses to disturbance over time in Pisco (a) and Sechura (b). Shaded areas are disturbances (environmental, socio – economic etc.) while non-shaded areas are responses. Dashed lines represent migration fluxes of fishermen.
Response without experience in the 80’s
Response with experience in the 90’s
in Pisco but not in Sechura
Looming crisis? 2006

Chapter 7 Role of formal institutions in resilience building
182
The second type of response is when an institution or local resource-user responds to a crisis
without previously tested policies at his disposal (Folke et al. 2003, p.360). This was observed
during the 1982-83 El Niño where one of the strongest El Niño of the century took by surprise
institutions and led to spontaneous adaptation by fishermen (migration, adoption of new
technology). Formal institutions had no existing responses available apart from moratoriums
and minimum size, and local authorities’ capabilities were limited in terms of manpower and
knowledge. Nevertheless, the disturbance was an opportunity to re-organize the fishery with
the development of aquaculture legislations. In figure 6 we refer to this period “learning by
doing” where institutions tried to formulate a new regulatory framework for scallop extraction
(Figure 42, phase A). Additionally, the scallop boom created a platform for collective action
with the increased number of fishermen associations since these were necessary to obtain
concessions, as well as increasing scientific knowledge and technological change
(development of sea ranching) which migrants would bring back to their regions. Following
El Niño and driven by increased exports and neo-liberal policies, the policy landscape
continued to flourish (Figure 42, phase B).
The third type of response is when institutional learning occurs based on previous crises and
socio-ecological memory (Folke et al. 2003, p.360). Albeit some institutional learning
occurred in Pisco in 1998 with measures to stop entry to the fishery promulgated, re-
organization was not sufficient, instruments and allocation of resources to enforce
management intervention were inexistent, and coordination and collaboration with local actors
limited, leading to an enforcement crisis. The 1997-98 “boom” in Pisco and “bust” in Sechura
only revealed the weakness of institutions to control access to the fishery and extraction of the
resources (Figure 42 – phase C).
Since 2001 policies related to scallop extraction and aquaculture have overall remained
unchanged, poorly implemented and enforced (Figure 42 – phase D). Government agencies
and users need to reflect on the future direction of fisheries policies (extraction versus
aquaculture) and how ENSO might impact them. The organizational failure to learn from past
events and integrate them into on-going management and policy interventions highlights a
lack of long term planning and mainstreaming of climate variability into fisheries
management, despite the recurrent nature of ENSO events on the Peruvian shores.

Chapter 7 Role of formal institutions in resilience building
183
0500
10001500200025003000350040004500
82 83 84 85 86 87 88 89 90 91 92 93 94 95 96 97 98 99 00 01 02 03
Land
ings
[10
of to
ns]
Sechura Pisco
A B C D
Learning by doing – Pionner phase Implementation stage?
Figure 42 Phases of policy development for the scallop fishery for the period 1982 - 2003 related to landings in Sechura and Pisco. Identified are: a) from underdeveloped fishery to new regulations, b) exporting and regulating, c) “boom” and “bust” d) fast north, slow south.
7.6 Exploring the role of formal institutions in resilience building with causal loop diagrams
When assessing the resilience of social-ecological systems (SESs), one should identify key
variables and fundamental processes to understand how their changes affect the system under
study, in this case the scallop fishery. The purpose of this section is to identify processes that
maintain the system or offer potential for other alternative state under ENSO conditions and
what role formal institutions play in these processes based on the information compiled in the
previous sections. To do so system dynamics concepts and causal loop diagrams are used to
build a conceptual model of the fishery. One of the principles of the system perspective is that
external forces do not explain everything: the causes of dynamic problems lye in a system
structure that cannot cope with unfavourable external conditions (Barlas 2002). The system
approach reminds us that a key factor for response [to change] is the presence of effective and
tight feedback mechanisms or coupling of stimulus and response in space and time (Berkes et

Chapter 7 Role of formal institutions in resilience building
184
al. 2003b, p. 269). The conceptual system models have already been put forward as a
framework for identifying resilience surrogate (Bennett et al. 2005) and in this section we
posit that this method can be used in fisheries management.
7.6.1 Conceptual model description The causal loop diagram in Figure 44 and 45 represents the scallop fishery in Pisco and
Sechura under an ENSO scenario, taking into account current management practices and
policies and was constructed based on the analysis presented above. In our effort to identify
the underlying mechanisms that shape resilience and what role formal institutions play we
made the following assumptions to simplify system representation:
• Environmental external drivers only include SST and river discharge despite the fact
that factors such as pollution and algae blooms significantly affect scallop biomass.
• Fishermen are separated only into two groups: scallop divers and other fishermen. The
scallop fishery is an open system and prey- switching is an adaptation strategy of other
fishermen (gill nets, long line etc.) which has an impact on levels of effort and design
of management interventions. The conceptual model however does not take into
account the heterogeneity of the other fishermen.
• Similarly biomass changes in other species (predators, competitors and other
commercial species) and impact of ENSO in other sectors (agriculture) can have
impacts on the scallop fishery (prey switching and entry in the fishery sector, reduced
biomass) but system boundaries had to be defined for the purpose of this study and
these factors were excluded for the time being.
The conceptual model presented is divided into three components which reflect analytical and
geographical scales: sub-system in Pisco and Sechura and formal institutions (market and
government). Figure 7.6 presents the systems without the intervention of market or
government institutions.

Chapter 7 Role of formal institutions in resilience building
185
Figure 43 Conceptual model of scallop’s fishery response to ENSO events using causal loop diagrams. Blue arrows represent Pisco, green arrows Sechura, and red ones the non diving fleet
Num ber ofD ivers Pisco
LandingsPisco
SST Pisco
RiverDischarge
E ffort Pisco
+
+
R ecuperationrate biomass
Scallop biom assPisco
Illegal fishing Pisco
+
+
-
Num ber ofD ivers Sechura
E ffort
Landings Sechura
Scallopbiom ass
Illegal fishingSechura
+
+
-
-
-
-
+
SST Sechura
+
+
-+ +
++
+
Recuperationrate biomass
+
B3R1
R2
B1
B2
R3
R4
Other speciesbiom ass Sechura
Other
Effort otherspecies
+ +
Landings otherspecies
+
+
-
+
+
+ B8

Chapter 7 Role of formal institutions in resilience building
186
National marketsupply
Number ofDivers Pisco
LandingsPisco
SST Pisco
RiverDischarge
Effort Pisco
ForeignDemand
Export Price
Export Ban
InternationalSupply
+
+ -
-
National Price-
-
+
+
Level ofDecentralization
+
EnforcementDelay
LearningDelay
AdoptionDelay
Recuperationrate biomass
Scallop biomassPisco
Illegal fishing Pisco
+
+
-
Number ofDivers Sechura
Effort
Landings Sechura
Scallopbiomass
Illegal fishingSechura
+
+
-
-
-
-
-
+
Regulations for extraction(moratorium, control entry into
the fishery, aquaculture)
Enforcement
+
SST Sechura
+
EL Niñoforecast
Regional institutionalcapabilities (human and
financial)
Perceived risksInstitutional memory(past experiences)
+
+
+
+
+
+
- -
-
+ +
++
+
Recuperationrate biomass
+
B3R1
R2
B1
B2
B4B5
B7
B6
R3
R4
+
--
Other speciesbiomass Sechura
OtherFishermen
Effort otherspecies
+ +
Landings otherspecies
+
+
-
+
+
+ B8
Figure 44 Conceptual model of the scallop fishery and institutional response to ENSO event. Black arrows represent institutional responses

Chapter 7 Role of formal institutions in resilience building
187
7.6.2 Identifying causality and feedback loops In the scallop fishery conceptual model we have identified eight balancing feedback loops and
four reinforcing ones. Feedback loops are a succession of cause-effect relations that start and
end with the same variable, the circular causality implying dynamism over time (Barlas 2002
p. 1147). Reinforcing (positive) feedback loops create growth or crash and tends to be
destabilizing while balancing (negative) feedback loops tend to have a stabilizing effect on the
system. The eight balancing loops in the model can be described as follow:
• B1: Scallop biomass mediates amount of catches that can be achieved overtime in
Sechura
• B2: refers to same pattern as B1 but in Pisco
• B3: The number of fishermen in Pisco (fleet size) is related to the number of
fishermen in Sechura (fleet size). Indeed the previous sections showed that strong
migration patterns exist between these two locations based on boom and bust periods
of the scallop fishery.
• B4 and B5: The amount of landings is linked to market prices in Pisco and Sechura,
abundance and price following the economic law of supply and demand. This reflects
government neo-liberal policies and free market economy described in other sections.
• B6 and B7: similarly at the national and international level, prices and amounts
supplied are locked in the economic law of supply and demand with no government
control possible.
• B8: for other species experiencing positive impacts of EN, biomass mediates the
amount of catches that can be obtained over time. These species include shrimp and
octopus favoured by warmer temperature and less affected by river discharge, and
mullet favoured by brackish water.
The eight feedback loops highlight the fact that one way to stabilize the system and maintain
its resilience is to maintain biomass and keep to a certain extent the open access nature of the
fishery that permits migrations, allowing one bay ecosystem to recover while the other
experiences a boom. The causal loop diagram places emphasis on the central role played by
market forces and how inappropriate macro-economic policies could destabilize the system.
But what process pushes away the system from an ‘equilibrium’, eroding its resilience? The
four reinforcing feedback loops in the conceptual model presents the following characteristics:

Chapter 7 Role of formal institutions in resilience building
188
• R1: An increased number of fishermen in Pisco leads to an increase in effort, resulting
in increased landings. Based on the data presented above we know that an increase in
landings in the area leads to an increase in the total number of fishermen due to
migration.
• R2: As presented in other sections a larger number of fishermen increases illegal
practices. By illegal practices we refer not only to the non-compliance with, for
instance, the moratoriums set by state agencies but also non-compliance with local
rules (fishing zones, daily limits). Illegal practices lead to increased effort and landings
in Pisco.
• R3: refers to the same patterns as R1 but in Sechura.
• R4. refers to the same patterns as R2 but in Sechura
These reinforcing loops can spiral the system into decline and reduce resilience, driving the
scallop stock to collapse. All the reinforcing feedback loops include the number of fishermen.
This highlights the importance of regulation of fishermen migration and access to the fishery,
which are endogenous and thus controllable variables, as opposed to exogenous variables
such as SST, river discharge and international markets that play an important role, but are
beyond the jurisdiction of (Peruvian) institutions. This underlines the fact that for the system
to persist or shift to another state, formal institutions are key determinants. Additionally, the
causal loop diagram illustrates the role knowledge (ENSO forecast, institutional memory)
plays in changing the fishermen variable through regulations. The conceptual model also
reveals the central role played by market forces, also highlighting that a better control of
landings could ensure better prices for fishermen.
Another key feature of the model is the presence of delays intervening between causes and
their effects. Delays are divided into two types: delays resulting from the time involved in
processing physical material (material delays) and delays resulting from the time involved in
perceiving and acting upon information (information delays) (Roberts et al. 1983). Four types
of delays were identified: recovery rate of scallop biomass, rate of learning from past
experiences (“social memory”), rate of adoption of new regulations and enforcement
effectiveness, the last three one being considered information delays. In terms of information
delays often individuals and organizations make decisions based on averaged or imperfect
information (Roberts et al. 1983). For instance a small increase in scallop landings will not

Chapter 7 Role of formal institutions in resilience building
189
lead to migration but an above-average increase will cause fishermen to change fishing zones
while institutions will only respond to significant changes in landings, resulting from higher
number of fishermen. Our research shows that formal institutions do not respond
instantaneously to changes while individuals respond immediately to information and small
variations (hence the lack of delay in loops involving fishermen).
The causal loop diagram presented is a first attempt to build a system dynamic model in the
study areas integrating ecological and social dimensions. Based on the data from interviews,
workshops and archival research a representation of the fishery system could be undertaken.
This type of approach offers the possibility to explore possible scenarios to solve complex
management problems and can be used as a basis for formal quantitative models.
7.7 Discussion and conclusion: Pathways to resilience? The Peruvian scallop fishery operates in a highly fluctuating environment where climate inter-
annual variability is a key driver of changes. Formal institutions responses to climate
variability varied according to the level of maturity (rate of exploitation) of the fishery. In
Pisco where the fishery dates back to the early 1950s, formal institutions were mainly reactive
to El Niño events and while past experiences had been integrated in the last strong event of 98
into the response mechanism, institutional and organisational adoption of past and new
knowledge is still incomplete to maintain resilience. In Sechura, no response by formal
institutions was identified, putting the fishery at risk (overexploitation and inability to adapt to
flood events). The study also shows that while individual responses are spontaneous, ensuring
a rapid process of adaptation, they do not always positively contribute to the sustainability of
the resource and formal institutions are necessary to control fishing effort and access to the
fishery through management interventions.
System analysis concepts and causal loop diagrams allowed us to conceptualize this system
behaviour and identify processes that maintain or erode resilience. The conceptual model
shows that formal institutions play a critical role in building resilience of the system through
the creation and implementation of normative frameworks that maintain scallop biomass and
control fleet capacity and behaviour by limiting the number of fishermen. The implementation
at the regional level is jeopardized by low human and financial capabilities, and must be
addressed to ensure the resilience of the system. Additionally, while controlling the level of

Chapter 7 Role of formal institutions in resilience building
190
fishing effort and entry into the fishery is crucial to maintain the resilience of the system, the
role of formal institutions in fisheries management goes beyond this traditional function. The
conceptual model shows that formal institutions through ‘institutional memory’ need to
contribute to knowledge building regarding ENSO impacts and interventions, to reflect on
past interventions and to adopt new approaches, all of which is not present in the current
management framework. The resilience of the system thus depends on the ability of formal
institutions to shape fishermen decision making by creating and enforcing a regulatory
framework as well as the ability to build and adopt knowledge in order to self-organize and
transform. Conceptual model are useful tools in that direction, allowing the exploration of
various past, current and future scenarios to inform policy making.
The research shows that formal institutions are slow to learn, self-reorganize and respond to
climate variability while fishermen responses are spontaneous, ensuring a rapid process of
adaptation. Institutional responses are mostly ex-post, not strongly shaped by past experience,
thus eroding the resilience of the system. However, fishermen responses sometimes lead to
negative outcomes such as local stock overexploitation or ‘invasion’ of natural scallop
habitats for scallop grow-out, and formal institutions play an important role in resilience
building through the control of effort and entry in the fishery. In this chapter system dynamic
concepts and causal loop diagrams have been used to conceptualize the fishery system to
highlight key variables and processes. The study thus provides the opportunity to explore the
usefulness of causal loop diagrams and conceptual models combined with participatory
approaches in the exploration of the resilience of a system. The case study also illustrates that
while individual adaptation, a feature of resilience, is occurring and will occur spontaneously,
its effectiveness is strongly influenced by the ways in which formal institutions shape
fishermen decision-making to engender positive management outcomes.

Chapter 8 Conclusions
191
CHAPTER 8
CONCLUSIONS
8.1 Livelihood security and institutions: building blocks for resilient social ecological systems?
This thesis set out to explore the livelihoods of two coastal communities in Peru, and it did
this bearing in mind the need to relate meso-scale and micro-scale processes to explore how
fishermen maintain their livelihoods. In terms of livelihood assets, the study discerned major
axes of differentiation between Pisco and Sechura. Human capital and physical capital were
higher in Pisco, lower educational levels, and lack of public infrastructures and service
provision in Sechura mainly explaining the differences. Differences in service provision in
Peru have been attributed to a deficient decentralization policy, with a focus on urban areas
and where settlements near the capital Lima are better endowed (Escobal 2001). Moreover, it
is worth noting that Pisco is characterized by the presence of the Paracas National Reserve
which makes it a hub for tourism and holiday-related activities, an impetus for better service
provision and infrastructure development. Thus government macro policies and the economic
environment are contextual variables that shed light on the difference between sites.
In terms of social capital, differences start to blur. While informality is higher in Sechura,
both sites exhibit a highly informal diving fishery. This warrants policies at the regional level
promoting the adoption of fishing and diving cards at low costs for this fishery. Membership
to fishermen organizations was higher in Pisco but dissatisfaction also followed the same
trend. This highlights the fact that measures of social capital based solely on membership or
number of organizations are not sufficient to establish whether social capital is thriving or not
in one area. Lack of access to financial capital was also highlighted as a major constraint to
the development of income generating activities.
Natural resources are fundamental assets for fishermen’s livelihoods. Fishermen in both sites
while targeting various species usually do not possess more than one type of gear. In terms of
natural capital Sechura presented a high variety of target species but a more specialized diving
fishermen group than in Pisco, as a result of the promotion of scallop extraction and

Chapter 8 Conclusions
192
aquaculture. Indeed since 1999-2000 Sechura has been experiencing a scallop boom due to
optimal growth conditions for the scallop, and the subsequent increase in fishing effort and
migration. The latter is a specific characteristic of Sechura which has a significantly higher
number of migrants than Pisco. The lack of management plans and regulations limiting access
to the fishery, and the lack of enforcement of moratoriums is causing conflicts between the
new immigrants, local divers and other artisanal fishermen. This development of the scallop
fishery in the North, and more broadly bivalve aquaculture, and the specialization and
territoriality of the diving fishery might in the long term hamper seasonal and permanent
migration patterns.
Indeed seasonal migration has been identified has an important livelihood option enabled by
the de facto open access regime. Further examining livelihood options, it was observed that
diversification is not as prevalent as contemporary research in fishing communities and more
broadly in the common property resources literature would suggest, with a high dependence
on marine resources. Additionally, while engagement into fishing activities is often motivated
by poverty and the lack of alternative opportunities, the prospect of improving livelihood
outcomes, tradition, kinship and the “identity of fishing”, where fishermen express a certain
job satisfaction of being at sea, are also strong motivators. Fishing is thus as much a choice as
a strategy motivated by necessity, putting a caveat on the idea that fishing is an activity of
‘last resort’ (Béné 2003). From a gender perspective, women are still an untapped human
capital in both study sites, with Sechura exhibiting the lowest proportion of women engaged
in income generating activities. Additionally, a high proportion of women are engaged in
post-harvesting activities, accentuating household dependency on marine resources.
In terms of livelihood outcomes Sechura overall achieves better economic outcomes than
Pisco with higher incomes and lower family expenditures. The high level of income and low
levels of human and physical capitals in Sechura highlight the failure to transform household
income into durable assets that would help build more resilience livelihoods. The results
revealed that income measures are not an adequate tool for evaluating livelihoods outcomes in
the context of our case studies since it is the combination of public and private assets that
enhance the livelihood platform. It was also shown that the micro-macro interactions were
inefficient on both sites, if existent. Efforts to decentralize political powers and
responsibilities in terms of fisheries management have clearly failed in Sechura while in Pisco

Chapter 8 Conclusions
193
the interactions between users and the state are hampered by bureaucracy and corruption, all
of these affecting negatively fishermen livelihoods outcomes.
On the whole, and in concordance with the adage that diversification is a risk-reduction
mechanism and increases the resilience of livelihoods, the findings suggest that fishermen on
both sites are vulnerable to external shocks due to their high reliance on fishing activities.
Additionally, the lack of cross-scale interaction and ill-implemented decentralization policies
put a strain on livelihood outcomes. Finally, the current institutional arrangement of defacto
open access enables migration, an important livelihood option in both communities.
8.2 El Niño and livelihoods Target species during EN events showed marked changes compared to normal years.
Conversely to normal years the type of gear did not explain the variance in the choice of target
species on both sites, indicating that fishing strategies during EN are not based on gear but the
availability of species. In normal years fishermen survey in Sechura are highly specialized,
focusing on the scallop fishery, while during EN they become generalists. In Pisco the reverse
is observed: during normal years fishermen in Pisco are more generalist than in Sechura but
with EN the scallop becomes the main target species.
In addition to prey switching, migration was another coping mechanisms adopted by
fishermen. In Sechura two responses strategies were identified: staying within the fishery
sector but changing target species or gear, and exiting the artisanal fishery. Diversification
into other sectors relied mainly on agriculture, low lying areas in the Piura region being less
affected by floods than its Andean part. Fishermen are thus highly flexible and respond
quickly to changes. Increased operational costs were an issue on both sites with re-tooling
costs providing some strain on income. EN also resulted in difficult commercialization of
catches. Of particular concern for Sechura were damages to infrastructures such as roads and
docks and decrease in the price of certain species due to oversupply.
The differential impacts on the livelihood platform and outcomes in Pisco and Sechura are
mainly driven by differential environmental drivers (i.e. flooding). No clear adaptation
process to climate variability in Sechura could be observed, rather responses to changes in the

Chapter 8 Conclusions
194
market environment. In Pisco it is the combination of market changes and adaptation practices
that lead to the development of the scallop aquaculture. It remains unclear, based on the low
level of diversification, how livelihoods could be secure in the face of changes in the marine
environment due to climate change.
8.3 Formal institutions and El Niño: what role in resilience building? Using as a case study the Peruvian bay scallop (Argopecten purpuratus) fishery, it is shown
that formal institutions are slow to learn, self-reorganize and respond to climate variability
while fishermen responses are spontaneous, ensuring a rapid process of adaptation. The
conceptual model shows that formal institutions play a critical role in building resilience of
the system through the creation and implementation of normative frameworks that maintain
scallop biomass and control fleet capacity and behaviour by limiting the number of fishermen.
However, the implementation at the regional level is jeopardized by low human and financial
capabilities, and must be addressed to ensure the resilience of the system. Institutional
responses are mostly ex-post, not strongly shaped by past experience, thus eroding the
resilience of the system. The case study illustrates that while individual adaptation is
occurring and will occur spontaneously, its effectiveness is strongly influenced by the ways in
which formal institutions shape fishermen decision-making to engender positive management
outcomes. Additionally, the importance of regulation of fishermen migration and access to
the fishery, which are endogenous and thus controllable variables, as opposed to exogenous
variables such as SST, river discharge and international markets that play an important role,
but are beyond the jurisdiction of (Peruvian) institutions are highlighted. In summary, climate
variability plays an important but not exclusive role in the dynamics of the scallop fishery in
Peru. Other exogenous factors such as international market forces, and endogenous factors
such the open access nature of the fishery at the national level, are key drivers of the system.
With El Niño being a recurrent phenomenon on the Peruvian shores and expected to increase
in frequency due to global climate change, adaptive management strategies focusing on
migration, property rights and limiting extraction are imperative.

Chapter 8 Conclusions
195
8.4 Fisheries management in the context of climate variability and change It is now widely accepted that at least part of the earth’s 0.6ºC warming during the 20th
century is due to emissions of greenhouse gases caused by human activities. Over this period
global average sea level has risen. Tide gauge data show that global average sea level rose
between 0.1 and 0.2 metres (Houghton et al. 2001). Warm episodes of the El Niño-Southern
Oscillation (ENSO) have been more frequent, persistent and intense since the mid-1970s,
compared with the previous 100 years (Houghton et al. 2001). A future climate change is thus
a reality for Peruvian fisheries, albeit it is not yet possible to gauge the magnitude and type of
change. Reducing vulnerability to El Niño and helping building resilient livelihoods is how
Peruvian institutions can steer changes towards desirable outcomes: socio-ecological systems
which give people access to the necessary assets for the pursuit of their livelihoods, and which
provide building blocks for the maintenance of livelihoods in the face of critical and pervasive
threats and situations. The following policy recommendations are entry points towards
creating resilient livelihoods:
1. Increase diversification through a gender approach
• Policies should aim at promoting not only women involved in fisheries, but also those
engaged in other income generating activities such as small businesses and agriculture
2. Increase “self-protection”
• Promote and enable access to financial services for fishermen not only for investment
in productive activities but also for the development of safety nets. In this context, risk
transfer mechanisms should be explored in the case of Sechura.
• Upgrade social capital on both study sites through capacity building. For Sechura
develop community disaster response programs embedded in existing institutions.
3. Address the issue of scale
• Currently migration patterns are not clearly integrated in fisheries policies and little
information exist on fleet and crew movements. Because seasonal migration is an
important livelihood option and a coping mechanism during EN, more knowledge
should be built on this issue, and renegotiating the de facto open access regime should
be made with care in the context of aquaculture development

Chapter 8 Conclusions
196
• The lack of cross-scale interaction and hyper centralism in fisheries management is a
clear constraint to livelihood outcomes and in the context of climate change might
hinder adaptation processes. Thus the central government should not only delegate
duties to regional authorities, it should also grant decision-making power and human
and financial capital, as well as technical capabilities
• Interventions at different scales need a sectoral approach for promoting access to
financial services, a regional approach for investing in public service infrastructure
and education in the North, and an ecosystem-based approach that takes into account
the level of heterogeneity of the artisanal fishery on both sites and the importance of
migration, as well as local level capacity building to upgrade human and social capital
• The dynamics of the two systems under study are interconnected. Research and
fisheries management plans should also seek to better understand and incorporate
migration patterns
8.5 Outlook
The work presented here is one of the first studies on fishermen livelihoods in coastal areas in
Peru. From a methodological perspective, it underlined the importance of conducting studies
at the micro level in order to understand processes of change, as well as the need to integrate
different approaches such as the resilience perspective and livelihoods and institutional
analysis. Only part of the questionnaire and database created by the author through the
CENSOR project has been used for this work. It is hoped that this data will be shared with
actors involved in the political and scientific arena in Peru, especially those dealing with the
ecological and biological dynamics of the HCLME, in order for them to better understand the
human dimension of environmental change and the social dynamics at play to design
management plans that are attuned to social realities.

197
REFERENCES 24 Horas Libres (2006) Destinarán más de S/.6
millones para apoyar a pescadores que se verán afectados por El Niño 24 Horas Libres 23 de octubre del 2006
Abel T, Stepp JR (2003) A new ecosystems ecology for anthropology. : . . Conservation Ecology 7(3): [online] URL: http://www.consecol.org/vol7/iss3/art12/
Adger NW (1999) Social Vulnerability to Climate Change and Extremes in Coastal Vietnam. World Development 27: 249-269
Adger WN (2000) Social and ecological resilience: are they related? Progress in Human Geography 24: 347-364
Adger WN, Agrawala S, Mirza MMQ, Conde C, O’Brien K, Pulhin J, Pulwarty R, Smit B, Takahashi K (2007) Assessment of adaptation practices, options, constraints and capacity. Climate Change 2007: Impacts, Adaptation and Vulnerability. Contribution of Working Group II. In: M.L. Parry, Canziani OF, Palutikof JP, van der Linden PJ, Hanson CE (eds) Fourth Assessment Report of the Intergovernmental Panel on Climate Change. Cambridge University Press, Cambridge, UK, pp 717-743
Adger WN, Brown K, Tompkins EL (2005a) The political economy of cross-scale networks in resource co-management. Ecology and Society 10: 9. [online] URL: http://www.ecologyandsociety.org/vol10/iss12/art19/
Adger WN, Hughes TP, Folke C, Carpenter SR, Rockstrom J (2005b) Social-Ecological Resilience to Coastal Disasters. Science 309: 1036-1039
Adger WN, Hughes TP, Folke C, Carpenter SR, Rockström J (2005c) Social-Ecological Resilience to Coastal Disasters. Science 309: 1036 - 1039
Agar M, MacDonald J (1995) Focus groups and ethnography. Human Organization: 78-86
Agrawal A (2001) Common Property Institutions and Sustainable Governance of Resources. World Development 29: 1649-1672
Agrawal A, Gibson CC (1999) Enchantment and Disenchantment: The Role of Community in Natural Resource Conservation. World Development 27: 629-649
Aiken KA, Bacon PR, Mooyoung R (1992) Recovery after Hurricane Gilbert: implications for disaster preparedness in the fishing industry in Jamaica. Proceedings of Gulf and Caribbean Fisheries Institute 41: 261-283
Airriess CA, Li W, Leong KJ, Chen AC-C, Keith VM Church-based social capital, networks and geographical scale: Katrina evacuation, relocation, and recovery in a New Orleans Vietnamese American community. Geoforum In Press, Corrected Proof
Alban Ramos J (1985) Recuento histórico cultural del departamento de Piura. Ubillus, Piura
Alheit J, Niquen M (2004) Regime shifts in the Humboldt Current ecosystem. Progress In Oceanography 60: 201-222
Allison EH, Adger WN, Badjeck M-C, Brown K, Conway D, Dulvy NK, Halls A, Perry A, Reynolds JD (2005) Effects of climate change on the sustainability of capture and enhancement fisheries important to the poor: analysis of the vulnerability and adaptability of fisherfolk living in poverty. Fisheries Management Science Programme Project No. R4778J. MRAG, London
Allison EH, Badjeck M-C (2004) Fisheries Co-Management in Inland Waters: A Review of International Experience. Sustainable Fisheries Livelihoods Programme, DFID, FAO, Rome
Allison EH, Ellis F (2001) The livelihoods approach and management of small-scale fisheries. Marine Policy 25: 377-388
Allison EH, Ellis F, Mvula PM, Mathieu LF ( 2001) Fisheries management and uncertainty: the causes and consequences of variability in inland fisheries in Africa, with special reference to Malawi. In: Weyl OLF, Weyl MV (eds) Proceedings of the Lake Malawi Fisheries Management Symposium, 4th-9th June 2001. National Resource Management Programme, Government of Malawi, Lilongwe, Malawi, pp 66-79
Allison EH, Horemans B (2006) Putting the principles of the Sustainable Livelihoods Approach into fisheries development policy and practice. Marine Policy 30: 757-766
Amin S, Rai AS, Topa G (2003) Does microcredit reach the poor and vulnerable? Evidence from northern Bangladesh. Journal of Development Economics 70: 59-82
Anderies JM, Janssen MA, Ostrom E (2004) A framework to analyze the robustness of social-ecological systems from an institutional perspective Ecology and Society, pp 18
Annan KA (2000) Millennium Report of the Secretary-General of the UN - 'We the Peoples – The Role of the United Nations in the 21st Century’. United Nations Department of Public Information, New York
Armitage D, Marschke M, Plummer R (In Press, Corrected Proof) Adaptive co-management and the paradox of learning. Global

198
Environmental Change In Press, Corrected Proof
Arntz WE (1986) The two faces of El Niño 1982-83. Meeresforschung 31: 1-46
Arntz WE, Gallardo VA, Gutierrez D, Isla E, Levin LA, Mendo J, Neira C, Rowe GT, Tarazona J, Wolff M (2006) El Nino and similar perturbation effects on the benthos of the Humboldt, California, and Benguela Current upwelling ecosystems. Advances in Geosciences 6: 243-265
Ashley C, Elliot J, Sikoyo G, Hanlon K (1999) Handbook for assessing the economic and livelihood impacts on wildlife entreprises. Conservation, Economics and Commerce Program, African Wlidlife Foundation, Nairobi
Ashley C, Hussein K (2000) Developing Methodologies for livelihood impact assessment: Experience of the African Wildlife foundation in East Africa. Overseas Development Institute, Working Paper 129, London
Avaria SP, Carrasco JC, Rutllant JA, Yáñez ER (2004) El Niño-La Niña 1997-2000. Sus Efectos en Chile. Comité Oceanográfico Nacional, CONA, Valparaíso, Chile, pp 265
Badjeck M-C (2004) Oil or Fish? Natural resource use and livelihood security of fisherfolk in Cameroon's coastal zone - Draft. Sustainable Fisheries Livelihoods Programme, FAO, Rome
Badjeck M-C, Barange M, Cochrane K, Hamilton L, Jarre A, Ommer R, Perry I, Sumaila R, Quiñones R (in prep.) The human dimensions of marine ecosystem change: Interactions between changes in marine ecosystems and human communities. In: Barange M, Field J, Harris R, Hofmann E, Perry I, Werner C (eds) Global Change and Marine Ecosystems. GLOBEC
Bakker K, del Moral L, Downing T, Giansante C, Garrido A, Iglesias E, Pedrega l, Riesco P (1999) Working Paper 3: A Framework for Institutional Analysis. Societal and Institutional Responses to Climate Change and Climatic Hazards: Managing Changing Flood and Drought Risk (SIRCH), Environmental Change Unit, University of Oxford., Oxford
Baland J-M, Platteau J-P (1996) Halting Degradation of Natural Resources: Is There a Role for Rural Communities? Clarendon Press,, Oxford
Balgis OE, Nagmeldin G, Hanafi A, Zakieldin S (2005) Sustainable livelihood approach for assessing community resilience to climate change: case studies from Sudan. Assessments of Impacts and Adaptations to Climate Change, N. 17
Barlas Y (2002) System Dynamics: Systemic Feedback Modeling for Policy Analysis Kowledge for Sustainable Development - An insight into the Encyclopedia of Life Support Systems. UNESCO, Paris, Franc, Oxford, UK, pp p 1131-1175
Barrett CB, Reardon T, Webb P (2001) Nonfarm income diversification and household livelihood strategies in rural Africa: concepts, dynamics, and policy implications. Food Policy 26: 315-331
Batterbury SPJ, Fernando JL (2006) Rescaling Governance and the Impacts of Political and Environmental Decentralization: An Introduction. World Development 34: 1851-1863
Bebbington A (1999) Capitals and Capabilities: A Framework for Analyzing Peasant Viability, Rural Livelihoods and Poverty. World Development 27: 2021-2044
Beck T, Nesmith C (2001) Building on Poor People's Capacities: The Case of Common Property Resources in India and West Africa. World Development 29: 119-133
Béné C (2003) When Fishery Rhymes with Poverty: A First Step Beyond the Old Paradigm on Poverty in Small-Scale Fisheries. World Development 31: 949-975
Béné C, Macfadyen G, Allison EH (2007) Increasing the contribution of small-scale fisheries to poverty alleviation and food security. Fisheries Technical Paper 481. FAO, Rome
Béné C, Neiland A, Jolley T, Ladu B, Ovie S, Sule O, Baba M, Belal E, Mindjimba K, Tiotsop F, Dara L, Zakara A, Quensiere J (2003a) Natural-resource institutions and property rights in inland African fisheries: The case of the Lake Chad Basin region. International Journal of Social Economics 30: 275-301
Béné C, Neiland A, Jolley T, Ovie S, Sule O, Ladu B, Mindjimba K, Belal E, Tiotsop F, Baba M, Dara L, Zakara A, Quensiere J (2003b) Inland Fisheries, Poverty, and Rural Livelihoods in the Lake Chad Basin. Journal of Asian and African Studies 38: 17-51
Bennett E (2005) Gender, fisheries and development. Marine Policy 29: 451-459
Bennett EM, Cumming GS, Peterson GD (2005) A Systems Model Approach to Determining Resilience Surrogates for Case Studies. Ecosystems 8: 945-957
Berkes F (2000) Cross-scale institutional linkages: perspectives from the bottom up. In: Ostrom E, Dietz T, Dolšak N, Stern PC (eds) The Drama of the Commons. Nacional Academy Press, Washington: DC, pp 293-319
Berkes F (2004) Rethinking Community-Based Conservation. Conservation Biology 18: 621-630

199
Berkes F, Colding J, Folke C (2003a) Introduction. In: Berkes F, Colding J, Folke C (eds) Navigating the dynamics of social-ecological systems: Building resilience for complexity and change. Cambridge University Press, Cambridge, pp 1-29
Berkes F, Colding J, Folke C (2003b) Navigating the dynamics of social-ecological systems: Building resilience for complexity and change. Cambridge University Press, Cambridge, pp pp. 387
Berkes F, Folke C (1998a) Linking social and ecological systems for resilience and sustainability. In: Berkes F, Folke C (eds) Linking social and ecological systems: management and practices and social mechanisms. Cambridge University Press, Cambridge, pp 1-25
Berkes F, Folke C (1998b) Linking social and ecological systems: management and practices and social mechanisms. Cambridge University Press, Cambridge, pp 459
Berkes F, Jolly D (2001) Adapting to climate change: social-ecological resilience in a Canadian western Artic community. Conservation Ecology 5: [online] ART 18
Berkes F, Mahon R, McConney P, Pollnac R, Pomeroy R (2001) Managing Small-Scale Fisheries: Alternative Directions and Methods. IDRC, Ottawa
Bertrand A, Segura M, Gutiérrez M, Vásquez L (2004) From small-scale habitat loopholes to decadal cycles: a habitat-based hypothesis explaining fluctuation in pelagic fish populations off Peru. Fish and Fisheries 5: 296-316
Biggs D, De Ville B, Suen E (1991) A method of choosing multiway partitions for classification and decision trees. Journal of Applied Statistics 18: 49 - 62
Bingeman K, Berkes F, Gardner JS (2004) Institutional responses to development pressures: Resilience of social-ecological systems in Himachal Pradesh, India. International Journal of Sustainable Development and World Ecology 11: 99-115
Birkmann J, Fernando N (2008) Measuring revealed and emergent vulnerabilities of coastal communities to tsunami in Sri Lanka. Disasters 32: 82-105
Blaikie P (1995) Changing environments or changing views? A political ecology for developing countries. Geography 80: 203-214
Blaikie P, Brookfield H (1987) Land degradation and society. Methuen, London, New York
Bodiguel C (2002) Fishermen facing the commercial lobster fishery licensing policy in the Canadian Maritime Provinces: origins
of illegal strategies, 1960-2000. Marine Policy 26: 271-281
Bond R, Kapondamgaga PH, Mwenebanda B, Yadav RPS, Rizvi A (2007) Monitoring the livelihood platform: reflections on the operation of the Livelihood Asset-Status Tracking method from India and Malawi. Impact Assessment and Project Appraisal 25: 301-315
Bourdieu P (1986) The forms of capital. In: Richardson J (ed) Handbook of theory and research for the sociology of education. Greenwood Press, Westport CT, pp 241-258
Brauch HG (2005) Threats, Challenges, Vulnerabilities and Risks in Environmental and Human Security. UNU Institute for Environment and Humam Security, 1, Bonn
Broad K, Pfaff ASP, Glantz MH (1999) Climate information and conflicting goals: El Niño 1997-98 and the Peruvian fishery Public Philosphy, Environment, and Social Justice. Carnegie Council on Ethics and International Affairs, New York
Broad K, Pfaff ASP, Glantz MH (2002) Effective and equitable dissemination of seasonal-to-interannual climate forecasts: Policy implications from the Peruvian fishery during El Niño 1997-98. Climatic Change 54: 415-438
Bromley DW (1991) Environment and Economy : Property Rights and Public Policy. Basil Blackwell, Cambridge, Mass.
Bryant R (1998) Power, knowledge and political ecology in the third world: a review. Progress in Physical Geography 22: 79-94
Bryant RL (1992) Political Ecology. Political Geography 11: 12-36
Bryant RL, Bailey S, . (1997) Third World Political Ecology. Routledge, London and New York
Buck EH (2005) Hurricanes Katrina and Rita: Fishing and Aquaculture Industries — Damage and Recovery. Congresional Report Service, The Library of Congress, Order Code RS22241
Bunce L, Townsley P, Pomeroy R, Pollnac R (2000) Socioeconomic manual for coral reef management. Australian Institute of Marine Science Townsville
Buzan B, Weaver O, De Wilde J (1997) Security: A New Framework for Analysis. Lynne Reinner Publishers, Boulder:
Caddy JF, Cochrane KL (2001) A review of fisheries management past and present and some future perspectives for the third millennium. Ocean & Coastal Management 44: 653-682
CAF (2000) Las lecciones del El Niño : Memorias del Fenómeno El Niño 1997 - 1998: Retos y propuestas para la Región Andina Volumen V: Perú. Corporación Andina de Fomento

200
Callaway D, Eamer J, Edwarden E, Jack C, Marcy S, Olrun A, Patkotak M, Rexford D, Whiting A (1998) Effects of climate change on subsitence communities in Alaska. In: Weller G, Anderson PA (eds) Proceeding of a workshop: Assessing the consequences of climate change for Alaska and the Bering Sea region. Center for Global Change and Artic System Research, University of Alaska Fairbanks, Fairbanks
Campbell B, Sayer JA, Frost P, Vermeulen S, Ruiz-Pérez M, Cunningham T, Prabhu R (2001) Assessing the Performance of Natural Resource Systems. Conservation Ecology 5(2): [online] URL: http://www.consecol.org/vol5/iss2/art22/
Campion A (2007) Rural and agricultural finance: emerging practices from Peruvian financial institutions. Enterprise Development and Microfinance 18: 182-188
Cannon T (2002) Gender and climate hazards in Bangladesh. Gender and Development 10: 45-50
Carbajal W, Alvitres V Influencia de El Nino 97-98 sobre la pesca artesanal de invertebrados en el departamento de Lambayeque Seminario - Taller: El Nino en America Latina, sus impactos biologicos y sociales: Bases para un monitoreo regional. CONCYTEC, RIBEN, Lima, Peru, pp 111
Carney D (1998) Approaches to Sustainable Livelihoods for the Rural Poor. Poverty Briefing No.2 Overseas Development Institute (ODI), London
Carpenter S, Walker B, Marty Anderies J, Abel N (2001) From metaphor to measurement: Resilience of what to what? Ecosystems 4: 765-781
Castilla JC, Defeo O (2001) Latin American benthic shellfisheries: emphasis on co-management and experimental practices. Reviews in Fish Biology and Fisheries 11: 1-30
Catanzano J, Rey H (1997) Fisheries research at the crossroads of science and action: reflection in a context of crisis. Nature Sciences Sociétés 5: 19-30
Catto NR (2004) Impacts of climate variation and adaptation for Atlantic Canadian fisheries communities Canadian Association of Geographers Annual Meeting. Canadian Association of Geographers, Moncton, NB
Chambers R (1997) Whose reality counts? Putting the first last Intermediate Technology Publications, London
Chambers R, Conway GR (1992) Sustainable rural livelihoods: Practical concepts for the 21st century. Institute of Development Studies, Discussion Paper 296., Brighton, UK
Chapa NEA (2005) Plan estrategico de desarollo de la provincia de Sechura 2006-2015. Municipalidad Provincial de Sechura, Sechura
Charles A (2005) Toward Sustainable and Resilient Fisheries: A Fishery-System Approach to Overcoming the Factors of Unsustainability. In: Swan J, Gréboval D (eds) Overcoming factors of unsustainability and overexploitation in fisheries: selected papers on issues and approaches. International Workshop on the Implementation of the International Fisheries Instruments and Factors of Unsustainability and Overexploitation in Fisheries. Siem Reap, Cambodia, 13–16 September 2004. FAO Fisheries Report . No. 782. . Food and Agriculture Organization of the United Nations, Rome Italy, pp 221-234
Charles A, Salas S, Chuenpagdee R, Seijo JC (2007) Preface - Evaluation and Management of Coastal Fisheries in Latin America and the Caribbean, 1st CoastFish Conference. Fisheries Research 87: 1-4
Charles AT (2001) Sustainable Fishery Systems Blackwell Science, Oxford
Chavez FP, Ryan J, Lluch-Cota SE, Niquen C M (2003) From Anchovies to Sardines and Back: Multidecadal Change in the Pacific Ocean. Science 299: 217-221
CIPCA, COER (1998) FEN en Piura: Informes y diagnostico. . Centro de Investigacion y Promocion del Campesino, Lima. http://www.cipca.org.pe/cipca/nino/index.html Accessed 01/05/08
Clark CW, Lauck T, Munro GR (1995) Managing Uncertain Fishery Resources: The Case for Protected Reserves
Coase RH (1937) The Nature of the Firm. Economica, New Series 4: 386-405
Coase RH (1960) The Problem of Social Cost Journal of Law and Economics, : 1-44
Cole CF (1996) Can we Resolve Uncertainty in Marine Fisheries Management? In: Lemons J (ed) Scientific Uncertainty and Environmental Problem Solving. Blackwell Science, Oxford, pp 233-263
Coleman JS (1988) Social Capital in the Creation of Human Capital. American Journal of Sociology 94: S94-920
Collinson S (2003) Power, Livelihoods and Conflict: Case Studies in Political Economy Analysis for Humanitarian Action. Humanitarian Policy Group, ODI, 13, London
Conway D, Allison E, Felstead R, Goulden M (2005) Rainfall variability in East Africa: implications for natural resources management and livelihoods. Philosophical
201
Transactions: Mathematical, Physical & Engineering Sciences 363: 49-54
Cooper PJM, Dimes J, Rao KPC, Shapiro B, Shiferaw B, Twomlow S (2008) Coping better with current climatic variability in the rain-fed farming systems of sub-Saharan Africa: An essential first step in adapting to future climate change? Agriculture, Ecosystems & Environment 126: 24-35
Corporación Andina de Fomento (2000) Las lecciones del El Niño : Memorias del Fenómeno El Niño 1997 - 1998 : Retos y propuestas para la Región Andina : Perú. Corporación Andina de Fomento, CAF, Caracas, Venezuela
Craig JF, Halls AS, Barr JJF, Bean CW (2004) The Bangladesh floodplain fisheries. Fisheries Research 66: 271-286
Crean K (2000) The influence of boundaries on the management of fisheries resources in the European Union: case studies from the UK. Geoforum 31: 315-328
Cumming GS, Cumming DHM, Redman CL (2006) Scale mismatches in social-ecological systems: causes, consequences, and solutions Ecology and Society 11: 14. [online] URL: http://www.ecologyandsociety.org/vol11/iss11/art14/
Cundill GNR, Fabricius C, Marti N (2005) Foghorns to the future: using knowledge and transdisciplinarity to navigate complex systems. Ecology and Society 10: [online] http://www.ecologyandsociety.org/vol10/iss12/art18/
Curran S (2002) Migration, Social Capital, and the Environment: Considering Migrant Selectivity and Networks in Relation to Coastal Ecosystems. Population and Development Review 28: 89-125
Curran SR, Agardy T (2002) Common Property Systems, Migration, and Coastal Ecosystems. AMBIO: A Journal of the Human Environment 31: 303-305
Cushing DH (1982) Climate and Fisheries. Academic Press, London
Cutter S, L. (1996) Vulnerability to environmental hazards. Progress in Human Geography 20: 529-539
Cutter SL, Mitchell JT, Scott MS (2000) Revealing the vulnerability of people and places: A case study of Georgetown County, South Carolina. Annals of the Association of American Geographers 90: 713-737
DaCosta E, Turner S (2007) Negotiating changing livelihoods: The sampan dwellers of Tam Giang Lagoon, Việt Nam. Geoforum 38: 190-206
Dalton MG (2001) El Nino, Expectations, and Fishing Effort in Monterey Bay, California.
Journal of Environmental Economics and Management 42: 336-359
Dalziell EP, McManus ST (2004) Resilience, Vulnerability, and Adaptive Capacity: Implications for System Performance International Forum on Engineering Decision Making: "Consequence modeling in engineering decision making (including natural and technological hazards)". International Forum on Engineering Decision Making, Stoos, Switzerland.
Davidsson P, Honig B (2003) The role of social and human capital among nascent entrepreneurs. Journal of Business Venturing 18: 301-331
Davis DL (1986) Occupational Community and Fishermen's Wives in a Newfoundland Fishing Village. Anthropological Quarterly 59: 129-142
De'ath G, Fabricius KE (2000) Classification and Regression Trees: A Powerful Yet Simple Technique for Ecological Data Analysis. Ecology 81: 3178-3192
De la Torre-Castro M (2006) Beyond regulations in fisheries management: the dilemmas of the beach recorders Bwana Dikos in Zanzibar, Tanzania. Ecology and Society 11: 35
Dekker M (2004) Sustainability and Resourcefulness: Support Networks During Periods of Stress. World Development 32: 1735-1751
Dempson JB, O'-Connell M-F, Cochrane NM (2001) Potential impact of climate warming on recreational fishing opportunities for Atlantic salmon, Salmo salar L., Newfoundland, Canada. Fisheries Management and Ecology 8: 69-82
Demsetz H (1988) The Theory of the Firm Revsited. In: Demstez (ed) Ownership, Control and the Firm. The Organization of Economic Activity. Blackwell, Oxford, pp 144-165
DePeru.Info (2007) FONDEPES otorga creditos de emergencia a pescadores afectados por marea roja. Accessed 7/01/08 http://www.deperu.info/notas_de_prensa/index.php?subaction=showfull&id=1178854875&archive=&start_from=&ucat=15&
Dewey J (1929) The Quest for Certainty. In: Boydston J (ed) The Later Works: 1925-1953. Southern Illinois University Press, Carbondale, IL
DFID (2001) Sustainable livelihoods guidance sheets. Department for International Development, London
Dietz T, Ostrom E, Stern PC (2003) The Struggle to Govern the Commons. Science 302: 1907-1912
DIREPE (1995) Flota pesquera por rubros segun tipo y sistema de pesca. DIREPE Piura/DSRP LCC. DZ Parachique, Piura

202
DIREPRO (2005a) Evaluación de las Áreas de Repoblamiento en la Bahía de Sechura. Direccion Regional Produccion, Piura
DIREPRO (2005b) Situacion de la pesca artesanal en la Bahia de Sechura Workshop "El manejo de la concha de abanico: desafíos y perspectivas". 12 de Mayo 2005. CENSOR, Sechura
Dodds DJ (1998) Lobster in the Rain Forest: The Political Ecology of Miskito Wage Labor and Agricultural Deforestation. Journal of Political Ecology 5: 83-108
Dolsak N, Ostrom E ( 2003) The Commons in the New Millennium: Challenges and Adaptations. MIT Press, Cambridge: Mass, pp 369
Eakin H (2005) Institutional change, climate risk, and rural vulnerability: Cases from Central Mexico. World Development 33: 1923-1938
Echevarria Espezua RA (1985) Analisis de la extraction y procesamiento de la concha de abanico (Agropecten Purpuratus) en la Provincia de Pisco durante 1983 (año anormal). Tesis. Facultad de Oceanografia, Pesqueria Y ciencias Alimentarias, Lima
Elasha BO, Elhassan NG, Ahmed H, Zakieldin S (2005) Resilient or vulnerable?: new methodology shows promise for studying local climate change adaptations. Assessments of Impacts and Adaptations to Climate Change (AIACC), No. 17, Washington, DC
Ellis F (2000) Rural Livelihoods and Diversity in Developing Countries. Oxford University Press, Oxford
Ellis F, Allison EH (2004) Livelihood diversification and natural resource access. Livelihood Support Programme (LSP), FAO, Rome
Ellis F, Kutengule M, Nyasulu A (2003) Livelihoods and Rural Poverty Reduction in Malawi. World Development 31: 1495-1510
ERM (2002) Environmental and Social Impact Assessment for the Liquids of Natural Gas Fractionation Plant and Loading Facilities Project Lobería Beach, Pisco, Peru. PlusPetrol Peru Corporation, ERM Peru S. A., Lima, Peru
Escobal J (2001) The Determinants of Nonfarm Income Diversification in Rural Peru. World Development 29: 497-508
Espino M (1999) El Nino 1997-98: su efecto sobre el ambiente y los recursos pesqueros en el Peru. Revista Peruana de Biologia Volumen Extraordinario: El Nino 1997-98 y su Impacto sobre los Ecosistemas Marino y Terrestre: 97-1009
Estrella C, Barriga E, Swartzman G (2006) The Peruvian Artisanal Fishery: Changes in patterns and distribution over time Fisheries
in the Peruvian Upwelling Ecosystem: in the Peruvian Upwelling Ecosystem: More than fifty years learning how to deal with learning how to deal with environmental uncertainty environmental uncertainty, Biblioteca Nacional del Perú / National Library of Peru, Lima, Peru. November 27 - December 1, 2006
Etkin D (1999) Risk transference and related trends: driving forces towards more mega-disasters. Global Environmental Change Part B: Environmental Hazards 1: 69-75
FAO (1998) Yearbook of Fisheries Statistics. Food and Agriculture Organisation, Vol.86, Rome
FAO (2003) Fishery Country Profile: Peru. FAO, FID/CP/PER Rev. 2, Rome
FAO (2005) Increasing the contribution of small-scale fisheries to poverty alleviation and food security. FAO Fisheries Technical Guidelines for Responsible No. 10. FAO, Rome
FAO (2006) Promoting literacy to improve livelihoods in fishing communities – Policies linking education to
fisheries management. FAO, Rome FAO (2008) Options for Decision Makers
Workshop: "Climate change and fisheries and aquaculture". 7-9 April 2008. FAO, Rome
Fay M, Morrison M (2007) Infrastructure in Latin America and the Caribbean: recent developments and key
challenges. The International Bank for Reconstruction and Development, The World Bank
Washington DC Filmer D, Pritchett LH (2001) Estimating wealth
effects without expenditure data--or tears: an application to educational enrollments in states of India. Demography 38: 115-132
Flaaten O, Salvanes AGV, Schweder T, Ulltang O (1998) Fisheries Management Under Uncertainty - An Overview. Fisheries Research 37: 1-6
Flores M, Vera S, Marcelo R, Chirinos E (1994) Estadísticas de los desembarques de la pesquería marina peruana 1983-1992. Informe 105. Instituto del Mar del Peru Callao
Flores Ysla F, Mina Valdivia L, Fiestas Chanduvi H, Acasiete Reyes A (2005) Informe estudio de recursos biologicos y areas productivas de la Bahia de Sechura - Piura. ESCAES - Huayuna, Sechura
Folke C (2006) Resilience: The emergence of a perspective for social-ecological systems analyses. Global Environmental Change 16: 253-267
Folke C, Colding J, Berkes F (2003) Synthesis: building resilience and adaptive capacity in

203
socio-ecological systems. In: Berkes F, Colding J, Folke C (eds) Navigating the dynamics of social-ecological systems: Building resilience for complexity and change. Cambridge University Press, Cambridge, pp p 325-383
Fordham MH (1998) Making Women Visible in Disasters: Problematising the Private Domain. Disasters 22: 126-143
Forrester JW (1961) Industrial Dynamics. Pegasus Communications, Waltham, MA
Füssel H-M, Klein RJT (2005) Climate Change Vulnerability Assessments: An Evolution of Conceptual Thinking. Climatic Change in press
Gale FP (1998) Theorizing Power in Ecological Economics. Ecological Economics 27: 131-138
Gallopin GC (2006) Linkages between vulnerability, resilience, and adaptive capacity. Global Environmental Change 16: 293-303
Garcia Carhuayo A (1998) Los culpabables desconocidos: Pescadores artesanales y medio ambiente en la Reserva Nacional de Paracas-Pisco Facultad de Ciencias Sociales y Instituto de Investigaciones Historico Sociales, Lima
Garcia SM (2004) Fishery Governance: Factors of success and failure The Bellaggio Blueprint for Sustaining Fisheries, Bellaggio, Italy, 21-24 February 2004 http://www.piscesforum.org/presentations.php
GECHS (Accessed 01/03/2008) Global Environmental Change and Human Security. http://www.gechs.org/. GECHS International Project Office, University of Oslo, Oslo Norway
Gibson CC, Ostrom E, Ahn TK (2000) The concept of scale and the human dimensions of global change: a survey. Ecological Economics 32: 217-239
Giddens A (1984) The Constitution of Society: Outline of the Theory of Structuration. University of California Press, Berkeley
Gillet V (2003) Case Study: the vulnerability and adaptive capacity of the Belize fisheries sector to severe weather events Climate Change and Severe Weather Events in Asia and the Caribbean. Carribean Disaster Emergency Response Agency, Grand Barbados Beach Resort, Barbados, pp 33
Gladwin CH, Peterson JS, Mwale AC (2002) The Quality of Science in Participatory Research: A Case Study from Eastern Zambia. World Development 30: 523-543
Glantz MH (1992) Climate variability, climate change, and fisheries. Cambridge University Press, Cambridge
Glantz MH, Thompson JD (1981) Resource Management and Envrionemntal Uncertainty: Lessons from coastal Upwelling Fisheries. In: Metcalf RL (ed) Advances in Environmental Science and Technology. John Wiley & Sons, New York; Chichester
Glaser M (2006) The social dimension in ecosystem management: Strengths and weakness of human-nature mind maps. Human Ecology Review 13: 122-142
Gobierno Regional de Ica (2006) Diagnóstico Económico Regional Ica en el Contexto del Desarrollo Económico 2006. Gerencia Regional de Desarrollo Económico, GOBIERNO REGIONAL DE ICA, Ica, http://www.regionica.gob.pe/pdf/grde/diagnostico_econ_2006.pdf Accessed 23/04/08
Goicochea ZI (1998) Las Lagunas de Las Salinas: Sintesis Ecogeografica y Potencial de Gestion Ambiental. Pontificia Universidad Catolica Del Peru, Lima
Gonzales EI, Yepez VE (2007) Estudio de línea base del ámbito marino de la Bahía de Sechura 14 - 28 Enero 2007. Instituto del Mar del Peru, Callao
Goran H (1997) Livelihoods and Security in Africa: contending perspectives in the new global order. African Studies Quarterly 1: [online]
Gordon DV, Munro GR (1996) Fisheries and uncertainty. A precautionary approach to resource management. University of Calgary Press, Canada, pp iv + 195p
Gordon HS (1991) The economic theory of a common-property resource: The fishery. Bulletin of Mathematical Biology 53: 231-252
Grafton RQ (2005) Social capital and fisheries governance. Ocean & Coastal Management 48: 753-766
Green D, Shapiro I (1996) Pathologies of Rational Choice Theory Yale University Press
Greenberg JB, Park TK (1994) Political Ecology. Journal of Political Ecology 1: 1-12
Grimm V (1996) A down-to-earth assessment of stability concepts in ecology: dreams,demands and the real problem. Senckenbergiana maritima 27: 215-226
Guevara R, Estrella C (unpublished) Datos de captura y esfuerzo de la pesca artesanal en los desembarcaderos de Laguna Grande, San Andres, Parachique y Puerto Rico. Instituto del Mar del Peru
Gunderson L (2003) Adaptive dancing: interactions between social resilience and ecological crises. In: Berkes F, Colding J, Folke C (eds) Navigating the dynamics of social-ecological systems: Building resilience for complexity and change. Cambridge University Press, Cambridge, pp p 33-52

204
Gunderson LH (2000) Ecological resilience: In theory and application. Annual Review of Ecology and Systematics 31: 425-439
Guti, Rrez M, Swartzman G, Bertrand A, Bertrand S (2007) Anchovy (Engraulis ringens) and sardine (Sardinops sagax) spatial dynamics and aggregation patterns in the Humboldt Current ecosystem, Peru, from 19832003. Fisheries Oceanography 16: 155-168
Habtemariam K, Gibbon D (2002) Does the Sustainable Livelihoods Approach Need a More Explicit Systems
Perspective? Systems Dynamics Modeling to Facilitate Entry Points to
Smallholder Farming Systems. November 17-20, 2002 17th Symposium of the International Farming Systems Association, Lake Buena Vista, Florida, USA
Hales S, Weinstein P, Woodard A (1999) Ciguatera (fish poisoning), El Niño, and Pacific sea surface temperatures. Ecosystem Health 5: 20-25
Halpern-Felsher BL, Millstein SG, Ellen JM, Adler NE, Tschann JM, Biehl M (2001) The Role of Behavioral Experience in Judging Risks. Health Psychology 20: 120-126
Hamilton L, Lyster P, Otterstad O (2000) Social Change, Ecology and Climate in 20th-Century Greenland. Climatic Change 47: 193-211
Hamilton WH (1932) Institution. In: Seligman ERA, Johnson A (eds) Encyclopaedia of the Social Sciences. Macmillan, New York: , pp 84-89
Handisyde N, Ross L, Badjeck M-C, Allison E ( 2006) The effects of climate change on worldaquaculture: A global perspective. University fo Stirling, DFID
Handmer JW, Dovers SR (1996) A typology of resilience: rethinking institutions for sustainable development. Industrial and Environmental Crisis Quaterly 9: 482-511
Hannesson R (2005) Rights Based Fishing: Use Rights versus Property Rights to Fish. Reviews in Fish Biology and Fisheries 15: 231-241
Hardin G (1968) The Tragedy of the Commons. Science 162: 1243 - 1248
Hartvigsen G, Kinzig A, Peterson.G. (1998) Use and analysis of complex adaptive systems in ecosystem science: overview of a special section. Ecosystems 1: 427-430
Heiskala R (2007 ) Economy and society: from Parsons through Habermas to semiotic institutionalism. Social Science Information 46: 243-272
Henrich J (2006) Cooperation, Punishment, and the Evolution of Human Institutions. Science 312: 60 - 61
Herbert GJ (1995) Fisheries relations in the Gulf of Maine Implications of an arbitrated maritime boundary. Marine Policy 19: 301-316
Hewitt K (1983) Interpretations of Calamity: from the viewpoint of human ecology. Allen and Unwin, Boston, MA
Hodgson GM (1998) The Approach of Institutional Economics. Journal of Economic Literature 36: 166-192
Hodgson GM (2006) What Are Institutions? Journal of Economic Issues. XL: 1-25
Holling CS (1973) Resilience and stability of ecological systems. Annual Review of Ecology and Systematics 4: 1-23
Holling CS (1996) Engineering resilience versus ecological resilience. In: Schulze PC (ed) Engineering within ecological constraints. National Academy Press, Washington DC, pp 31-44
Hotimsky S, Cobb R, Bond A (2006) Contracts or scripts? A critical review of the application of institutional theories to the study of environmental change Ecology and Society, pp 41
Houghton JT, Ding Y, Griggs DJ, Noguer M, van der Linden PJ, Dai X, Maskell K, Johnson CA (2001) Climate Change 2001: The Scientific Basis. Contribution of Working Group I to the Third Assessment Report of the Intergovernmental Panel on Climate Change. Cambridge University Press, Cambridge, pp 881
Hughes TP, Bellwood DR, Folke C, Steneck RS, Wilson J (2005) New paradigms for supporting the resilience of marine ecosystems. Trends in Ecology & Evolution 20: 380-386
Ibarra AA, Reid C, Thorpe A (2000) The Political Economy of Marine Fisheries Development in Peru, Chile and Mexico. Journal of Latin American Studies 32: 503-527
ICLARM (1996) Analysis of fisheries co-management arrangements: a research framework. ICLARM and North Sea Cente, Manila
IDS (Accessed 4/01/2008) Livelihoods Connect. http://www.livelihoods.org/pip/pip_home.html. Institute of Development Studies Brighton, UK
IMARPE (2008) Resultado de la Segunda Encuesta Estructural de la Pesquería Artesanal en el Litoral Peruano” II ENEPA 2004-2005. Unidad de Estadistica y Pesca Artesanal, Instituto del Mar del Peru Callao
Imperial MT (1999a) Institutional Analysis and Ecosystem-Based Management: The Institutional Analysis and Development Framework. Environmental Management 24: 449-465

205
Imperial MT (1999b) Institutionnal Analysis and Ecosystem-Based Management: The Institutionnal Analysis and Development Framework. Environmental Management 24: 449-465
Imperial MT, Yandle T (2005) Taking Institutions Seriously: Using the IAD Framework to Analyze Fisheries Policy. Society and Natural Resources 18: 493-509
INEI (2004) Encuesta Nacional de Hogares -Anual 2004. Instituto Nacional de Estadística e Informática Lima
INEI (2007) Encuesta Nacional de Hogares -Anual 2006. Instituto Nacional de Estadística e Informática Lima
Jallow BP, Toure S, Barrow MMK, Mathieu AA (1999) Coastal zone of The Gambia and the Abidjan region in Côte d'Ivoire: sea level rise vulnerability, response strategies, and adaptation options. Climate Research 12: 129-136
Janssen MA, Ostrom E (2006a) Governing Social-Ecological Systems. In: Tesfatsion L, Judd KL (eds) Handbook of Computational Economics: Agent-Based Computational Economics. Elsevier Publishers, Oxford, U.K.: North-Holland, pp 1465-1509
Janssen MA, Ostrom E (2006b) Resilience, vulnerability, and adaptation: A cross-cutting theme of the International Human Dimensions Programme on Global Environmental Change. Global Environmental Change 16: 237-239
Janssen MA, Schoon ML, Ke W, Borner K (2006) Scholarly networks on resilience, vulnerability and adaptation within the human dimensions of global environmental change. Global Environmental Change 16: 240-252
Janssen MA, Schoon ML, Ke W, Börner K (2005) Scholarly networks on resilience, vulnerability and adaptation within the human dimensions of global environmental change. in review
Jentoft S (2004) Institutions in fisheries: what they are, what they do, and how they change. Marine Policy 28: 137-149
Johnson JC, Orbach MK (1990) Migratory fishermen: A case study in interjurisdictional natural resource management. Ocean and Shoreline Management 13: 231-252
Kaplan IM, McCay BJ (2004) Cooperative research, co-management and the social dimension of fisheries science and management. Marine Policy 28: 257-258
Kendall J (1999) Axial Coding and the Grounded Theory Controversy. West J Nurs Res 21: 743-757
Kidd P, Parshall M (2000) Getting the focus and the group: Enhancing analytical rigor in focus
group research. Qualitative Health Research 10: 293-308
Klein RJT, Nicholls RJ, Thomalla F (2003) Resilience to natural hazards: How useful is this concept? Global Environmental Change Part B: Environmental Hazards 5: 35-45
Klyashtorin LB (2001) Climate change and long-term fluctuations of commercial catches - the possibility of forecasting. FAO, 410, Rome
Knapp G, Livingston P, Tyler A (1998) Human Effects of climate-related changes in Alaska commercial fisheries. In: Weller G, Anderson PA (eds) Proceeding of a workshop: Assessing the consequences of climate change for Alaska and the Bering Sea region. Center for Global Change and Artic System Research, University of Alaska Fairbanks, Fairbanks
Kramer RA, Simanjuntak SMH, Liese C (2002) Migration and Fishing in Indonesian Coastal Villages. AMBIO 31: 367–372
Kristjanson P, Krishna A, Radeny M, Kuan J, Quilca G, Sanchez-Urrelo A, Leon-Velarde C (2007) Poverty dynamics and the role of livestock in the Peruvian Andes. Agricultural Systems 94: 294-308
Lane DE, Stephenson RL (2000) Institutional arrangements for fisheries: alternate structures and impediments to change. Marine Policy 24: 385-393
Leach M, Mearns R, Scoones I (1999) Environmental Entitlements: Dynamics and Institutions in Community-Based Natural Resource Management. World Development 27: 225-247
Lehodey P, Alheit J, Barange M, Baumgartner T, Beaugrand G, Drinkwater K, Fromentin J-M, Hare SR, Ottersen G, Perry RI, Roy C, van der Lingen CD, Werne F (2006) Climate Variability, Fish, and Fisheries. Journal of Climate 19 5009-5030
Levin L, Gutiérrez D, Rathburn A, Neira C, Sellanes J, Muñoz P, Gallardo V, Salamanca M (2002) Benthic processes on the Peru margin: a transect across the oxygen minimum zone during the 1997-98 El Niño. Progress In Oceanography 53: 1-27
Linnerooth-Bayer J ( 2005) Refocusing Disaster Aid. Science 309: 1044 - 1046
Little PD (1999) Living in risky environments: the political ecology of pastoralism in East Africa. Pastoral Risk Management Project, SR/GL CRSP, Utah State University, Logan
Lum Kong A (2002) Impact of climate changes on Caribbean fisheries resources: research needs Caribbean food systems: Developing a research agenda. Global Environmental Change and Food Systems (GECAFS), St Augustine, Trinidad

206
MacKenzie BR, Visser AW (2001) Fisheries and Climate Change: the Danish Perspective. In: Jørgensen AMK, Fenger J, Halsnaes K (eds) Climate Change Research - Danish Contributions. Danish Climate Center, Copenhagen
Mahon R (2002) Adaptation of fisheries and fishing communities to the impacts of climate change in the CARICOM region: Issue Paper - Draft. Mainstreaming Adaptation to Climate Change (MACC) of the Caribbean Center for Climate Change (CCCC) , Organization of American States, Washington
Mahon R, Joseph D (1997) Country case study on climate change impacts and adaptation assessments in Antigua and Barbuda (GF/2200-96-43): Fisheries sector asssessment. United Nations Environment Program and Ministry of Trade and Planning, Antigua and Barbuda
Mahon R, McConney P, Roy RN (In Press, Corrected Proof) Governing fisheries as complex adaptive systems. Marine Policy In Press, Corrected Proof
Majluf P, Barandearán A, Sueiro JC (2005) Evaluacion Ambiental del Sector Pesquero en el Peru. World Bank, Washington, DC
Manly BFJ (2004) Multivariate Statistical Methods: A Primer, Third Edition. Chapman and Hall, Boca Raton, Florida
Marquette CM, Koranteng KA, Over, Ragnhild, Aryeetey EB-D (2002) Small-scale Fisheries, Population Dynamics, and Resource Use in Africa: The Case of Moree, Ghana. AMBIO: A Journal of the Human Environment 31: 324-336
Marschke MJ, Berkes F (2006) Exploring strategies that build livelihood resilience: a case from Cambodia. . Ecology and Society 11: 42. [online] URL: http://www.ecologyandsociety.org/vol11/iss41/art42/
Marshall J (2001) Landlords, leaseholders & sweat equity: changing property regimes in aquaculture. Marine Policy 25: 335-352
Matthews RCO (1986) The Economics of Institutions and the Sources of Growth. The Economic Journal 96: 903-918
McCarthy J, Canziani OS, Leary N, Dokken D, White K (2001) Climate change 2001: impacts, adaptation, and vulnerability IPCC Third Assessment Report. Cambridge University Press, Cambridge
McDougall C, Braun A (2003) Navigating Complexity, Diversity and Dynamism: Reflections on Research for Natural Resource Management. In: Pound B, Snapp S, McDougall C, Braun A (eds) Managing Natural Resources for Sustainable
Livelihoods: Uniting Science and Participation. Earthscan, International Development Research Centre, London, Ottawa, pp 20-44
McGoodwin JR (2007) Effects of climatic variability on three fishing economies in high-latitude regions: Implications for fisheries policies. Marine Policy 31: 40-55
Mehta L, Leach M, Newell P, Scoones I, Sivaramakrishnan K, Way S-A (1999) Exploring Understandings of Institutions and Uncertainty: New Directions in Natural Resource Management. Discussion Papers, IDS, 372, Brighton
Meltzoff SK, Lemons M, Asfour L, Guardia-Montoya G, Gonzales R (2005) Sustaining El Niño-Induced Scallop Booms with Aquaculture: Livelihood Transitions of Artisanal Fishing People in the Paracas National Reserve, Peru. Culture and Agriculture 27: 1-15
Mendo J, Badjeck M-C, Wolff M (2007) Taller de Consulta Técnica: Bases técnicas para el manejo de la concha de abanico en la Bahía de Sechura, Piura, Miércoles 6 de Diciembre 2006. CENSOR
Mendo J, Badjeck M-C, Wolff M, Taylor MH (2006a) Informe del Seminario El manejo de la concha de abanico: desafíos y perspectivas. Pisco, 17 de Marzo 2006 CENSOR
Mendo J, Badjeck MC, Wolff M (2006b) Informe del Taller CENSOR-PASARELAS: Las áreas de manejo como una Herramienta para el manejo de recursos costeros en Chile. Concepción, Chile del 7 al 8 de Septiembre 2006 CENSOR. CENSOR
Mendo J, Fernandez E, Orrego H, Rojas JC, Valencia PF, Solano A (2002) Bases tecnicas y marco legal para la implementacion de areas de manejo de recursos hidrobiologicos en la costa peruana. USAID-CONAM, Lima
Mendo J, Orrego H, Soto I, Carrillo L, Rojas JC, Bandin R (2005) Diseño y ejecución de una encuesta estructural social, económica y ambiental de la Pesquería Artesanal en la región de Pisco/Paracas - IRG STEM – TMA. International Resources Group, STEM-TMA USAID Perú, Fundación para el Desarrollo Agrario, Lima, Peru
Mendo J, Wolff M (2002) Pesqueria y manejo de la concha de abanico en la Bahia Independencia. In: Mendo A. J, Wolff M (eds) Memorias I Jornada Cientifica Reserva Nacional de Paracas. Universidad Nacional Agraria La Molina, Lima, pp p 188-194
Mendo J, Wolff M (2003) El Impacto del Nino sobre la produccion de la concha de abanico (Argopecten purpuratus) en Bahia

207
Independencia, Pisco, Peru, . Ecologia Aplicada 2: 51-57
Menger C (1981) Grundsätze der Volkwirtschaftslehre. Tübingen: J. C. B. Mohr, 1871. Published in English as Principles of Economics. In: Dingwall J, Hoselitz BF (eds). New York University Press, New York
Miceli R, Sotgiu I, Settanni M (2008) Disaster preparedness and perception of flood risk: A study in an alpine valley in Italy. Journal of Environmental Psychology 28: 164-173
Mikkelsen B (1995) Methods for development work and research: A guide for practitioners. Sage Publications, New Delhi, Thousand Oaks, London
Mileti DS (1999) Disasters by Design: A Reassessment of Natural Hazards in the United States. Joseph Henry Press, Washington D.C., pp 376
Miller KA (2000) Pacific salmon fisheries: climate, information and adaptation in a conflict-ridden context. Climatic Change 45: 37-61
Miller KA (2007) Climate variability and tropical tuna: Management challenges for highly migratory fish stocks. Marine Policy 31: 56-70
Miller KA, Downton MW (2003) Transboundary fisheries: Pacific salmon. In: Colman B, Potter T (eds) Handbook of Weather, Climate and Water. John Wiley and Sons, New York, pp 851-864
Mitchell CL (1997) Fisheries management in the Grand Banks, 1980-1992 and the straddling stock issue. Marine Policy 21: 97-109
Mitchell JK (1989) Hazards research. In: Wilmott GLGaCJ (ed) Geography in America. Merrill Publishing, Columbus, OH, pp 410-424
Morales WS (1993) Cuidemos el mar que es nuestro terminando la exploitacion irracional de los productos marinos y protejemos los ecosistemas de la Reserva Nacional de Paracas - Wilfredo Suarez Morales Buzo, Pisco
Morishita J (2008) What is the ecosystem approach for fisheries management. Marine Policy 32: 19-26
Morris S, Neidecker-Gonzales O, Carletto C, Munguia M, Wood Q (2002) Hurricane Mitch and the livelihoods of eth rural poor in Honduras. World Development 30: 49-60
Munoz AA (1988) El Nino impacts on the pelagic fishery management in the Eastern Pacific. Medio Ambiente 9: 35-41
Muñoz I, Paredes M, Thorp R (2007) Group Inequalities and the Nature and Power of Collective Action: Case Studies from Peru. World Development 35: 1929-1946
Murray C (2001) Livelihoods research: somce conceptual and methodological issues. Chronic Poverty Research Centre, University of Manchester, Backgroun Paper 5, Manchester
Nabli MK, Nugent JB (1989) The New Institutional Economics and its applicability to development. World Development 17: 1333-1347
Nagy GJ, Bidegain M, Caffera RM, Blixen F, Ferrari G, Lagomarsino JJ, López CH, Norbis W, Ponce A, Presentado MC, Pshennikov V, Sans K, Sención G (2006) Adaptive Capacity for Responding to Climate Variability and Change in Estuarine Fisheries of the Rio de la Plata. Assessments of Impacts and Adaptations to Climate Change (AIACC), No. 36, Washington, DC
Narayan D (1999) Bonds and bridges: social and poverty. The World Bank Washington, DC
Nedelec C, Prado J (1990) Definition and classification of fishing gear categories FAO, Rome
Nellemann C, Hain S, Alder J (2008) In Dead Water - Merging of climate change with pollution,over-harvest, and infestations in the world’s fishing grounds. United Nations Environment Programme, GRID-Arendal Norway
Newkirk SG (2006) Property rights in fisheries. Bulletin of Marine Science 78: 563-573
Niehof A (2004) The significance of diversification for rural livelihood systems. Food Policy 29: 321-338
Niiya YM (1998) El fenomeno de El Nino 1997-1998: Problema de seguridad alimentaria en la poblacion local. Estudio de caso en el area marginal urbana de Piura Peru y El Nino: Aprendiendo de la Naturaleza. PromPeru, PIEDUL S.R.L, Lima, pp 247-281
Ñiquen M, Bouchon M (2004) Impact of El Niño events on pelagic fisheries in Peruvian waters. Deep Sea Research Part II: Topical Studies in Oceanography 51: 563-574
Noble BF (2000) Institutional Criteria for Co-Management. Marine Policy 24: 69-77
North DC (1989) Institutions and economic growth: An historical introduction. World Development 17: 1319-1332
North DC (1991) Institutions. The Journal of Economic Perspectives 5: 97-112
Norton A, Foster M (2001) The potential of using sustainable livelihoods approaches in poverty reduction strategy papers - A discussion paper for DFID. Centre for Aid and Public Expenditure, ODI, London
O'Brien J (1985) Sowing the seeds of famine: the political economy of food deficits in Sudan. Review of African Political Economy 33: 25-32

208
O'Riordan T, Jordan A (1999) Institutions, climate change and cultural theory: towards a common analytical framework. Global Environmental Change 9: 81-93
Odenbaugh J (2006) Ecology. In: Sarkar S, Pfeifer JE (eds) The Philosophy of Science: An Encyclopedia. Routledge Press, New York, NY
Ogutu-Ohwayo R, Hecky RE, Cohen AS, Kaufman L (1997) Human impacts on the African Great Lakes. Environmental Biology of Fishes 50: 117-131
Olson MJ (1971) The Logic of Collective Action: Public Goods and the Theory of Groups. Harvard University Press, Cambridge, Mass.
Olsson P, Folke C, Berkes F (2004) Adaptive Comanagement for Building Resilience in Social–Ecological Systems. Environmental Management 34: 75-90
Ordinola N (2002) The consequences of cold events for Peru. In: Glantz MH (ed) La Nina and its impacts: facts and speculation. United Nations University Press, Toronton, New York, Paris, pp 146-150
Ostrom E (1986) A method of institutionnal analysis. In: Kaufman F-X, Majone D, Ostrom V (eds) Guidance, Control and Evaluation in the Public Sector. Walter de Gruyter, New York, pp 459-475
Ostrom E (1988) Institutional Arrangements and the Commons Dilemma. In: Ostrom E, Feery D, Pitch H (eds) Rethinking Institutional Analysis and Development: Issues, Alternatives and Choices. ICS Press, San Francisco, U.S.A., pp 101-139
Ostrom E (1990) Governing the Commons: The Evolution of Institutions for Collective Action. Cambridge University Press, New York
Ostrom E (1998) A Behavioral Approach to the Rational Choice Theory of Collective Action: Presidential Address, American Political Science Association, 1997. The American Political Science Review 92: 1-22
Ostrom E (2007) Going Beyond Panaceas Special Feature: A diagnostic approach for going beyond panaceas. Proceedings of the National Academy of Sciences 104: 15181-15187
Ostrom E, Burger J, Field CB, Norgaard RB, Policansky D (1999) Revisiting the Commons: Local Lessons, Global Challenges. Science 284: 278 - 282
Ostrom E, Dietz T, Dolšak N, Stern PC, Stonich S, Weber EU (2002) The Drama of the Commons. Committee on the Human Dimensions of Global Change, National Research Council, Division of Behavioral and Social Sciences and Education, National Academy Press, Washington, DC, pp 521
Owen AL, Videras JR (2007) Culture and public goods: The case of religion and the voluntary provision of environmental quality. Journal of Environmental Economics and Management 54: 162-180
Paavola J, Adger WN (2005) Institutional ecological economics. Ecological Economics 53: 353-368
Palomino FM (1985) El Niño phenomena and its socio-economic consequences. PESCA 46: 12-16
Parada J (2002) Original Institutional Economics and New Institutional Economics: Revisiting the Bridges (Or the Divide). Oeconomicus 6: 44-61
Patz JA (2000) Climate change and health: New research challenges. Ecosystem Health 6: 52-58
Patz JA, Kovats RS (2002) Hotspots in climate change and human health. British Medical Journal 325: 1094-1098
Pauly D (1995) Anecdotes and the shifting baseline syndrome of fisheries. Trends in Ecology & Evolution 10: 430
Pauly D (2006) Major trends in small-scale fisheries, with emphasis on developing countries, and some implications for the social sciences. Maritime Studies (MAST) 4: 7-22
Pauly D, Christensen V, Dalsgaard J, Froese R, Torres F, Jr. (1998) Fishing Down Marine Food Webs. Science 279: 860-863
Perry AL, Low PJ, Ellis JR, Reynolds JD (2005) Climate Change and Distribution Shifts in Marine Fishes. Science 308: 1912-1915
Perry IR, Ommer RE (2003) Scale issues in marine ecosystems and human interactions. Fisheries Oceanography 12: 513-522
Perry RI, Ommer RE, Jentoft S, Barange M, Sumaila UR, Neis B, Stephanus K, Quiñones R, Broad K, Lu J (In revision) Interactive responses of natural and human systems to marine ecosystem changes. Fish and Fisheries
Perry RI, Sumaila UR (2006) Marine ecosystem variability and human community responses: The example of Ghana, West Africa. Marine Policy In Press, Corrected Proof
Pers. comm. Fiesta W Municipalidad Officina de Pesca Sechura
Petersen C (2007) Educating and training out of poverty? Adult provision and the informal sector in fishing communities, South Africa. International Journal of Educational Development 27: 446-457
Peterson G (2000a) Political ecology and ecological resilience: An integration of human and ecological dynamics. Ecological Economics 35: 323-336

209
Peterson G (2000b) Scaling ecological dynamics: Self-organization, hierarchical structure, and ecological resilience. Climatic Change 44: 291-309
Peukert H (2001) Bridging Old and New Institutional Economics: Gustav Schmoller and Douglass C. North, Seen with Oldinstitutionalists' Eyes. European Journal of Law and Economics 11: 91-130
Pigou AC (1932) The Economics of Welfare Plummer R, Armitage D (2007) A resilience-based
framework for evaluating adaptive co-management: Linking ecology, economics and society in a complex world. Ecological Economics 61: 62-74
Pollack G, Berghöfer A, Berghöfer U (2008) Fishing for social realities--Challenges to sustainable fisheries management in the Cape Horn Biosphere Reserve. Marine Policy 32: 233-242
Pomeroy RS, Berkes F (1997) Two to tango: The role of government in fisheries co-management. Marine Policy 21: 465-480
Pontecorvo G (2001) Supply side uncertainty and the management of commercial fisheries: - Peruvian Anchovetta, an illustration. Marine Policy 25: 169-172
Pretty J, Ward H (2001) Social Capital and the Environment. World Development 29: 209-227
PRODUCE (2004) Características básicas de los puntos de desembarque de la pesca artesanal marítima. Oficina General de Tecnología de la Información y Estadística, PRODUCE, Lima
PRODUCE (2006) Medida Descentralizadora: “Direcciones Regionales de Producción recibirán directamente cobros por infracciones de actividades pesqueras y acuícolas”. 22/11/2006. PRODUCE, Lima
Proleon J, Mendo J (2002) Estrategia adoptada por los pescadores artesanales ante el reclutamiento masivode concha de abanico (Agropecten purpuratus) en la Bahia Independencia Durante 1997-2000. In: Mendo J, Wolff M (eds) Memorias I Jornada Cientifica Reserva Nacional Paracas. Universidad Nacional Agraria La Molina, Lima, pp p 207-211
Putnam R, Leonardi R, Nanetti RY (1993) Making Democracy Work: Civic Traditions in Modern Italy. Princeton University Press, Princeton, NJ
Resiliance Alliance http://www.resalliance.org Reves B (1983) Los castigos de Piura Que Hacer?
(22), Lima, pp 42-45 Reyes RR (2002) Gendering responses to El Nino
in rural Peru. Gender and Development 10: 60-69
Ribot JC, Agrawal A, Larson AM (2006) Recentralizing While Decentralizing: How National Governments Reappropriate Forest Resources. World Development 34: 1864-1886
Rigg J (2006) Land, farming, livelihoods, and poverty: Rethinking the links in the Rural South. World Development 34: 180-202
Robbins P (2003) Political ecology in political geography. Political Geography 22: 641-645
Roberts N, Andersen DF, Deal RM, Garet MS, Shaffe WA (1983) Chapter 17: Introduction to Delays Introduction to computer simulation: The system dynamics approach. Addison-Wesley Publishing Company London, Amsterdam, pp p 301-334
Roessig JM, Woodley CM, Cech JJ, Hansen LJ (2004) Effects of global climate change on marine and estuarine fishes and fisheries. Reviews in Fish Biology and Fisheries 14: 251-275
Rostworowski M (2005) Recursos naturales renovables y pesca, siglos XVI y XVII; Curacas y sucesiones. Costa Norte. IEP, Lima
Rothschild BJ, Chen, C., and Lough, R. G (2005) Managing fish stocks under climate uncertainty. ICES Journal of Marine Science 62: 1531-1541
Rudd MA (2004) An institutional framework for designing and monitoring ecosystem-based fisheries management policy experiments. Ecological Economics 48: 109-124
Ruttan VW (1999) The new growth theory and development
economics: a survey. Journal of Development Studies 35 1 - 26
Ruttan VW (2001) Imperialism and competition in anthropology, sociology, political science and economics: a perspective from development economics. Journal of Socio-Economics 30: 15-29
Sáenz-Arroyo A, Roberts CM, Torre J, Cariño-Olvera M, Enríquez-Andrade RR (2005) Rapidly shifting environmental baselines among fishers of the Gulf of California. Proceedings of the Royal Society B: Biological Sciences 272: 1957-1962
Salas S, Chuenpagdee R, Seijo JC, Charles A (2007) Challenges in the assessment and management of small-scale fisheries in Latin America and the Caribbean. Fisheries Research 87: 5-16
Salas S, Gaertner D (2004) The behavioural dynamics of fishers: management implications. Fish and Fisheries 5: 153-167
Sarch M-T, Allison EH (2000) Fluctuating fisheries in Africa's inland waters: well adapted livelihoods, maladapted management Proceedings of the 10th International

210
Conference of the Institute of Fisheries Economics and Trade., Corvallis, Oregon. July 9-14th 2000.
Satria A, Matsuda Y (2004) Decentralization of fisheries management in Indonesia. Marine Policy 28: 437-450
Schneider A, Zuniga-Hamlin R (2005) A Strategic Approach to Rights: Lessons from Clientelism in Rural Peru. Development Policy Review 23: 567-584
Schneider V, Bauer JM (2007) Governance: Prospects of Complexity Theory in Revisiting System Theory. Paper presented at the annual meeting of the Midwest Political Science Association. Panel 33.26 Political Theory and Theories of Political Science. Chicago, Illinois, 14 April 2007. University of Constance and The James H. and Mary B. Quello Center for Telecommunication Management & Law, Michigan State University, WP-07-01, Konstanz, Germany and East Lansing, MI
Schoon M (2005) A Short Historical Overview of the Concepts of Resilience, Vulnerability, and Adaptation. Workshop in Political Theory and Policy Analysis, Indiana University, W05-4, Bloomington
Scoones I (1998) Sustainable Rural Livelihoods: A framework for analysis. Institute of Development Studies, No. 72, Brighton
Scott A (2000) Introducing Property in Fishery Management. In: Shotton R (ed) Use of property rights in fisheries management volume 1. Proceedings of the FishRights99 Conference. Freemantle, Western Australia, 11-19 November 1999. FAO, Rome, pp 1-13
Scott WR (2001) Institutions and Organizations. Sage Publications
SEI, IUCN, IISD, Intercooperation (2003) Livelihoods and climate change: combining disaster risk reduction, natural resource management and cliamet change adaptation in a new approach to the reduction of vulnerability and poverty. SEI, IUCN, IISD, Intercooperation
Sen A (1999) Development as Freedom. Anchor Books, New York
Sen AK (1981) Poverty and Famines: An Essay on Entitlements and Deprivation. Clarendon Press, Oxford
Sen S, Raakjaer Nielsen J (1996) Fisheries co-management: a comparative analysis. Marine Policy 20: 405-418
Shapiro I (2000) Political Scientists Debate Theory of `Rational Choice'. February 26, 2000. The New York Times. http://www.wellesley.edu/Polisci/wj/100/ratchoice.html
Shapiro I (2005) The Flight from Reality in the Human Science. Princeton University PRess, Princeton and Oxford
Shotton R (2000) Use of property rights in fisheries management volume 1. Proceedings of the FishRights99 Conference. Freemantle, Western Australia, 11-19 November 1999 FAO Fisheries Technical Papers - T404/1. FAO, Rome, pp 342
Siung-Chang A, Lum Kong A (2001) Possible links between reef-fish martalities in teh southeast Caribbean and South American river discharge (July-October 1999). Bulletin of Marine Science 68: 343-349
Skees JR, Hartell J, Murphy AG (2007) Using Index-Based Risk Transfer Products to Facilitate Micro Lending in Peru and Vietnam. American Journal of Agricultural Economics 89: 1255-1261
Smit B, Wandel J (2006) Adaptation, adaptive capacity and vulnerability. Global Environmental Change 16: 282-292
Smith CL, McKelvey R (1986) Specialist and Generalist. North American Journal of Fisheries Management 6: 88-99
Smith DR, Gordon A, Meadows K, Zwick K (2001) Livelihood diversification in Uganda: patterns and determinants of change across two rural districts. Food Policy 26: 421-435
Smith IR, Pauly D, Mines AN (1983) Small-scale fisheries of San Miguel Bay, Philippines: options for management and research. ICLARM, 11, Manila, Philippines
Smith LED, Nguyen Khoa S, Lorenzen K (2005) Livelihood functions of inland fisheries: policy implications in developing countries. Water Policy 7: 359-383
Spiegel HW (1971) The Growth of Economic Thought. Duke
University Press, Durham (NC) Strauss AaC, J. (1990) Basics of Qualitative
Research: Grounded Theory Procedures and Techniques. Sage Publications, Newbury Park, CA
Suna C-H, Chiangb F-S, Eugene Tsoac, Chend M-H (2005) The effects of El Nino on the mackerel purse-seine fishery harvests in Taiwan: An analysis integrating the barometric readings and sea surface temperature. Ecological Economics xx: xxx
Symes D (2006) Fisheries governance: A coming of age for fisheries social science? Fisheries Research 81: 113-117
Tafur R, Castillo G, Crispin A, Taipe A (2000) Evaluación Poblacional de la Concha de Abanico en la Bahía de Sechura e Isla Lobos de Tierra. Julio 1999. Informe Progresivo N°113. IMARPE, Lima
Takahashi K (2004) The atmospheric circulation associated with extreme rainfall events in

211
Piura, Peru, during the 1997-1998 and 2002 El Niño events. Annales Geophysicae 22: 3917-3926
Tarazona J, Indacochea, A (2005) Caracterización Física y Biológica Marino Pesquera de la Bahía de Sechura. Informe Final del Proyecto Evaluación de La Vulnerabilidad y Adaptación Marina y Pesquera a los Efectos del Cambio Climático en la Cuenca del Piura. PROCLIM, Lima
Taylor MH, Tam J, Blaskovic V, Espinoza P, Ballón RM, Wosnitza-Mendo C, Argüelles J, Díaz E, Purca S, Ochoa N, Ayón P, Goya E, Gutiérrez D, Quipuzcoa L, Wolff M (in press) Trophic modeling of the Northern Humboldt Current Ecosystem, Part II: Elucidating ecosystem dynamics from 1995-2004 with a focus on the impact of ENSO. Progress in Oceanography accepted November 8th, 2007
Taylor MH, Wolff M, Vadas F, Yamashiro C (2007) Trophic and environmental drivers of the Sechura Bay Ecosystem (Peru) over an ENSO cycle. Helgoland Marine Research 62: 15-32
Thompson EL, Adger NW (2005) Defining response capacity to enhance climate change policy Environmental Science & Policy 8: 562-571
Tietze U, Villareal LV (2003 ) Microfinance in fisheries and aquaculture. Guidelines and case studies. FAO, Rome
Tobin GA, Montz BE (1988) Catastrophic flooding and the response of the real estate market. The Social Science Journal 25: 167-177
Toufique KA (1997) Some observations on power and property rights in the inland fisheries of Bangladesh. World Development 25: 457-467
Townsley P (1998) Social Issues in Fisheries. FAO, Rome
True JA (1989) Finding out: conducting and evaluating social research. 2nd ed. Wadsworth Publishing Company, Belmont, California
Turner R, Cakacaka A, Graham N, Polunin N, Pratchett M, Stead S, Wilson S (2007) Declining reliance on marine resources in remote South Pacific societies: ecological versus socio-economic drivers. Coral Reefs 26: 997-1008
Tzanatos E, Dimitriou E, Katselis G, Georgiadis M, Koutsikopoulos C (2005) Composition, temporal dynamics and regional characteristics of small-scale fisheries in Greece. Fisheries Research 73: 147-158
Vadas F (2007) Modelling Climate-forced Dynamics of the Peruvian Scallop Fishery. M.Sc. Thesis in International Studies in Aquatic Tropical Ecology, Bremen
Vadas F, Wolff M, Berger U (2008) Environmental and endogenous drivers of scallop catch dynamics in Sechura Bay (Peru) between 1996 and 2003 (over an ENSO cycle) unpublished. Center for Tropical Marine Ecoloy, pp 12
Valdivia C, Gilles JL, Jetté C, Quiroz R, Espejo R (2003) Coping and Adapting to Climate Variability: The Role of Assets, Networks, Knowledge and Institutions Insights and Tools for Adaptation: Learning from Climate Variability. November 18-20, 2003. NOAA Office of Global Programs, Climate and Societal Interactions, Washington. DC, pp 189-199
Valdivia M (2004) Poverty, health infrastructure and the nutrition of Peruvian children. Economics & Human Biology 2: 489-510
Van der Veen D (1998) La causa fundamental de la vulnerabilidad ante el Nino: un analisis del manejo de Suelos y aguas en el departamento de Piura, Peru Peru y El Nino: Aprendiendo de la Naturaleza. PromPeru, PIEDUL S.R.L, Lima, pp 25-99
van Oostenbrugge JAE, van Densen WLT, Machiels MAM (2004) How the uncertain outcomes associated with aquatic and land resource use affect livelihood strategies in coastal communities in the Central Moluccas, Indonesia. Agricultural Systems 82: 57-91
Vasquez-Leon M, West CT, Finan TJ (2003) A comparative assessment of climate vulnerability: agriculture and ranching on both sides of the US-Mexico border. Global Environmental Change 13: 159-173
Vyas S, Kumaranayake L (2006) Constructing socio-economic status indices: how to use principal components analysis. Health Policy Plan. 21: 459-468
Wade R (1988) Village Republics: Economic Conditions for Collective Action in South India. Cambridge University Press, Cambridge
Walker B, Carpenter S, Anderies J, Abel N, Cumming G, Janssen M, Lebel L, Norberg J, Peterson GD, Pritchar R (2002) Resilience management in social-ecological systems: a working hypothesis for a participatory approach Conservation Ecology, pp 14
Wang C, Fiedler PC (2006) ENSO variability and the eastern tropical Pacific: A review. Progress In Oceanography 69: 239-266
Watts M, Bohle H-G (1993) The space of vulnerability: the causal structure of hunger and famine. Progress in Human Geography 17: 43-67
Wenner MD, Navajas S, Trivelli C, Tarazona A (2007) Managing credit risk in rural financial institutions: what seems to work.

212
Enterprise Development and Microfinance 18: 158-174
Wilson DC, Ahmed M, Siar SV, Kanagaratnam U (2006) Cross-scale linkages and adaptive management: Fisheries co-management in Asia. Marine Policy 30: 523-533
Wilson JA (2006) Matching social and ecological systems in complex ocean fisheries. Ecology and Society 11(1): [online] URL: http://www.ecologyandsociety.org/vol11/iss11/art19/
Wisner B, Blaikie P, Cannon T, Davis I (2004) At Risk: Natural Hazards, People’s Vulnerability and Disasters. 2nd Edition. Routledge, London
Wolff M, Mendo J (2000) Management of the Peruvian bay scallop metapopulation with regard to environmental change. Aquatic Conservation Marine Freshwater Ecosystems 10: 117-126
Wolff M, Taylor MH, Mendo J, Yamashiro C (2007) A catch forecast model for the Peruvian scallop (agropecten purpuratus) based on estimators of spawning stock and settlement rate. Ecological Modelling 209: 333-341
Wolff M, Wosnitza-Mendo C, Mendo J (2003) The Humboldt Current - Trends in exploitation, protection and research. In: Hempel G, Sherman K (eds) Large Marine Ecosystems of the World: Trends in Exploitation, protection , and research. Elsevier, B.V.
Wood G (2003) Staying Secure, Staying Poor: The "Faustian Bargain". World Development 31: 455-471
World Bank (2000) Volume IV: Adapting to Climate Change Cities, Seas, and Storms: Managing change in Pacific Island Economies. Papua New Guinea and Pacific Country Unit, The World Bank, Washington, D.C.
Wosnitza-Mendo C, Espino M, Veliz M (1988) La pesqueria artesanal en el Peru durante Junio 1986 a Junio de 1988 INFORME N.93. IMARPE, GTZ, Callao, Peru
Wouterse F, Taylor JE (2008) Migration and Income Diversification:: Evidence from Burkina Faso. World Development 36: 625-640
Yanez E, Barbieri MA, Silva C, Nieto K, Espndola F (2001) Climate variability and pelagic fisheries in northern Chile. Progress in Oceanography 49: 581-596
Yin RK (2003) Case Study Research: Design and Methods. 3rd ed. Sage Publications, London
Young HP (1998) Individual Strategy and Social Structure: An Evolutionary Theory of Institutions. Princeton University Press New Jersey
Young OR (2002a) The Institutional Dimensions of Environmental Change: Fit, Interplay, and Scale. MIT Press Cambridge, Mass.
Young OR (2002b) Institutional Interplay: The Environmental Consequences of Cross-Scale Interactions. In: Ostrom E, Dietz T, Dolšak N, Stern PC, Stonich S, Weber EU (eds) The Drama of the Commons: Institutions for Managing the Commons. National Academy Press, Washington, DC, pp 263-291
Young OR, Lambin EF, Alcock F, Haberl H, Karlsson SI, McConnell WJ, Myint T, Pahl-Wostl C, Polsky C, Ramakrishnan P, Schroeder H, Scouvart M, Verburg PH (2006) A portfolio approach to analyzing complex human-environment interactions: institutions and land change Ecology and Society pp 31
Zapata A, Broad K ([undated]) Peru Country Case study. United Nations University in cooperation with United Nations Environmental Programme and National Center for Atmospheric Research, Tokyo
Zavala Lopez E (No date) Informe de Consultoria: Historia de las organizaciones de los pescadores artesanales en Pisco e Ica. Instituto Huayuna, Pisco
Zawodny J (1966) Man and international relations; contributions of the social sciences to the study of conflict and integration: Complete in two volumes. . Chandler, San Francisco
Zenger TR, Lazzarini SG, Poppo L (2002) Informal and Formal Organization in New Institutional Economics. Advances in Strategic Management 19: 277-306
Ziervogel G, Calder R (2003) Climate variability and rural livelihoods: assessing the impact of seasonal climate forecasts in Lesotho. Area 35: 403-417

213
ANNEX 1 Workshops Pisco and Sechura

214
ANNEX 2 Example of interview guide Interview guide for key informant (NGO workers, government officials, academics etc.): topic fisheries management
• How do national and regional levels of government interact, and which are their respective competencies?
• Describe the distribution of power between the national and regional level. At what stage of the policy process do they actively participate? (Policy formulation; implementation through laws, local laws, strategies, programs, or others; policy evaluation).
• For fisheries policies is the articulation between national and regional levels of government effective or poor? If it is poor, explain why. Do local communities participate? If yes, how? (what is their role)
• Legal issues: are there conflicting or overlapping jurisdictions; lack of regulation on zoning etc.
• Is there a problem with enforcement? If so what? What can be done? Interview guide for key informant fishermen association: topic ENSO Presentation of the CENSOR project and the thesis How many active members does your association have? When was it created? What are it’s main goals/objectives/projects Local perception of vulnerability
• What are the main shocks and trends experienced by you and/or your members in the last 20 years (here aiming for a list of events)
• Which groups or households types are the most vulnerable to these shocks and trends?
• Why (explain criteria) • Local perception of vulnerability (ENSO focused) • What were the effects of the El Niño of 1998 for the members of your
association? • And in 1983? Can you compare both events’ impact on you and/or your
member’s activities • Who in the community (i.e. which user group) responded the best to the El Niño
event in 1983?And in 1998? • Who lost the most during the El Niño 1983? And in 1998?
Strategies for poverty reduction • In terms of income what is the trend (increasing or decreasing) in the past 20
years? • Which factors explain this trend/ these changes?

215
• Is fishing still a profitable activity? • How do you and/or your members’ access to additional income? • What agency outside the community has helped you and/or your members in the
last 10 years (government, projects, NGOs??) and how? • Are they still active? If no longer helping then why not? (Try to probe for
different views and expectations of government and non-government agencies

216
ANNEX 4 Survey (Translated from Spanish, not all questions presented) Place: Date: Interviewer: Code:
INFORMATION - ARTISANAL FISHERMEN SURVEY – (FDA UNALM)
I. PERSONAL DATA AND FAMILY 1. Fathers surname.......................................................................2. Mothers
surname...................................................................
3. Name ................................................................. 4. Age .......................... 5. Birth Place ............................................................
6. If the person is not from Pisco, in what year did he arrived? .................... 7. Years fishing ...........................….. 8. Why did you start fishing? 9. Address..............................................................................................................................................................................................
avenue./street number. place 10. Sex MF 10. Marital status SLive with partner MWD 11. Number of children ................ 12. Studies None Primary SecondaryTechnicalUniv. 12.1. Studies statusFinishedNot finished II. ACTIVITY DATA Case: With boat activity: 1. Gear type 2. Crew memberDiverCptArmadorIf the fisherman is a diver 2.1 how many times have you
decompressed?.............
2.2 Have you suffered injuries? YN 3. N° hours/days dedicated to the activity................ 4. N° days per week …………………..
5. Beach fishermen 6. N° hours/days dedicated to the activity................7. Landing Points

217
9. What document do you have as a fisherman? fishermen carddiving cardwithout boat fishermen armador cardcrew cardnone 10. Do you belong to a fishermen organization?YN 11. Organization type.guildAsocsyndicate 11.1 Name of the organization to which you belong........................................................... 12. Three most important fisheries zones 1............................................................................................... 2…………………………………………………3………………………………………………………… 13. Duration of the last fishing trip 1 day2 to 3 daysmore than 3 days 13.a. If the trip lastes more than 1 day, what was the reason? …………………………………………………………………. 14. Have you received capacity building courses in the last two years? YN If the answer is yes, indicate what type: 14.1 environmentalaquaculturebussiness managementorganizationmerchandizingfisheries others......................................................
III. SOCIO ECONOMIC INFORMATION
1. Life insuranceYN 2. Social InsuranceYN 3. Nro. dependents .............. 4. Num. children in schooling age ............ 5. Monthly family income S/............ 6. Monthly family expenses S/ ...................... 7. Monthly income from fishing activity S/............................... 8. House ownership own rented 9. Number of rooms (without consider: living room, dining room, kitchen, bathroom). .............. 10. Service infrastructure WSETCableCel Internet11. Housing characteristicsBAQRM
12. Did you received credit for the house?. YN 13. Do you have others assets? YN 13. Liquid Assets washing machinecomputerrefricartv

218
Form E – Fishermen (FDA-UNALM Complement)
Date
Place
Interviewer
FDA Code
Surname
Mothers surname
Name
Years fishing
Economic Activity E1. What are the main economic activities that sustain your family? Name them by order of importance E2. Do the women in your house occupy any specific economic activity? Which ones? E3. What species are present now in your catches?
E4. What species do you catch during El Niño?
E4b. Not working during El Niño? E4c.Change of activity (to what?) E5. How does your economic activity change during el Niño? Describe (For example operative costs; equipments; less incomes) E5a. Change of fishing zones: Yes/No Where?................................. Participation in collective activities (social capital) E6. Do any of your family members participate in a social organization? (For example APA, religious/ charismatic group, credit), which ones? E7. If yes ¿in what ways this participation helps your household? E8. Did your participation in a group help you to face El Niño events? Yes No Does not Know
Resource Quantity Measurement unit Price / Measurement unit
Resource Quantity Measurement unit Price / Measurement unit

219
E9. If yes ¿how? E10. ¿Are there any groups formed as response to El Niño? Yes No Does not Know E11. If yes, which ones? Change of fishing zone (city, region) for fishing activity - Migration E12. ¿Have you moved since the beginning of your fishing career? Yes / No If yes, go to E14 E13. ¿Why you don’t change your fishing zone if other fishermen do it? E14. ¿What zones have you visited for short term stays? (seasonal) E15. ¿To which cities have you moved (larger periods than a season or one time event) since you started fishing? E16. Did you move base on your own decision, the captain or the armador one? E17. How did you find where to migrate? Climate variability impact on your family and household E18. ¿Were you/your family affected positive or negatively by El Niño? Yes/ No E19. Explain ¿how were you affected? E22. Have you needed external help to support your home during El Niño events? Yes/No E23. If yes ¿what type of help did you receive and who gave you that help? E24. If not from who and what kind of help would you liked to receive? E25. How do you find out if there is going to be El Niño?

220
ANNEX 5 Disclaimer
Gemäß §2 der Promotionsordnung der Universität Bremen, Fachbereich für
Sozialwissenschaften versichere ich, dass:
1. die Arbeit ohne unerlaubte fremde Hilfe angefertigt wurde
2. keine anderen als die angegebenen Quellen und Hilfsmittel benutzt wurden
3. die den benutzten Werken wörtlich oder inhaltlich entnommenen Stellen als
solche kenntlich gemacht wurden
Bremen, 27. Mai 2008
(M-C Badjeck)