coastal fishing coastal fishing in newfoundland & labrador 1 . coastal fishing . in newfoundland...
TRANSCRIPT
P-1006 Coastal Fishing In Newfoundland & Labrador 1
Coastal Fishing In Newfoundland & Labrador
Prepared by
Centre for Fisheries Ecosystems Research Marine Institute of Memorial University, St. John’s

P-1006 Coastal Fishing In Newfoundland & Labrador 2
Abbreviations CCG Canadian Coast Guard CFER Centre for Fisheries Ecosystems Research DFA Department of Fisheries and Aquaculture DFO Department of Fisheries and Oceans; Fisheries and Oceans Canada FFAW Fish, Food & Allied Workers Union GRP Glass Reinforced Plastic KGM Kilogram KGS Kilograms NAFO Northwest Atlantic Fisheries Organization NORA Nordisk Atlantsamarbejde (Nordic Atlantic Cooperation) MT Metric Tonnes (1000 Kgs) RT Registered Tonnage TC Transport Canada
P-1006 Coastal Fishing In Newfoundland & Labrador 3
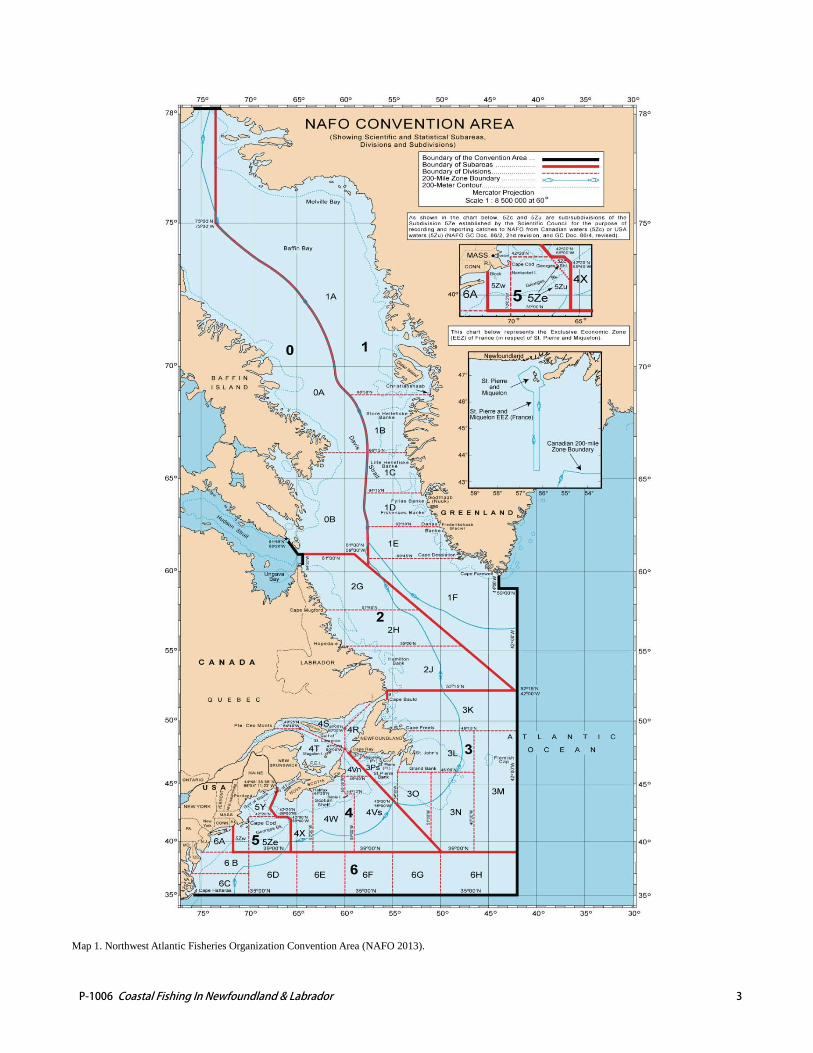
Map 1. Northwest Atlantic Fisheries Organization Convention Area (NAFO 2013).
P-1006 Coastal Fishing In Newfoundland & Labrador 4
Introduction The purpose of this report is to inventory the Newfoundland & Labrador coastal fisheries, and to provide the Nordisk Atlantsamarbejde (Nordic Atlantic Cooperation, NORA) unbiased and uniform data for decision-making. In pursuit of these goals, this report summarizes available data representative of the small commercial fishing fleet <15 meter (50 feet) in Newfoundland & Labrador (hereafter the Coastal Fleet). Data summarized include fisheries landings and value, vessel registration data, and data on personnel employed in the fisheries. Motivation for this report is value chain improvement in the small vessel sector and international networking among stakeholders across the North Atlantic. Subsequent analyses of small vessel fisheries in the North Atlantic will build on inventory data provided by the Marine Institute in Canada and research organizations in other NORA member countries. These countries include Norway, Faroe Islands, Iceland, Greenland, and Canada. Data for all of Atlantic Canada are within the scope of this project (Map 1); however the accumulation of these data from different Canadian fishing provinces would require substantially more research. Focusing on Newfoundland & Labrador is necessary to meet the project’s budget and timeline. Objectives Research objectives are as follows. This report represents progress toward the objectives. a) To inventory the small commercial fishing fleet <15
meter (50 feet) in Newfoundland & Labrador, or Coastal Fleet, as discretely as data will allow, including;
o Total vessels, o Length, o Building material, o Engine size, o Regional distribution, o Gear types.
b) To identify and summarize small vessel fisheries landings and value.
c) To summarize persons employed in small vessel fish capture and processing.
d) To describe handling, processing, and marketing in the small vessel fisheries.
e) To examine alternative uses for coastal vessels such as leisure, tourism, or other uses.
As an inventory and data summary, no conclusions or recommendations come from this report.
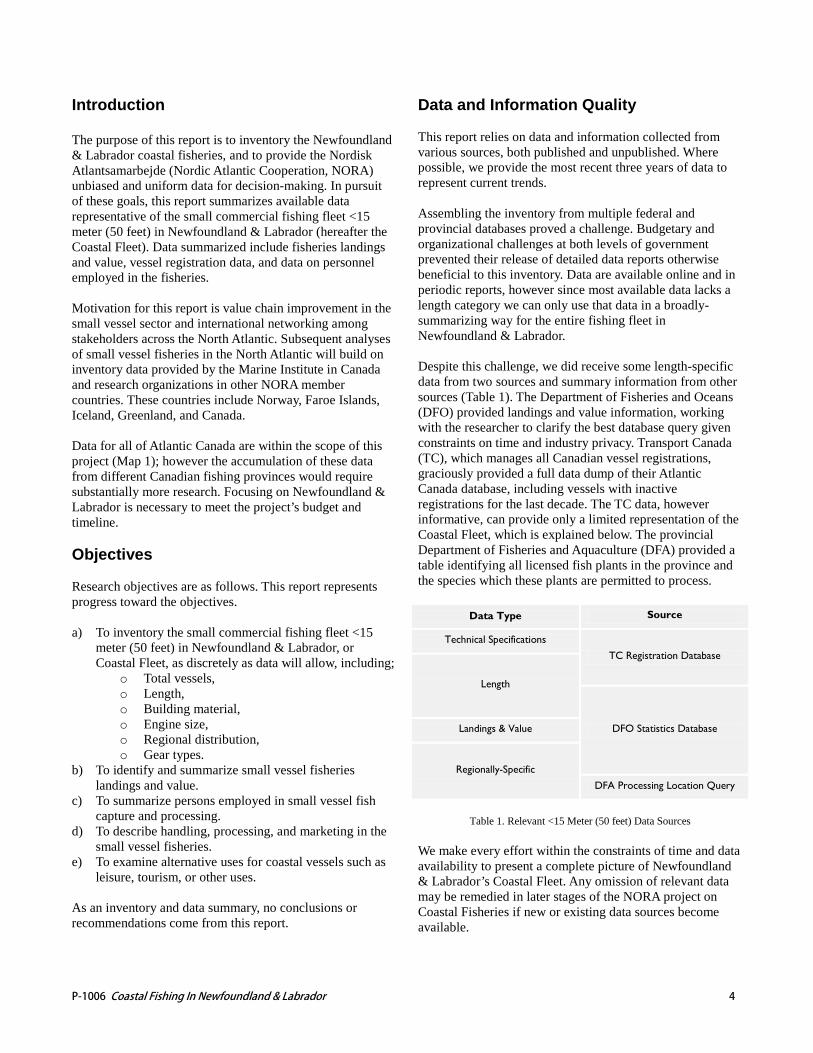
Data and Information Quality This report relies on data and information collected from various sources, both published and unpublished. Where possible, we provide the most recent three years of data to represent current trends. Assembling the inventory from multiple federal and provincial databases proved a challenge. Budgetary and organizational challenges at both levels of government prevented their release of detailed data reports otherwise beneficial to this inventory. Data are available online and in periodic reports, however since most available data lacks a length category we can only use that data in a broadly-summarizing way for the entire fishing fleet in Newfoundland & Labrador. Despite this challenge, we did receive some length-specific data from two sources and summary information from other sources (Table 1). The Department of Fisheries and Oceans (DFO) provided landings and value information, working with the researcher to clarify the best database query given constraints on time and industry privacy. Transport Canada (TC), which manages all Canadian vessel registrations, graciously provided a full data dump of their Atlantic Canada database, including vessels with inactive registrations for the last decade. The TC data, however informative, can provide only a limited representation of the Coastal Fleet, which is explained below. The provincial Department of Fisheries and Aquaculture (DFA) provided a table identifying all licensed fish plants in the province and the species which these plants are permitted to process.
Data Type Source
Technical Specifications
TC Registration Database
Length
DFO Statistics Database Landings & Value
Regionally-Specific
DFA Processing Location Query
Table 1. Relevant <15 Meter (50 feet) Data Sources
We make every effort within the constraints of time and data availability to present a complete picture of Newfoundland & Labrador’s Coastal Fleet. Any omission of relevant data may be remedied in later stages of the NORA project on Coastal Fisheries if new or existing data sources become available.

P-1006 Coastal Fishing In Newfoundland & Labrador 5
Data Summary
Securing data on current fishing enterprises was not possible through government channels. We relied on personal com-munication with informed industry members and their own contacts in government. A “fishing enterprise” is Newfound-land & Labrador terminology for an authorized fishing busi-ness under which multiple fishing licenses or vessels up to 27 meters (90 feet) operate. Each enterprise is controlled by one owner who directs fishing effort among that owner’s vessels and licenses (DFO 2013a). Early 2013 DFO databases contain 4,425 enterprises, of which 4,009 include vessels <15m (50 feet). The first figure includes enterprises operating vessels up to 27 meters (90 feet). Excluding vessels 15-27 meters (50- 90 feet) is neces-sary for an accurate count of enterprises relevant to this in-ventory. Using the TC database we can isolate the ves-sels >15 meters (50 feet). Subtracting the total number of federally registered fishing vessels from 15-27 meters (50- 90 feet) in Newfoundland & Labrador, the total enterprises remaining are 4,009. This figure represents enterprises, not vessels, because an enterprise may include multiple vessels both over and under our target length category (TC 2013, Mark Dolomount Personal Communication February 6, 2013). Data used to assemble Figures 1-20 are available for review in this report’s appendix. TC Database on Newfoundland & Labrador <15 Meter
(50 feet) Fishing Vessels Registration information on Newfoundland & Labrador ves-sels is comprehensive; however the direct relationship of these data to the current <15 Meter (50 feet) fleet for the NORA Coastal Fisheries project must be called into ques-tion. The concern is discussed following a description of these data. Transport Canada separates vessels into two broad catego-ries based on length at 13.7 meters (45 feet), storing vessel information in separate databases. The information Transport Canada provided includes full queries from both databases. The total count of <15m (50 feet) fishing vessels with valid Federal registrations on December 31, 2012 in Newfoundland & Labrador is 1,198. The construction of these vessels varies predominantly be-tween wood and glass-reinforced-plastic (GRP). The varia-tion in hull materials appears in Figure 1.
Figure 1. Hull Materials, NL Coastal Vessels <15m (50’).
The registered tonnages (RT) represented in these same ves-sels varied from <1 to >87 RT. Distribution was general-ly >25RT, with the most vessels between 11-15RT. Figure 2 breaks down the reported RT for these vessels.
Figure 2. Registered Tonnage, NL Coastal Vessels <15m (50’).
These data represent approximately 25% of the active Coastal Fleet. Current regulation requires Federal registra-tion of “all small non-pleasure vessels powered by an engine of 10 horsepower (7.5kw) or more…” (TC, 2013). This is a relatively recent change in regulation. Prior to 2008, Canada required registration of vessels exceeding 15RT. Registra-tion of vessels under 15RT was voluntary. Canadian fleets are responding to this new registration, however the current data under-represents the actual fishing effort in the Coastal Fleet. Note that all Canadian fishing vessels were and are required to register with DFO Licensing to receive their Vessel Registration Number, a number unique to fishing vessels and different from the vessel’s Official Number pro-vided through Federal registration. The DFO Query Report, discussed next, provides more precise data on the size of the Coastal Fleet.
5 2 0
200
400
600
0
100
200
300
P-1006 Coastal Fishing In Newfoundland & Labrador 6
DFO Query Report on Newfoundland & Labrador <15 Meter (50 feet) Fishing Vessels for YE 2010-2012
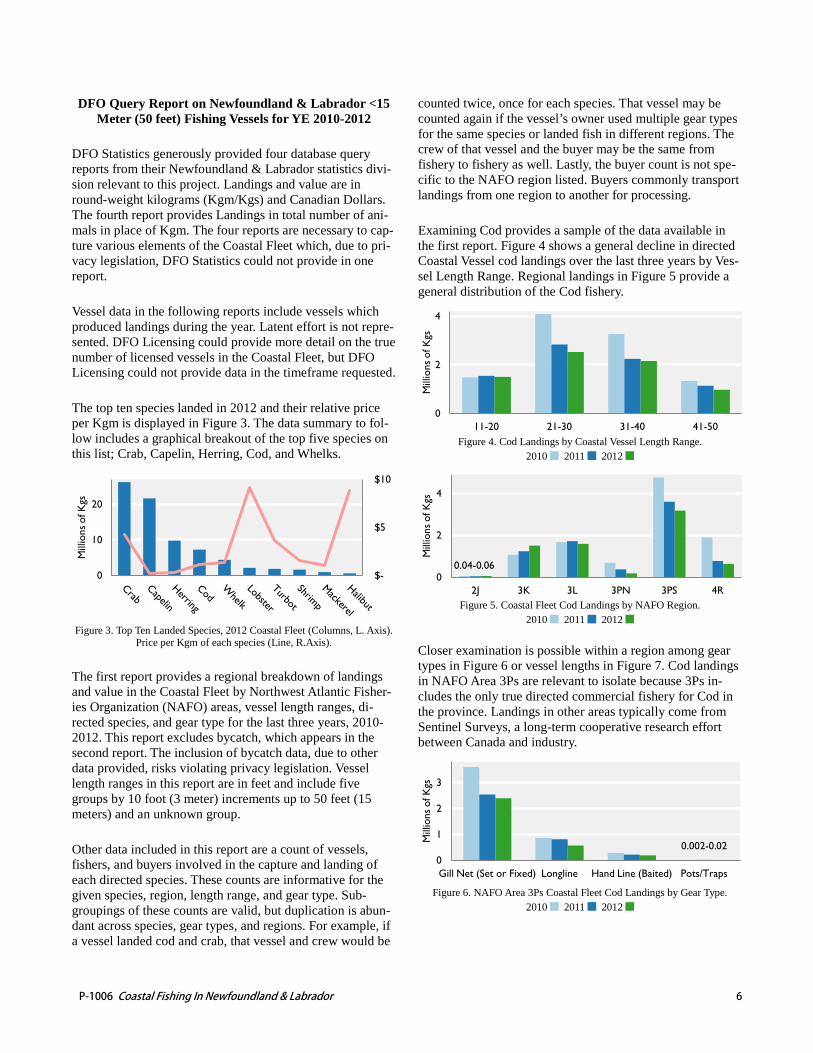
DFO Statistics generously provided four database query reports from their Newfoundland & Labrador statistics divi-sion relevant to this project. Landings and value are in round-weight kilograms (Kgm/Kgs) and Canadian Dollars. The fourth report provides Landings in total number of ani-mals in place of Kgm. The four reports are necessary to cap-ture various elements of the Coastal Fleet which, due to pri-vacy legislation, DFO Statistics could not provide in one report. Vessel data in the following reports include vessels which produced landings during the year. Latent effort is not repre-sented. DFO Licensing could provide more detail on the true number of licensed vessels in the Coastal Fleet, but DFO Licensing could not provide data in the timeframe requested. The top ten species landed in 2012 and their relative price per Kgm is displayed in Figure 3. The data summary to fol-low includes a graphical breakout of the top five species on this list; Crab, Capelin, Herring, Cod, and Whelks.
Figure 3. Top Ten Landed Species, 2012 Coastal Fleet (Columns, L. Axis).
Price per Kgm of each species (Line, R.Axis). The first report provides a regional breakdown of landings and value in the Coastal Fleet by Northwest Atlantic Fisher-ies Organization (NAFO) areas, vessel length ranges, di-rected species, and gear type for the last three years, 2010-2012. This report excludes bycatch, which appears in the second report. The inclusion of bycatch data, due to other data provided, risks violating privacy legislation. Vessel length ranges in this report are in feet and include five groups by 10 foot (3 meter) increments up to 50 feet (15 meters) and an unknown group. Other data included in this report are a count of vessels, fishers, and buyers involved in the capture and landing of each directed species. These counts are informative for the given species, region, length range, and gear type. Sub-groupings of these counts are valid, but duplication is abun-dant across species, gear types, and regions. For example, if a vessel landed cod and crab, that vessel and crew would be
counted twice, once for each species. That vessel may be counted again if the vessel’s owner used multiple gear types for the same species or landed fish in different regions. The crew of that vessel and the buyer may be the same from fishery to fishery as well. Lastly, the buyer count is not spe-cific to the NAFO region listed. Buyers commonly transport landings from one region to another for processing. Examining Cod provides a sample of the data available in the first report. Figure 4 shows a general decline in directed Coastal Vessel cod landings over the last three years by Ves-sel Length Range. Regional landings in Figure 5 provide a general distribution of the Cod fishery.
Figure 4. Cod Landings by Coastal Vessel Length Range.
2010 2011 2012
Figure 5. Coastal Fleet Cod Landings by NAFO Region.
2010 2011 2012
Closer examination is possible within a region among gear types in Figure 6 or vessel lengths in Figure 7. Cod landings in NAFO Area 3Ps are relevant to isolate because 3Ps in-cludes the only true directed commercial fishery for Cod in the province. Landings in other areas typically come from Sentinel Surveys, a long-term cooperative research effort between Canada and industry.
Figure 6. NAFO Area 3Ps Coastal Fleet Cod Landings by Gear Type.
2010 2011 2012
$-
$5
$10
0
10
20
Mill
ions
of K
gs
0
2
4
11-20 21-30 31-40 41-50 M
illio
ns o
f Kgs
0.04-0.06 0
2
4
2J 3K 3L 3PN 3PS 4R
Mill
ions
of K
gs
0.002-0.02 0
1
2
3
Gill Net (Set or Fixed) Longline Hand Line (Baited) Pots/Traps
Mill
ions
of K
gs
P-1006 Coastal Fishing In Newfoundland & Labrador 7
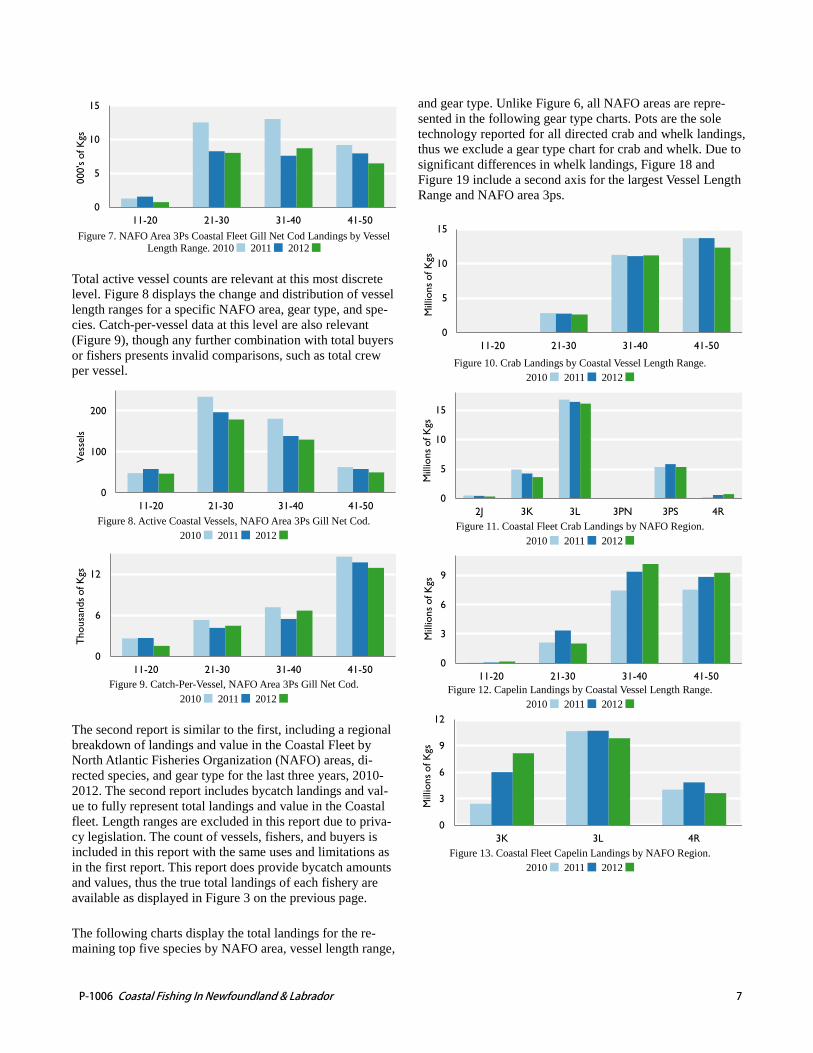
Figure 7. NAFO Area 3Ps Coastal Fleet Gill Net Cod Landings by Vessel
Length Range. 2010 2011 2012
Total active vessel counts are relevant at this most discrete level. Figure 8 displays the change and distribution of vessel length ranges for a specific NAFO area, gear type, and spe-cies. Catch-per-vessel data at this level are also relevant (Figure 9), though any further combination with total buyers or fishers presents invalid comparisons, such as total crew per vessel.
Figure 8. Active Coastal Vessels, NAFO Area 3Ps Gill Net Cod.
2010 2011 2012
Figure 9. Catch-Per-Vessel, NAFO Area 3Ps Gill Net Cod.
2010 2011 2012
The second report is similar to the first, including a regional breakdown of landings and value in the Coastal Fleet by North Atlantic Fisheries Organization (NAFO) areas, di-rected species, and gear type for the last three years, 2010-2012. The second report includes bycatch landings and val-ue to fully represent total landings and value in the Coastal fleet. Length ranges are excluded in this report due to priva-cy legislation. The count of vessels, fishers, and buyers is included in this report with the same uses and limitations as in the first report. This report does provide bycatch amounts and values, thus the true total landings of each fishery are available as displayed in Figure 3 on the previous page. The following charts display the total landings for the re-maining top five species by NAFO area, vessel length range,
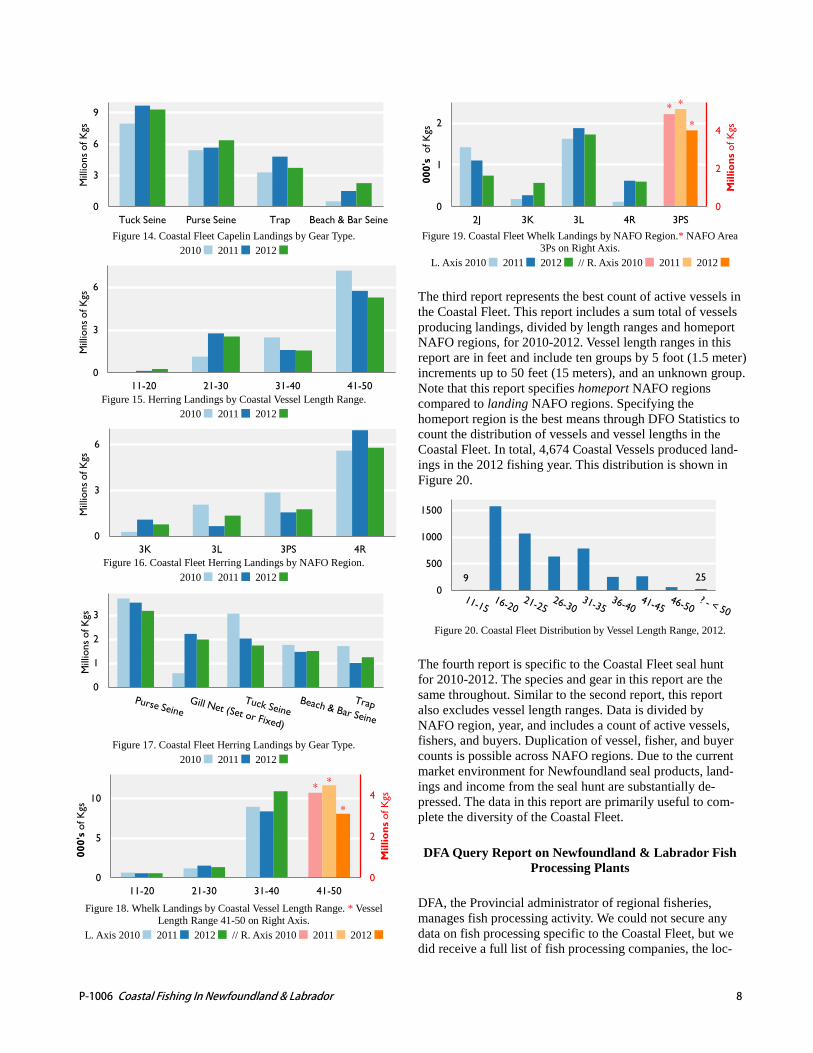
and gear type. Unlike Figure 6, all NAFO areas are repre-sented in the following gear type charts. Pots are the sole technology reported for all directed crab and whelk landings, thus we exclude a gear type chart for crab and whelk. Due to significant differences in whelk landings, Figure 18 and Figure 19 include a second axis for the largest Vessel Length Range and NAFO area 3ps.
Figure 10. Crab Landings by Coastal Vessel Length Range.
2010 2011 2012
Figure 11. Coastal Fleet Crab Landings by NAFO Region.
2010 2011 2012
Figure 12. Capelin Landings by Coastal Vessel Length Range.
2010 2011 2012
Figure 13. Coastal Fleet Capelin Landings by NAFO Region.
2010 2011 2012
0
5
10
15
11-20 21-30 31-40 41-50
000'
s of
Kgs
0
100
200
11-20 21-30 31-40 41-50
Vess
els
0
6
12
11-20 21-30 31-40 41-50
Thou
sand
s of K
gs
0
5
10
15
11-20 21-30 31-40 41-50
Mill
ions
of K
gs
0
5
10
15
2J 3K 3L 3PN 3PS 4R
Mill
ions
of K
gs
0
3
6
9
11-20 21-30 31-40 41-50
Mill
ions
of K
gs
0
3
6
9
12
3K 3L 4R
Mill
ions
of K
gs
P-1006 Coastal Fishing In Newfoundland & Labrador 8
Figure 14. Coastal Fleet Capelin Landings by Gear Type.
2010 2011 2012
Figure 15. Herring Landings by Coastal Vessel Length Range.
2010 2011 2012
Figure 16. Coastal Fleet Herring Landings by NAFO Region.
2010 2011 2012
Figure 17. Coastal Fleet Herring Landings by Gear Type.
2010 2011 2012
Figure 18. Whelk Landings by Coastal Vessel Length Range. * Vessel
Length Range 41-50 on Right Axis. L. Axis 2010 2011 2012 // R. Axis 2010 2011 2012
Figure 19. Coastal Fleet Whelk Landings by NAFO Region.* NAFO Area
3Ps on Right Axis. L. Axis 2010 2011 2012 // R. Axis 2010 2011 2012
The third report represents the best count of active vessels in the Coastal Fleet. This report includes a sum total of vessels producing landings, divided by length ranges and homeport NAFO regions, for 2010-2012. Vessel length ranges in this report are in feet and include ten groups by 5 foot (1.5 meter) increments up to 50 feet (15 meters), and an unknown group. Note that this report specifies homeport NAFO regions compared to landing NAFO regions. Specifying the homeport region is the best means through DFO Statistics to count the distribution of vessels and vessel lengths in the Coastal Fleet. In total, 4,674 Coastal Vessels produced land-ings in the 2012 fishing year. This distribution is shown in Figure 20.
Figure 20. Coastal Fleet Distribution by Vessel Length Range, 2012.
The fourth report is specific to the Coastal Fleet seal hunt for 2010-2012. The species and gear in this report are the same throughout. Similar to the second report, this report also excludes vessel length ranges. Data is divided by NAFO region, year, and includes a count of active vessels, fishers, and buyers. Duplication of vessel, fisher, and buyer counts is possible across NAFO regions. Due to the current market environment for Newfoundland seal products, land-ings and income from the seal hunt are substantially de-pressed. The data in this report are primarily useful to com-plete the diversity of the Coastal Fleet. DFA Query Report on Newfoundland & Labrador Fish
Processing Plants DFA, the Provincial administrator of regional fisheries, manages fish processing activity. We could not secure any data on fish processing specific to the Coastal Fleet, but we did receive a full list of fish processing companies, the loc-
0
3
6
9
Tuck Seine Purse Seine Trap Beach & Bar Seine
Mill
ions
of K
gs
0
3
6
11-20 21-30 31-40 41-50
Mill
ions
of K
gs
0
3
6
3K 3L 3PS 4R
Mill
ions
of K
gs
0
1
2
3
Mill
ions
of K
gs
* *
*
0
2
4
0
5
10
11-20 21-30 31-40 41-50
Mill
ions
of K
gs
000'
s of
Kgs
* *
*
0
2
4
0
1
2
2J 3K 3L 4R 3PS
Mill
ions
of K
gs
000'
s o
f Kgs
9 25 0
500
1000
1500
P-1006 Coastal Fishing In Newfoundland & Labrador 9
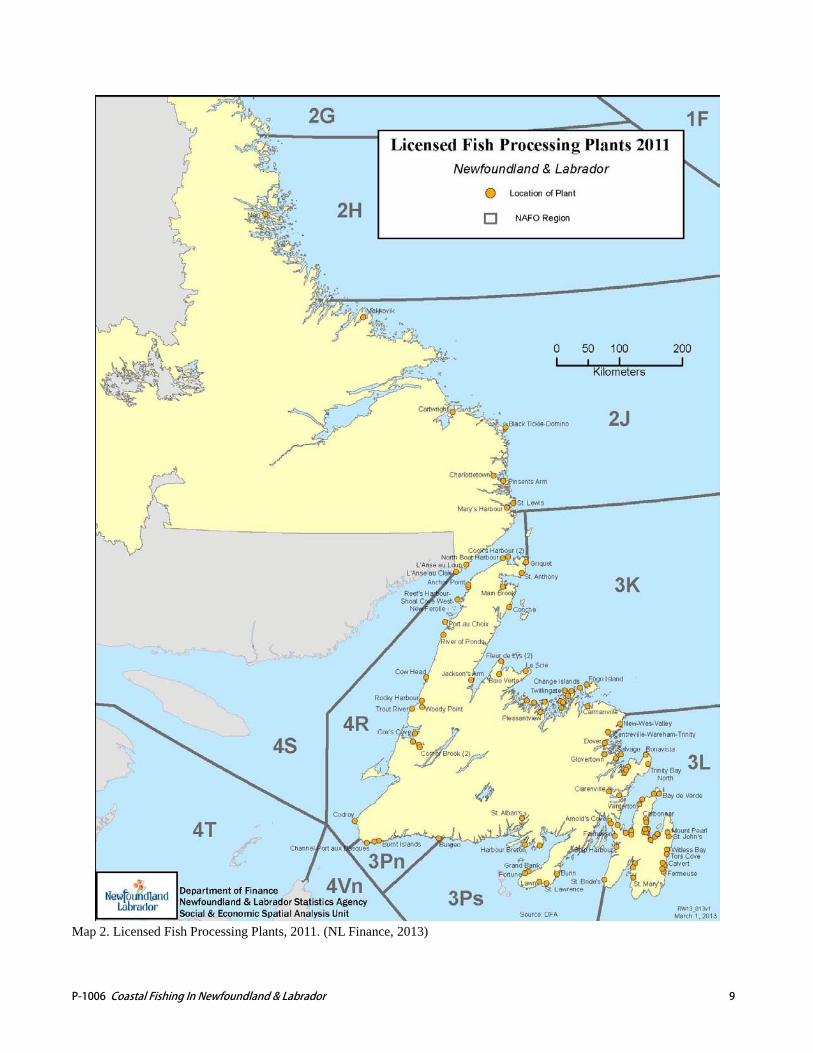
Map 2. Licensed Fish Processing Plants, 2011. (NL Finance, 2013)
P-1006 Coastal Fishing In Newfoundland & Labrador 10
ations of their plants, and the species each plant is permitted to process. The list is current to November, 2012 and sum-marized in the following Table 2. We also secured Map 2, from the Newfoundland & Labrador Department of Finance, displaying the general distribution of fish plants in the prov-ince for 2011 (NL Finance, 2013). The ‘Total Buyers’ count in Table 2 is an additional figure to the obtained DFA Query. This figure represents a different class of fish buyer in the province. A licensed ‘fish buyer’ “provided a service or exercised competition for raw materi-al in certain regions. Their role in recent years is diminish-ing as processors provide many of the same services” (4-25, DFA, 2010). This figure is current to 2011 and came from DFA’s online resources (DFA, 2011). The total companies and total buyers noted here should be considered together when examining the DFO query reports ‘buyers’ column.
Total Companies 89
Total Plants 111
Total Buyers 27
Included Communities 99
Table 2. Newfoundland & Labrador Fish Processors.
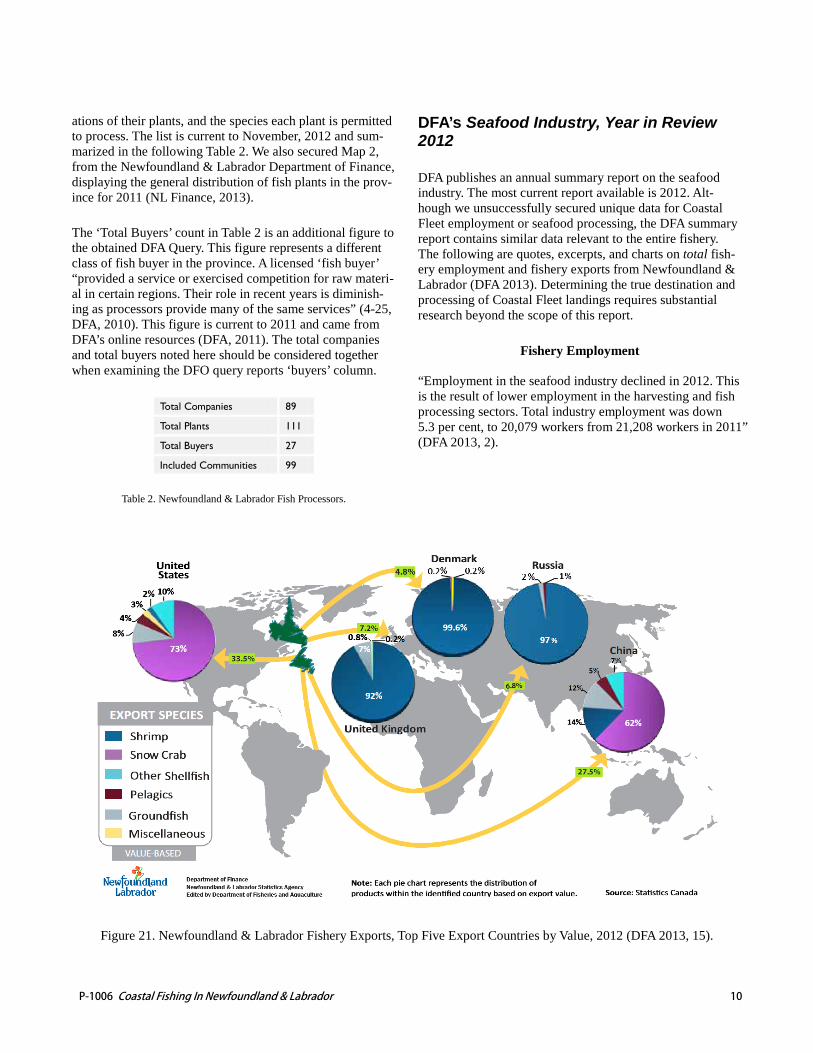
DFA’s Seafood Industry, Year in Review 2012 DFA publishes an annual summary report on the seafood industry. The most current report available is 2012. Alt-hough we unsuccessfully secured unique data for Coastal Fleet employment or seafood processing, the DFA summary report contains similar data relevant to the entire fishery. The following are quotes, excerpts, and charts on total fish-ery employment and fishery exports from Newfoundland & Labrador (DFA 2013). Determining the true destination and processing of Coastal Fleet landings requires substantial research beyond the scope of this report.
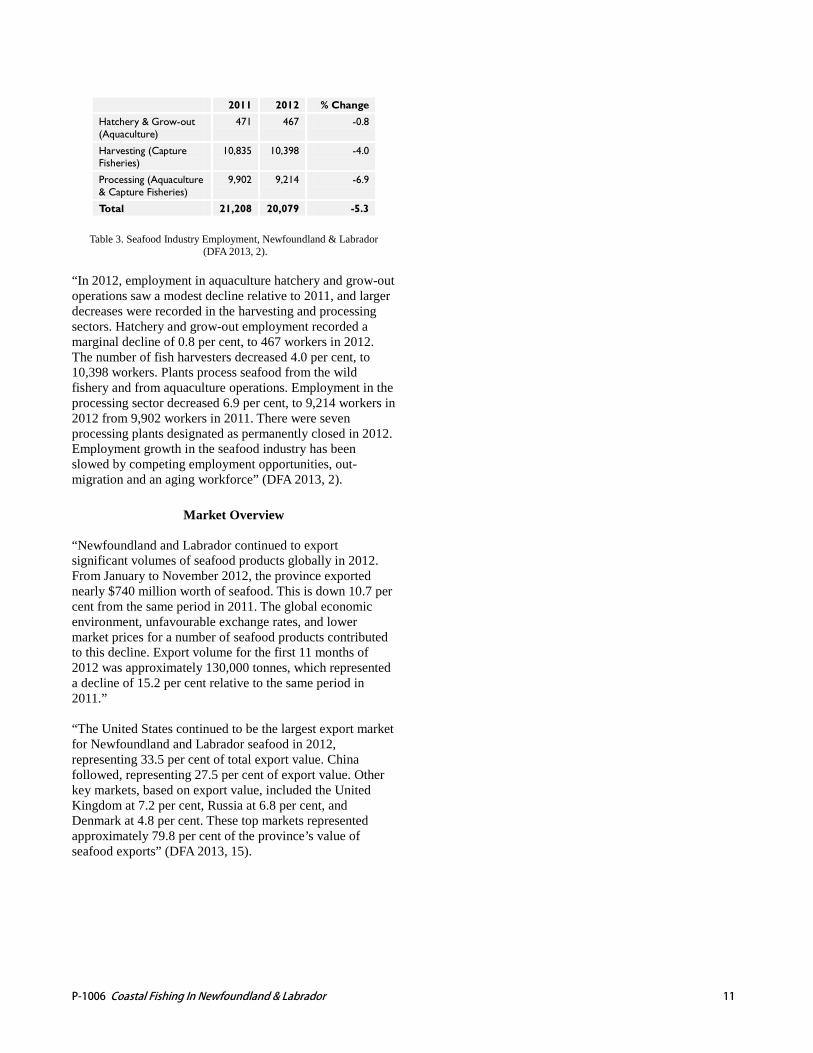
Fishery Employment “Employment in the seafood industry declined in 2012. This is the result of lower employment in the harvesting and fish processing sectors. Total industry employment was down 5.3 per cent, to 20,079 workers from 21,208 workers in 2011” (DFA 2013, 2).
Figure 21. Newfoundland & Labrador Fishery Exports, Top Five Export Countries by Value, 2012 (DFA 2013, 15).
P-1006 Coastal Fishing In Newfoundland & Labrador 11
2011 2012 % Change Hatchery & Grow-out (Aquaculture)
471 467 -0.8
Harvesting (Capture Fisheries)
10,835 10,398 -4.0
Processing (Aquaculture & Capture Fisheries)
9,902 9,214 -6.9
Total 21,208 20,079 -5.3
Table 3. Seafood Industry Employment, Newfoundland & Labrador
(DFA 2013, 2).
“In 2012, employment in aquaculture hatchery and grow-out operations saw a modest decline relative to 2011, and larger decreases were recorded in the harvesting and processing sectors. Hatchery and grow-out employment recorded a marginal decline of 0.8 per cent, to 467 workers in 2012. The number of fish harvesters decreased 4.0 per cent, to 10,398 workers. Plants process seafood from the wild fishery and from aquaculture operations. Employment in the processing sector decreased 6.9 per cent, to 9,214 workers in 2012 from 9,902 workers in 2011. There were seven processing plants designated as permanently closed in 2012. Employment growth in the seafood industry has been slowed by competing employment opportunities, out-migration and an aging workforce” (DFA 2013, 2).
Market Overview “Newfoundland and Labrador continued to export significant volumes of seafood products globally in 2012. From January to November 2012, the province exported nearly $740 million worth of seafood. This is down 10.7 per cent from the same period in 2011. The global economic environment, unfavourable exchange rates, and lower market prices for a number of seafood products contributed to this decline. Export volume for the first 11 months of 2012 was approximately 130,000 tonnes, which represented a decline of 15.2 per cent relative to the same period in 2011.” “The United States continued to be the largest export market for Newfoundland and Labrador seafood in 2012, representing 33.5 per cent of total export value. China followed, representing 27.5 per cent of export value. Other key markets, based on export value, included the United Kingdom at 7.2 per cent, Russia at 6.8 per cent, and Denmark at 4.8 per cent. These top markets represented approximately 79.8 per cent of the province’s value of seafood exports” (DFA 2013, 15).
P-1006 Coastal Fishing In Newfoundland & Labrador 12
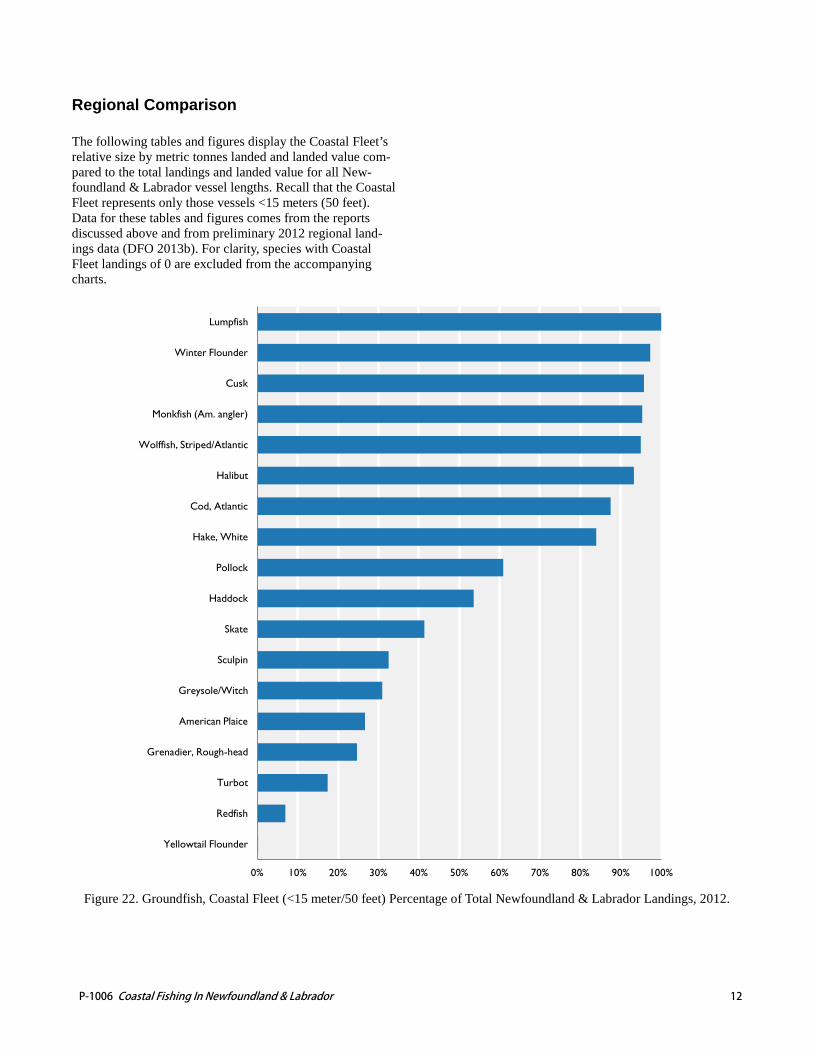
Regional Comparison The following tables and figures display the Coastal Fleet’s relative size by metric tonnes landed and landed value com-pared to the total landings and landed value for all New-foundland & Labrador vessel lengths. Recall that the Coastal Fleet represents only those vessels <15 meters (50 feet). Data for these tables and figures comes from the reports discussed above and from preliminary 2012 regional land-ings data (DFO 2013b). For clarity, species with Coastal Fleet landings of 0 are excluded from the accompanying charts.
Figure 22. Groundfish, Coastal Fleet (<15 meter/50 feet) Percentage of Total Newfoundland & Labrador Landings, 2012.
0% 10% 20% 30% 40% 50% 60% 70% 80% 90% 100%
Yellowtail Flounder
Redfish
Turbot
Grenadier, Rough-head
American Plaice
Greysole/Witch
Sculpin
Skate
Haddock
Pollock
Hake, White
Cod, Atlantic
Halibut
Wolffish, Striped/Atlantic
Monkfish (Am. angler)
Cusk
Winter Flounder
Lumpfish
P-1006 Coastal Fishing In Newfoundland & Labrador 13
Groundfish - 2012 Coastal Fleet All NL Region
Tonnes Value Tonnes Value
% $ ‘000s %
$ ‘000s
Total Landings & Value 11,108 44 21,529 30 25,376 70,811 Cod, Atlantic 7,248 87 8,386 88 8,284 9,571 Haddock 56 54 55 54 105 102 Redfish 92 7 57 9 1,327 674 Halibut 586 93 5,213 93 629 5,600 American Plaice 126 27 88 29 473 299 Yellowtail Flounder 4 < 1 2 < 1 1,803 1,253 Greysole/Witch 171 31 151 31 554 488 Winter Flounder 125 97 63 97 129 65 Turbot 1,830 17 6,711 13 10,504 51,551 Skate 233 41 60 42 562 143 Pollock 206 61 190 60 339 316 Hake, White 212 84 185 84 253 221 Cusk 2 96 1 96 2 1 Lumpfish 24 100 14 93 24 15 Monkfish (Am angler) 177 95 347 95 185 364 Sculpin 1 33 <1 32 4 <1 Grenadier, Rough-Head 7 25 2 16 29 12 Wolffish, Striped/Atlantic 6 95 3 95 7 3 Hagfish - 0 - 0 164 134
Table 4. Groundfish, Coastal Fleet (<15 meter/50 feet) Percentage of Total Newfoundland & Labrador Landings, 2012.
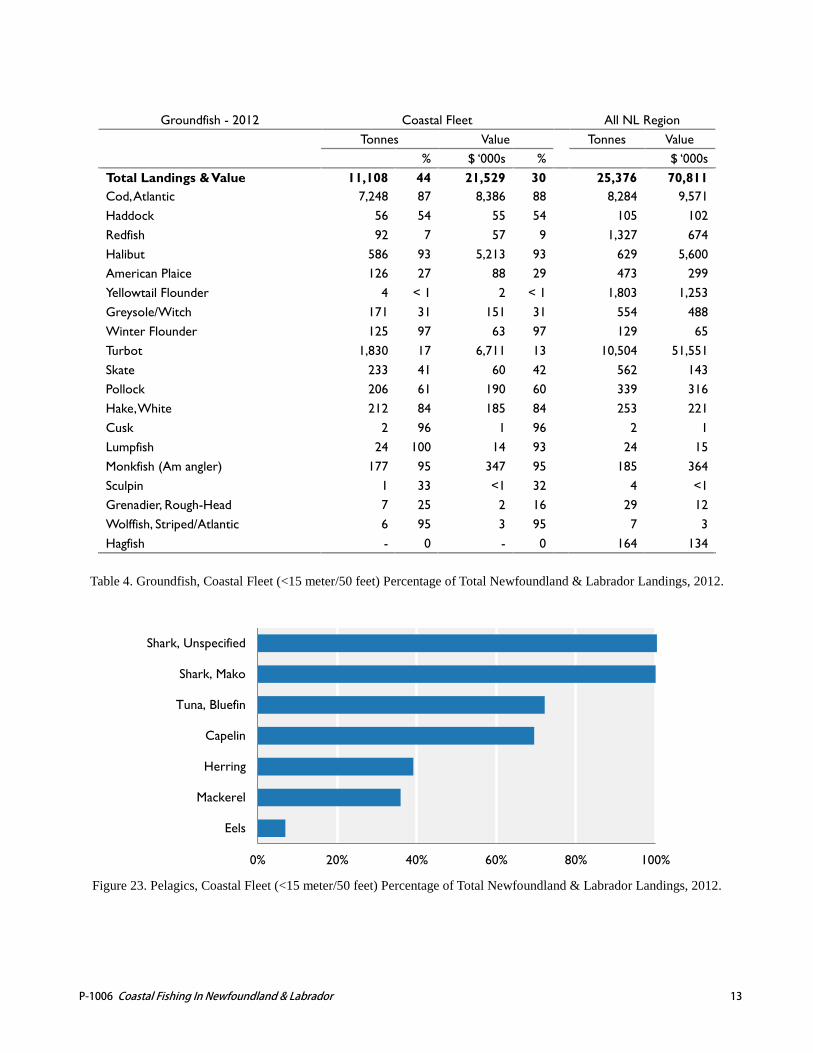
Figure 23. Pelagics, Coastal Fleet (<15 meter/50 feet) Percentage of Total Newfoundland & Labrador Landings, 2012.
0% 20% 40% 60% 80% 100%
Eels
Mackerel
Herring
Capelin
Tuna, Bluefin
Shark, Mako
Shark, Unspecified

P-1006 Coastal Fishing In Newfoundland & Labrador 14
Pelagics - 2012 Coastal Fleet All NL Region
Tonnes Value Tonnes Value
% $ ‘000s %
$ ‘000s
Total Landings & Value 32,335 55 8,475 51 58,690 16,500 Herring, Atlantic 9,756 39 2,559 39 24,926 6,539 Mackerel 917 36 909 36 2,551 2,528 Tuna, bluefin 19 72 219 72 26 303 Eels 3 7 22 8 40 270 Capelin 21,640 69 4,765 69 31,145 6,860 Shark, mako < 1 100 < 1 100 < 1 < 1 Shark, unspecified < 1 101 < 1 100 < 1 < 1
Table 5. Pelagics, Coastal Fleet (<15 meter/50 feet) Percentage of Total Newfoundland & Labrador Landings, 2012.
Figure 24. Molluscs, Coastal Fleet (<15 meter/50 feet) Percentage of Total Newfoundland & Labrador Landings, 2012.
Molluscs - 2012 Coastal Fleet All NL Region
Tonnes Value Tonnes Value
% $ ‘000s %
$ ‘000s
Total Landings & Value 5,442 18 7,801 17 29,689 46,197 Clams, propellor - 0 - 0 1,343 972 Clams, Stimpsons surf - 0 - 0 21,228 34,629 Scallop, Sea 402 33 748 33 1,234 2,297 Whelks 4,386 89 5,857 88 4,928 6,668 Cockles - 0 - 0 190 241 Scallop, Iceland 242 75 413 75 323 550 Sea Urchins 412 93 783 93 443 841
Table 6. Molluscs, Coastal Fleet (<15 meter/50 feet) Percentage of Total Newfoundland & Labrador Landings, 2012.
0% 20% 40% 60% 80% 100%
Scallop, Sea
Scallop, Iceland
Whelks
Sea Urchins
P-1006 Coastal Fishing In Newfoundland & Labrador 15
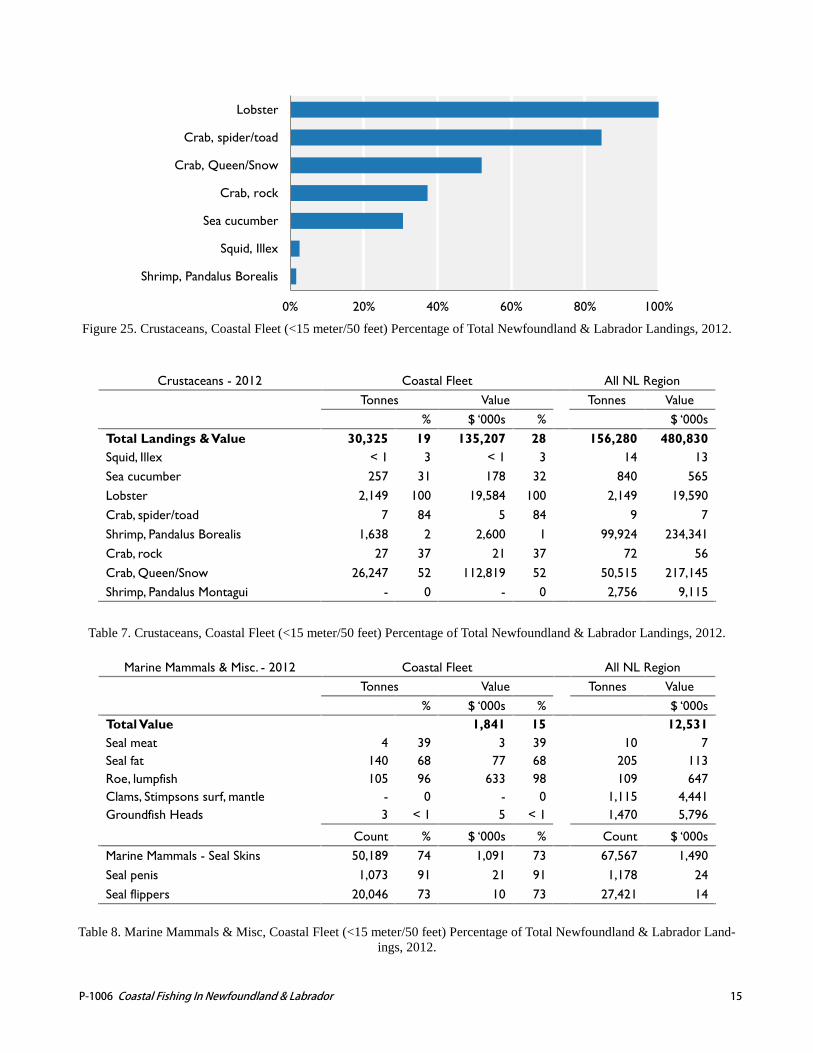
Figure 25. Crustaceans, Coastal Fleet (<15 meter/50 feet) Percentage of Total Newfoundland & Labrador Landings, 2012.
Crustaceans - 2012 Coastal Fleet All NL Region
Tonnes Value Tonnes Value
% $ ‘000s %
$ ‘000s
Total Landings & Value 30,325 19 135,207 28 156,280 480,830 Squid, Illex < 1 3 < 1 3 14 13 Sea cucumber 257 31 178 32 840 565 Lobster 2,149 100 19,584 100 2,149 19,590 Crab, spider/toad 7 84 5 84 9 7 Shrimp, Pandalus Borealis 1,638 2 2,600 1 99,924 234,341 Crab, rock 27 37 21 37 72 56 Crab, Queen/Snow 26,247 52 112,819 52 50,515 217,145 Shrimp, Pandalus Montagui - 0 - 0 2,756 9,115
Table 7. Crustaceans, Coastal Fleet (<15 meter/50 feet) Percentage of Total Newfoundland & Labrador Landings, 2012.
Marine Mammals & Misc. - 2012 Coastal Fleet All NL Region
Tonnes Value Tonnes Value
% $ ‘000s %
$ ‘000s
Total Value
1,841 15
12,531 Seal meat 4 39 3 39 10 7 Seal fat 140 68 77 68 205 113 Roe, lumpfish 105 96 633 98 109 647 Clams, Stimpsons surf, mantle - 0 - 0 1,115 4,441 Groundfish Heads 3 < 1 5 < 1 1,470 5,796
Count % $ ‘000s % Count $ ‘000s
Marine Mammals - Seal Skins 50,189 74 1,091 73 67,567 1,490 Seal penis 1,073 91 21 91 1,178 24 Seal flippers 20,046 73 10 73 27,421 14
Table 8. Marine Mammals & Misc, Coastal Fleet (<15 meter/50 feet) Percentage of Total Newfoundland & Labrador Land-
ings, 2012.
0% 20% 40% 60% 80% 100%
Shrimp, Pandalus Borealis
Squid, Illex
Sea cucumber
Crab, rock
Crab, Queen/Snow
Crab, spider/toad
Lobster
P-1006 Coastal Fishing In Newfoundland & Labrador 16
Present Status The preceding summary is an overview of available data specific to the Coastal Fleet. Detailed analysis is expected in future portions of the NORA project. The data may be fur-ther refined over time if Canadian and Regional government departments gain the appropriate capacity. Despite room for greater precision, currently the data effectively represent a general inventory of the Newfoundland & Labrador Coastal Fleet. Due to the unexpected difficulty in securing data for this report, we will have to wait for future evolutions of the NORA project to explore alternative uses for coastal vessels and a more detailed value-chain analysis. If you would like to review the original DFA, DFO, and TC data reports, please contact the Centre for Fisheries Ecosys-tems Research (CFER) Administrative Director Tom Brown at (709) 778-0336, or by email at <[email protected]>. References DFA. 2013. Seafood Industry Year in Review 2012.
Newfoundland & Labrador Department of Fisheries and Aquaculture, St. John’s. 36p.
DFA. 2011. List of Licensed Buyers and Contacts.
Newfoundland & Labrador Department of Fisheries and Aquaculture, St. John’s. 5p.
DFA. 2010. Fish Processing Licensing Policy Manual.
Newfoundland & Labrador Department of Fisheries and Aquaculture, St. John’s. 46p.
DFO. 2013a. Policy for Preserving the Independence of the
Inshore Fleet in Canada’s Atlantic Fisheries. Re-trieved from DFO website: http://www.dfo-mpo.gc.ca/fm-gp/initiatives/piifcaf-pifpcca/piifcaf-policy-politique-pifpcca-eng.htm
DFO. 2013b. Landings and Landed Value By Species.
Newfoundland and Labrador Preliminary Data. 2012. Retrieved from DFO website: http://www.nfl.dfo-mpo.gc.ca/publications/reports_rapports/Land_Inshore_Debarquer_cotiere_2012_eng.htm
NAFO. 2013. NAFO Convention Area Map. Retrieved from
NAFO website: http://www.nafo.int/about/frames/area.html
NL Finance. 2013. Licensed Fish Processing Plants, 2011. Newfoundland & Labrador Department of Finance, St. John’s. 1p.
TC. 2013. Small Vessel Register (Commercial). Retrieved from TC website: http://www.tc.gc.ca/eng/marinesafety/oep-vesselreg-smallcomm-menu-542.htm
TC. 2012. Vessel Registration Query System. Retrieved from
TC website: http://wwwapps.tc.gc.ca/Saf-Sec-Sur/4/vrqs-srib/m.aspx?lang=e
P-1006 Coastal Fishing In Newfoundland & Labrador 17
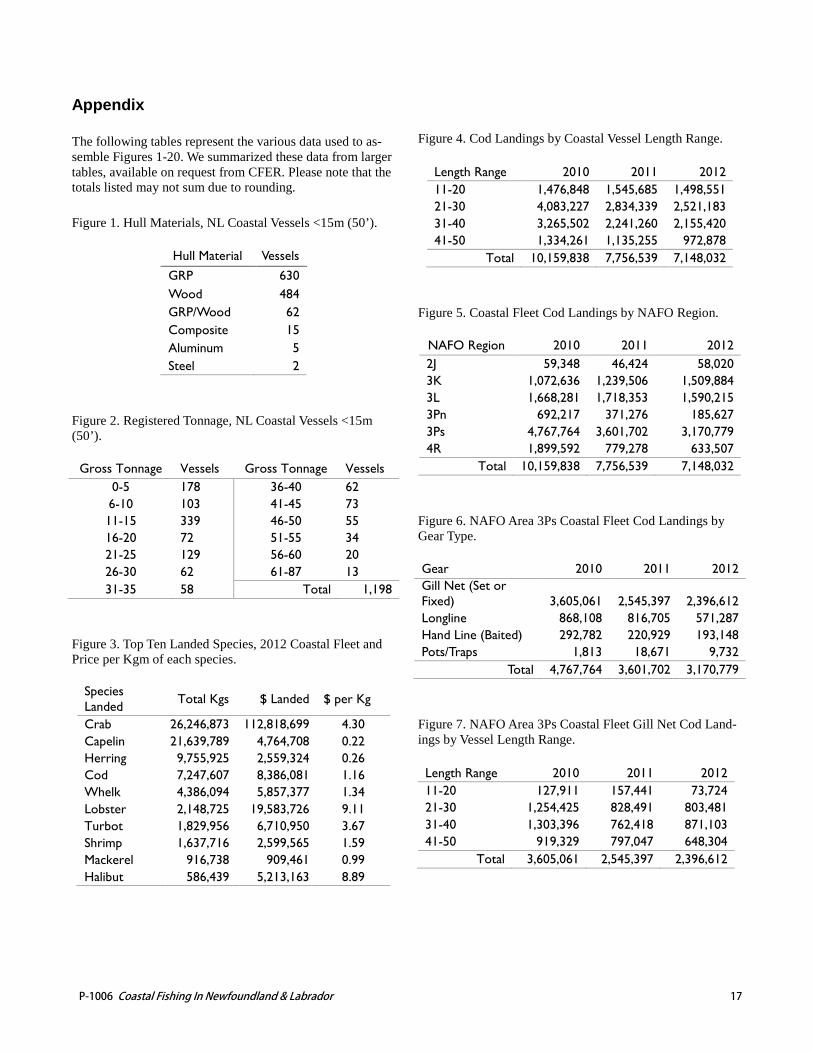
Appendix The following tables represent the various data used to as-semble Figures 1-20. We summarized these data from larger tables, available on request from CFER. Please note that the totals listed may not sum due to rounding. Figure 1. Hull Materials, NL Coastal Vessels <15m (50’).
Hull Material Vessels GRP 630 Wood 484 GRP/Wood 62 Composite 15 Aluminum 5 Steel 2
Figure 2. Registered Tonnage, NL Coastal Vessels <15m (50’).
Gross Tonnage Vessels Gross Tonnage Vessels 0-5 178 36-40 62 6-10 103 41-45 73 11-15 339 46-50 55 16-20 72 51-55 34 21-25 129 56-60 20 26-30 62 61-87 13 31-35 58 Total 1,198
Figure 3. Top Ten Landed Species, 2012 Coastal Fleet and Price per Kgm of each species.
Species Landed Total Kgs $ Landed $ per Kg
Crab 26,246,873 112,818,699 4.30 Capelin 21,639,789 4,764,708 0.22 Herring 9,755,925 2,559,324 0.26 Cod 7,247,607 8,386,081 1.16 Whelk 4,386,094 5,857,377 1.34 Lobster 2,148,725 19,583,726 9.11 Turbot 1,829,956 6,710,950 3.67 Shrimp 1,637,716 2,599,565 1.59 Mackerel 916,738 909,461 0.99 Halibut 586,439 5,213,163 8.89
Figure 4. Cod Landings by Coastal Vessel Length Range.
Length Range 2010 2011 2012 11-20 1,476,848 1,545,685 1,498,551 21-30 4,083,227 2,834,339 2,521,183 31-40 3,265,502 2,241,260 2,155,420 41-50 1,334,261 1,135,255 972,878
Total 10,159,838 7,756,539 7,148,032 Figure 5. Coastal Fleet Cod Landings by NAFO Region.
NAFO Region 2010 2011 2012 2J 59,348 46,424 58,020 3K 1,072,636 1,239,506 1,509,884 3L 1,668,281 1,718,353 1,590,215 3Pn 692,217 371,276 185,627 3Ps 4,767,764 3,601,702 3,170,779 4R 1,899,592 779,278 633,507
Total 10,159,838 7,756,539 7,148,032 Figure 6. NAFO Area 3Ps Coastal Fleet Cod Landings by Gear Type. Gear 2010 2011 2012 Gill Net (Set or Fixed) 3,605,061 2,545,397 2,396,612 Longline 868,108 816,705 571,287 Hand Line (Baited) 292,782 220,929 193,148 Pots/Traps 1,813 18,671 9,732
Total 4,767,764 3,601,702 3,170,779 Figure 7. NAFO Area 3Ps Coastal Fleet Gill Net Cod Land-ings by Vessel Length Range. Length Range 2010 2011 2012 11-20 127,911 157,441 73,724 21-30 1,254,425 828,491 803,481 31-40 1,303,396 762,418 871,103 41-50 919,329 797,047 648,304
Total 3,605,061 2,545,397 2,396,612
P-1006 Coastal Fishing In Newfoundland & Labrador 18
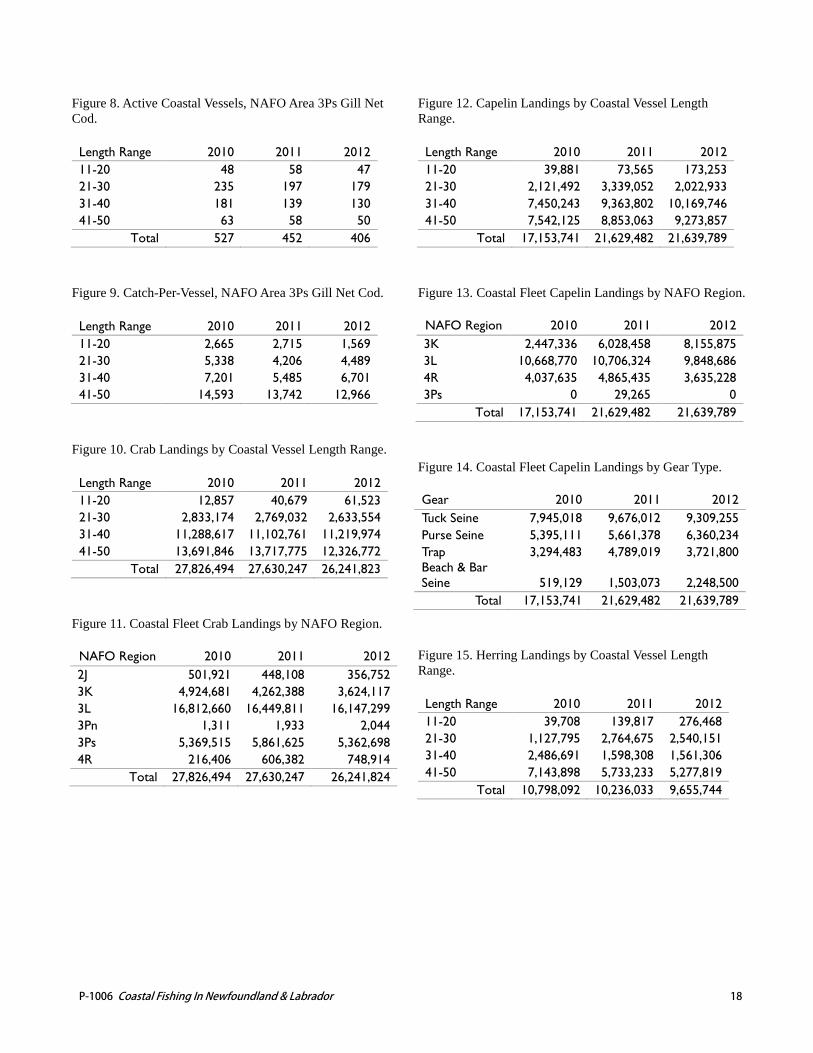
Figure 8. Active Coastal Vessels, NAFO Area 3Ps Gill Net Cod. Length Range 2010 2011 2012 11-20 48 58 47 21-30 235 197 179 31-40 181 139 130 41-50 63 58 50
Total 527 452 406 Figure 9. Catch-Per-Vessel, NAFO Area 3Ps Gill Net Cod. Length Range 2010 2011 2012 11-20 2,665 2,715 1,569 21-30 5,338 4,206 4,489 31-40 7,201 5,485 6,701 41-50 14,593 13,742 12,966
Figure 10. Crab Landings by Coastal Vessel Length Range. Length Range 2010 2011 2012 11-20 12,857 40,679 61,523 21-30 2,833,174 2,769,032 2,633,554 31-40 11,288,617 11,102,761 11,219,974 41-50 13,691,846 13,717,775 12,326,772
Total 27,826,494 27,630,247 26,241,823 Figure 11. Coastal Fleet Crab Landings by NAFO Region. NAFO Region 2010 2011 2012 2J 501,921 448,108 356,752 3K 4,924,681 4,262,388 3,624,117 3L 16,812,660 16,449,811 16,147,299 3Pn 1,311 1,933 2,044 3Ps 5,369,515 5,861,625 5,362,698 4R 216,406 606,382 748,914
Total 27,826,494 27,630,247 26,241,824
Figure 12. Capelin Landings by Coastal Vessel Length Range. Length Range 2010 2011 2012 11-20 39,881 73,565 173,253 21-30 2,121,492 3,339,052 2,022,933 31-40 7,450,243 9,363,802 10,169,746 41-50 7,542,125 8,853,063 9,273,857
Total 17,153,741 21,629,482 21,639,789 Figure 13. Coastal Fleet Capelin Landings by NAFO Region. NAFO Region 2010 2011 2012 3K 2,447,336 6,028,458 8,155,875 3L 10,668,770 10,706,324 9,848,686 4R 4,037,635 4,865,435 3,635,228 3Ps 0 29,265 0
Total 17,153,741 21,629,482 21,639,789 Figure 14. Coastal Fleet Capelin Landings by Gear Type. Gear 2010 2011 2012 Tuck Seine 7,945,018 9,676,012 9,309,255 Purse Seine 5,395,111 5,661,378 6,360,234 Trap 3,294,483 4,789,019 3,721,800 Beach & Bar Seine 519,129 1,503,073 2,248,500
Total 17,153,741 21,629,482 21,639,789 Figure 15. Herring Landings by Coastal Vessel Length Range. Length Range 2010 2011 2012 11-20 39,708 139,817 276,468 21-30 1,127,795 2,764,675 2,540,151 31-40 2,486,691 1,598,308 1,561,306 41-50 7,143,898 5,733,233 5,277,819
Total 10,798,092 10,236,033 9,655,744
P-1006 Coastal Fishing In Newfoundland & Labrador 19
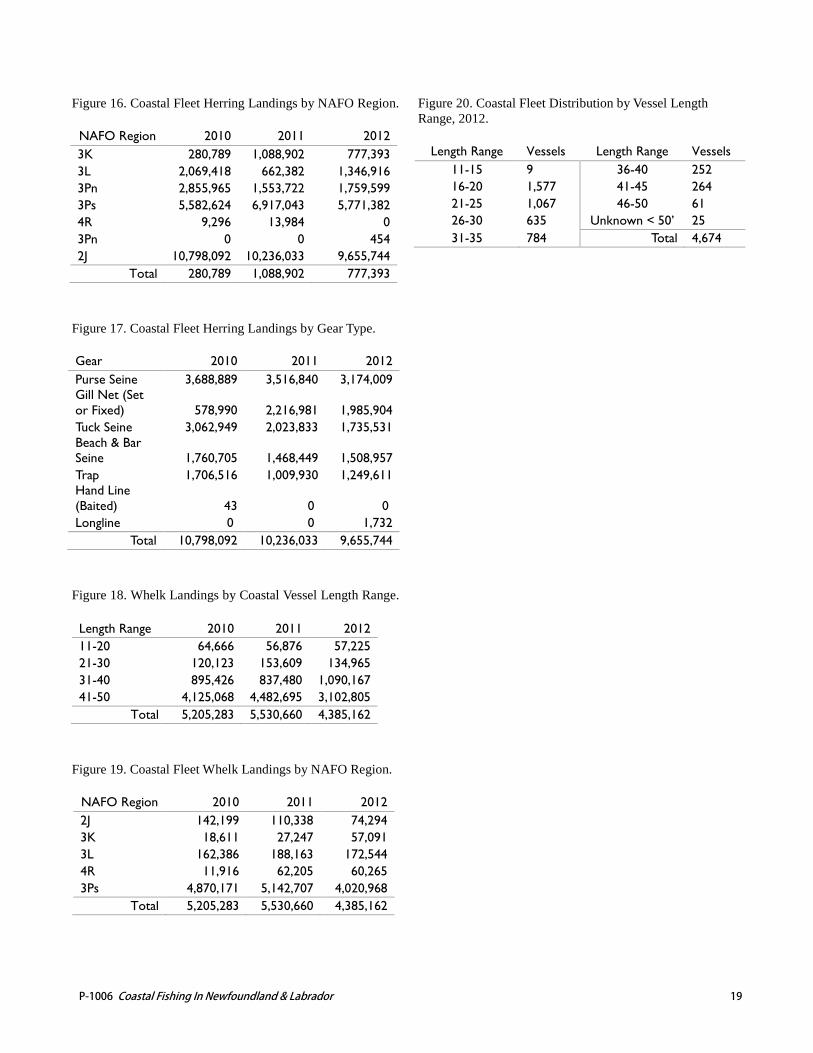
Figure 16. Coastal Fleet Herring Landings by NAFO Region. NAFO Region 2010 2011 2012 3K 280,789 1,088,902 777,393 3L 2,069,418 662,382 1,346,916 3Pn 2,855,965 1,553,722 1,759,599 3Ps 5,582,624 6,917,043 5,771,382 4R 9,296 13,984 0 3Pn 0 0 454 2J 10,798,092 10,236,033 9,655,744
Total 280,789 1,088,902 777,393 Figure 17. Coastal Fleet Herring Landings by Gear Type. Gear 2010 2011 2012 Purse Seine 3,688,889 3,516,840 3,174,009 Gill Net (Set or Fixed) 578,990 2,216,981 1,985,904 Tuck Seine 3,062,949 2,023,833 1,735,531 Beach & Bar Seine 1,760,705 1,468,449 1,508,957 Trap 1,706,516 1,009,930 1,249,611 Hand Line (Baited) 43 0 0 Longline 0 0 1,732
Total 10,798,092 10,236,033 9,655,744 Figure 18. Whelk Landings by Coastal Vessel Length Range. Length Range 2010 2011 2012 11-20 64,666 56,876 57,225 21-30 120,123 153,609 134,965 31-40 895,426 837,480 1,090,167 41-50 4,125,068 4,482,695 3,102,805
Total 5,205,283 5,530,660 4,385,162 Figure 19. Coastal Fleet Whelk Landings by NAFO Region.
NAFO Region 2010 2011 2012 2J 142,199 110,338 74,294 3K 18,611 27,247 57,091 3L 162,386 188,163 172,544 4R 11,916 62,205 60,265 3Ps 4,870,171 5,142,707 4,020,968
Total 5,205,283 5,530,660 4,385,162
Figure 20. Coastal Fleet Distribution by Vessel Length Range, 2012.
Length Range Vessels Length Range Vessels 11-15 9 36-40 252 16-20 1,577 41-45 264 21-25 1,067 46-50 61 26-30 635 Unknown < 50’ 25 31-35 784 Total 4,674